Embed Size (px)
Citation preview

Dalhousie UniversityDalhousie UniversityDepartment of Physics and Atmospheric ScienceDepartment of Physics and Atmospheric Science
• Materials Science
• Biophysics
• Condensed Matter Physics
• Atmospheric Science
Research in Theoretical, Experimental, and Applied Physics
http://www.physics.dal.ca/files/Physics_and_Atmospheric_Science_Faculty.ppt

Ozone and Aerosols in the Lower AtmosphereOzone and Aerosols in the Lower Atmosphere
Randall MartinAaron Van Donkelaar Arlene Fiore
Kelly Chance Chris Sioris

GLOBAL RADIATIVE FORCING OF CLIMATE, GLOBAL RADIATIVE FORCING OF CLIMATE, 1750-present1750-present
IPCC [2001]

ORIGIN OF ATMOSPHERIC AEROSOLSORIGIN OF ATMOSPHERIC AEROSOLS
Soil dustSea salt
Aerosol: dispersed condensed matter suspended in a gasSize range: 0.001 m (molecular cluster) to 100 m (small raindrop)
Environmental importance: health (respiration), visibility, radiative balance,cloud formation, heterogeneous reactions, delivery of nutrients…

Toronto (1997-99)Egbert (1994-99)
Abbotsford (1994-95)
Quaker City OH (1999)
Arendstville PA (1999)
Atlanta (1999)Yorkville (1999)Mexico City - Pedregal (1997)
Los Angeles (1995-96)
Fresno (1988-89)
Kern Wildlife Refuge (1988-89)
Sulfate
Nitrate
Ammonium
Black carbon
Organic carbon
Soil
Other
12.3 ug m-38.9 ug m-3
7.8 ug m-3
12.4 ug m-3
10.4 ug m-3
19.2 ug m-314.7 ug m-3
55.4 ug m-3
30.3 ug m-3
23.3 ug m-3
39.2 ug m-3
Washington DC (1996-99)
14.5 ug m-3
Colorado Plateau (1996-99)3.0 ug m-3
Mexico City - Netzahualcoyotl (1997)
24.6 ug m-3
Esther (1995-99)
St. Andrews (1994-97)5.3 ug m-3
4.6 ug m-3
COMPOSITION OF PM2.5 COMPOSITION OF PM2.5 (NARSTO PM ASSESSMENT)(NARSTO PM ASSESSMENT)

Scattering of Radiation
Size Parameter: xr

Mie Theory
Extinction = Scattering + Absorption
Extinction Efficiency (Qext) = ratio of the extinction cross section to the geometric cross-section (πr2)

MODerate-resolution Imaging Spectroradiometer MODerate-resolution Imaging Spectroradiometer (MODIS)(MODIS)
Seven MODIS bands are available for aerosol properties
0.47, 0.55, 0.65, 0.86, 1.24, 1.64, and 2.13 µm
OCEAN
reflectance contrast between cloud-free atmosphere and dark ocean
aerosol optical thickness for all 7 bands
LAND
reflectance of dark vegetation and semi-arid regions deduced using 2.13 µm where
aerosols are nearly transparent
reflectance contrast between atmosphere and dense dark vegetation surface
aerosol optical thickness (0.47 and 0.66 µm)
0 0
2 dzdrrnrQext
Optical Thickness
I=Ioe-

Apollo 17 1972 What do we
actually see?

Mar 3, 2003
Aerosols Visible over Dark Surface

Example Cloud and Aerosol Optical ThicknessExample Cloud and Aerosol Optical Thickness
Aerosol Optical Thickness (550 nm)
Cloud Optical Thickness


TROPOSPHERIC OZONE IS A KEY SPECIES IN CLIMATE AND TROPOSPHERIC OZONE IS A KEY SPECIES IN CLIMATE AND AIR QUALITYAIR QUALITY
Tropopause
Stratopause
•Major greenhouse gas
•Primary constituent of smog
•Largely controls atmospheric oxidation
Stratosphere
Troposphere
Ozonelayer
Mesosphere

THE ATMOSPHERE IS AN OXIDIZING MEDIUM THE ATMOSPHERE IS AN OXIDIZING MEDIUM
EARTHSURFACE
Emission
Reduced gasOxidized gas/aerosol
Oxidation
Uptake
Reduction

CO, VOCs, NOx
HO2OH
NONO2
H2O2
O3
hv, H2O
hvHNO3
OH
VOCs + OH HCHO
HCHO + h 2HO2 + CO
HCHO + OH HO2 + CO + H2O
CO, VOCs
Simplified Tropospheric Ozone (O3) Chemistry
Role of Formaldehyde (HCHO)
NOx
HOx
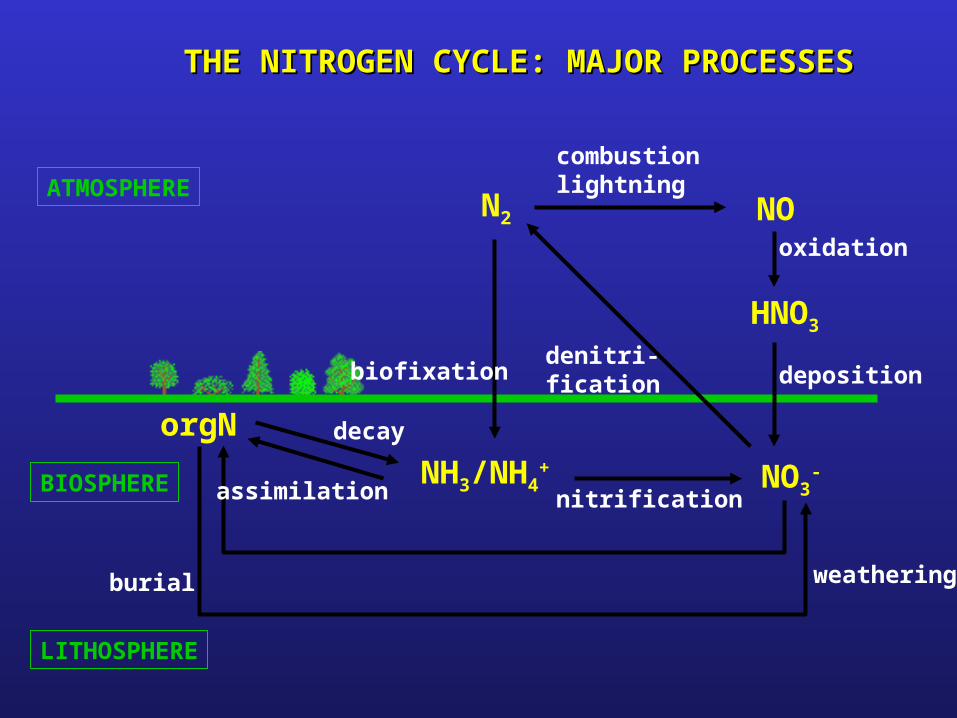
THE NITROGEN CYCLE: MAJOR PROCESSESTHE NITROGEN CYCLE: MAJOR PROCESSES
ATMOSPHEREN2 NO
HNO3
NH3/NH4+ NO3
-
orgN
BIOSPHERE
LITHOSPHERE
combustionlightning
oxidation
deposition
assimilation
decay
nitrification
denitri-ficationbiofixation
burial weathering

NONOxx EMISSIONS (Tg N yr EMISSIONS (Tg N yr-1-1) TO TROPOSPHERE) TO TROPOSPHERE
FOSSIL FUEL 20
AIRCRAFT 0.5
BIOFUEL 2
BIOMASSBURNING 5
SOILS 5
LIGHTNING 6
STRATOSPHERE 0.2

EULERIAN EULERIAN RESEARCH MODELS SOLVE MASS BALANCE RESEARCH MODELS SOLVE MASS BALANCE
(alias CONTINUITY) EQUATION IN 3-D ASSEMBLAGE OF (alias CONTINUITY) EQUATION IN 3-D ASSEMBLAGE OF GRIDBOXES GRIDBOXES
Solve continuity equation for individual gridboxes
• Models can presently afford ~ 106 gridboxes
• In global models, this implies a horizontal resolution of 100-500 km in horizontal and ~ 1 km in vertical
DELPz
u
y
u
x
un
t
n zyx


BOTTOM-UP EMISSION INVENTORIES ARE BOTTOM-UP EMISSION INVENTORIES ARE NOTORIOUSLY DIFFICULT TO DETERMINENOTORIOUSLY DIFFICULT TO DETERMINE
• Fuel use estimates• Measurements of emission ratios• Process studies• Estimate biological density• Temperature, water, … dependence
of biological activity• Extreme events

1E+08
1E+10
1E+12
1E+14
1E+16
200 300 400 500 600 700 800Wavelength [nm]
Inte
nsity [a
rbitra
ry u
nits]
O3 UV
O3 vis
HCHO
OClO
O4
O2
H2O
SO2 NO2
BrO
Satellite group: http://giger.iup.uni-heidelberg.de/
Absorbing properties of molecules
Atmospheric trace gas absorptions detected in satellite spectra:

Retrieval of Trace Gas ColumnRetrieval of Trace Gas Column
EARTH SURFACE
Scattering by Earth surface and by atmosphere
Backscatteredintensity IB
Solar Io
RingeIAI s
B )()()( 0
A
Nonlinear least-squares fitting

Total NOTotal NO22 Slant Columns Observed from the SCIAMACHY Slant Columns Observed from the SCIAMACHY
Satellite InstrumentSatellite Instrument
May-August 2004

Perform a Radiative Transfer Calculation to Account for Viewing Perform a Radiative Transfer Calculation to Account for Viewing Geometry and ScatteringGeometry and Scattering
Cloud Screening: Remove Scenes with ICloud Screening: Remove Scenes with IB,c B,c > I> IB,oB,o
RcRo
IB,o IB,c
Pc
Rs
•LIDORT Radiative Transfer Model [Spurr et al., 2002]
•FRESCO Clouds Fields [Koelemeijer et al., 2002]
•GOME Surface Reflectivity [Koelemeijer et al., 2003]
d
Io

Tropospheric NOTropospheric NO22 Columns Observed from the SCIAMACHY Columns Observed from the SCIAMACHY
Satellite InstrumentSatellite Instrument
May-August 2004
detectionlimit

Major Urban Centers Are Concentrated NOx SourcesMajor Urban Centers Are Concentrated NOx Sources
May-August 2004
detectionlimit

Sillman and He, 2002
(ppbv)
NOx-Saturated
NOx-Limited
Shown that the HCHO/NO2 Ratio Is as IndicatorThat Can be Observed from Space
Ozone Control Strategies Require Independent Ozone Control Strategies Require Independent Information on Effectiveness of Reducing NOx or VOCsInformation on Effectiveness of Reducing NOx or VOCs

GOME Observations Show NOGOME Observations Show NOxx-Sensitive Conditions -Sensitive Conditions
Over Most Polluted Regions During AugustOver Most Polluted Regions During AugustMajor Industrial Areas are Clear ExceptionsMajor Industrial Areas are Clear Exceptions
August
White areas indicate clouds or data below the GOME detection limit
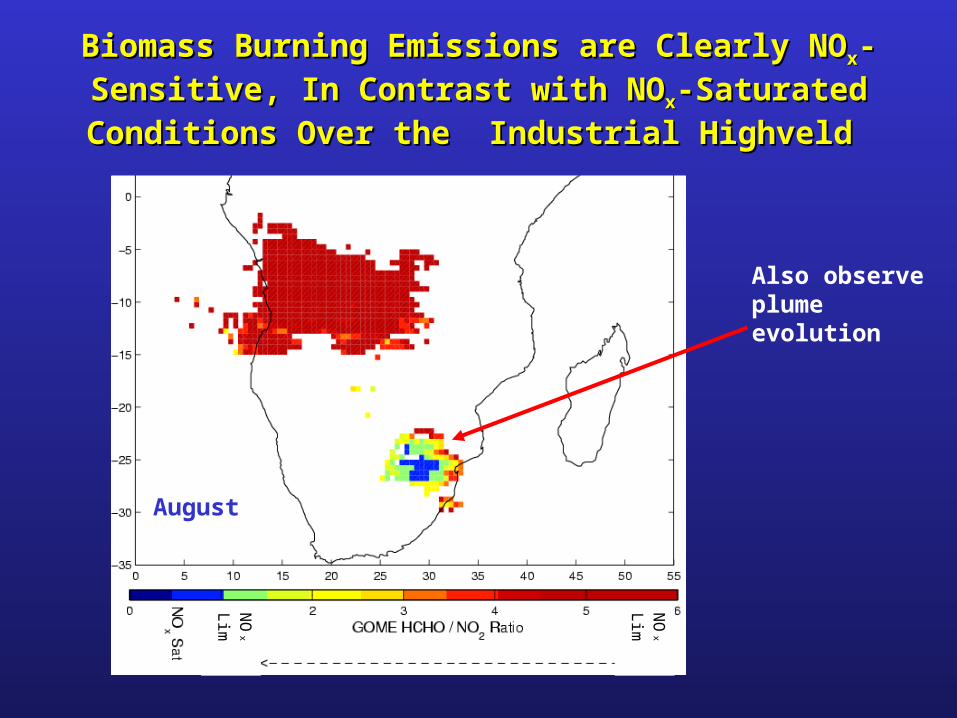
Biomass Burning Emissions are Clearly NOBiomass Burning Emissions are Clearly NOxx-Sensitive, -Sensitive,
In Contrast with NOIn Contrast with NOxx-Saturated Conditions Over the -Saturated Conditions Over the
Industrial Highveld Industrial Highveld
August
Also observe plume evolution
NO
x L
im
NO
x L
im

Seasonal Seasonal Evolution from Evolution from
NOx-Sensitive to NOx-Sensitive to NOx-Saturated NOx-Saturated
Conditions in FallConditions in Fall