Embed Size (px)
Citation preview
Damage and failure characteristics of rock similar materialswith pre-existing cracks
Xiaoyu Cheng1
Received: 13 April 2019 / Revised: 27 May 2019 / Accepted: 12 July 2019 / Published online: 22 July 2019
� The Author(s) 2019
Abstract In order to further study the damage and failure mechanism for rock similar materials, this study investigated the
mechanical properties and failure characteristics, law of damage space development, and damage evolution characteristics
for rock similar materials with pre-existing cracks of varying length under uniaxial compression load. The equipment used
in this study is the self-developed YYW-II strain controlled unconfined compression apparatus and the PCIE-8 acoustic
emission monitoring system. Results show that, as the length of pre-existing crack increases: (1) the peak and residual
strength reduces, and the peak axial strain and the strain during the initial compression phase increases; (2) the major
failure mode is changed from shear failure to tensile failure along a vertical plane that passes the middle of the pre-existing
crack; (3) The damage increases during the stable and accelerated development stage, and the effect of the pre-existing
cracks is more during the accelerated development stage than the stable development stage.
Keywords Pre-existing cracks � Rock similar materials � Mechanical properties � Acoustic emission localization � Damage
evolution
1 Introduction
Rock is a commonly seen material in geotechnical engi-
neering (Zhou et al. 2014; Cao et al. 2016a, b; Bahaaddini
et al. 2013). Cracks in rock heavily influence its stability in
geologic structural and engineering activities (Camones
et al. 2013; Zhao et al. 2016; Cheng et al. 2016). Cracks in
rock have direct influence to its physical and mechanical
property, which is directly linked to rock’s deformation and
failure (Cao et al. 2016a, b; Fan et al. 2015; Lee and Jeon
2011; Manouchehrian et al. 2014).
Lots of researchers have studied the deformation failure
characteristics of cracked rock. Park and Bobet (2009)
studied the cracks generation, development, extension, and
connection, proposed eight crack connection patterns, and
found the influence of connection pattern to rock sample
strength: Wing cracks are tensile cracks that initiate at or
near the tip of the flaws, are stable, and propagate towards
the direction of maximum compression. Coalescence is
produced by the linkage of two flaws by a combination of
wing and secondary cracks. The types of coalescence are
classified based on the types of cracks that produce linkage,
and are closely related to the orientation, spacing, and
continuity of the flaws. Nasseri et al. (1997) and Niandou
et al. (1997) conducted mechanical test to rock samples
with pre-existing cracks, discovered 3 different types of
failure modes, and found that the crack angle and the
confining pressure are the major factors influencing the
failure modes: Quartzitic and Chlorite schists due to pres-
ence of continuous weakness planes exhibit ‘‘axial cleav-
age monofracture and multifracture’’ pattern in unconfined
state which is typical of hard fine grained rocks. Where as
Quartz mica and Biotite schists due to absence of persistent
continuous foliation plane and being coarse grained exhibit
‘‘multi shear cataclasis failure pattern’’. Yang et al. (2009)
conducted uniaxial compression test to granite rock
& Xiaoyu Cheng
1 China Coal Energy Research Institute Co., Ltd.,
Xi’an 710054, People’s Republic of China
123
Int J Coal Sci Technol (2019) 6(4):505–517
https://doi.org/10.1007/s40789-019-0263-4
samples with pre-existing cracks, studied their failure
characteristics, and analyzed the influence of crack length,
the number of cracks, and crack angle to the sample
strength, elasticity modulus, deformation and failure:
Compared with the intact marble, the marble with pre-
existing fissure takes on the localization deformation and
asymptotic failure. The peak strength, elastic modulus and
peak axial strain of marble with pre-existing fissure are all
lower than that of intact marble, and the reduction extent is
closely related to the distribution forms of pre-existing
fissure. Zhao et al. (2013) studied the influence of crack
angle and density to the sample peak strength and crack
connection patterns of rock material with multiple, ordered
cracks: It is concluded that the transfixion pattern of wing
tensile cracks, transfixion pattern of tension-shear cracks
between different rows and oblique shear crack transfixion
pattern in the same row are the main rapture modes for the
ordered multi-crack body. The representative peak strength
of specimens decreases with the increasing number of
cracks. Li et al. (2004) investigated the crack development
and connection mechanism for granite rock samples with
pre-existing cracks under uniaxial compression: It is shown
that the influence of pre-existing cracks is significant, and
the critical collapsing load, failure stress and elastic mod-
ulus are all reduced. The orientations of pre-existing cracks
can decide which kind of wing cracks will be produced.
The interactions between cracks are of marked influence on
the initiation and propagation of wing cracks, and make
failure manners of samples thoroughly different. Scholz
(1968) used 6 acoustic emission (AE) sensors and studied
the AE events spatial distribution in rock samples under
uniaxial compression: Many small cracking events or
microfractures precede fracture in laboratory compression
tests on rock. These observations suggest that the approx-
imate time and place of fracture could have been predicted.
In the light of the similarity of microfractures and earth-
quakes, this suggests a possible method for predicting
earthquakes. Zhao et al. (2008) studied the AE events
during rock sample failure for different type of rocks, and
revealed their failure mechanism: The results showed that
failure modes of all samples are the same. During loading,
the number of AE events is minimum in sandy rock but
maximum in granite, and both the numbers in sandy rock
and red granite change very clearly with no portent of
failure to come. The AE location as a time-of-arrival
results are affected by the elastic wave velocity in rock
sample. Lei et al. (2004) investigated the spatial distribu-
tion of the AE events during the failure process of jointed
rock mass under triaxial compression: AE activity is
modeled quantitatively in terms of the seismic b- value of
the magnitude-frequency relation, the self-excitation
strength of the AE time series, and the fractal dimension of
AE hypocenters. Consistent with previous studies on rock
samples containing a fracture plane with several asperities,
the present analyses reveal three long-term phases of AE
activity associated with damage creation on heterogeneous
faults, each clearly identifiable based on the above
parameters. Zuo et al. (2011) used a real time AE events
three-dimensional positioning apparatus studied the AE
characteristics and their spatio-temporal evolution mecha-
nism for coal, rock, and coal and rock combination: The
experimental results indicate that with the increase of load,
the cumulative AE numbers of single rock, single coal and
coal-rock combined bodies are increasing. With the
increase of load, the AE number in a time interval gradu-
ally increases in rock, decreases in coal, and increases
initially and then decreases in coal-rock combined body.
Tang and Xu (1990) established the rock material failure
model under uniaxial compression by using the continuum
damage mechanics theory: It is proved that the acoustic
emission count N shows no difference with damage
parameter D. The acoustic emission count N is therefore
used to describe the constitutive relation of the rock. The
theoretical result agress quite well with that from
experiments.
Rock similar materials can simulate the complex
implementation process and condition in geotechnical
engineering and overcomes the challenges in field mea-
surement. Similar material simulation experimental studies
have been widely used in the field of mining, tunneling,
and water conservancy. Therefore, there is a need for the
systematical study of the deformation failure characteris-
tics for rock similar material with pre-existing cracks. In
the study of the AE evolution characteristics, there are few
studies on the influence of fracture parameters on the
evolution of AE events. Further study is needed due to that
the crack parameters have great impact on the AE evolu-
tion characteristics.
Based on the above analysis of the research status, in
this study, the influence of crack length to the deformation
and failure mode, AE events and micro cracks develop-
ment, and damage properties of rock similar materials are
investigated. The outcomes provide basis for the research
of instability failure and crack development mechanism of
geotechnical engineering similar material models.
2 Experimental designs
2.1 Preparation of rock similar material specimens
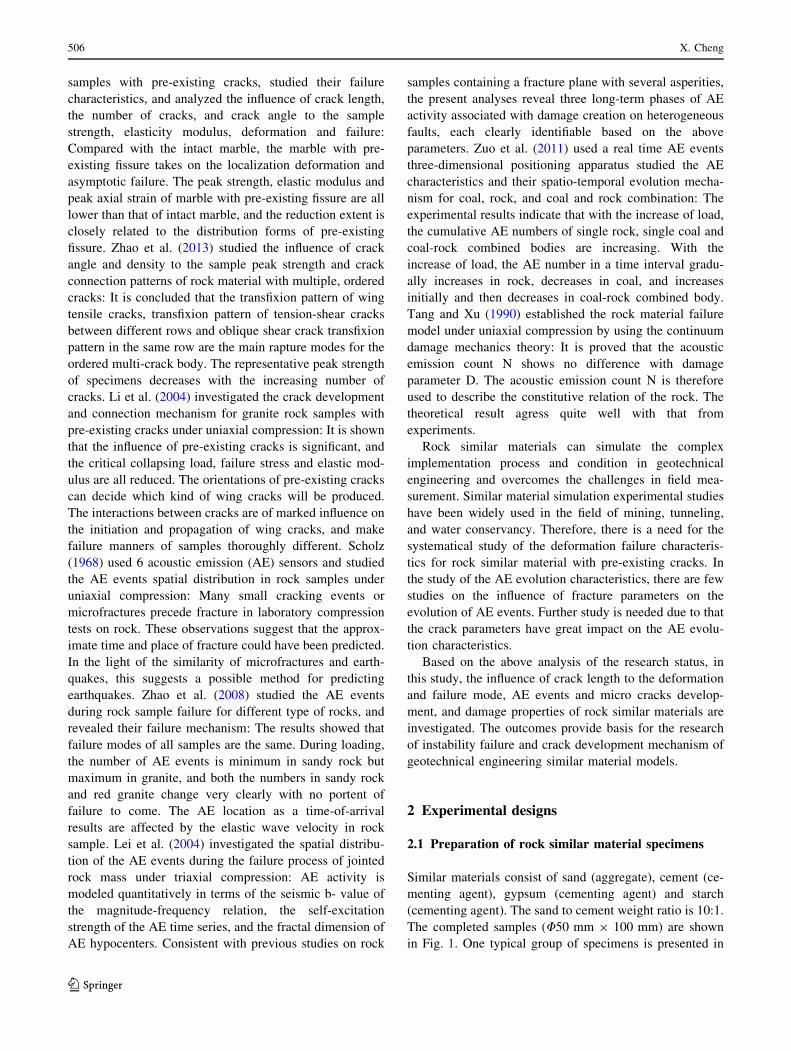
Similar materials consist of sand (aggregate), cement (ce-
menting agent), gypsum (cementing agent) and starch
(cementing agent). The sand to cement weight ratio is 10:1.
The completed samples (U50 mm 9 100 mm) are shown
in Fig. 1. One typical group of specimens is presented in
506 X. Cheng
123
this paper. The three specimens in this group are numbered
L-1, L-2, and L-3. The crack length for specimen L-1, L-2,
and L-3 are 30, 40, and 50 mm, respectively. The width of
the cracks is 3 mm, and the angle is 45� (Fig. 2).
2.2 Loading conditions and damage monitoring
design
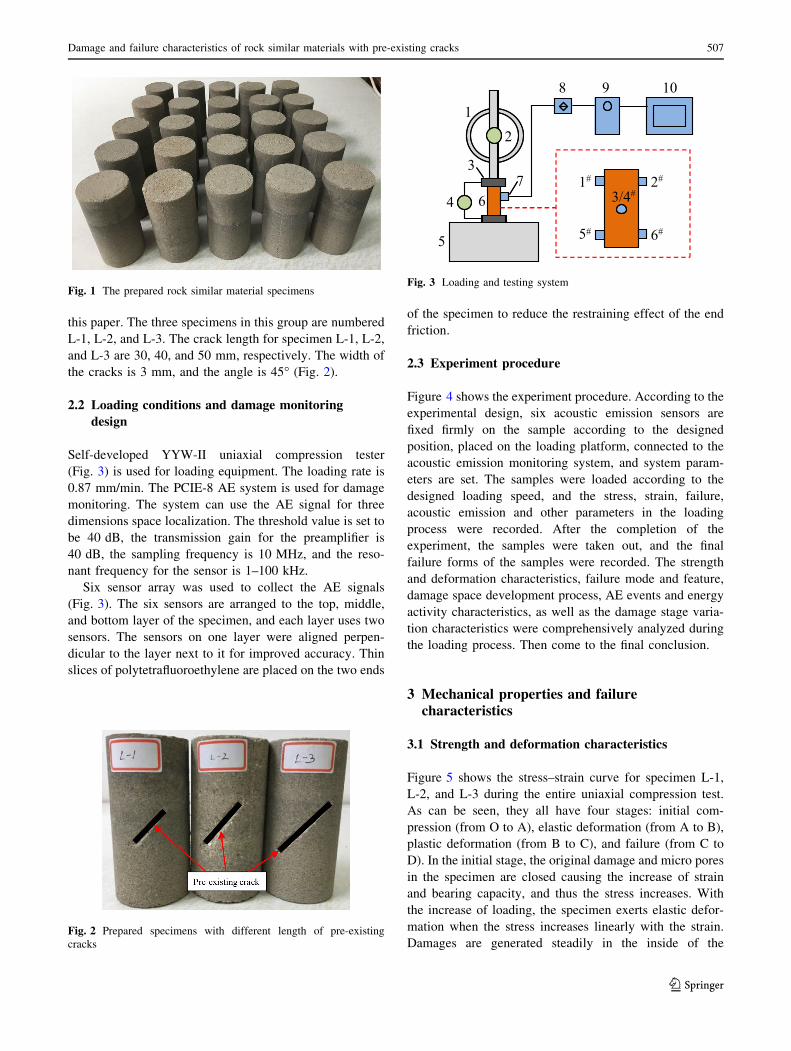
Self-developed YYW-II uniaxial compression tester
(Fig. 3) is used for loading equipment. The loading rate is
0.87 mm/min. The PCIE-8 AE system is used for damage
monitoring. The system can use the AE signal for three
dimensions space localization. The threshold value is set to
be 40 dB, the transmission gain for the preamplifier is
40 dB, the sampling frequency is 10 MHz, and the reso-
nant frequency for the sensor is 1–100 kHz.
Six sensor array was used to collect the AE signals
(Fig. 3). The six sensors are arranged to the top, middle,
and bottom layer of the specimen, and each layer uses two
sensors. The sensors on one layer were aligned perpen-
dicular to the layer next to it for improved accuracy. Thin
slices of polytetrafluoroethylene are placed on the two ends
of the specimen to reduce the restraining effect of the end
friction.
2.3 Experiment procedure
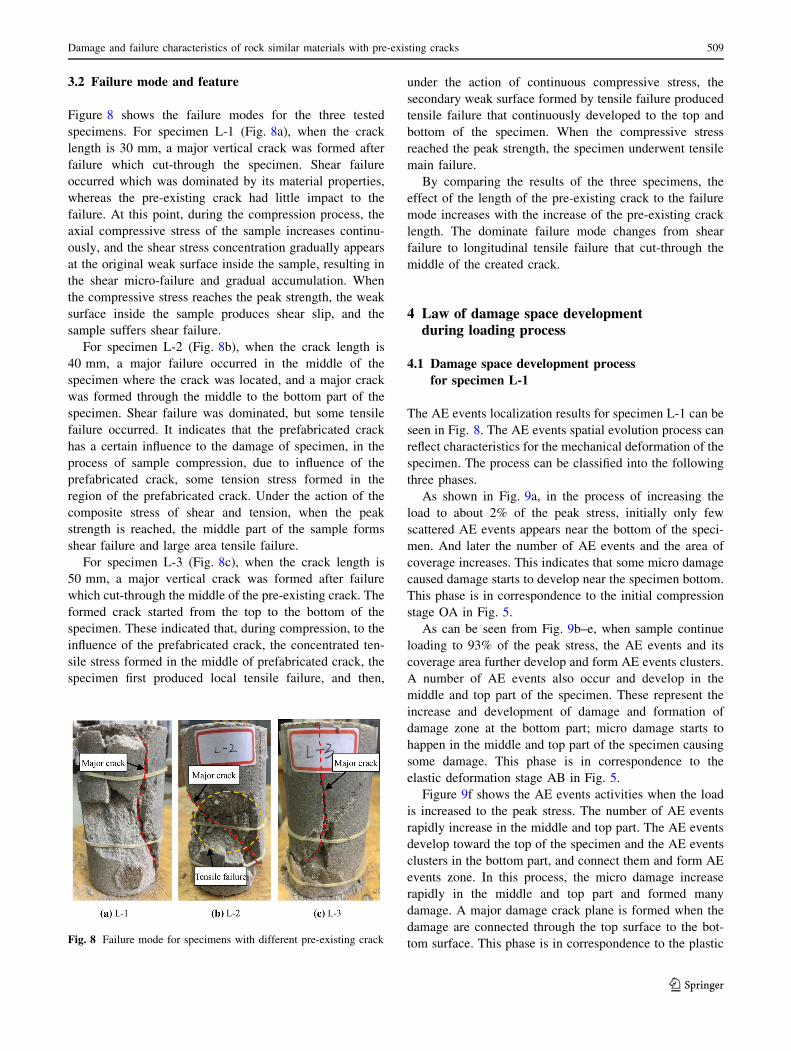
Figure 4 shows the experiment procedure. According to the
experimental design, six acoustic emission sensors are
fixed firmly on the sample according to the designed
position, placed on the loading platform, connected to the
acoustic emission monitoring system, and system param-
eters are set. The samples were loaded according to the
designed loading speed, and the stress, strain, failure,
acoustic emission and other parameters in the loading
process were recorded. After the completion of the
experiment, the samples were taken out, and the final
failure forms of the samples were recorded. The strength
and deformation characteristics, failure mode and feature,
damage space development process, AE events and energy
activity characteristics, as well as the damage stage varia-
tion characteristics were comprehensively analyzed during
the loading process. Then come to the final conclusion.
3 Mechanical properties and failurecharacteristics
3.1 Strength and deformation characteristics
Figure 5 shows the stress–strain curve for specimen L-1,
L-2, and L-3 during the entire uniaxial compression test.
As can be seen, they all have four stages: initial com-
pression (from O to A), elastic deformation (from A to B),
plastic deformation (from B to C), and failure (from C to
D). In the initial stage, the original damage and micro pores
in the specimen are closed causing the increase of strain
and bearing capacity, and thus the stress increases. With
the increase of loading, the specimen exerts elastic defor-
mation when the stress increases linearly with the strain.
Damages are generated steadily in the inside of the
Fig. 1 The prepared rock similar material specimens
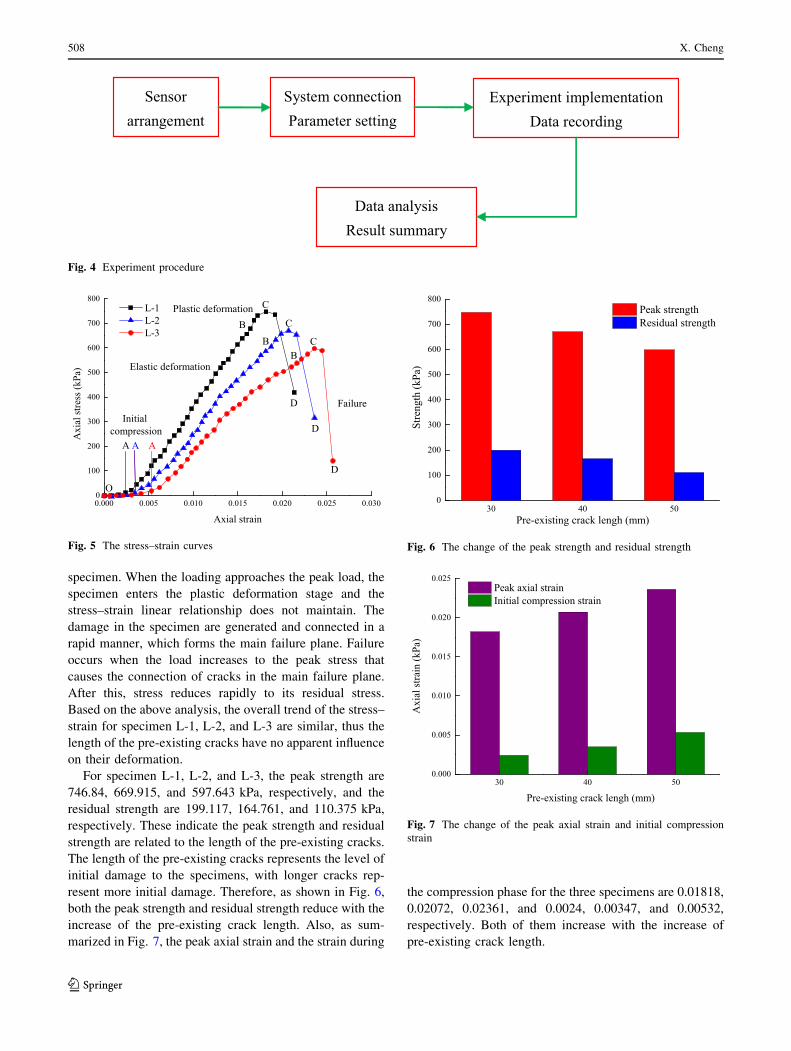
Fig. 2 Prepared specimens with different length of pre-existing
cracks
1
2
3
4 6
5
7
8 9 10
1# 2#
5# 6#
3/4#
Fig. 3 Loading and testing system
Damage and failure characteristics of rock similar materials with pre-existing cracks 507
123
specimen. When the loading approaches the peak load, the
specimen enters the plastic deformation stage and the
stress–strain linear relationship does not maintain. The
damage in the specimen are generated and connected in a
rapid manner, which forms the main failure plane. Failure
occurs when the load increases to the peak stress that
causes the connection of cracks in the main failure plane.
After this, stress reduces rapidly to its residual stress.
Based on the above analysis, the overall trend of the stress–
strain for specimen L-1, L-2, and L-3 are similar, thus the
length of the pre-existing cracks have no apparent influence
on their deformation.
For specimen L-1, L-2, and L-3, the peak strength are
746.84, 669.915, and 597.643 kPa, respectively, and the
residual strength are 199.117, 164.761, and 110.375 kPa,
respectively. These indicate the peak strength and residual
strength are related to the length of the pre-existing cracks.
The length of the pre-existing cracks represents the level of
initial damage to the specimens, with longer cracks rep-
resent more initial damage. Therefore, as shown in Fig. 6,
both the peak strength and residual strength reduce with the
increase of the pre-existing crack length. Also, as sum-
marized in Fig. 7, the peak axial strain and the strain during
the compression phase for the three specimens are 0.01818,
0.02072, 0.02361, and 0.0024, 0.00347, and 0.00532,
respectively. Both of them increase with the increase of
pre-existing crack length.
Sensor arrangement
System connection Parameter setting
Data analysisResult summary
Experiment implementationData recording
Fig. 4 Experiment procedure
0.000 0.005 0.010 0.015 0.020 0.025 0.0300
100
200
300
400
500
600
700
800
Failure
Plastic deformation
Elastic deformation
Initial compression
D
D
D
C
C
C
BB
B
A A A
Axi
al st
ress
(kPa
)
Axial strain
L-1 L-2 L-3
O
Fig. 5 The stress–strain curves
30 40 500
100
200
300
400
500
600
700
800
Stre
ngth
(kPa
)
Pre-existing crack lengh (mm)
Peak strength Residual strength
Fig. 6 The change of the peak strength and residual strength
30 40 500.000
0.005
0.010
0.015
0.020
0.025
Axi
al st
rain
(kPa
)
Pre-existing crack lengh (mm)
Peak axial strain Initial compression strain
Fig. 7 The change of the peak axial strain and initial compression
strain
508 X. Cheng
123
3.2 Failure mode and feature
Figure 8 shows the failure modes for the three tested
specimens. For specimen L-1 (Fig. 8a), when the crack
length is 30 mm, a major vertical crack was formed after
failure which cut-through the specimen. Shear failure
occurred which was dominated by its material properties,
whereas the pre-existing crack had little impact to the
failure. At this point, during the compression process, the
axial compressive stress of the sample increases continu-
ously, and the shear stress concentration gradually appears
at the original weak surface inside the sample, resulting in
the shear micro-failure and gradual accumulation. When
the compressive stress reaches the peak strength, the weak
surface inside the sample produces shear slip, and the
sample suffers shear failure.
For specimen L-2 (Fig. 8b), when the crack length is
40 mm, a major failure occurred in the middle of the
specimen where the crack was located, and a major crack
was formed through the middle to the bottom part of the
specimen. Shear failure was dominated, but some tensile
failure occurred. It indicates that the prefabricated crack
has a certain influence to the damage of specimen, in the
process of sample compression, due to influence of the
prefabricated crack, some tension stress formed in the
region of the prefabricated crack. Under the action of the
composite stress of shear and tension, when the peak
strength is reached, the middle part of the sample forms
shear failure and large area tensile failure.
For specimen L-3 (Fig. 8c), when the crack length is
50 mm, a major vertical crack was formed after failure
which cut-through the middle of the pre-existing crack. The
formed crack started from the top to the bottom of the
specimen. These indicated that, during compression, to the
influence of the prefabricated crack, the concentrated ten-
sile stress formed in the middle of prefabricated crack, the
specimen first produced local tensile failure, and then,
under the action of continuous compressive stress, the
secondary weak surface formed by tensile failure produced
tensile failure that continuously developed to the top and
bottom of the specimen. When the compressive stress
reached the peak strength, the specimen underwent tensile
main failure.
By comparing the results of the three specimens, the
effect of the length of the pre-existing crack to the failure
mode increases with the increase of the pre-existing crack
length. The dominate failure mode changes from shear
failure to longitudinal tensile failure that cut-through the
middle of the created crack.
4 Law of damage space developmentduring loading process
4.1 Damage space development process
for specimen L-1
The AE events localization results for specimen L-1 can be
seen in Fig. 8. The AE events spatial evolution process can
reflect characteristics for the mechanical deformation of the
specimen. The process can be classified into the following
three phases.
As shown in Fig. 9a, in the process of increasing the
load to about 2% of the peak stress, initially only few
scattered AE events appears near the bottom of the speci-
men. And later the number of AE events and the area of
coverage increases. This indicates that some micro damage
caused damage starts to develop near the specimen bottom.
This phase is in correspondence to the initial compression
stage OA in Fig. 5.
As can be seen from Fig. 9b–e, when sample continue
loading to 93% of the peak stress, the AE events and its
coverage area further develop and form AE events clusters.
A number of AE events also occur and develop in the
middle and top part of the specimen. These represent the
increase and development of damage and formation of
damage zone at the bottom part; micro damage starts to
happen in the middle and top part of the specimen causing
some damage. This phase is in correspondence to the
elastic deformation stage AB in Fig. 5.
Figure 9f shows the AE events activities when the load
is increased to the peak stress. The number of AE events
rapidly increase in the middle and top part. The AE events
develop toward the top of the specimen and the AE events
clusters in the bottom part, and connect them and form AE
events zone. In this process, the micro damage increase
rapidly in the middle and top part and formed many
damage. A major damage crack plane is formed when the
damage are connected through the top surface to the bot-
tom surface. This phase is in correspondence to the plasticFig. 8 Failure mode for specimens with different pre-existing crack
Damage and failure characteristics of rock similar materials with pre-existing cracks 509
123
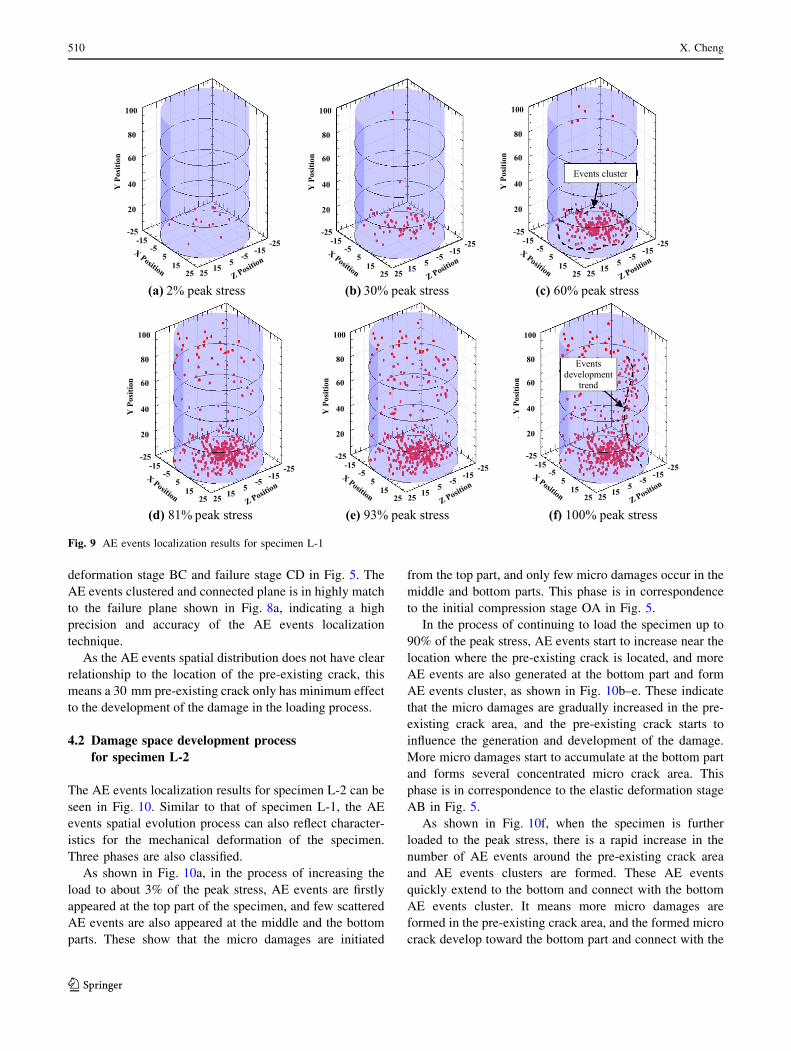
deformation stage BC and failure stage CD in Fig. 5. The
AE events clustered and connected plane is in highly match
to the failure plane shown in Fig. 8a, indicating a high
precision and accuracy of the AE events localization
technique.
As the AE events spatial distribution does not have clear
relationship to the location of the pre-existing crack, this
means a 30 mm pre-existing crack only has minimum effect
to the development of the damage in the loading process.
4.2 Damage space development process
for specimen L-2
The AE events localization results for specimen L-2 can be
seen in Fig. 10. Similar to that of specimen L-1, the AE
events spatial evolution process can also reflect character-
istics for the mechanical deformation of the specimen.
Three phases are also classified.
As shown in Fig. 10a, in the process of increasing the
load to about 3% of the peak stress, AE events are firstly
appeared at the top part of the specimen, and few scattered
AE events are also appeared at the middle and the bottom
parts. These show that the micro damages are initiated
from the top part, and only few micro damages occur in the
middle and bottom parts. This phase is in correspondence
to the initial compression stage OA in Fig. 5.
In the process of continuing to load the specimen up to
90% of the peak stress, AE events start to increase near the
location where the pre-existing crack is located, and more
AE events are also generated at the bottom part and form
AE events cluster, as shown in Fig. 10b–e. These indicate
that the micro damages are gradually increased in the pre-
existing crack area, and the pre-existing crack starts to
influence the generation and development of the damage.
More micro damages start to accumulate at the bottom part
and forms several concentrated micro crack area. This
phase is in correspondence to the elastic deformation stage
AB in Fig. 5.
As shown in Fig. 10f, when the specimen is further
loaded to the peak stress, there is a rapid increase in the
number of AE events around the pre-existing crack area
and AE events clusters are formed. These AE events
quickly extend to the bottom and connect with the bottom
AE events cluster. It means more micro damages are
formed in the pre-existing crack area, and the formed micro
crack develop toward the bottom part and connect with the
Z Position
100
80
60
40
20
-25-15
-55
1525
-25-15
-55
1525
X Position
noitisoPY
Z Position
100
80
60
40
20
-25-15
-55
1525
-25-15
-55
1525
X Position
noitisoPY
Z Position
100
80
60
40
20
-25-15
-55
1525
-25-15
-55
1525
X Position
noitisoPY
Events cluster
(a) 2% peak stress (b) 30% peak stress (c) 60% peak stress
Z Position
100
80
60
40
20
-25-15
-55
1525
-25-15
-55
1525
X Position
noitisoPY
Z Position
100
80
60
40
20
-25-15
-55
1525
-25-15
-55
1525
X Position
noitisoPY
Z Position
100
80
60
40
20
-25-15
-55
1525
-25-15
-55
1525
X Position
noitisoPY
Events development
trend
(d) 81% peak stress (e) 93% peak stress (f) 100% peak stress
Fig. 9 AE events localization results for specimen L-1
510 X. Cheng
123
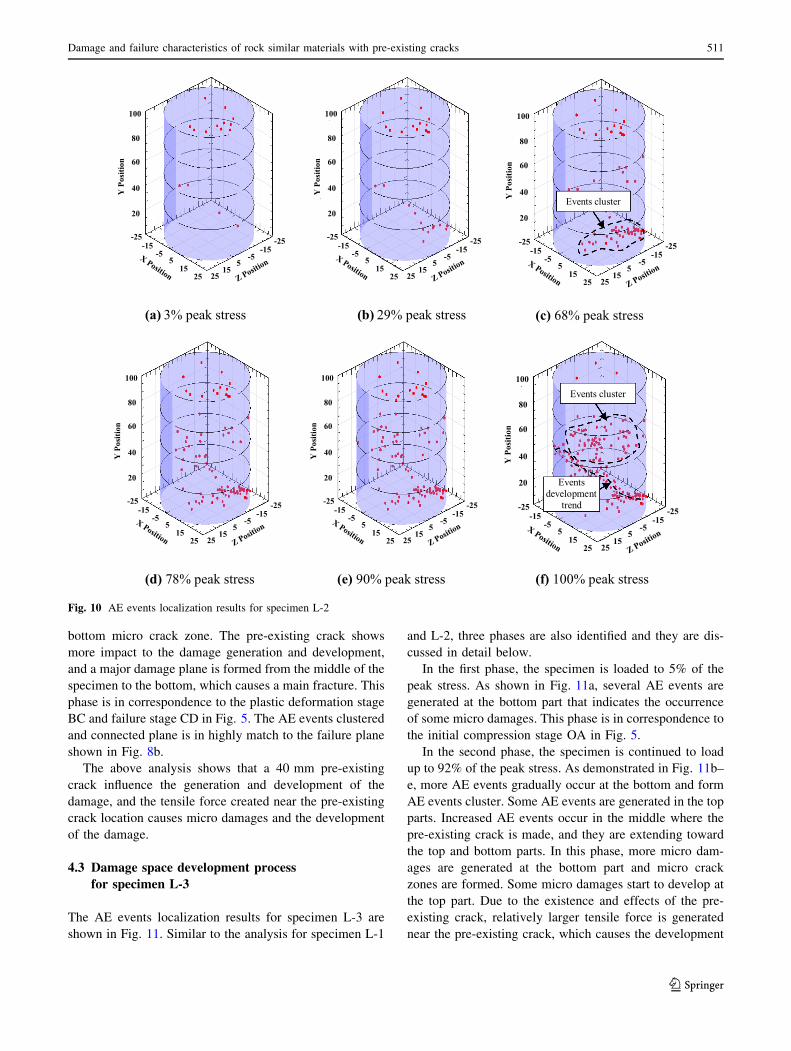
bottom micro crack zone. The pre-existing crack shows
more impact to the damage generation and development,
and a major damage plane is formed from the middle of the
specimen to the bottom, which causes a main fracture. This
phase is in correspondence to the plastic deformation stage
BC and failure stage CD in Fig. 5. The AE events clustered
and connected plane is in highly match to the failure plane
shown in Fig. 8b.
The above analysis shows that a 40 mm pre-existing
crack influence the generation and development of the
damage, and the tensile force created near the pre-existing
crack location causes micro damages and the development
of the damage.
4.3 Damage space development process
for specimen L-3
The AE events localization results for specimen L-3 are
shown in Fig. 11. Similar to the analysis for specimen L-1
and L-2, three phases are also identified and they are dis-
cussed in detail below.
In the first phase, the specimen is loaded to 5% of the
peak stress. As shown in Fig. 11a, several AE events are
generated at the bottom part that indicates the occurrence
of some micro damages. This phase is in correspondence to
the initial compression stage OA in Fig. 5.
In the second phase, the specimen is continued to load
up to 92% of the peak stress. As demonstrated in Fig. 11b–
e, more AE events gradually occur at the bottom and form
AE events cluster. Some AE events are generated in the top
parts. Increased AE events occur in the middle where the
pre-existing crack is made, and they are extending toward
the top and bottom parts. In this phase, more micro dam-
ages are generated at the bottom part and micro crack
zones are formed. Some micro damages start to develop at
the top part. Due to the existence and effects of the pre-
existing crack, relatively larger tensile force is generated
near the pre-existing crack, which causes the development
Z Position
100
80
60
40
20
-25-15
-55
1525
-25-15
-55
1525
X Position
noitisoPY
Z Position
100
80
60
40
20
-25-15
-55
1525
-25-15
-55
1525
X Position
noitisoPY
Z Position
100
80
60
40
20
-25-15
-55
1525
-25-15
-55
1525
X Position
noitisoPY Events cluster
(a) 3% peak stress (b) 29% peak stress (c) 68% peak stress
Z Position
100
80
60
40
20
-25-15
-55
1525
-25-15
-55
1525
X Position
noitisoPY
Z Position
100
80
60
40
20
-25-15
-55
1525
-25-15
-55
1525
X Position
noitisoPY
Z Position
100
80
60
40
20
-25-15
-55
1525
-25-15
-55
1525
X Position
noitisoPY
Events development
trend
Events cluster
(d) 78% peak stress (e) 90% peak stress (f) 100% peak stress
Fig. 10 AE events localization results for specimen L-2
Damage and failure characteristics of rock similar materials with pre-existing cracks 511
123
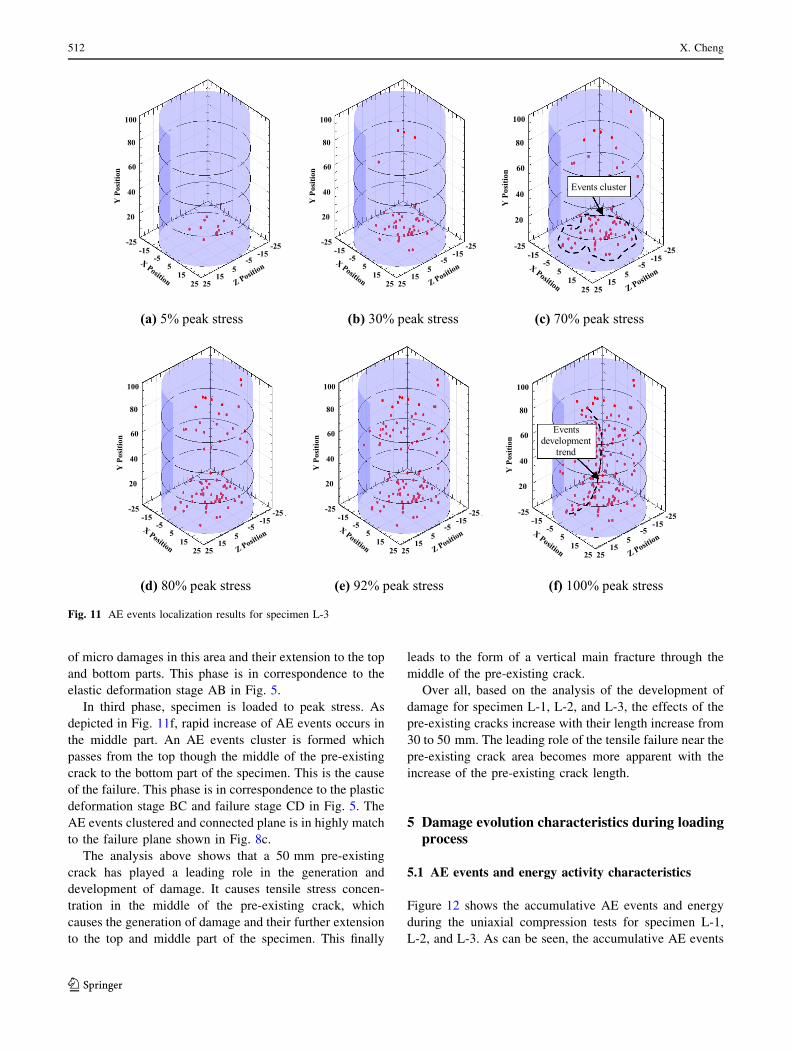
of micro damages in this area and their extension to the top
and bottom parts. This phase is in correspondence to the
elastic deformation stage AB in Fig. 5.
In third phase, specimen is loaded to peak stress. As
depicted in Fig. 11f, rapid increase of AE events occurs in
the middle part. An AE events cluster is formed which
passes from the top though the middle of the pre-existing
crack to the bottom part of the specimen. This is the cause
of the failure. This phase is in correspondence to the plastic
deformation stage BC and failure stage CD in Fig. 5. The
AE events clustered and connected plane is in highly match
to the failure plane shown in Fig. 8c.
The analysis above shows that a 50 mm pre-existing
crack has played a leading role in the generation and
development of damage. It causes tensile stress concen-
tration in the middle of the pre-existing crack, which
causes the generation of damage and their further extension
to the top and middle part of the specimen. This finally
leads to the form of a vertical main fracture through the
middle of the pre-existing crack.
Over all, based on the analysis of the development of
damage for specimen L-1, L-2, and L-3, the effects of the
pre-existing cracks increase with their length increase from
30 to 50 mm. The leading role of the tensile failure near the
pre-existing crack area becomes more apparent with the
increase of the pre-existing crack length.
5 Damage evolution characteristics during loadingprocess
5.1 AE events and energy activity characteristics
Figure 12 shows the accumulative AE events and energy
during the uniaxial compression tests for specimen L-1,
L-2, and L-3. As can be seen, the accumulative AE events
Z Position
100
80
60
40
20
-25-15
-55
1525
-25-15
-55
1525
X Position
noitisoPY
Z Position
100
80
60
40
20
-25-15
-55
1525
-25-15
-55
1525
X Position
noitisoPY
Z Position
100
80
60
40
20
-25-15
-55
1525
-25-15
-55
1525
X Position
noitisoPY
Events cluster
(a) 5% peak stress (b) 30% peak stress (c) 70% peak stress
Z Position
100
80
60
40
20
-25-15
-55
1525
-25-15
-55
1525
X Position
noitisoPY
Z Position
100
80
60
40
20
-25-15
-55
1525
-25-15
-55
1525
X Position
noitisoPY
Z Position
100
80
60
40
20
-25-15
-55
1525
-25-15
-55
1525
X Position
noitisoPY
Events development
trend
(d) 80% peak stress (e) 92% peak stress (f) 100% peak stress
Fig. 11 AE events localization results for specimen L-3
512 X. Cheng
123
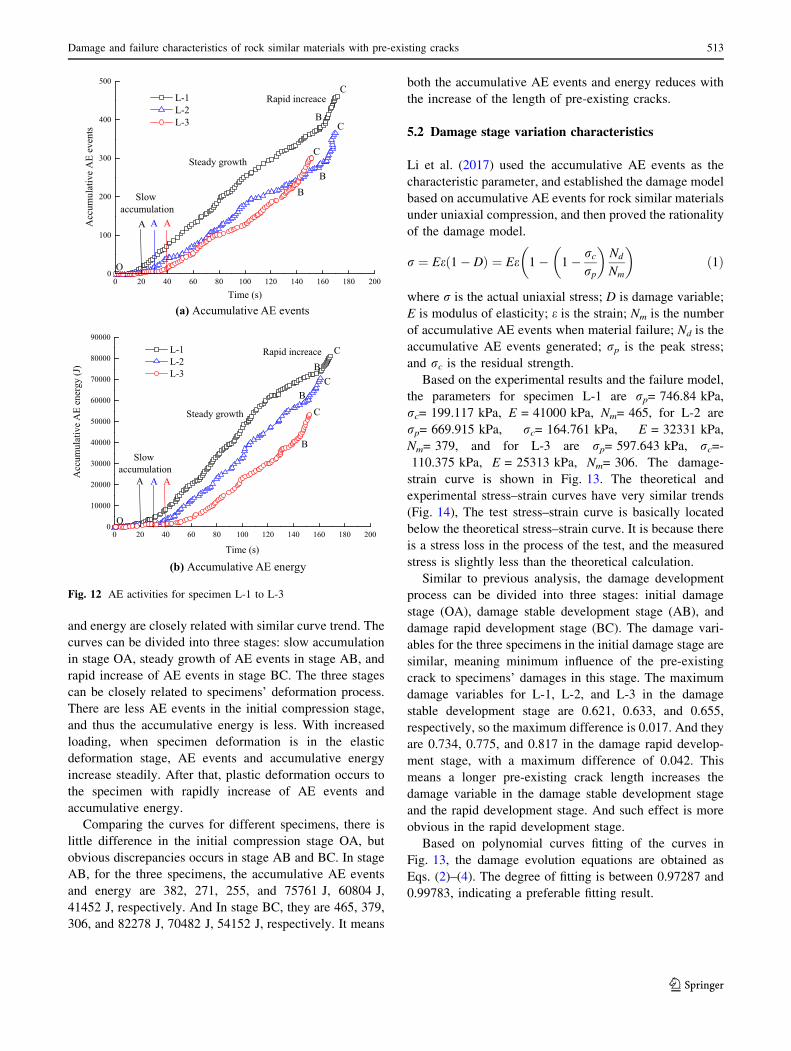
and energy are closely related with similar curve trend. The
curves can be divided into three stages: slow accumulation
in stage OA, steady growth of AE events in stage AB, and
rapid increase of AE events in stage BC. The three stages
can be closely related to specimens’ deformation process.
There are less AE events in the initial compression stage,
and thus the accumulative energy is less. With increased
loading, when specimen deformation is in the elastic
deformation stage, AE events and accumulative energy
increase steadily. After that, plastic deformation occurs to
the specimen with rapidly increase of AE events and
accumulative energy.
Comparing the curves for different specimens, there is
little difference in the initial compression stage OA, but
obvious discrepancies occurs in stage AB and BC. In stage
AB, for the three specimens, the accumulative AE events
and energy are 382, 271, 255, and 75761 J, 60804 J,
41452 J, respectively. And In stage BC, they are 465, 379,
306, and 82278 J, 70482 J, 54152 J, respectively. It means
both the accumulative AE events and energy reduces with
the increase of the length of pre-existing cracks.
5.2 Damage stage variation characteristics
Li et al. (2017) used the accumulative AE events as the
characteristic parameter, and established the damage model
based on accumulative AE events for rock similar materials
under uniaxial compression, and then proved the rationality
of the damage model.
r ¼ Ee 1� Dð Þ ¼ Ee 1� 1� rcrp
� �Nd
Nm
� �ð1Þ
where r is the actual uniaxial stress; D is damage variable;
E is modulus of elasticity; e is the strain; Nm is the number
of accumulative AE events when material failure; Nd is the
accumulative AE events generated; rp is the peak stress;
and rc is the residual strength.
Based on the experimental results and the failure model,
the parameters for specimen L-1 are rp= 746.84 kPa,
rc= 199.117 kPa, E = 41000 kPa, Nm= 465, for L-2 are
rp= 669.915 kPa, rc= 164.761 kPa, E = 32331 kPa,
Nm= 379, and for L-3 are rp= 597.643 kPa, rc=-110.375 kPa, E = 25313 kPa, Nm= 306. The damage-
strain curve is shown in Fig. 13. The theoretical and
experimental stress–strain curves have very similar trends
(Fig. 14), The test stress–strain curve is basically located
below the theoretical stress–strain curve. It is because there
is a stress loss in the process of the test, and the measured
stress is slightly less than the theoretical calculation.
Similar to previous analysis, the damage development
process can be divided into three stages: initial damage
stage (OA), damage stable development stage (AB), and
damage rapid development stage (BC). The damage vari-
ables for the three specimens in the initial damage stage are
similar, meaning minimum influence of the pre-existing
crack to specimens’ damages in this stage. The maximum
damage variables for L-1, L-2, and L-3 in the damage
stable development stage are 0.621, 0.633, and 0.655,
respectively, so the maximum difference is 0.017. And they
are 0.734, 0.775, and 0.817 in the damage rapid develop-
ment stage, with a maximum difference of 0.042. This
means a longer pre-existing crack length increases the
damage variable in the damage stable development stage
and the rapid development stage. And such effect is more
obvious in the rapid development stage.
Based on polynomial curves fitting of the curves in
Fig. 13, the damage evolution equations are obtained as
Eqs. (2)–(4). The degree of fitting is between 0.97287 and
0.99783, indicating a preferable fitting result.
0
100
200
300
400
500A
ccum
ulat
ive
AE
even
ts
C
C
C
BB
B
AAA
O
L-1 L-2 L-3
0 20 40 60 80 100 120 140 160 180 200
Rapid increace
Steady growth
Slow accumulation
Time (s)
0 20 40 60 80 100 120 140 160 180 2000
10000
20000
30000
40000
50000
60000
70000
80000
90000
C
C
C
B
B
B
O
Acc
umul
ativ
e A
E en
ergy
(J)
Time (s)
L-1 L-2 L-3
AAA
Slow accumulation
Steady growth
Rapid increace
(a) Accumulative AE events
(b) Accumulative AE energy
Fig. 12 AE activities for specimen L-1 to L-3
Damage and failure characteristics of rock similar materials with pre-existing cracks 513
123

0.0
0.1
0.2
0.3
0.4
0.5
0.6
0.7
0.8
0.9
1.0Damage rapid development
Damage stable development
Initial damage
Axial strain
C
B
AO
Dam
age
0.000 0.005 0.010 0.015 0.020 0.025 0.030
0.0
0.1
0.2
0.3
0.4
0.5
0.6
0.7
0.8
0.9
1.0
Axial strain
C
B
AO
Dam
age
Initial damage
Damage stable development
Damage rapid development
0.000 0.005 0.010 0.015 0.020 0.025 0.030
0.0
0.1
0.2
0.3
0.4
0.5
0.6
0.7
0.8
0.9
1.0
Axial strain
C
B
AO
Dam
age
0.000 0.005 0.010 0.015 0.020 0.025 0.030
Damage stable development
Initial damage Damage rapid development
(a) L-1
(b) L-2
(c) L-3
Fig. 13 The damage-strain curves
0.000 0.005 0.010 0.015 0.020 0.025 0.0300
100
200
300
400
500
600
700
800
Similar trends
Axi
al st
ress
(kPa
)
Axial strain
Theoretical curve Experimental curve
0.000 0.005 0.010 0.015 0.020 0.025 0.0300
100
200
300
400
500
600
700
800
Similar trends
Theoretical curve Experimental curve
Axial strain
Axi
al st
ress
(kPa
)
(a) L-1
(b) L-2
0.000 0.005 0.010 0.015 0.020 0.025 0.0300
100
200
300
400
500
600
700
800
Similar trends
Axi
al st
ress
(kPa
)
Axial strain
Theoretical curve Experimental curve
(c) L-3
Fig. 14 Comparison of theoretical and experimental stress–strain
curves
514 X. Cheng
123
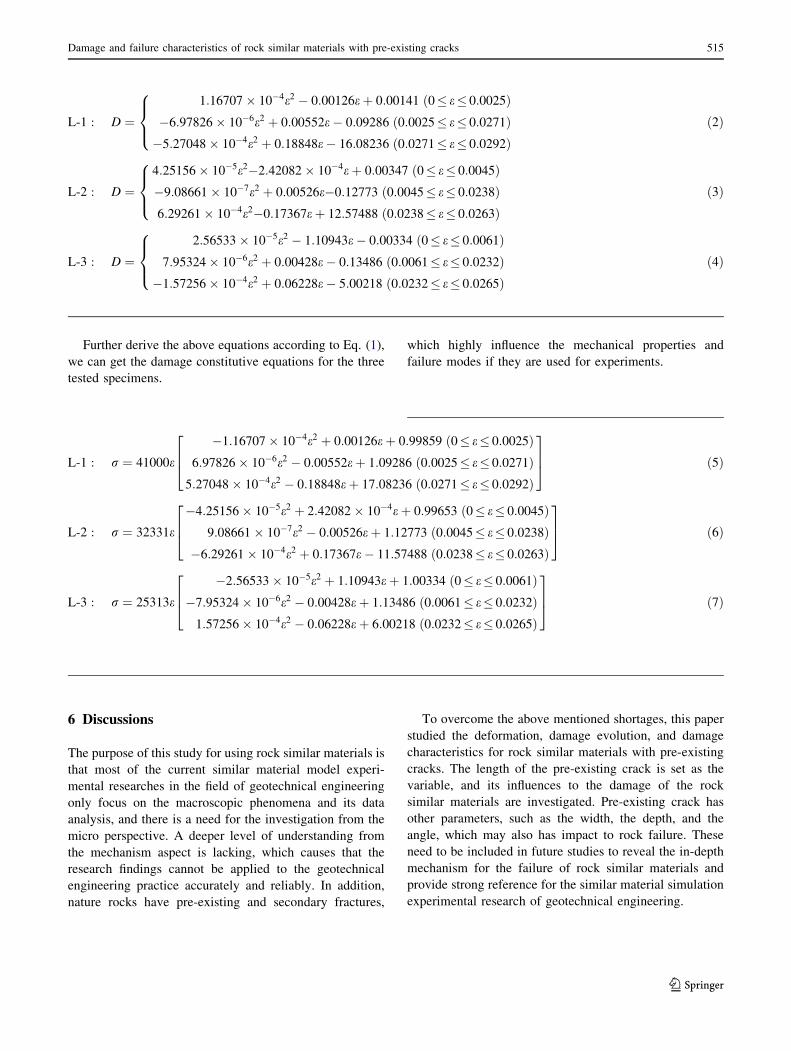
Further derive the above equations according to Eq. (1),
we can get the damage constitutive equations for the three
tested specimens.
6 Discussions
The purpose of this study for using rock similar materials is
that most of the current similar material model experi-
mental researches in the field of geotechnical engineering
only focus on the macroscopic phenomena and its data
analysis, and there is a need for the investigation from the
micro perspective. A deeper level of understanding from
the mechanism aspect is lacking, which causes that the
research findings cannot be applied to the geotechnical
engineering practice accurately and reliably. In addition,
nature rocks have pre-existing and secondary fractures,
which highly influence the mechanical properties and
failure modes if they are used for experiments.
To overcome the above mentioned shortages, this paper
studied the deformation, damage evolution, and damage
characteristics for rock similar materials with pre-existing
cracks. The length of the pre-existing crack is set as the
variable, and its influences to the damage of the rock
similar materials are investigated. Pre-existing crack has
other parameters, such as the width, the depth, and the
angle, which may also has impact to rock failure. These
need to be included in future studies to reveal the in-depth
mechanism for the failure of rock similar materials and
provide strong reference for the similar material simulation
experimental research of geotechnical engineering.
L-1 : D ¼1:16707 � 10�4e2 � 0:00126eþ 0:00141 ð0� e� 0:0025Þ
�6:97826� 10�6e2 þ 0:00552e� 0:09286 ð0:0025� e� 0:0271Þ�5:27048� 10�4e2 þ 0:18848e� 16:08236 ð0:0271� e� 0:0292Þ
8><>: ð2Þ
L-2 : D ¼4:25156� 10�5e2�2:42082� 10�4eþ 0:00347 ð0� e� 0:0045Þ�9:08661� 10�7e2 þ 0:00526e�0:12773 ð0:0045� e� 0:0238Þ6:29261� 10�4e2�0:17367eþ 12:57488 ð0:0238� e� 0:0263Þ
8><>: ð3Þ
L-3 : D ¼2:56533 � 10�5e2 � 1:10943e� 0:00334 ð0� e� 0:0061Þ
7:95324� 10�6e2 þ 0:00428e� 0:13486 ð0:0061� e� 0:0232Þ�1:57256� 10�4e2 þ 0:06228e� 5:00218 ð0:0232� e� 0:0265Þ
8><>: ð4Þ
L-1 : r ¼ 41000e
�1:16707� 10�4e2 þ 0:00126eþ 0:99859 ð0� e� 0:0025Þ6:97826� 10�6e2 � 0:00552eþ 1:09286 ð0:0025� e� 0:0271Þ
5:27048� 10�4e2 � 0:18848eþ 17:08236 ð0:0271� e� 0:0292Þ
264
375 ð5Þ
L-2 : r ¼ 32331e
�4:25156� 10�5e2 þ 2:42082� 10�4eþ 0:99653 ð0� e� 0:0045Þ9:08661 � 10�7e2 � 0:00526eþ 1:12773 ð0:0045� e� 0:0238Þ
�6:29261� 10�4e2 þ 0:17367e� 11:57488 ð0:0238� e� 0:0263Þ
264
375 ð6Þ
L-3 : r ¼ 25313e
�2:56533� 10�5e2 þ 1:10943eþ 1:00334 ð0� e� 0:0061Þ�7:95324� 10�6e2 � 0:00428eþ 1:13486 ð0:0061� e� 0:0232Þ1:57256� 10�4e2 � 0:06228eþ 6:00218 ð0:0232� e� 0:0265Þ
264
375 ð7Þ
Damage and failure characteristics of rock similar materials with pre-existing cracks 515
123
Most of the previous studies focused on the influence of
the crack parameters to the mechanical properties and
failure modes of rock. Few researches have studied its
influence to the rock failure evolution. This paper studied
the influence of pre-existing crack length to the compaction
failure process, AE events activities, and damage devel-
opments, established the inoculation, generation, and
development for the damage of rock similar materials, and
improved the understanding of damage evolution mecha-
nism for rock similar materials with pre-existing cracks.
Past researches investigate the rock damage properties
based on AE ringing counts. However, compared to AE
ringing counts, the number of AE events can reflect the
local change of material more directly. This paper uses the
accumulative AE events as the characteristic parameter,
and established the damage model for rock similar mate-
rials under compression. Based on this, the influences of
pre-existing crack to the damage characteristics are
investigated. The established damage model accurately
described the damage evolution for the tested material, and
further revealed its damage characteristics.
The findings of this paper further revealed the damage
mechanism for rock similar materials, and provided refer-
ence basis for the study of instability failure characteristics
and crack evolution mechanisms of similar material sim-
ulation in geotechnical engineering.
7 Conclusions
This study conducted uniaxial compression for rock similar
materials with different length of pre-existing cracks. The
influence of the length of pre-existing cracks to specimens’
damage and failure characteristics are investigated. Find-
ings are summarized in the following.
(1) The peak strength and residual strength decreases
with the increase of pre-existing crack length, but the
peak axial strain and the strain during the initial
compression stage increases. The influence to the
failure mode increases with increased pre-existing
crack length. The dominant failure mode changes
from shear failure to tensile failure with the failure
plane cut through the middle of the pre-existing
crack.
(2) With the increase of the length of the pre-existing
crack, its influence to the damage space development
increases, and the tensile force in the pre-existing
crack area shows enhanced effect to the development
of damage.
(3) With the length increase of the pre-existing cracks,
the accumulative AE events and energies reduces,
indicating weakened AE events activities. The initial
damage for the three types of specimens are similar,
but the influence increases in the damage stable and
rapid development stage. Furthermore, its influence
is larger in the damage rapid development stage than
the damage stable development stage.
Acknowledgements This paper is an extended version of a published
conference paper Li et al. (2017), and this paper gets its funding from
Project (51734007) supported by National Natural Science Founda-
tion of China. We would also like to acknowledge the editor-in-chief,
editors and the anonymous reviewers for their valuable comments,
which have greatly improved this paper.
Open Access This article is distributed under the terms of the
Creative Commons Attribution 4.0 International License (http://crea
tivecommons.org/licenses/by/4.0/), which permits unrestricted use,
distribution, and reproduction in any medium, provided you give
appropriate credit to the original author(s) and the source, provide a
link to the Creative Commons license, and indicate if changes were
made.
References
Bahaaddini M, Sharrock G, Hebblewhite BK (2013) Numerical
investigation of the effect of joint geometrical parameters on the
mechanical properties of a non-persistent jointed rock mass
under uniaxial compression. Comput Geotech 49:206–225
Camones LAM, Vargas EA, Figueiredo RP (2013) Application of the
discrete element method for modeling of rock crack propagation
and coalescence in the step-path failure mechanism. Eng Geol
153:80–94
Cao RH, Cao P, Fan X (2016a) An experimental and numerical study
on mechanical behavior of ubiquitous-joint brittle rock-like
specimens under uniaxial compression. Rock Mech Rock Eng
49:4319–4338
Cao RH, Cao P, Lin H (2016b) Mechanical behavior of brittle rock-
like specimens with pre-existing fissures under uniaxial loading:
experimental studies and particle mechanics approach. Rock
Mech Rock Eng 49:763–783
Cheng H, Zhou XP, Zhu J (2016) The effects of crack openings on
crack initiation, propagation and coalescence behavior in rock-
like materials under uniaxial compression. Rock Mech Rock Eng
49:3481–3494
Fan X, Kulatilake PHSW, Chen X (2015) Mechanical behavior of
rock-like jointed blocks with multi-non-persistent joints under
uniaxial loading: a particle mechanics approach. Eng Geol
190:17–32
Lee H, Jeon S (2011) An experimental and numerical study of
fracture coalescence in pre-cracked specimens under uniaxial
compression. Int J Solids Struct 48:979–999
Lei XL, Masuda K, Nishizawa O (2004) Detailed analysis of acoustic
emission activity during catastrophic fracture of faults in rock.
J Struct Geol 26:247–258
Li YP, Wan YH, Chen LZ (2004) Experimental research on pre-
existing cracks in marble under compression. Chin J Geotech
Eng 26:120–124
Li SH, Cheng XY, Liu C (2017) Effect law of damage characteristics
of rock similar material with pre-existing cracks. IOP Conf Ser
Mater Sci Eng 269:012011
Manouchehrian A, Sharifzadeh M, Marji MF (2014) A bonded
particle model for analysis of the flaw orientation effect on crack
516 X. Cheng
123
propagation mechanism in brittle materials under compression.
Arch Civ Mech Eng 14:40–52
Nasseri MH, Rao KS, Ramamurthy T (1997) Failure mechanism in
schistose rocks. Int J Rock Mech Min Sci 34:219.e1–219.e15
Niandou H, Shao JF, Henry JP (1997) Laboratory investigation of the
mechanical behavior of Tournemire shale. Int J Rock Mech Min
Sci 34:3–16
Park CH, Bobet A (2009) Crack coalescence in specimens with open
and closed flaws: a comparison. Int J Rock Mech Min Sci
46:819–829
Scholz CH (1968) Experimental study of the fracturing process in
brittle rock. J Geophys Res 73:1447–1454
Tang CA, Xu XH (1990) Evolution and propagation of material
defects and Kaiser effect function. J Seismol Res 13:203–213
Yang SQ, Dai YH, Han LJ (2009) Uniaxial compression experimental
research on deformation and failure properties of brittle marble
specimen with pre-existing fissures. Chin J Rock Mech Eng
28:2391–2404
Zhao XD, Chen CH, Liu JP (2008) Experimental study on AE activity
characteristics of different rock samples. J Northeast Univ Nat
Sci 29:1633–1636
Zhao YL, Wan W, Wang WJ (2013) Fracture experiments materials
on ordered multi-crack body in rock-like under uniaxial com-
pression and numerical simulation of wing cracks. Chin J
Geotech Eng 35:2097–2108
Zhao YL, Zhang LY, Wang WJ (2016) Cracking and stress-strain
behavior of rock-like material containing two flaws under
uniaxial compression. Rock Mech Rock Eng 49:2665–2687
Zhou XP, Cheng H, Feng YF (2014) An experimental study of crack
coalescence behavior in rock-like materials containing multiple
flaws under uniaxial compression. Rock Mech Rock Eng
47:1961–1986
Zuo JP, Pei JL, Liu JF (2011) Time-space evolution mechanism in
failure process of coal–rock combined body. Chin J Rock Mech
Eng 30:1564–1570
Damage and failure characteristics of rock similar materials with pre-existing cracks 517
123