Embed Size (px)
Citation preview
Damage Assessment of Multistoried Structures
under Seismic Loading using Pushover Analysis
Gutta Vijaya Aditya Pavan Kumar
B.E Civil Engineering,
Sir. C. R. R College of Engineering,
Eluru,
Andhra Pradesh, India.
Dr. R. Harinadha Babu
Professor in Civil Engineering,
Sir. C. R. R. College of Engineering
Abstract- The buildings which do not fulfill the
requirements of seismic design may be affected by either damage
or collapse if shaken by a severe ground motion which results in
huge economic and loss of life. A building has the potential to
wave back and forth during an earthquake and severe wind storm.
This is called fundamental mode, and is the lowest frequency of
building response. Most buildings, however, have higher modes of
response, which are uniquely activated depending up on the
intensity of earthquakes. The purpose of this paper is to assess the
damage and to evaluate the performance of the structures which
are already designed and analyzed using linear static analysis for
seismic loads as per the Indian codes IS-456, IS-1893 and IS-
13920. It is proposed to study the performance of the structure
before and after the linear state. To make such assessment,
simplified linear-elastic methods are not adequate. Thus, the
structural engineering community has developed a new generation
of design and seismic procedures (ATC-40, FEMA-356 and
FEMA-440) that incorporate performance based structures and is
moving away from simplified linear elastic methods and towards a
more non-linear technique i.e., Pushover analysis which is a series
of incremental static analysis. It is carried out on the 12-storied
building modal which was designed and analyzed for the
earthquake analysis using STAAD for two seismic load cases
(Zone-3 and Zone-5) considering both are Special Moment
Resisting Frames. Pushover analysis is propounded to perform by
SAP to get the extent of damage experienced by the structure at
target displacement by the sequence of yielding of components,
plastic hinge formation and failure of various structural
components. Finally both the frames which were designed to
linear static analysis for earthquake loading performed well and
the damage is within the limits. Initially, yielding of the beams
taken place then yielding of columns. This shows that the analysis
theory is based on the strong column and weak beam i.e., both the
frames behaving as ductile frames.
Keywords—fundamental mode; linear static analysis;
Non-linear analysis; pushover analysis; Target displacement ;
plastic hinge; ductile frame.
1. INTRODUCTION
Indian subcontinent experienced severe earthquakes
in the past decades. The major reason for the high frequency and intensity of the earthquakes is that the Indian plate is driving into Asia at a rate of approximately 47 mm per year. Geographical statistics of India shows that almost 54 percent
of land is vulnerable to earthquakes. World Bank and United Nations report shows estimates around 200 million city dwellers in India will be exposed to storms and earthquakes by 2050.
The latest version of seismic zoning map of India given in the earthquake resistant design code of India [IS 1893 (part 1) 2002] assigns four levels of seismicity for India in terms of zone factors. In other words, the earthquake zoning map of India divides India into 4 seismic zones (Zone 2, 3, 4, 5). Zone 5 expects the highest level of seismicity whereas Zone 2 is associated with the lowest level of seismicity. The zone factors for the different zones are as follows:
TABLE-I
ZONE FACTORS
S.NO ZONE Zone Factor
1. Zone 2 0.10
2. Zone3 0.16
3. Zone 4 0.24
4. Zone 5 0.36
Seismic analysis is a subset of structural analysis and is the calculation of the response of a building structure to earthquakes. It is part of the process of structural design, earthquake engineering and retrofit in regions where earthquakes are prevalent. Structural analysis methods are classified into following five categories:
a). Linear Static Analysis:
Linear static analysis or Equivalent static analysis can only be used for regular structure with limited height. Elastic analysis gives a good indication of the elasticity capacity of the structures though it cannot predict failure mechanisms but indicates where first yielding occurs. Design forces that are acquired from elastic spectrum are reduced using response modification factor. The larger the value of modification factor, the larger will be the level of energy
International Journal of Engineering Research & Technology (IJERT)
IJERT
IJERT
ISSN: 2278-0181
www.ijert.orgIJERTV3IS100082
(This work is licensed under a Creative Commons Attribution 4.0 International License.)
Vol. 3 Issue 10, October- 2014
99
absorption, resulting in formation of more number of plastic joints.
b). Response Spectrum Method (Dynamic Analysis):
This is an approach to find earthquake response of
structures using waves or vibration mode shapes. This
method comes under linear dynamic analysis. This method is
usually used in conjunction with a response spectrum. The
mathematical principles of oscillations in n-degree of
freedom systems were adopted from Rayleigh theories. The
structures response is determined by mass and stiffness
distributions. The stiff building will experience low
accelerations relative to the ground. Tall buildings accelerate
away from the ground motions.
C.) Time-History Analysis (linear and non-linear):
Time history method of analysis uses appropriate
ground motion and shall be performed using accepted
principle of dynamics. This is the most rational method
available for assessing building performance. There are
computer programs available to perform this type of analysis.
d.) Push over Analysis:
The pushover analysis of a structure is a static non-
linear analysis under permanent vertical loads and gradually
increasing lateral loads. The equivalent static lateral loads
approximately represent earthquake induced forces. A plot of
the total base shear versus top displacement in a structure is
obtained. By this analysis any permanent failure or weakness
can be identified. The analysis is carried out up to failure,
thus it enables determination of collapse load and ductility
capacity. on a building frame, plastic rotation is monitored
and lateral inelastic forces versus displacement response for
the complete structure is analytically computed. This type of
analysis enables us to identify the weakness in the structure.
The decision to retrofit can be taken in such studies.
2. SEISMIC EVALUATION BY PUSHOVER
ANALYSIS
Pushover analysis is performed by subjecting a
structure to a monotonically increasing pattern of lateral
loads, that shows the inertial forces which would be
experienced by the structure when subjected to ground
motion. Under incrementally increasing loads many structural
elements may yield sequentially. Therefore, at each event, the
structure experiences a decrease in stiffness. Using a non-
linear static pushover analysis, a representative non-linear
force displacement relationship can be obtained. A two or
three dimensional model which includes bi-linear or tri-linear
load-deformation diagrams of all lateral force resisting
elements is first created and gravity loads are applied
initially.
A pre-defined lateral load pattern which is
distributed along the building height is then applied. The
lateral forces are increased until some members yield. The
structural model is modified to account for the reduced
stiffness of yielded members and lateral forces are again
increased until additional members yield. The process is
continued until a control displacement at the top of building
reaches a certain level of deformation or structure becomes
unstable.
2.1 Types of Pushover Analysis:
Pushover analysis can be performed as force-
controlled or displacement-controlled. In force-controlled
pushover analysis, full load combination is applied i.e., force-
controlled analysis should be used when the load is known
(such as gravity loading). Also, in force-controlled pushover
analysis some numerical problems that affect the accuracy of
results occur, since target displacement may be associated
with a very small positive or even a negative lateral stiffness
because of the development of mechanisms and P-delta
effects.
Generally, pushover analysis is performed as
displacement-controlled to overcome these problems. In
displacement-controlled procedure, specified drifts are sought
(as in seismic loading) where the magnitude of applied load is
not known in advance. The magnitude of load combination is
increased or decreased as necessary until the control
displacement reaches a specified value. Generally, roof
displacement at the center of mass of structure is chosen as
the control displacement. The internal forces and
deformations computed at the target displacement are used as
estimates of inelastic strength and deformation demands that
have to be compared with available capacities for a
performance check.
2.2 Performance Levels of Building:
Pushover analysis gives an insight into the
maximum base shear that the structure is capable of resisting.
A building performance level is a combination of the
performance levels of the structure and the non-structural
components. A performance level describes a limiting
damage condition for a given building with specific ground
motion. The performances levels as per FEMA, ATC 40 are:
Immediate Occupancy (IO):
Damage is relatively less, the structure retains a
significant portion of its original stiffness. The risk of life
threatening injury as a result of structural damage is very low,
and although some minor structural repairs may be
appropriate, these would generally not be required prior to re
occupancy
Life safety Level (LS):
Substantial damage has occurred to the structure,
and it may have lost a significant amount of its original
stiffness. However, a substantial margin remains for
additional lateral deformation before collapse would occur. It
should be possible to repair the structure; however, for
economic reasons this may not be practical. While the
damaged structure is not an
International Journal of Engineering Research & Technology (IJERT)
IJERT
IJERT
ISSN: 2278-0181
www.ijert.orgIJERTV3IS100082
(This work is licensed under a Creative Commons Attribution 4.0 International License.)
Vol. 3 Issue 10, October- 2014
100

imminent collapse risk, it would be prudent to implement
structural repairs or install temporary bracing prior to re-
occupancy.
Collapse Prevention (CP):
At this level the building has experienced extreme
damage, if laterally deformed beyond this point, the structure
can experience instability and collapse. The structure may not
be technically practical to repair and is not safe for re-
occupancy, as aftershock activity could induce collapse.
2.3 Pushover Curve:
In order to obtain performance points of structure as
well as the location of hinges in different stages of analysis,
we can use the pushover curve. In this curve, the range AB is
the elastic range, B to IO is the range of instant occupancy,
IO to LS being the range of life safety and LS to CP being the
range of collapse prevention
When a hinge touches point C on its force-
displacement curve then that hinge must start to drop load.
The load will be released until the pushover force or base
shear at point C becomes equal to the force at point D.
As the force is released, all of the elements unload
as well as the displacement is decreased .After the yielded
hinge touches the point D force level, the magnitude of
pushover force is again amplified and the displacement starts
to increase again.
If all of the hinges are within the given CP limit then
that structure is supposed to be safe. Though, the hinge after
IO range may also be required to be retrofitted depending on
the significance of structure.
Figure 1 Typical Pushover Curve and Performance Levels
2.4 Key Elements of Pushover Analysis:
Defining Plastic Hinges:
In SAP2000, non-linear behavior is assumed to
occur within frame elements at concentrated plastic hinges.
The default types include an uncoupled moment hinges, an
uncoupled axial hinges, an uncoupled shear hinges and a
coupled axial force and biaxial bending moment hinges.
Defining control node:
Control node is the node used to control
displacements of the structure. Its displacement versus the
base-shear forms the capacity (pushover) curve of the
structure. For developing the pushover curve it is important to
consider a force displacement that is equal to the expected
distribution of the inertial forces. Different forces
distributions can be used to represent the earthquake load
intensity.
Estimation of Displacement Demand:
This is a crucial step when using pushover analysis.
The control node is pushed to reach the demand displacement
which represents the maximum expected displacement
resulting from the earthquake intensity under consideration.
Evaluation of the Performance Level:
Performance evaluation is the main objective of a
performance based design. A component or action is
considered satisfactory if it meets a prescribed performance.
The main output of a pushover analysis is in terms of
response demand versus capacity. If the demand curve
intersects the capacity envelope near the elastic range, then
the structure has a good resistance. If the demand curve
intersects the capacity curve with little reserve of strength and
deformation capacity, then it can be concluded that the
structure will behave poorly during the imposed seismic
excitation and need to be retrofitted to avoid future major
damage or collapse.
2.5 Evaluation Procedures:
The procedures for building evaluation are different
from one another but their basic principles are all the same.
The following are the evaluation procedures according to the
respective codes.
ATC 40 – 1996 Capacity Spectrum Method (CSM):
ATC 40 adopts the capacity spectrum method
(CSM) which uses the intersection of capacity (pushover)
curve and a reduced response spectrum to estimate the
maximum displacement. The push over or capacity curve
represents the lateral displacement as a function of the force
applied to the structure. The important assumption is that
inelastic displacement of nonlinear single degree freedom
system will be approximately equal to the maximum elastic
displacement of linear single degree freedom system, whose
damping values are greater than the initial values for those in
non- linear system with in natural time period.
FEMA 356 - 2000 Displacement Coefficient Method (DCM):
FEMA 356 adopts the displacement coefficient
method that uses pushover analysis and a modified version of
the equal displacement approximation to estimate maximum
displacement. The DCM is based on the statistical analysis of
the results obtained by the time history analysis of SDOF
oscillators of various types. The results from various analyses
indicate that the capacity spectrum method underestimates
the response of the structure in inelastic range while the
displacement coefficient method yields reasonable values in
most cases.
FEMA 440 - 2005 Equivalent Linearization-Modified CSM:
In equivalent linearization method, the inelastic
equivalent single degree of freedom system will be converted
to its equivalent elastic single degree of freedom. In
Equivalent Linearization method equivalent period and
International Journal of Engineering Research & Technology (IJERT)
IJERT
IJERT
ISSN: 2278-0181
www.ijert.orgIJERTV3IS100082
(This work is licensed under a Creative Commons Attribution 4.0 International License.)
Vol. 3 Issue 10, October- 2014
101
damping is defined in a way that inelastic displacement is
nearly close to the elastic displacement of equivalent system.
The assumption in capacity spectrum method that the
equivalent stiffness of inelastic system will be the same as its
secant stiffness is not used here. Instead, the equivalent
stiffness is obtained effective from time period and damping
properties derived using equations from statistical analyses.
FEMA 440 - 2005 Displacement Modification- Improvement
of DCM:
In FEMA 440 Displacement Modification, several
improvements to the displacement coefficient procedures in
FEMA 356 are made. They relate to the coefficient of target
displacement which is used for estimating the maximum
inelastic global deformation demands of buildings for earth
quake ground motions. The improvement for the angular
displacement coefficient method uses advanced equations for
different coefficients.
3. MODELING AND ANALYSIS OF STRUCTURE
3.1 Brief overview:
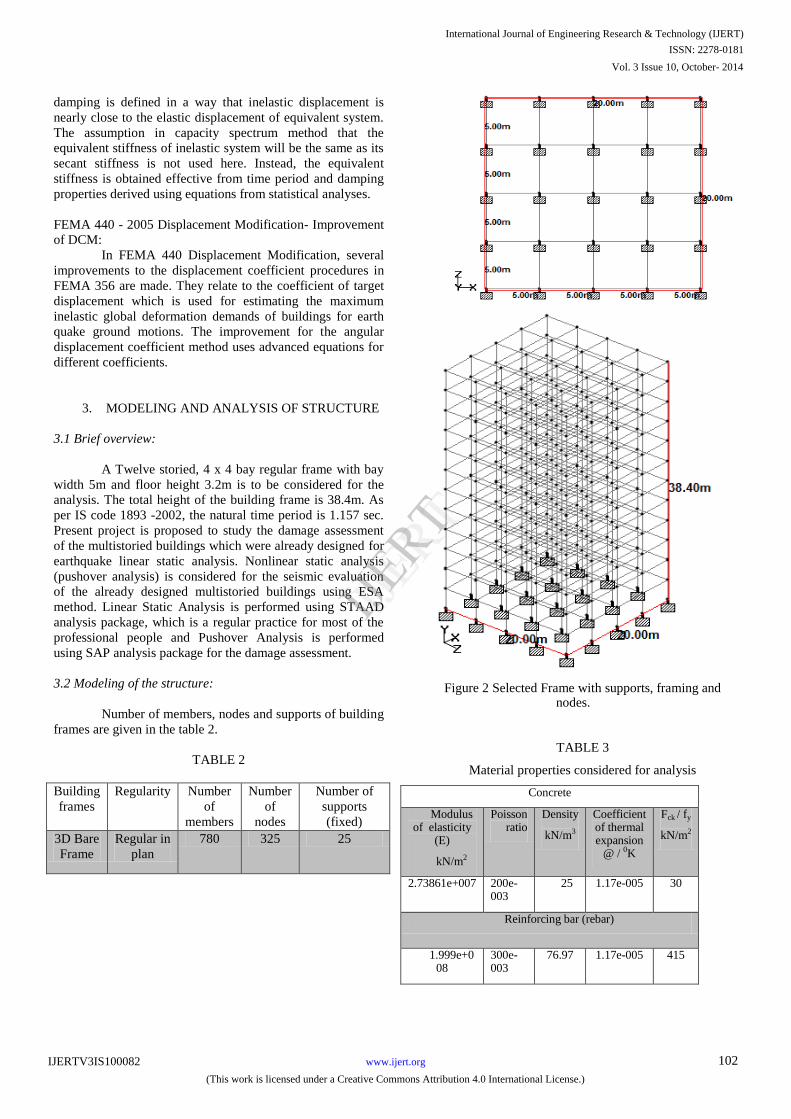
A Twelve storied, 4 x 4 bay regular frame with bay
width 5m and floor height 3.2m is to be considered for the
analysis. The total height of the building frame is 38.4m. As
per IS code 1893 -2002, the natural time period is 1.157 sec.
Present project is proposed to study the damage assessment
of the multistoried buildings which were already designed for
earthquake linear static analysis. Nonlinear static analysis
(pushover analysis) is considered for the seismic evaluation
of the already designed multistoried buildings using ESA
method. Linear Static Analysis is performed using STAAD
analysis package, which is a regular practice for most of the
professional people and Pushover Analysis is performed
using SAP analysis package for the damage assessment.
3.2 Modeling of the structure:
Number of members, nodes and supports of building
frames are given in the table 2.
TABLE 2
Building
frames
Regularity Number
of
members
Number
of
nodes
Number of
supports
(fixed)
3D Bare
Frame
Regular in
plan
780 325 25
Figure 2 Selected Frame with supports, framing and nodes.
TABLE 3
Material properties considered for analysis
Concrete
Modulus of elasticity
(E)
kN/m2
Poisson ratio
Density
kN/m3
Coefficient of thermal expansion
@ / 0K
Fck / fy
kN/m2
2.73861e+007 200e-003
25 1.17e-005 30
Reinforcing bar (rebar)
1.999e+008
300e-003
76.97 1.17e-005 415
International Journal of Engineering Research & Technology (IJERT)
IJERT
IJERT
ISSN: 2278-0181
www.ijert.orgIJERTV3IS100082
(This work is licensed under a Creative Commons Attribution 4.0 International License.)
Vol. 3 Issue 10, October- 2014
102
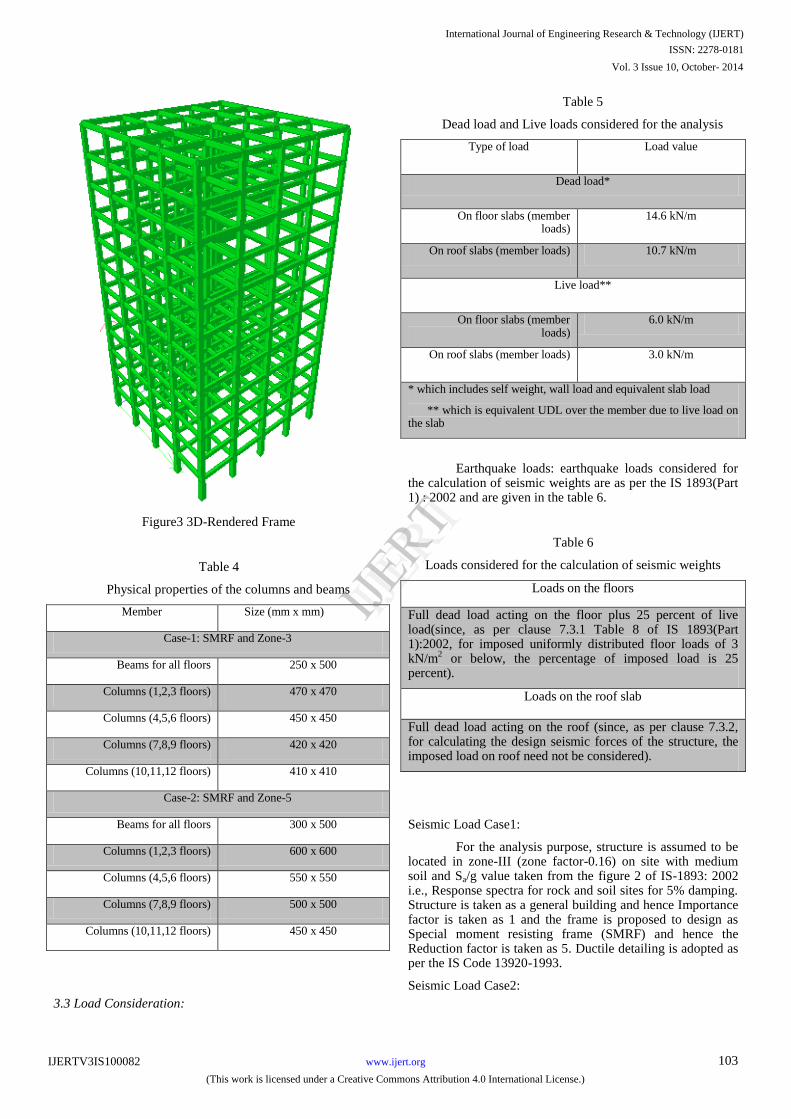
Figure3 3D-Rendered Frame
Table 4
Physical properties of the columns and beams
Member Size (mm x mm)
Case-1: SMRF and Zone-3
Beams for all floors 250 x 500
Columns (1,2,3 floors) 470 x 470
Columns (4,5,6 floors) 450 x 450
Columns (7,8,9 floors) 420 x 420
Columns (10,11,12 floors) 410 x 410
Case-2: SMRF and Zone-5
Beams for all floors 300 x 500
Columns (1,2,3 floors) 600 x 600
Columns (4,5,6 floors) 550 x 550
Columns (7,8,9 floors) 500 x 500
Columns (10,11,12 floors) 450 x 450
3.3 Load Consideration:
Table 5
Dead load and Live loads considered for the analysis
Type of load Load value
Dead load*
On floor slabs (member loads)
14.6 kN/m
On roof slabs (member loads) 10.7 kN/m
Live load**
On floor slabs (member loads)
6.0 kN/m
On roof slabs (member loads) 3.0 kN/m
* which includes self weight, wall load and equivalent slab load
** which is equivalent UDL over the member due to live load on the slab
Earthquake loads: earthquake loads considered for the calculation of seismic weights are as per the IS 1893(Part 1) : 2002 and are given in the table 6.
Table 6
Loads considered for the calculation of seismic weights
Loads on the floors
Full dead load acting on the floor plus 25 percent of live load(since, as per clause 7.3.1 Table 8 of IS 1893(Part 1):2002, for imposed uniformly distributed floor loads of 3 kN/m
2 or below, the percentage of imposed load is 25
percent).
Loads on the roof slab
Full dead load acting on the roof (since, as per clause 7.3.2, for calculating the design seismic forces of the structure, the imposed load on roof need not be considered).
Seismic Load Case1:
For the analysis purpose, structure is assumed to be located in zone-III (zone factor-0.16) on site with medium soil and Sa/g value taken from the figure 2 of IS-1893: 2002 i.e., Response spectra for rock and soil sites for 5% damping. Structure is taken as a general building and hence Importance factor is taken as 1 and the frame is proposed to design as Special moment resisting frame (SMRF) and hence the Reduction factor is taken as 5. Ductile detailing is adopted as per the IS Code 13920-1993.
Seismic Load Case2:
International Journal of Engineering Research & Technology (IJERT)
IJERT
IJERT
ISSN: 2278-0181
www.ijert.orgIJERTV3IS100082
(This work is licensed under a Creative Commons Attribution 4.0 International License.)
Vol. 3 Issue 10, October- 2014
103
For the analysis purpose, structure is assumed to be located in zone-II (zone factor-0.36) on site with medium soil and Sa/g value taken from the figure 2 of IS-1893: 2002 i.e., Response spectra for rock and soil sites for 5% damping. Structure is taken as general building and hence Importance factor is taken as 1 and the frame is proposed to design as Special moment resisting frame (SMRF) and hence the Reduction factor is taken as 5. Ductile detailing is adopted is as per the IS Code 13920 -1993.
3.4 Load Combinations and Envelope:
Earthquake load combination is only considered for the analysis.
TABLE 7
LOAD ENVELOPE
Envelope
1.0DL+1.0LL 0.9DL+1.5(-ELx)
1.5DL+1.5LL 0.9DL+1.5(ELz)
1.5DL+1.5(ELx) 0.9DL+1.5(-ELz)
1.5DL+1.5(-ELx) 1.2DL+1.2LL+1.2(ELx)
1.5DL+1.5(ELz) 1.2DL+1.2LL+1.2(-ELx)
1.5DL+1.5(-ELz) 1.2DL+1.2LL+1.2(ELz)
0.9DL+1.5(ELx) 1.2DL+1.2LL+1.2(-ELz)
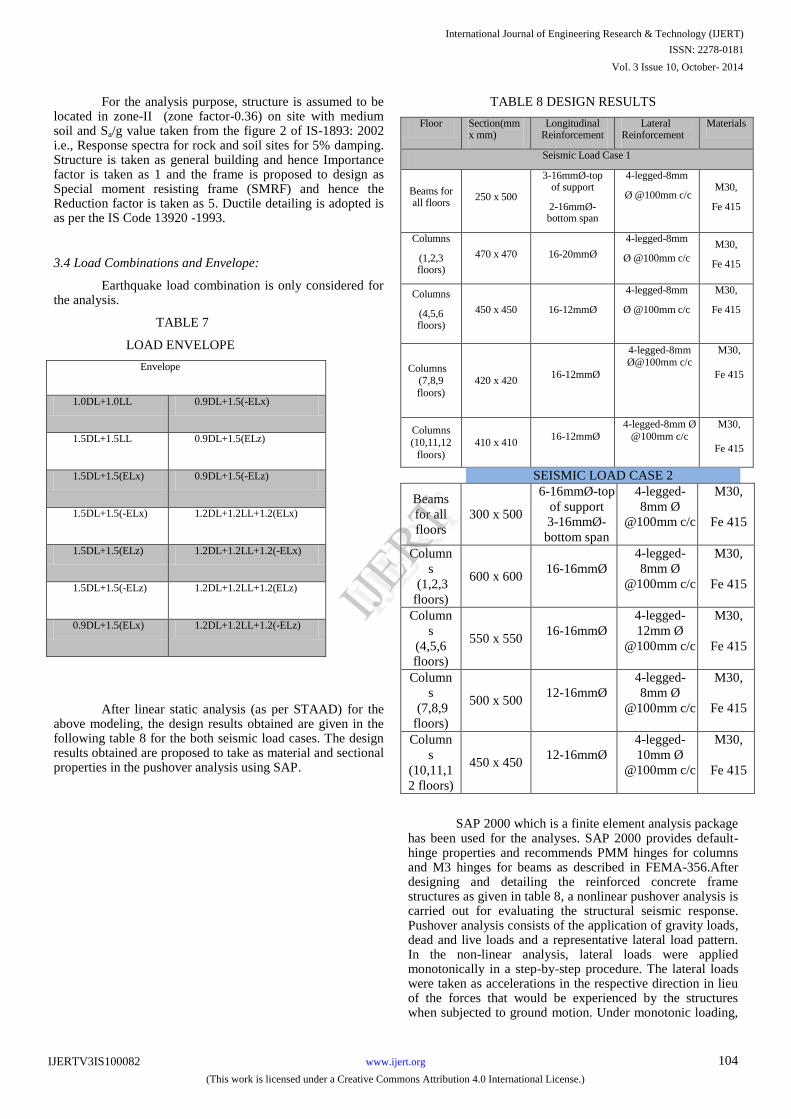
After linear static analysis (as per STAAD) for the above modeling, the design results obtained are given in the following table 8 for the both seismic load cases. The design results obtained are proposed to take as material and sectional properties in the pushover analysis using SAP.
TABLE 8 DESIGN RESULTS
Floor Section(mm x mm)
Longitudinal Reinforcement
Lateral Reinforcement
Materials
Seismic Load Case 1
Beams for all floors
250 x 500
3-16mmØ-top of support
2-16mmØ-bottom span
4-legged-8mm
Ø @100mm c/c M30,
Fe 415
Columns
(1,2,3 floors)
470 x 470 16-20mmØ
4-legged-8mm
Ø @100mm c/c
M30,
Fe 415
Columns
(4,5,6 floors)
450 x 450 16-12mmØ
4-legged-8mm
Ø @100mm c/c
M30,
Fe 415
Columns (7,8,9
floors)
420 x 420 16-12mmØ
4-legged-8mm Ø@100mm c/c
M30,
Fe 415
Columns
(10,11,12
floors)
410 x 410 16-12mmØ
4-legged-8mm Ø
@100mm c/c
M30,
Fe 415
SEISMIC LOAD CASE 2
Beams
for all
floors
300 x 500
6-16mmØ-top
of support
3-16mmØ-
bottom span
4-legged-
8mm Ø
@100mm c/c
M30,
Fe 415
Column
s
(1,2,3
floors)
600 x 600 16-16mmØ
4-legged-
8mm Ø
@100mm c/c
M30,
Fe 415
Column
s
(4,5,6
floors)
550 x 550 16-16mmØ
4-legged-
12mm Ø
@100mm c/c
M30,
Fe 415
Column
s
(7,8,9
floors)
500 x 500 12-16mmØ
4-legged-
8mm Ø
@100mm c/c
M30,
Fe 415
Column
s
(10,11,1
2 floors)
450 x 450 12-16mmØ
4-legged-
10mm Ø
@100mm c/c
M30,
Fe 415
SAP 2000 which is a finite element analysis package has been used for the analyses. SAP 2000 provides default-hinge properties and recommends PMM hinges for columns and M3 hinges for beams as described in FEMA-356.After designing and detailing the reinforced concrete frame structures as given in table 8, a nonlinear pushover analysis is carried out for evaluating the structural seismic response. Pushover analysis consists of the application of gravity loads, dead and live loads and a representative lateral load pattern. In the non-linear analysis, lateral loads were applied monotonically in a step-by-step procedure. The lateral loads were taken as accelerations in the respective direction in lieu of the forces that would be experienced by the structures when subjected to ground motion. Under monotonic loading,
International Journal of Engineering Research & Technology (IJERT)
IJERT
IJERT
ISSN: 2278-0181
www.ijert.orgIJERTV3IS100082
(This work is licensed under a Creative Commons Attribution 4.0 International License.)
Vol. 3 Issue 10, October- 2014
104
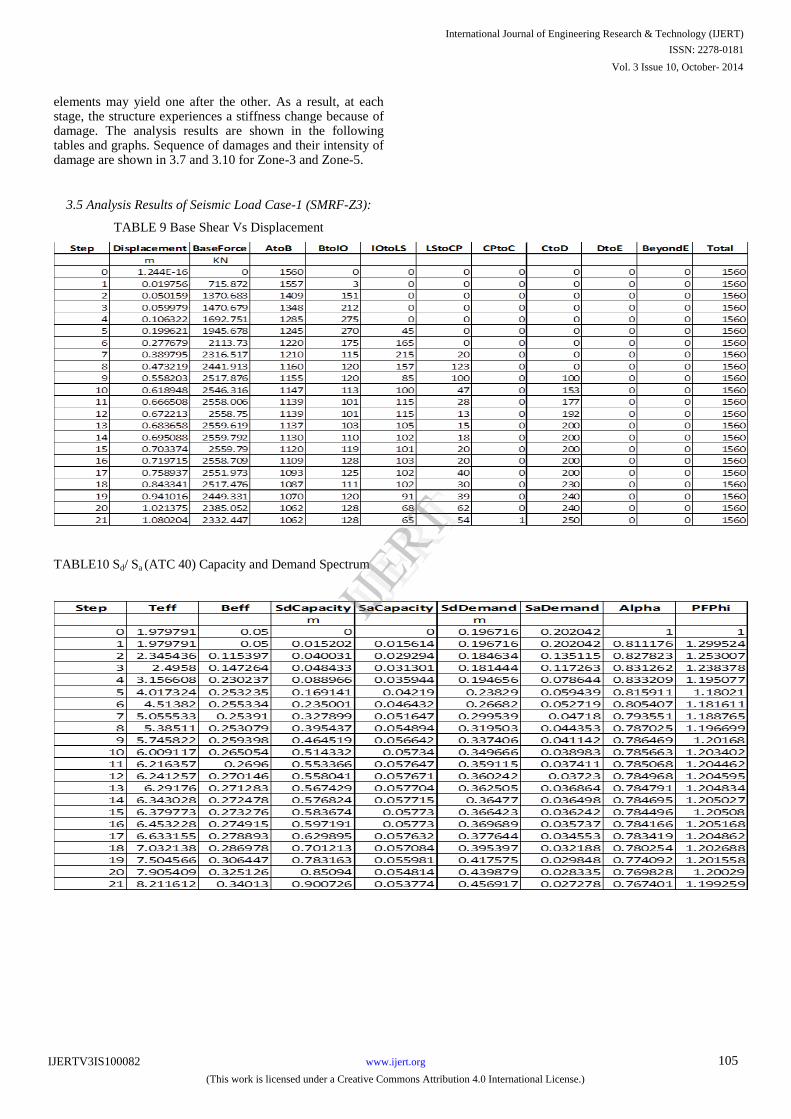
elements may yield one after the other. As a result, at each stage, the structure experiences a stiffness change because of damage. The analysis results are shown in the following tables and graphs. Sequence of damages and their intensity of damage are shown in 3.7 and 3.10 for Zone-3 and Zone-5.
3.5 Analysis Results of Seismic Load Case-1 (SMRF-Z3):
TABLE 9 Base Shear Vs Displacement
TABLE10 Sd/ Sa (ATC 40) Capacity and Demand Spectrum
International Journal of Engineering Research & Technology (IJERT)
IJERT
IJERT
ISSN: 2278-0181
www.ijert.orgIJERTV3IS100082
(This work is licensed under a Creative Commons Attribution 4.0 International License.)
Vol. 3 Issue 10, October- 2014
105
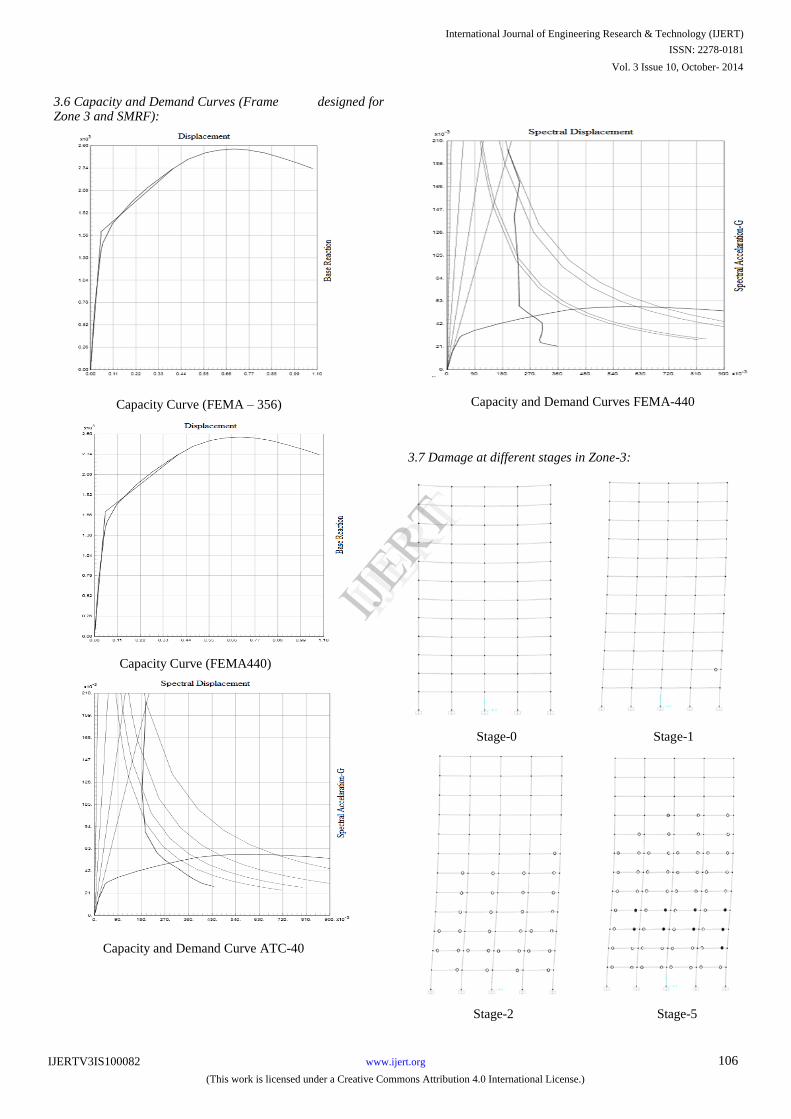
3.6 Capacity and Demand Curves (Frame designed for Zone 3 and SMRF):
Capacity Curve (FEMA – 356)
Capacity Curve (FEMA440)
Capacity and Demand Curve ATC-40
Capacity and Demand Curves FEMA-440
3.7 Damage at different stages in Zone-3:
Stage-0 Stage-1
Stage-2 Stage-5
International Journal of Engineering Research & Technology (IJERT)
IJERT
IJERT
ISSN: 2278-0181
www.ijert.orgIJERTV3IS100082
(This work is licensed under a Creative Commons Attribution 4.0 International License.)
Vol. 3 Issue 10, October- 2014
106
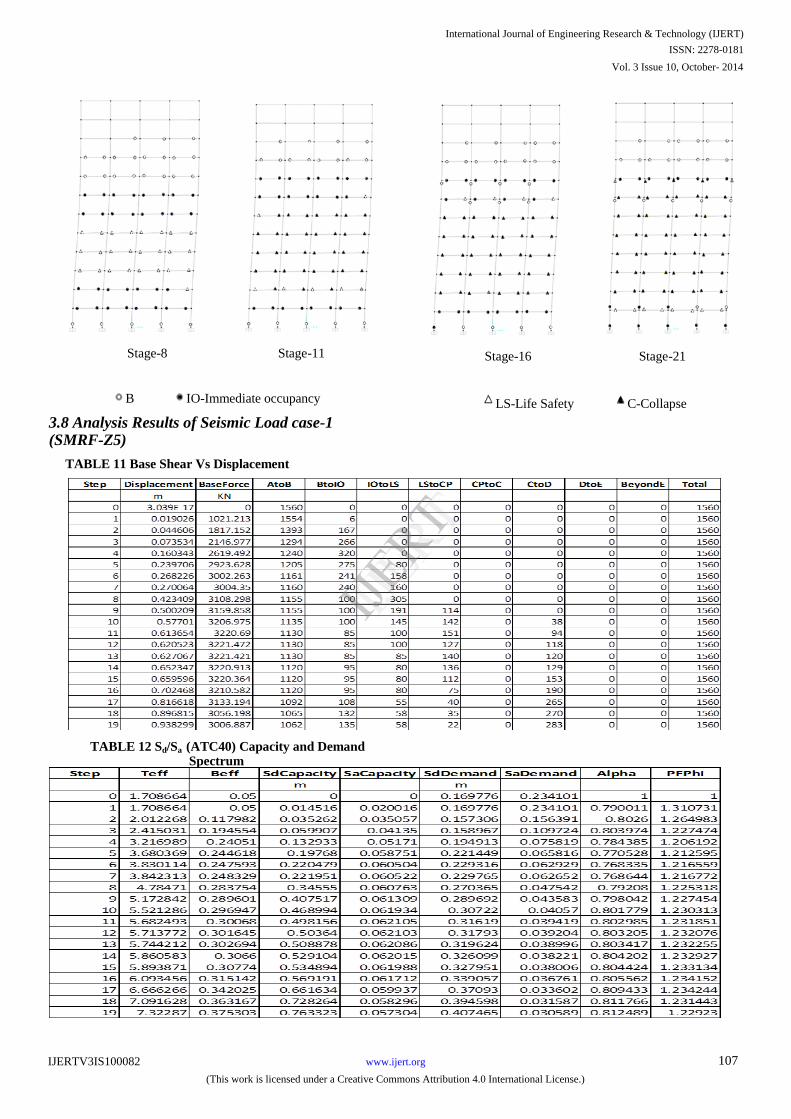
Stage-8 Stage-11
B IO-Immediate occupancy
3.8 Analysis Results of Seismic Load case-1 (SMRF-Z5)
TABLE 11 Base Shear Vs Displacement
TABLE 12 Sd/Sa (ATC40) Capacity and Demand Spectrum
Stage-16 Stage-21
LS-Life Safety C-Collapse
International Journal of Engineering Research & Technology (IJERT)
IJERT
IJERT
ISSN: 2278-0181
www.ijert.orgIJERTV3IS100082
(This work is licensed under a Creative Commons Attribution 4.0 International License.)
Vol. 3 Issue 10, October- 2014
107
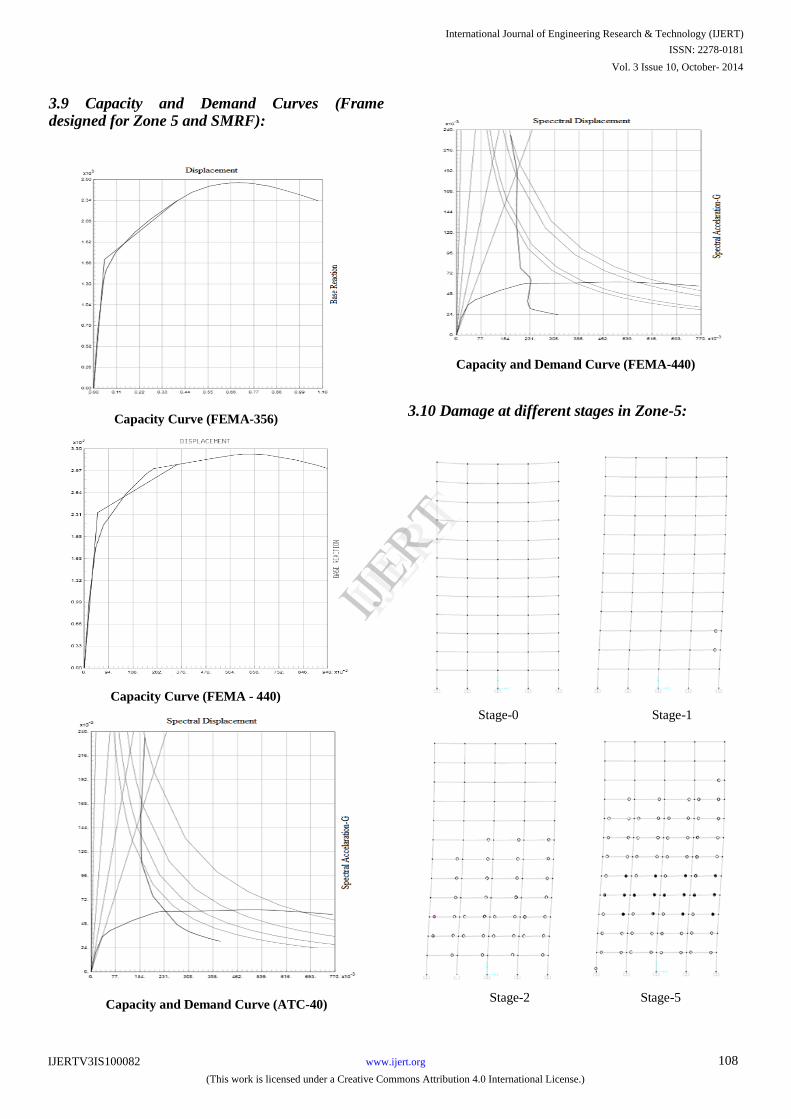
3.9 Capacity and Demand Curves (Frame designed for Zone 5 and SMRF):
Capacity Curve (FEMA-356)
Capacity Curve (FEMA - 440)
Capacity and Demand Curve (ATC-40)
Capacity and Demand Curve (FEMA-440)
3.10 Damage at different stages in Zone-5:
Stage-0 Stage-1
Stage-2 Stage-5
International Journal of Engineering Research & Technology (IJERT)
IJERT
IJERT
ISSN: 2278-0181
www.ijert.orgIJERTV3IS100082
(This work is licensed under a Creative Commons Attribution 4.0 International License.)
Vol. 3 Issue 10, October- 2014
108
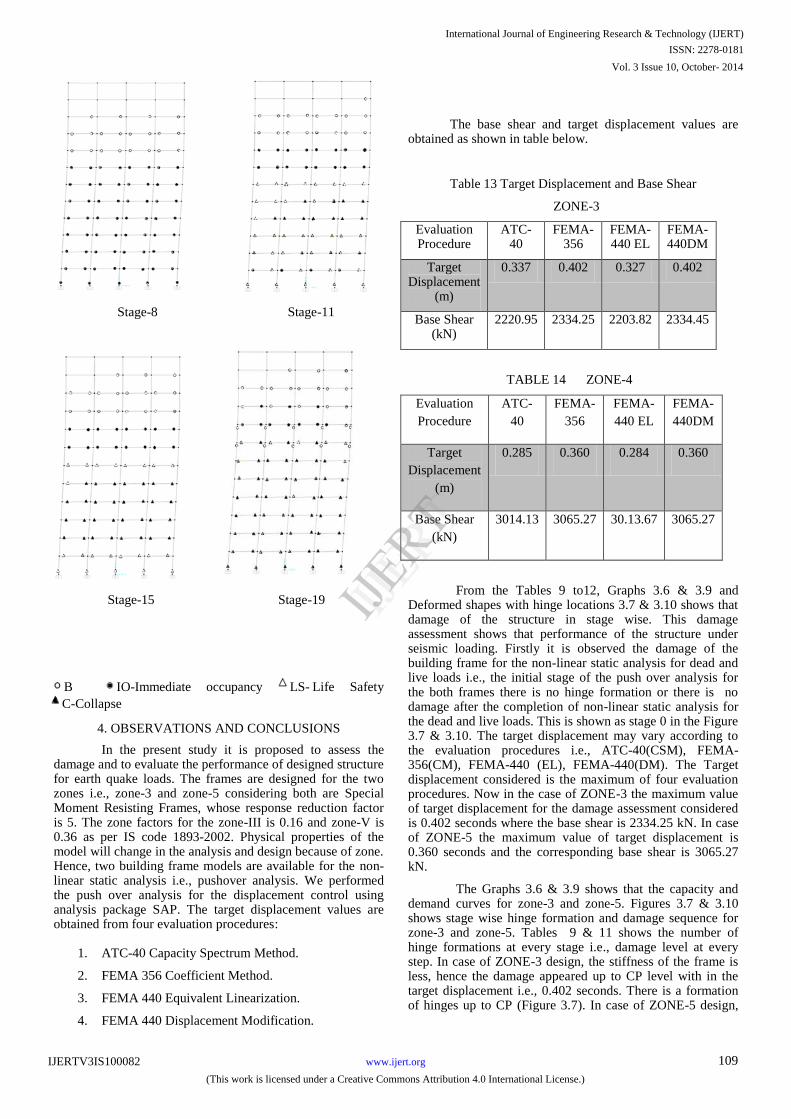
B IO-Immediate occupancy LS- Life Safety
C-Collapse
4. OBSERVATIONS AND CONCLUSIONS
In the present study it is proposed to assess
the damage and to evaluate the performance of designed structure
for earth quake loads. The frames are designed for the two zones i.e., zone-3 and zone-5 considering both are Special Moment Resisting Frames, whose response reduction factor is 5. The zone factors for the zone-III is 0.16 and
zone-V is 0.36 as per IS code 1893-2002. Physical properties of the model will change in the analysis and design because of zone. Hence, two building frame models are available for the non-linear static analysis i.e., pushover analysis. We performed the push over analysis for the displacement control using analysis package SAP. The target displacement values are obtained from four evaluation procedures:
1.
ATC-40 Capacity Spectrum Method.
2.
FEMA 356 Coefficient Method.
3.
FEMA 440 Equivalent Linearization.
4.
FEMA 440 Displacement Modification.
The base shear and target displacement values are obtained as shown in table below.
Table 13 Target Displacement and Base Shear
ZONE-3
Evaluation Procedure
ATC-40
FEMA-356
FEMA-440 EL
FEMA-440DM
Target Displacement
(m)
0.337 0.402 0.327 0.402
Base Shear (kN)
2220.95 2334.25 2203.82 2334.45
TABLE 14 ZONE-4
Evaluation
Procedure
ATC-
40
FEMA-
356
FEMA-
440 EL
FEMA-
440DM
Target
Displacement
(m)
0.285 0.360 0.284 0.360
Base Shear
(kN)
3014.13 3065.27 30.13.67 3065.27
From the Tables 9 to12, Graphs 3.6 & 3.9 and Deformed shapes with hinge locations 3.7 & 3.10 shows that damage of the structure in stage wise. This damage assessment shows that performance of the structure under seismic loading. Firstly it is observed the damage of the building frame for the non-linear static analysis for dead and live loads i.e., the initial stage of the push over analysis for the both frames there is no hinge formation or there is no damage after the completion of non-linear static analysis for the dead and live loads. This is shown as stage 0 in the Figure 3.7 & 3.10. The target displacement may vary according to the evaluation procedures i.e., ATC-40(CSM), FEMA-356(CM), FEMA-440 (EL), FEMA-440(DM). The Target displacement considered is the maximum of four evaluation procedures. Now in the case of ZONE-3 the maximum value of target displacement for the damage assessment considered is 0.402 seconds where the base shear is 2334.25 kN. In case of ZONE-5 the maximum value of target displacement is 0.360 seconds and the corresponding base shear is 3065.27 kN.
The Graphs 3.6 & 3.9 shows that the capacity and demand curves for zone-3 and zone-5. Figures 3.7 & 3.10 shows stage wise hinge formation and damage sequence for zone-3 and zone-5. Tables 9 & 11 shows the number of hinge formations at every stage i.e., damage level at every step. In case of ZONE-3 design, the stiffness of the frame is less, hence the damage appeared up to CP level with in the target displacement i.e., 0.402 seconds. There is a formation of hinges up to CP (Figure 3.7). In case of ZONE-5 design,
Stage-8 Stage-11
Stage-15 Stage-19
International Journal of Engineering Research & Technology (IJERT)
IJERT
IJERT
ISSN: 2278-0181
www.ijert.orgIJERTV3IS100082
(This work is licensed under a Creative Commons Attribution 4.0 International License.)
Vol. 3 Issue 10, October- 2014
109
the stiffness of the frame is higher than in ZONE 3 frame, hence the damage appeared up to LS level with in the target displacement i.e., 0.360 seconds (Figure 3.10). Finally both the frames which were designed to linear static analysis for earth quake loading performed well. The damage is within the limits and it is observed by conducting the push over analysis. Initially, the yielding of the beams takes place and then yielding of columns. This shows that the analysis theory is based on the strong column and weak beam i.e., both the frames behaving as ductile frames
5. FUTURE SCOPE OF WORK
Pushover analysis is an efficient method to
understand the performance of the structure during earthquakes; however, it is not a dynamic phenomenon and lacks accuracy. This may not consider all the deformation within the structure. To know the complete behavior of the structure from initial stage to collapse stage, knowledge of non-linear analysis for the numerical modals using Finite Element Method (FEM) and Applied Element Method (AEM) is most essential.
6. REFERENCES
[1] IS 1893 (part-1): 2002. Indian Standard criteria for earthquake
resistant design of structures [2] Method of Analysis. Midas Gen – One stop solution for building
and general structure, page no 7. [3] FEMA 356-Prestandard and commentary for the seismic
rehabilitation of buildings. [4] ATC 40-Seismic evaluation and retrofit of concrete buildings. [5] SAP 2000-Structural analysis program. [6] FEMA440-Equivalent linearization Method. Improvement of non-
linear static analysis procedures. [7] FEMA440-Displacement modification. Improvement of non-linear
static analysis procedures. [8] IS 456:2000.Plain and reinforced concrete. [9] IS 13920:1993.Ductile detailing of reinforced concrete structures
subjected to seismic forces. [10] STAAD-Structural Analysis and design engineering software. [11] Chung- Yue Wang and Shaing-Yung Ho. Pushover Analysis for
Structure Containing RC Walls. The 2nd International Conference on Urban Disaster Reduction, Taipei, Taiwan. November, 27-29, 2007.
[12] Konuralp Girgin and Kutlu Darılmaz. Seismic Response of Infilled Framed Buildings Using Pushover Analysis. Department of Civil Engineering, Istanbul Technical University, 34469, Maslak, Istanbul, Turkey. VOLUME 54, NUMBER 5. 5 December 2007.
[13] A.Kadid., Boumrkik A. (2008): Pushover Analysis of Reinforced Concrete FrameStructures, Asian Journal of Civil Engineering (Building and Housing) Vol. 9, No.1
[14] Mehmet Inel, Hayri Baytan Ozmen. Effects of plastic hinge properties in nonlinear analysis of reinforced concrete buildings. Department of Civil Engineering, Pamukkale University, 20070 Denizli, Turkey. Available online 30 March 2006.
[15] Griffith M. C., Pinto A. V. (2000):“Seismic Retrofit of RC Buildings - A Review and Case Study”, University of Adelaide, Adelaide, Australia and European Commission,Joint Research Centre, Ispra Italy
[16] Faella C., Martinelli E., Nigro E. (2002): Steel and concrete composite beams with flexible shear connection: “exact” analytical expression of the stiffness matrix and applications, Computers & Structures - COMPUT STRUCT, vol. 80, no. 11, pp. 1001-1009, 2002
[17] SERMİN OĞUZ (April 2005) Master of Science Thesis, The Graduate School of Naturaland Applied Sciences of Middle East Technical University.
[18] Rai, Durgesh C. (2005): “Seismic Evaluation and Strengthening of Existing Buildings”IIT Kanpur and Gujarat State Disaster Mitigation Authority.
International Journal of Engineering Research & Technology (IJERT)
IJERT
IJERT
ISSN: 2278-0181
www.ijert.orgIJERTV3IS100082
(This work is licensed under a Creative Commons Attribution 4.0 International License.)
Vol. 3 Issue 10, October- 2014
110