Embed Size (px)
Citation preview
IJRET: International Journal of Research in Engineering and Technology eISSN: 2319-1163 | pISSN: 2321-7308
_______________________________________________________________________________________
Volume: 03 Issue: 12 | Dec-2014, Available @ http://www.ijret.org 80
DAMAGE DETECTION IN CFRP PLATES BY MEANS OF
NUMERICAL MODELING OF LAMB WAVES PROPAGATION
Grzegorz Knor1
1Institute of Fundamental Technological Research Polish Academy of Sciences, Warsaw, Poland
Abstract The paper presents an application of modeling acoustic waves propagation in a carbon fiber reinforced plastic (CFRP) plates for
damage detection. This task is a part of non-destructive testing (NDT) methods which are very important in many industry
branches. Propagation of Lamb waves is modeled using three-dimensional finite element method by means of commercial
software. In the paper three different cases of plate structures with and without flaws are considered to present review of selected
methods for the detection of defects in time and frequency domain. These are comparisons of: A-scans, B-scans, dispersion
curves, spectrograms, scalograms and energy plots. Developed numerical model first has been validated by means of analytical solution for isotropic plate.
Keywords: Lamb waves, non-destructive testing, finite element method, damage detection
--------------------------------------------------------------------***----------------------------------------------------------------------
1. INTRODUCTION
Many of construction elements are made of composite
materials (e.g. plane's wings, components of cars
coachwork, boats, wind turbines blades [1]) and because of
importance of these elements they must be tested by means of NDT techniques during manufacturing and exploitation.
The main reason to do that is to ensure the reliability of the
whole constructions made of CFRP materials. One of the
ways to detect flaws in plate structures are techniques based
on so called Lamb wave propagation [2]. The mathematical
background for this phenomenon was developed by Horace
Lamb in 1917 [3] and since 1980s Lamb waves have been
successfully used in Structural Health Monitoring and
Nondestructive evaluation [4]. Theoretical models and
experimental methods are still being developed mainly
because of their advantages. In his classical paper Lamb
developed only equations for waves propagation in isotropic objects of simplified geometries [3]. CFRP belongs to a
class of anisotropic materials and very often structures made
of it have complicated geometry (curved shape, presence of
stiffeners or joints). Due to the complexity there is no
analytical solution in such cases. Moreover these
phenomena become more complex with the presence of a
flaw, because defects in a structure interfere with
propagating waves. To deal with these problems many
algorithms have therefore been developed for the effective
damage detection with the aid of advanced signal processing
and identification approaches [4], viz. Fourier transform, wavelet analysis, dispersion curves, A and B-scans
comparisons, etc. Furthermore due to lack of the analytical
solution for a better understanding of Lamb waves
phenomena in layered materials there is need to develop
accurate numerical models. A number of different numerical
computational techniques have been developed and can be
used for this type of analysis bearing in mind their
limitations. For example according to the literature
following algorithms can be used: finite difference method
(FDM) [5], finite element method (FEM) [6], finite strip
method (FSM) [7], boundary element method (BEM) [8],
global matrix approach [9], spectral element method (SEM) [10], mass-spring lattice model [11]. The most commonly
used technique seems to be a higher order FEM, which
utilizes Lagrangian shape functions on a Gauss-Lobatto-
Legendre grid (it is called spectral-element method in the
literature). But SEM is also limited. For example algorithm
developed by Ostachowicz et.al. [10] gives very good
approximation only for fundamental modes of Lamb waves.
For example for a 1mm thick plate made of aluminum alloy
both the s0 and a0 modes can be well represented in the
frequency range up to about 500 kHz, which constitutes the
upper limit of practical application of the Reissner–Mindlin
theory [10]. In this paper standard FEM is used because of its versatility and wide availability of both commercial and
free software. The advantages of FEM include the ability to
study Lamb wave propagation almost in any kind of the
structure including geometry inhomogeneities, defects, etc.
But main limitation of this method is long calculation time
and also FEM puts a heavy workload on the CPU and
memory. Problems increases with frequency increment
(frequencies are in hundreds of kilohertz range [12]),
because sampling step in space should be not greater than
20λ (λ is a wave lengths) [13] and sampling step in time
should satisfy Nyquist-Shannon sampling theorem [14].
2. MATHEMATICAL BACKGROUND
The wave propagation in stress-free isotropic and
anisotropic bulk media can be adequately described using
theory based on linear stress-strain relationships. The stress
equation of motion [15]:
iijij uf , (1)
IJRET: International Journal of Research in Engineering and Technology eISSN: 2319-1163 | pISSN: 2321-7308
_______________________________________________________________________________________
Volume: 03 Issue: 12 | Dec-2014, Available @ http://www.ijret.org 81
Hooke’s law:
klijklij C (2)
And linear strain-displacement relationship:
)(2
1,, ijjiij uu (3)
where σ is the Cauchy stress tensor, ε is the Cauchy strain
tensor, ρ is the material density, u is the displacement, f is a
vector of the external force, C is fourth-order stiffness tensor
and two dots over a letter denote the second order derivative
with respect to time. Einstein summation convention and a
comma derivative notation are used. Combining the Eqs. 1-3
one can write the following system of equations:
ijlkijkl uuC , (4)
Differential equations of motion given by Eq. 4 with associated boundary conditions can be solved analytically
only for limited number of cases. On the whole the
geometry, boundary conditions and potential defects
complicate the situation, that the only possible solution is to
use the numerical model. One of the example where a semi-
analytical solution exists is the propagation of Lamb waves
in thin isotropic plate (for example made of aluminum). In
this case the elastic oscillations are described by the
Rayleigh-Lamb equations:
1
222
24
)tan(
)tan(
qk
pqk
qd
pd (5)
where:
2
2
22 k
cp
L
(6)
And
2
2
22 k
cq
T
(7)
k is the wave number, ω is the angular frequency, cL is the
longitudinal phase velocity, cT is the shear phase velocity
and d is a half thickness of the plate. Eq. 5 can be solved by
means of numerical software according to the algorithm
proposed in [15]. The solution of Eq. 5 is the dispersion
relation between the wave number and angular frequency.
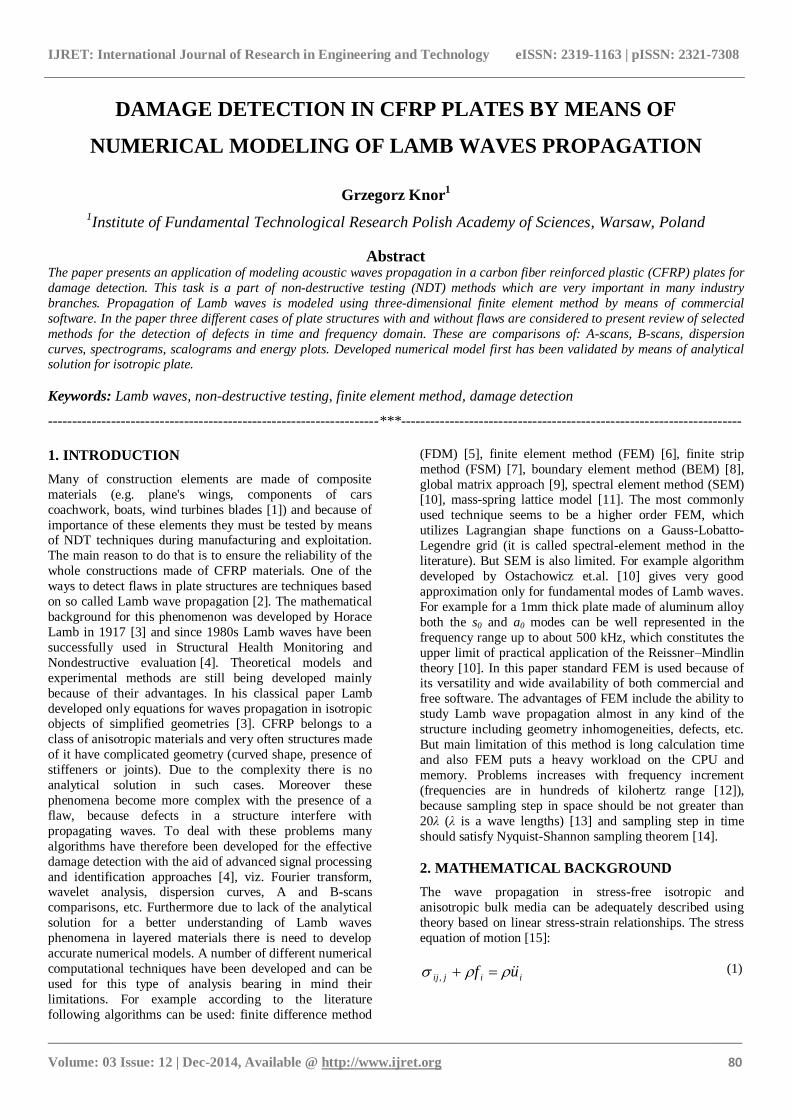
Fig. 1 presents dispersion curves (symmetrical modes s0, s1,
s2 and antisymmetric modes: a0, a1) in k-ω representation for
3mm thick aluminum plate. To plot result in more common
than k-ω form one need to perform transformation to fd-vp
representation by calculating the phase velocity vp, which is defined as the following quotient:
k
fv p (8)
Where f = 2πω – frequency and k is a wave number.
3. NUMERICAL MODEL
3.1 Model Details
The plate was modelled by means of Structural Mechanic
Module in COMSOL Multiphysics software as a linear
elastic material. To achieve good numerical accuracy at least
Fig- 1: Calculated dispersion curves (symmetrical and antisymmetric modes) - k-ω representation.
IJRET: International Journal of Research in Engineering and Technology eISSN: 2319-1163 | pISSN: 2321-7308
_______________________________________________________________________________________
Volume: 03 Issue: 12 | Dec-2014, Available @ http://www.ijret.org 82
5 second-order mesh elements per wavelength are required
[16] (some authors propose more rigorous condition [13]).
So the maximum allowed mesh element size becomes:
00
Nf
ch (9)
where c is the local speed of the wave, and N = 5 is the
number of mesh elements per wavelength. Also time step is connected with the accuracy issue and element size. The
relationship between mesh size and time step length is
known as the Courant–Friedrichs–Lewy condition [17] and
it can be expressed as:
htcCFL (10)
where Δt is the time step and h is the mesh size. In practice, with second order mesh elements, a CFL number of 0.2 is
chosen as optimal. In discussed simulation time step Δt is
equal 100ns and it makes that CFL condition is satisfied. As
excitation sinusoidal signals with a rectangular window or
Hanning window are usually used in nondestructive
evaluation and structural health monitoring. These signals
are usually called a tone burst. In this paper a 3-cycle tone
burst at 200 kHz center-frequency is used. The Nc cycle
Hanning windowed tone burst at given frequency can be
expressed as:
tN
ttf
c0
0 sincos15.0)(
(11)
for time in the range of:
0,0 fNt c (12)
Where: f0 – center frequency, Nc – number of cycles, ω0 –
center angular frequency, t – time.
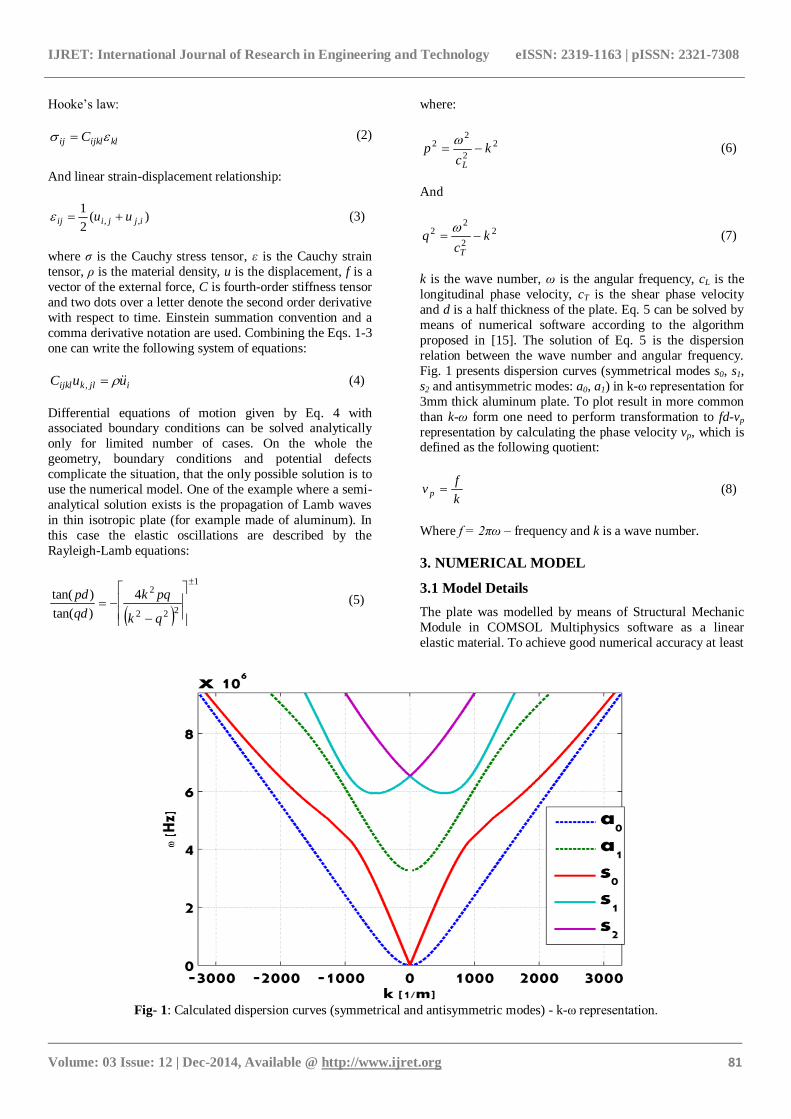
Another remark refers to the excitation of a plate. In this work the properties of transmitter are ignored and
interaction between transmitter and plate are modeled as
surface load and distributed over the area of transmitter form
of Gaussian distribution in this case is as follows:
using Gaussian distribution (see Fig. 2). The mathematical
Fig - 2: Schematic representation of the transmitter and emitted beam
2
__
_5.0exp)(
widthpulseload
positionloadxxg (13)
By multiplying surface tone burst (given by Eq. 11) by
function g in two directions (e.g. x and y) one can obtain
desired pulse. For completeness of description it should be
added that all boundary condition were set to free. It means
that there are no constraints and no loads (except surface
covered by the transmitter) acting on the boundary. And all
initial values (displacements and velocities) were set to 0.
3.2 Model Validation
As it was mentioned the implemented model was validated
by means of analytical solution for thin isotropic plate. The
thickness of the plate was 3mm and for the purposes of calculations the material constants for aluminum were
adopted. The results of FEM calculation can be presented in
many ways. One of it, so called B-scan, is presented in
Fig. 3.
IJRET: International Journal of Research in Engineering and Technology eISSN: 2319-1163 | pISSN: 2321-7308
_______________________________________________________________________________________
Volume: 03 Issue: 12 | Dec-2014, Available @ http://www.ijret.org 83
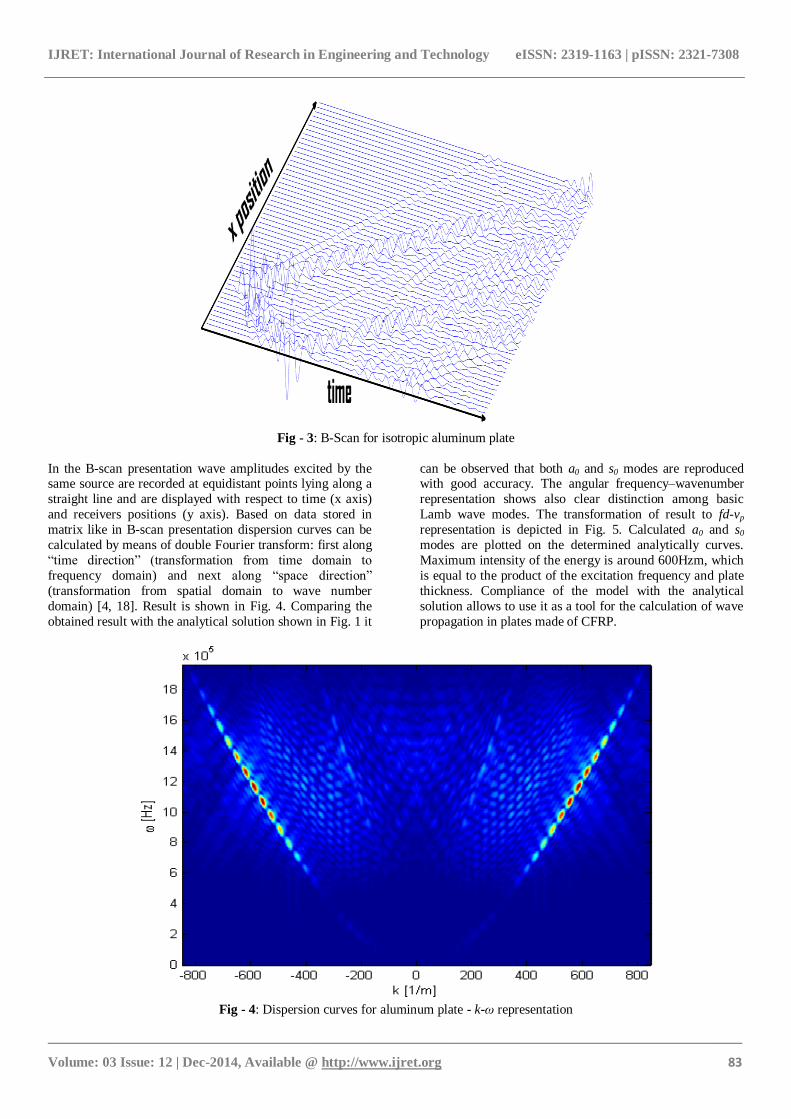
Fig - 3: B-Scan for isotropic aluminum plate
In the B-scan presentation wave amplitudes excited by the same source are recorded at equidistant points lying along a
straight line and are displayed with respect to time (x axis)
and receivers positions (y axis). Based on data stored in
matrix like in B-scan presentation dispersion curves can be
calculated by means of double Fourier transform: first along
“time direction” (transformation from time domain to
frequency domain) and next along “space direction”
(transformation from spatial domain to wave number
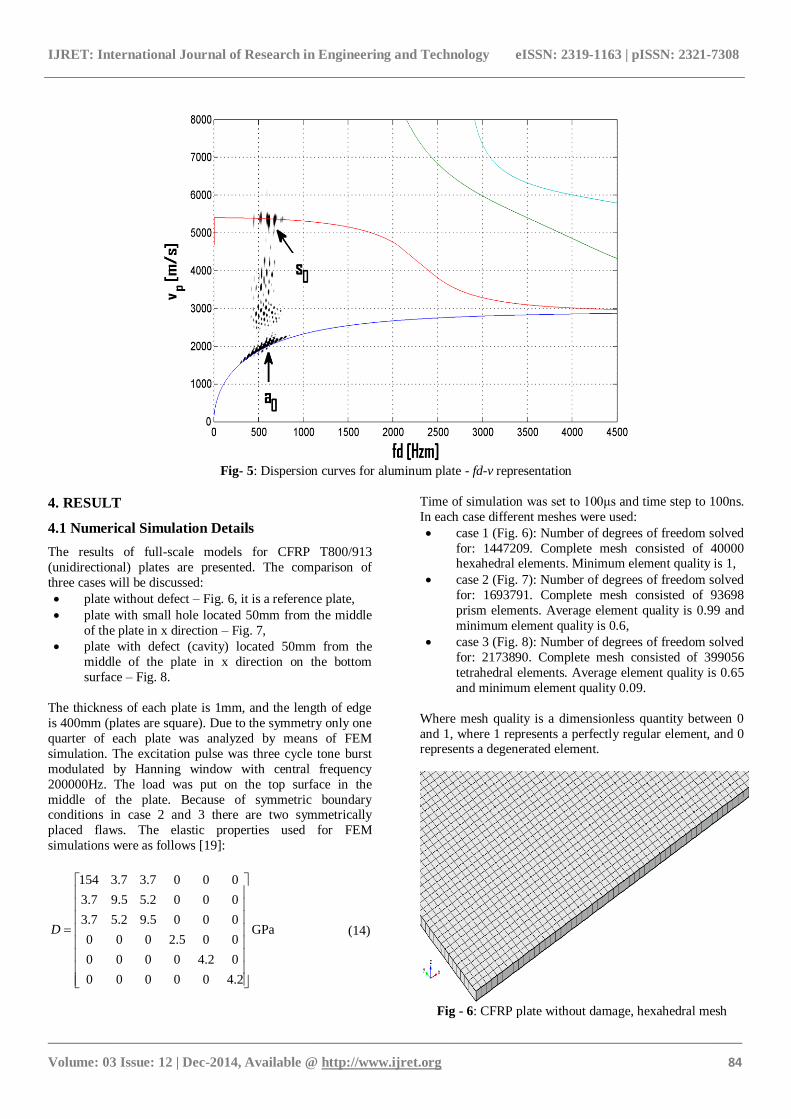
domain) [4, 18]. Result is shown in Fig. 4. Comparing the
obtained result with the analytical solution shown in Fig. 1 it
can be observed that both a0 and s0 modes are reproduced with good accuracy. The angular frequency–wavenumber
representation shows also clear distinction among basic
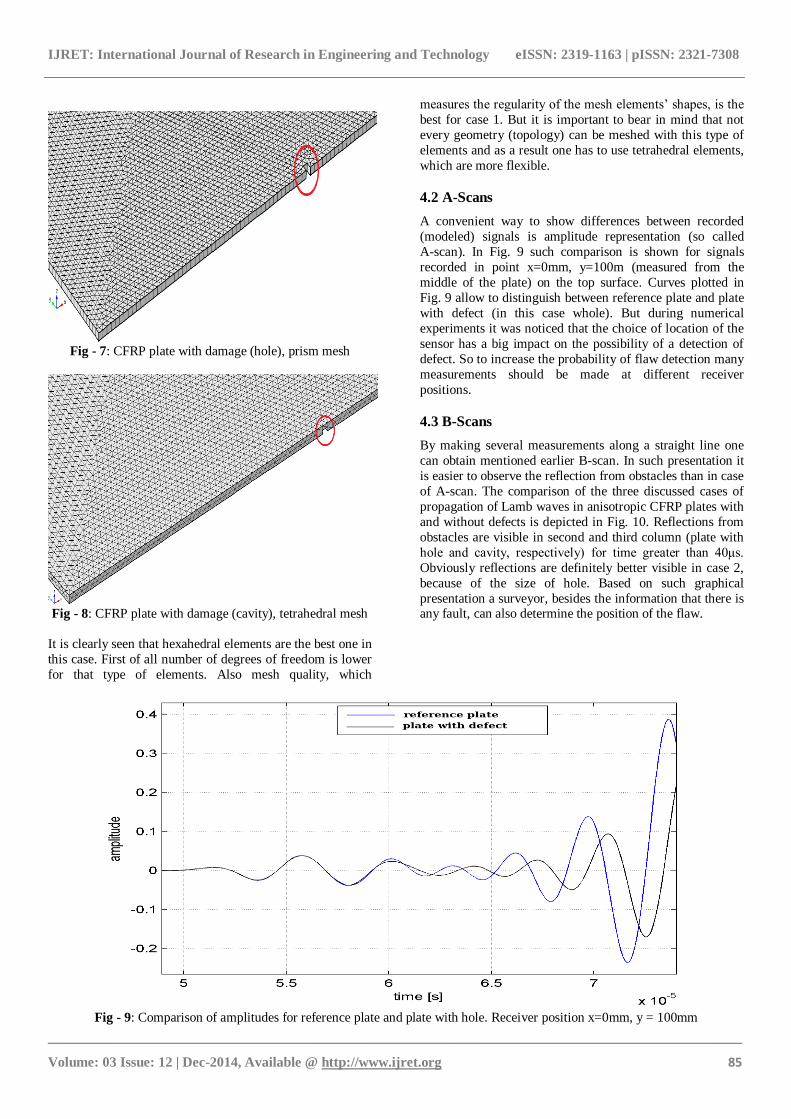
Lamb wave modes. The transformation of result to fd-vp
representation is depicted in Fig. 5. Calculated a0 and s0
modes are plotted on the determined analytically curves.
Maximum intensity of the energy is around 600Hzm, which
is equal to the product of the excitation frequency and plate
thickness. Compliance of the model with the analytical
solution allows to use it as a tool for the calculation of wave
propagation in plates made of CFRP.
Fig - 4: Dispersion curves for aluminum plate - k-ω representation
IJRET: International Journal of Research in Engineering and Technology eISSN: 2319-1163 | pISSN: 2321-7308
_______________________________________________________________________________________
Volume: 03 Issue: 12 | Dec-2014, Available @ http://www.ijret.org 84
Fig- 5: Dispersion curves for aluminum plate - fd-v representation
4. RESULT
4.1 Numerical Simulation Details
The results of full-scale models for CFRP T800/913
(unidirectional) plates are presented. The comparison of
three cases will be discussed:
plate without defect – Fig. 6, it is a reference plate,
plate with small hole located 50mm from the middle
of the plate in x direction – Fig. 7,
plate with defect (cavity) located 50mm from the
middle of the plate in x direction on the bottom
surface – Fig. 8.
The thickness of each plate is 1mm, and the length of edge
is 400mm (plates are square). Due to the symmetry only one
quarter of each plate was analyzed by means of FEM
simulation. The excitation pulse was three cycle tone burst
modulated by Hanning window with central frequency
200000Hz. The load was put on the top surface in the
middle of the plate. Because of symmetric boundary conditions in case 2 and 3 there are two symmetrically
placed flaws. The elastic properties used for FEM
simulations were as follows [19]:
2.400000
02.40000
005.2000
0005.92.57.3
0002.55.97.3
0007.37.3154
D GPa (14)
Time of simulation was set to 100μs and time step to 100ns.
In each case different meshes were used:
case 1 (Fig. 6): Number of degrees of freedom solved
for: 1447209. Complete mesh consisted of 40000 hexahedral elements. Minimum element quality is 1,
case 2 (Fig. 7): Number of degrees of freedom solved
for: 1693791. Complete mesh consisted of 93698
prism elements. Average element quality is 0.99 and
minimum element quality is 0.6,
case 3 (Fig. 8): Number of degrees of freedom solved
for: 2173890. Complete mesh consisted of 399056
tetrahedral elements. Average element quality is 0.65
and minimum element quality 0.09.
Where mesh quality is a dimensionless quantity between 0
and 1, where 1 represents a perfectly regular element, and 0 represents a degenerated element.
Fig - 6: CFRP plate without damage, hexahedral mesh
IJRET: International Journal of Research in Engineering and Technology eISSN: 2319-1163 | pISSN: 2321-7308
_______________________________________________________________________________________
Volume: 03 Issue: 12 | Dec-2014, Available @ http://www.ijret.org 85
Fig - 7: CFRP plate with damage (hole), prism mesh
Fig - 8: CFRP plate with damage (cavity), tetrahedral mesh
It is clearly seen that hexahedral elements are the best one in
this case. First of all number of degrees of freedom is lower
for that type of elements. Also mesh quality, which
measures the regularity of the mesh elements’ shapes, is the
best for case 1. But it is important to bear in mind that not
every geometry (topology) can be meshed with this type of
elements and as a result one has to use tetrahedral elements,
which are more flexible.
4.2 A-Scans
A convenient way to show differences between recorded
(modeled) signals is amplitude representation (so called
A-scan). In Fig. 9 such comparison is shown for signals
recorded in point x=0mm, y=100m (measured from the
middle of the plate) on the top surface. Curves plotted in
Fig. 9 allow to distinguish between reference plate and plate
with defect (in this case whole). But during numerical
experiments it was noticed that the choice of location of the
sensor has a big impact on the possibility of a detection of
defect. So to increase the probability of flaw detection many
measurements should be made at different receiver
positions.
4.3 B-Scans
By making several measurements along a straight line one
can obtain mentioned earlier B-scan. In such presentation it
is easier to observe the reflection from obstacles than in case
of A-scan. The comparison of the three discussed cases of
propagation of Lamb waves in anisotropic CFRP plates with
and without defects is depicted in Fig. 10. Reflections from
obstacles are visible in second and third column (plate with
hole and cavity, respectively) for time greater than 40μs.
Obviously reflections are definitely better visible in case 2,
because of the size of hole. Based on such graphical
presentation a surveyor, besides the information that there is any fault, can also determine the position of the flaw.
Fig - 9: Comparison of amplitudes for reference plate and plate with hole. Receiver position x=0mm, y = 100mm
IJRET: International Journal of Research in Engineering and Technology eISSN: 2319-1163 | pISSN: 2321-7308
_______________________________________________________________________________________
Volume: 03 Issue: 12 | Dec-2014, Available @ http://www.ijret.org 86
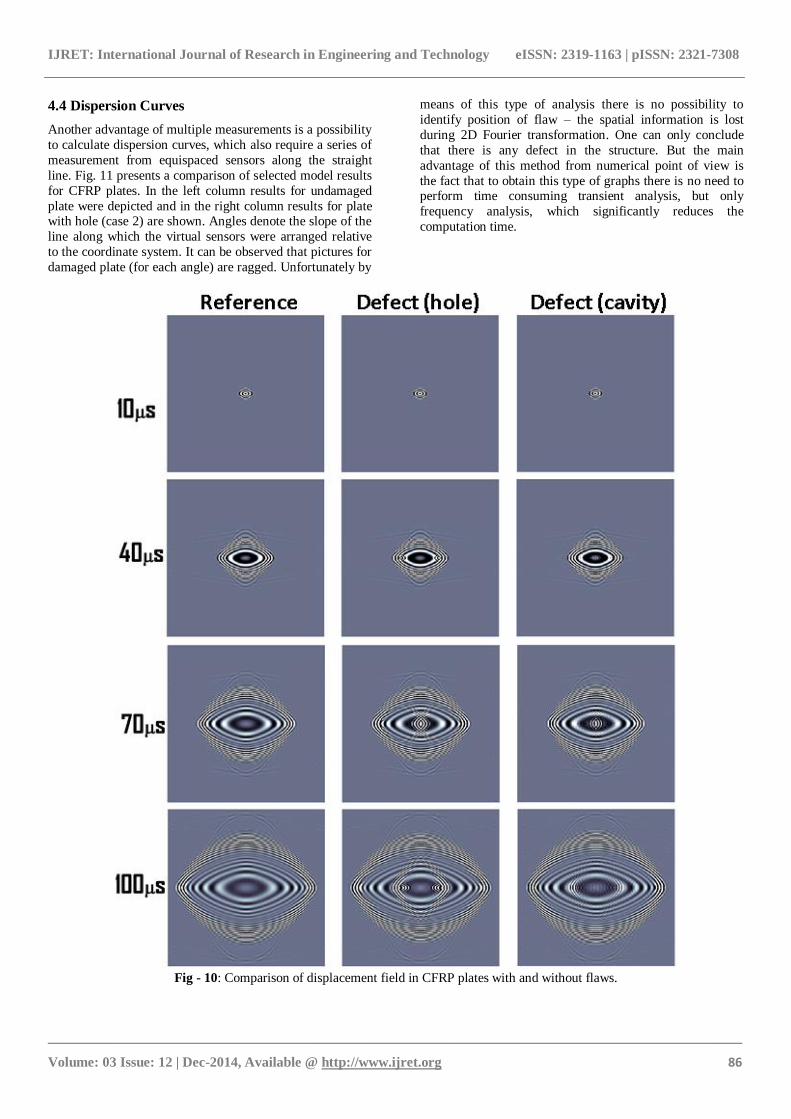
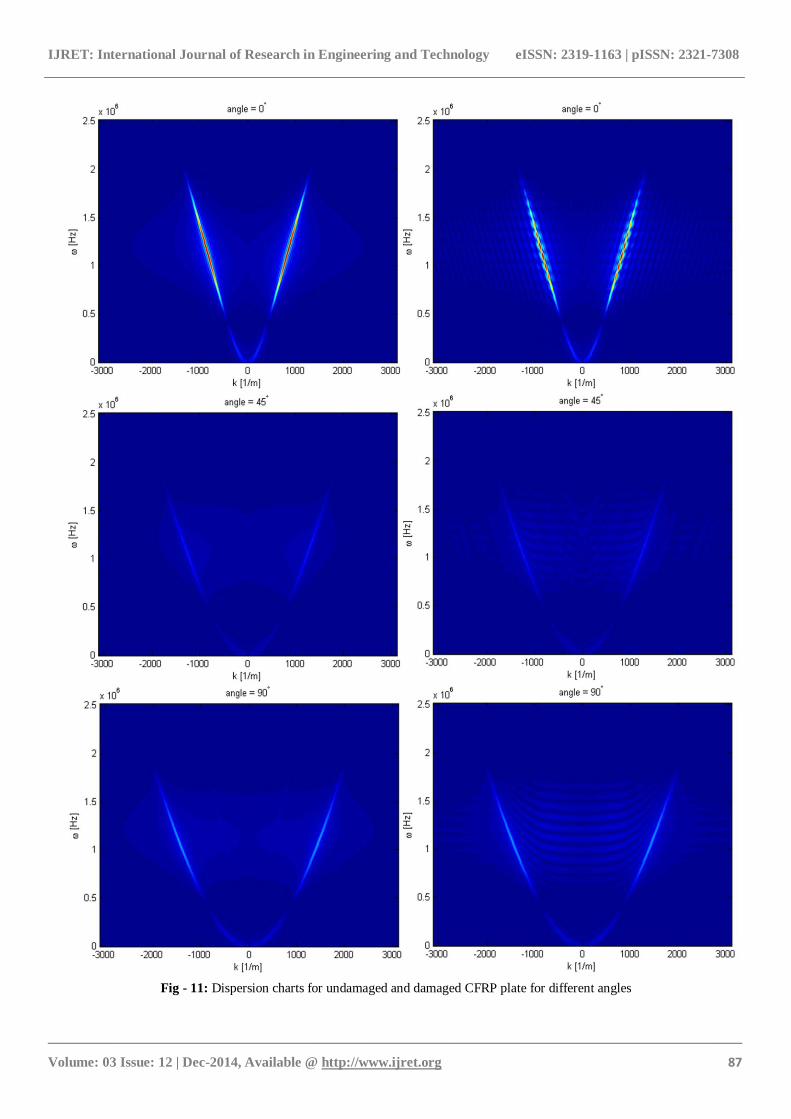
4.4 Dispersion Curves
Another advantage of multiple measurements is a possibility
to calculate dispersion curves, which also require a series of
measurement from equispaced sensors along the straight
line. Fig. 11 presents a comparison of selected model results
for CFRP plates. In the left column results for undamaged
plate were depicted and in the right column results for plate with hole (case 2) are shown. Angles denote the slope of the
line along which the virtual sensors were arranged relative
to the coordinate system. It can be observed that pictures for
damaged plate (for each angle) are ragged. Unfortunately by
means of this type of analysis there is no possibility to
identify position of flaw – the spatial information is lost
during 2D Fourier transformation. One can only conclude
that there is any defect in the structure. But the main
advantage of this method from numerical point of view is
the fact that to obtain this type of graphs there is no need to perform time consuming transient analysis, but only
frequency analysis, which significantly reduces the
computation time.
Fig - 10: Comparison of displacement field in CFRP plates with and without flaws.
IJRET: International Journal of Research in Engineering and Technology eISSN: 2319-1163 | pISSN: 2321-7308
_______________________________________________________________________________________
Volume: 03 Issue: 12 | Dec-2014, Available @ http://www.ijret.org 87
Fig - 11: Dispersion charts for undamaged and damaged CFRP plate for different angles
IJRET: International Journal of Research in Engineering and Technology eISSN: 2319-1163 | pISSN: 2321-7308
_______________________________________________________________________________________
Volume: 03 Issue: 12 | Dec-2014, Available @ http://www.ijret.org 88
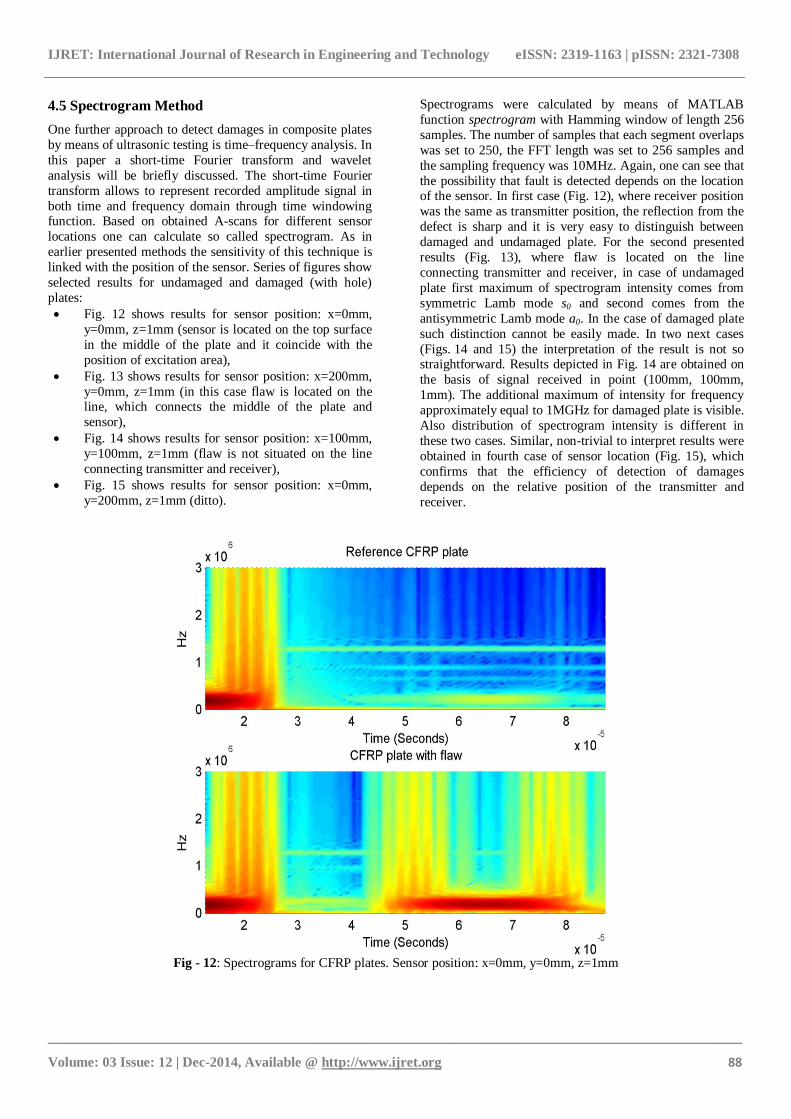
4.5 Spectrogram Method
One further approach to detect damages in composite plates
by means of ultrasonic testing is time–frequency analysis. In
this paper a short-time Fourier transform and wavelet
analysis will be briefly discussed. The short-time Fourier
transform allows to represent recorded amplitude signal in
both time and frequency domain through time windowing function. Based on obtained A-scans for different sensor
locations one can calculate so called spectrogram. As in
earlier presented methods the sensitivity of this technique is
linked with the position of the sensor. Series of figures show
selected results for undamaged and damaged (with hole)
plates:
Fig. 12 shows results for sensor position: x=0mm,
y=0mm, z=1mm (sensor is located on the top surface
in the middle of the plate and it coincide with the
position of excitation area),
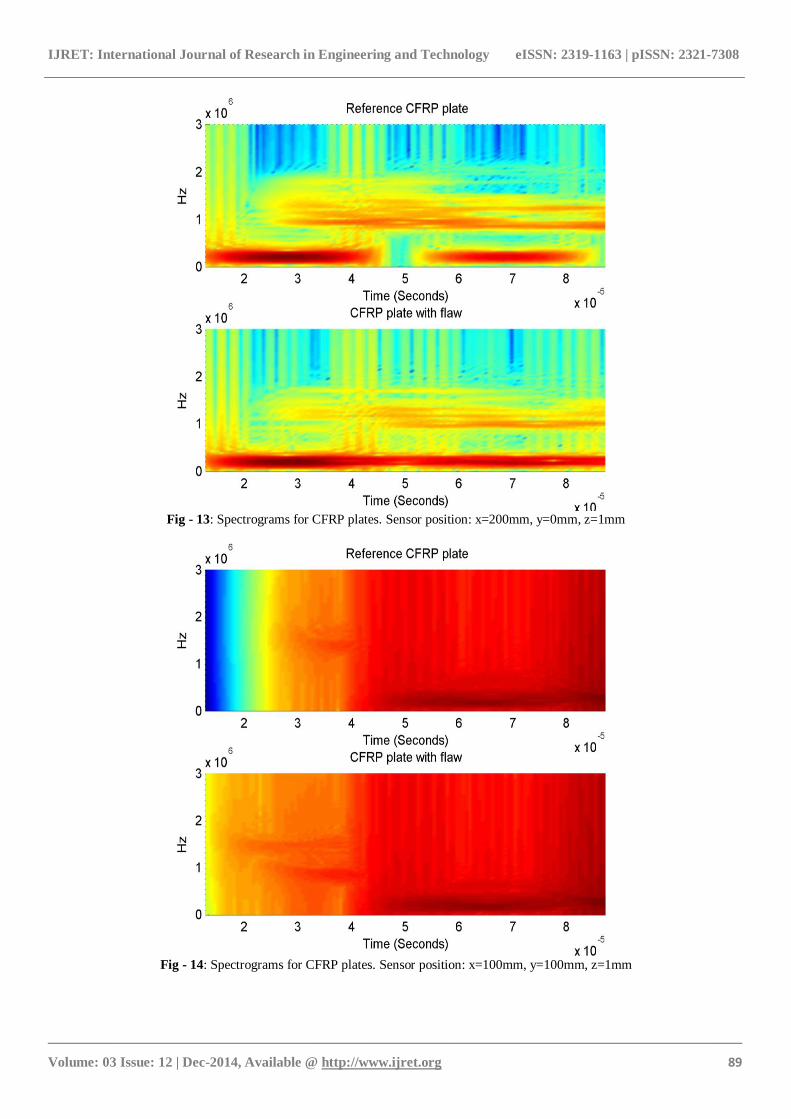
Fig. 13 shows results for sensor position: x=200mm,
y=0mm, z=1mm (in this case flaw is located on the line, which connects the middle of the plate and
sensor),
Fig. 14 shows results for sensor position: x=100mm,
y=100mm, z=1mm (flaw is not situated on the line
connecting transmitter and receiver),
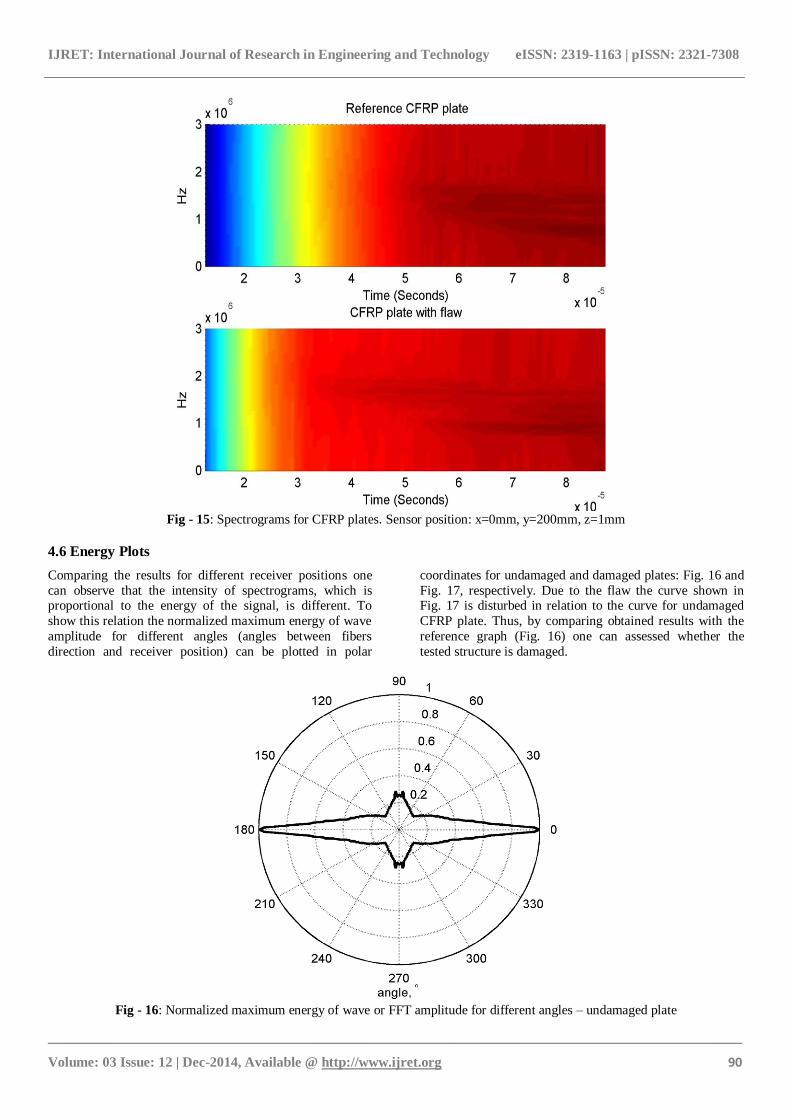
Fig. 15 shows results for sensor position: x=0mm,
y=200mm, z=1mm (ditto).
Spectrograms were calculated by means of MATLAB
function spectrogram with Hamming window of length 256
samples. The number of samples that each segment overlaps
was set to 250, the FFT length was set to 256 samples and
the sampling frequency was 10MHz. Again, one can see that
the possibility that fault is detected depends on the location of the sensor. In first case (Fig. 12), where receiver position
was the same as transmitter position, the reflection from the
defect is sharp and it is very easy to distinguish between
damaged and undamaged plate. For the second presented
results (Fig. 13), where flaw is located on the line
connecting transmitter and receiver, in case of undamaged
plate first maximum of spectrogram intensity comes from
symmetric Lamb mode s0 and second comes from the
antisymmetric Lamb mode a0. In the case of damaged plate
such distinction cannot be easily made. In two next cases
(Figs. 14 and 15) the interpretation of the result is not so straightforward. Results depicted in Fig. 14 are obtained on
the basis of signal received in point (100mm, 100mm,
1mm). The additional maximum of intensity for frequency
approximately equal to 1MGHz for damaged plate is visible.
Also distribution of spectrogram intensity is different in
these two cases. Similar, non-trivial to interpret results were
obtained in fourth case of sensor location (Fig. 15), which
confirms that the efficiency of detection of damages
depends on the relative position of the transmitter and
receiver.
Fig - 12: Spectrograms for CFRP plates. Sensor position: x=0mm, y=0mm, z=1mm
IJRET: International Journal of Research in Engineering and Technology eISSN: 2319-1163 | pISSN: 2321-7308
_______________________________________________________________________________________
Volume: 03 Issue: 12 | Dec-2014, Available @ http://www.ijret.org 89
Fig - 13: Spectrograms for CFRP plates. Sensor position: x=200mm, y=0mm, z=1mm
Fig - 14: Spectrograms for CFRP plates. Sensor position: x=100mm, y=100mm, z=1mm
IJRET: International Journal of Research in Engineering and Technology eISSN: 2319-1163 | pISSN: 2321-7308
_______________________________________________________________________________________
Volume: 03 Issue: 12 | Dec-2014, Available @ http://www.ijret.org 90
Fig - 15: Spectrograms for CFRP plates. Sensor position: x=0mm, y=200mm, z=1mm
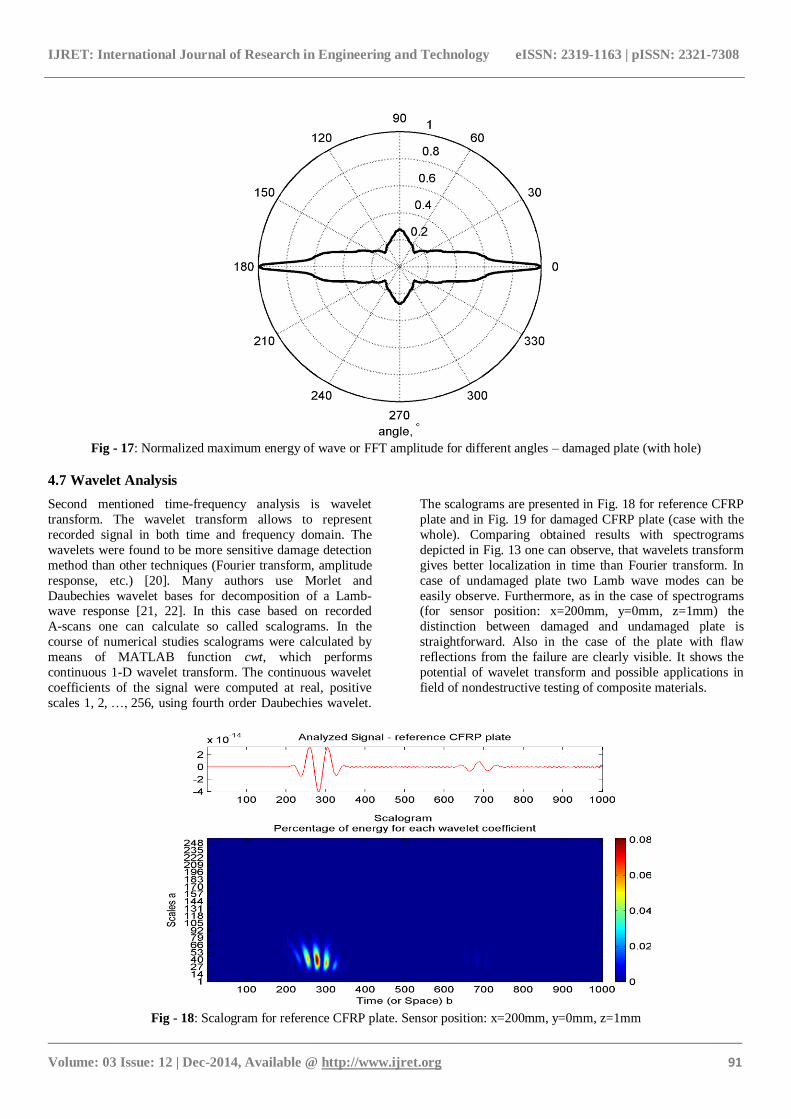
4.6 Energy Plots
Comparing the results for different receiver positions one
can observe that the intensity of spectrograms, which is proportional to the energy of the signal, is different. To
show this relation the normalized maximum energy of wave
amplitude for different angles (angles between fibers
direction and receiver position) can be plotted in polar
coordinates for undamaged and damaged plates: Fig. 16 and
Fig. 17, respectively. Due to the flaw the curve shown in Fig. 17 is disturbed in relation to the curve for undamaged
CFRP plate. Thus, by comparing obtained results with the
reference graph (Fig. 16) one can assessed whether the
tested structure is damaged.
Fig - 16: Normalized maximum energy of wave or FFT amplitude for different angles – undamaged plate
IJRET: International Journal of Research in Engineering and Technology eISSN: 2319-1163 | pISSN: 2321-7308
_______________________________________________________________________________________
Volume: 03 Issue: 12 | Dec-2014, Available @ http://www.ijret.org 91
Fig - 17: Normalized maximum energy of wave or FFT amplitude for different angles – damaged plate (with hole)
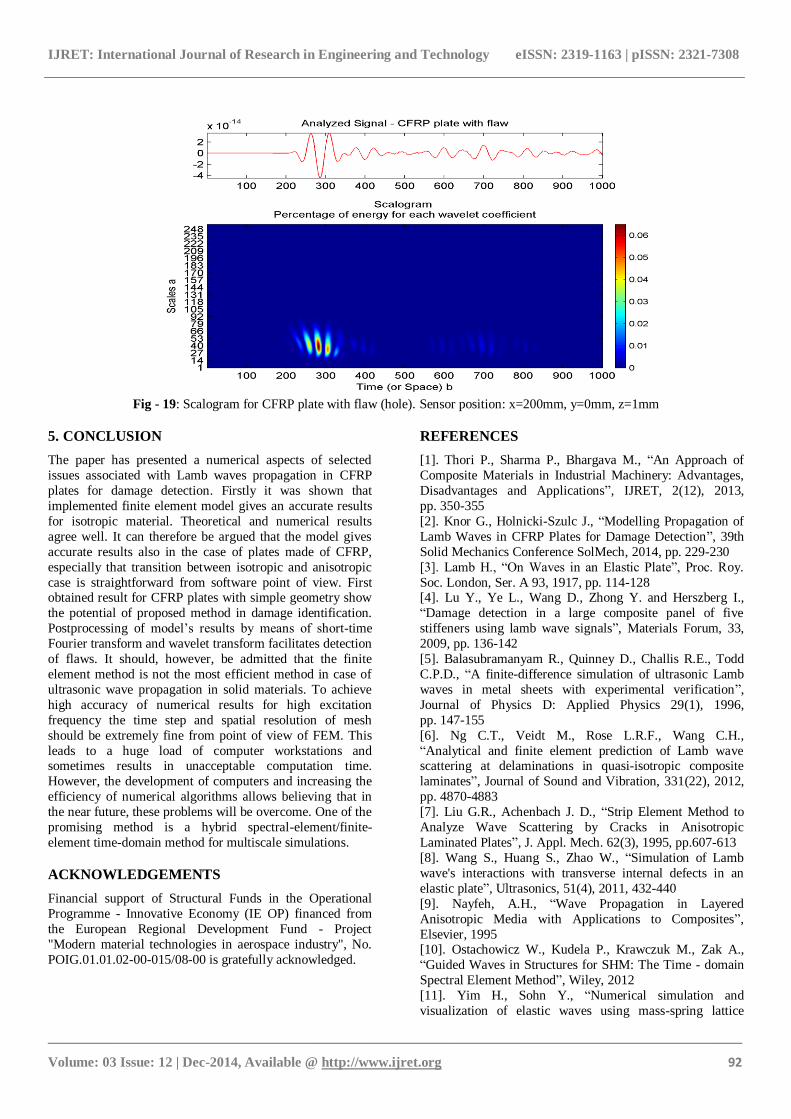
4.7 Wavelet Analysis
Second mentioned time-frequency analysis is wavelet
transform. The wavelet transform allows to represent
recorded signal in both time and frequency domain. The
wavelets were found to be more sensitive damage detection
method than other techniques (Fourier transform, amplitude
response, etc.) [20]. Many authors use Morlet and
Daubechies wavelet bases for decomposition of a Lamb-wave response [21, 22]. In this case based on recorded
A-scans one can calculate so called scalograms. In the
course of numerical studies scalograms were calculated by
means of MATLAB function cwt, which performs
continuous 1-D wavelet transform. The continuous wavelet
coefficients of the signal were computed at real, positive
scales 1, 2, …, 256, using fourth order Daubechies wavelet.
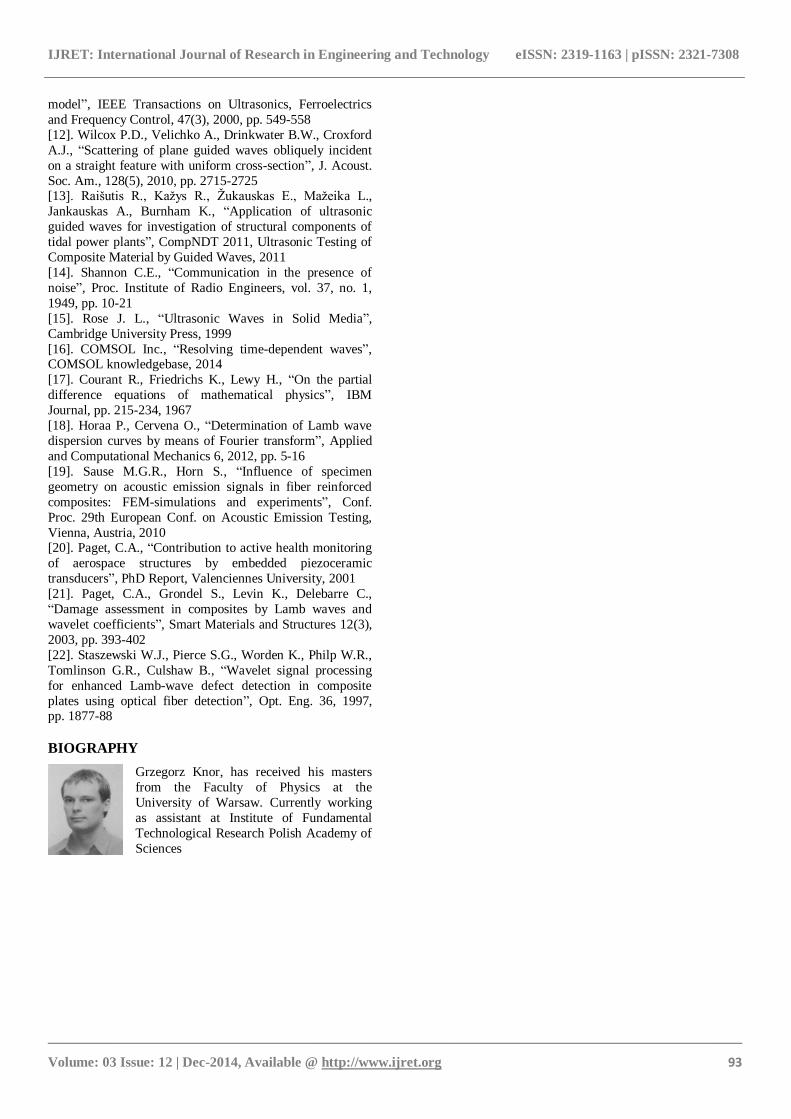
The scalograms are presented in Fig. 18 for reference CFRP
plate and in Fig. 19 for damaged CFRP plate (case with the
whole). Comparing obtained results with spectrograms
depicted in Fig. 13 one can observe, that wavelets transform
gives better localization in time than Fourier transform. In
case of undamaged plate two Lamb wave modes can be
easily observe. Furthermore, as in the case of spectrograms (for sensor position: x=200mm, y=0mm, z=1mm) the
distinction between damaged and undamaged plate is
straightforward. Also in the case of the plate with flaw
reflections from the failure are clearly visible. It shows the
potential of wavelet transform and possible applications in
field of nondestructive testing of composite materials.
Fig - 18: Scalogram for reference CFRP plate. Sensor position: x=200mm, y=0mm, z=1mm
IJRET: International Journal of Research in Engineering and Technology eISSN: 2319-1163 | pISSN: 2321-7308
_______________________________________________________________________________________
Volume: 03 Issue: 12 | Dec-2014, Available @ http://www.ijret.org 92
Fig - 19: Scalogram for CFRP plate with flaw (hole). Sensor position: x=200mm, y=0mm, z=1mm
5. CONCLUSION
The paper has presented a numerical aspects of selected
issues associated with Lamb waves propagation in CFRP
plates for damage detection. Firstly it was shown that
implemented finite element model gives an accurate results
for isotropic material. Theoretical and numerical results
agree well. It can therefore be argued that the model gives
accurate results also in the case of plates made of CFRP,
especially that transition between isotropic and anisotropic
case is straightforward from software point of view. First obtained result for CFRP plates with simple geometry show
the potential of proposed method in damage identification.
Postprocessing of model’s results by means of short-time
Fourier transform and wavelet transform facilitates detection
of flaws. It should, however, be admitted that the finite
element method is not the most efficient method in case of
ultrasonic wave propagation in solid materials. To achieve
high accuracy of numerical results for high excitation
frequency the time step and spatial resolution of mesh
should be extremely fine from point of view of FEM. This
leads to a huge load of computer workstations and sometimes results in unacceptable computation time.
However, the development of computers and increasing the
efficiency of numerical algorithms allows believing that in
the near future, these problems will be overcome. One of the
promising method is a hybrid spectral-element/finite-
element time-domain method for multiscale simulations.
ACKNOWLEDGEMENTS
Financial support of Structural Funds in the Operational
Programme - Innovative Economy (IE OP) financed from
the European Regional Development Fund - Project
"Modern material technologies in aerospace industry", No.
POIG.01.01.02-00-015/08-00 is gratefully acknowledged.
REFERENCES
[1]. Thori P., Sharma P., Bhargava M., “An Approach of
Composite Materials in Industrial Machinery: Advantages,
Disadvantages and Applications”, IJRET, 2(12), 2013,
pp. 350-355
[2]. Knor G., Holnicki-Szulc J., “Modelling Propagation of
Lamb Waves in CFRP Plates for Damage Detection”, 39th
Solid Mechanics Conference SolMech, 2014, pp. 229-230
[3]. Lamb H., “On Waves in an Elastic Plate”, Proc. Roy.
Soc. London, Ser. A 93, 1917, pp. 114-128 [4]. Lu Y., Ye L., Wang D., Zhong Y. and Herszberg I.,
“Damage detection in a large composite panel of five
stiffeners using lamb wave signals”, Materials Forum, 33,
2009, pp. 136-142
[5]. Balasubramanyam R., Quinney D., Challis R.E., Todd
C.P.D., “A finite-difference simulation of ultrasonic Lamb
waves in metal sheets with experimental verification”,
Journal of Physics D: Applied Physics 29(1), 1996,
pp. 147-155
[6]. Ng C.T., Veidt M., Rose L.R.F., Wang C.H.,
“Analytical and finite element prediction of Lamb wave scattering at delaminations in quasi-isotropic composite
laminates”, Journal of Sound and Vibration, 331(22), 2012,
pp. 4870-4883
[7]. Liu G.R., Achenbach J. D., “Strip Element Method to
Analyze Wave Scattering by Cracks in Anisotropic
Laminated Plates”, J. Appl. Mech. 62(3), 1995, pp.607-613
[8]. Wang S., Huang S., Zhao W., “Simulation of Lamb
wave's interactions with transverse internal defects in an
elastic plate”, Ultrasonics, 51(4), 2011, 432-440
[9]. Nayfeh, A.H., “Wave Propagation in Layered
Anisotropic Media with Applications to Composites”,
Elsevier, 1995 [10]. Ostachowicz W., Kudela P., Krawczuk M., Zak A.,
“Guided Waves in Structures for SHM: The Time - domain
Spectral Element Method”, Wiley, 2012
[11]. Yim H., Sohn Y., “Numerical simulation and
visualization of elastic waves using mass-spring lattice
IJRET: International Journal of Research in Engineering and Technology eISSN: 2319-1163 | pISSN: 2321-7308
_______________________________________________________________________________________
Volume: 03 Issue: 12 | Dec-2014, Available @ http://www.ijret.org 93
model”, IEEE Transactions on Ultrasonics, Ferroelectrics
and Frequency Control, 47(3), 2000, pp. 549-558
[12]. Wilcox P.D., Velichko A., Drinkwater B.W., Croxford
A.J., “Scattering of plane guided waves obliquely incident
on a straight feature with uniform cross-section”, J. Acoust.
Soc. Am., 128(5), 2010, pp. 2715-2725 [13]. Raišutis R., Kažys R., Žukauskas E., Mažeika L.,
Jankauskas A., Burnham K., “Application of ultrasonic
guided waves for investigation of structural components of
tidal power plants”, CompNDT 2011, Ultrasonic Testing of
Composite Material by Guided Waves, 2011
[14]. Shannon C.E., “Communication in the presence of
noise”, Proc. Institute of Radio Engineers, vol. 37, no. 1,
1949, pp. 10-21
[15]. Rose J. L., “Ultrasonic Waves in Solid Media”,
Cambridge University Press, 1999
[16]. COMSOL Inc., “Resolving time-dependent waves”, COMSOL knowledgebase, 2014
[17]. Courant R., Friedrichs K., Lewy H., “On the partial
difference equations of mathematical physics”, IBM
Journal, pp. 215-234, 1967
[18]. Horaa P., Cervena O., “Determination of Lamb wave
dispersion curves by means of Fourier transform”, Applied
and Computational Mechanics 6, 2012, pp. 5-16
[19]. Sause M.G.R., Horn S., “Influence of specimen
geometry on acoustic emission signals in fiber reinforced
composites: FEM-simulations and experiments”, Conf.
Proc. 29th European Conf. on Acoustic Emission Testing,
Vienna, Austria, 2010 [20]. Paget, C.A., “Contribution to active health monitoring
of aerospace structures by embedded piezoceramic
transducers”, PhD Report, Valenciennes University, 2001
[21]. Paget, C.A., Grondel S., Levin K., Delebarre C.,
“Damage assessment in composites by Lamb waves and
wavelet coefficients”, Smart Materials and Structures 12(3),
2003, pp. 393-402
[22]. Staszewski W.J., Pierce S.G., Worden K., Philp W.R.,
Tomlinson G.R., Culshaw B., “Wavelet signal processing
for enhanced Lamb-wave defect detection in composite
plates using optical fiber detection”, Opt. Eng. 36, 1997, pp. 1877-88
BIOGRAPHY
Grzegorz Knor, has received his masters
from the Faculty of Physics at the
University of Warsaw. Currently working
as assistant at Institute of Fundamental
Technological Research Polish Academy of
Sciences