Embed Size (px)
Citation preview
Damage Precursor Investigation of Fiber-Reinforced
Composite Materials Under Fatigue Loads
by Asha J. Hall, Raymond E. Brennan IV, Anindya Ghoshal, Kuang C. Liu,
Michael Coatney, Robert Haynes, Natasha Bradley, Volker Weiss,
and Jerome Tzeng
ARL-TR-6622 September 2013
Approved for public release; distribution unlimited.

NOTICES
Disclaimers
The findings in this report are not to be construed as an official Department of the Army position
unless so designated by other authorized documents.
Citation of manufacturer’s or trade names does not constitute an official endorsement or
approval of the use thereof.
Destroy this report when it is no longer needed. Do not return it to the originator.
Army Research Laboratory Aberdeen Proving Ground, MD 21005
ARL-TR-6622 September 2013
Damage Precursor Investigation of Fiber-Reinforced
Composite Materials Under Fatigue Loads
Asha J. Hall, Anindya Ghoshal, Michael Coatney, Robert Haynes,
Kuang C. Liu, Natasha Bradley, and Volker Weiss Vehicle Technology Directorate, ARL
Raymond E. Brennan IV and Jerome Tzeng
Weapons and Materials Research Directorate
Approved for public release; distribution unlimited.
ii
REPORT DOCUMENTATION PAGE Form Approved
OMB No. 0704-0188 Public reporting burden for this collection of information is estimated to average 1 hour per response, including the time for reviewing instructions, searching existing data sources, gathering and maintaining the
data needed, and completing and reviewing the collection information. Send comments regarding this burden estimate or any other aspect of this collection of information, including suggestions for reducing the
burden, to Department of Defense, Washington Headquarters Services, Directorate for Information Operations and Reports (0704-0188), 1215 Jefferson Davis Highway, Suite 1204, Arlington, VA 22202-4302.
Respondents should be aware that notwithstanding any other provision of law, no person shall be subject to any penalty for failing to comply with a collection of information if it does not display a currently
valid OMB control number.
PLEASE DO NOT RETURN YOUR FORM TO THE ABOVE ADDRESS.
1. REPORT DATE (DD-MM-YYYY)
September 2013
2. REPORT TYPE
Final
3. DATES COVERED (From - To)
4. TITLE AND SUBTITLE
Damage Precursor Investigation of Fiber-Reinforced Composite Materials
Under Fatigue Loads
5a. CONTRACT NUMBER
5b. GRANT NUMBER
5c. PROGRAM ELEMENT NUMBER
6. AUTHOR(S)
Asha J. Hall, Raymond E. Brennan IV, Anindya Ghoshal, Kuang C. Liu,
Michael Coatney, Robert Haynes, Natasha Bradley, Volker Weiss, and
Jerome Tzeng
5d. PROJECT NUMBER
5e. TASK NUMBER
5f. WORK UNIT NUMBER
7. PERFORMING ORGANIZATION NAME(S) AND ADDRESS(ES)
U.S. Army Research Laboratory
ATTN: RDRL-VTP
Aberdeen Proving Ground, MD 21005
8. PERFORMING ORGANIZATION REPORT NUMBER
ARL-TR-6622
9. SPONSORING/MONITORING AGENCY NAME(S) AND ADDRESS(ES)
10. SPONSOR/MONITOR'S ACRONYM(S)
11. SPONSOR/MONITOR'S REPORT NUMBER(S)
12. DISTRIBUTION/AVAILABILITY STATEMENT
Approved for public release; distribution unlimited.
13. SUPPLEMENTARY NOTES
*Corresponding author Email: [email protected]
14. ABSTRACT
Glass-epoxy composite structures (common aerospace applications) exhibit damage precursors such as micro-cracks, which
significantly impact structural performance and life span. This study focused on identifying the stress levels responsible for
crazing, micro-crack formation, and coalescence into macro-cracks in S2 glass and Cycom-381 epoxy matrices (8 plies
woven). Fatigue tests were performed at 1, 100, 1,000, 10,000, 100,000, and 1,000,000 cycles under tensile loading conditions
(R=0.1). Damage monitoring strategies prior to, during, and after cyclic loading conditions include ultrasonic nondestructive
evaluation (NDE), acoustic emission (AE), and scanning electron microscopy (SEM). Macro-scale inhomogeneities in the as-
fabricated composite structures, such as porosity, debonding, macro-cracking, and ply distortions, were evaluated using an
ultrasonic NDE technique. AE was used during the fatigue loading tests to identify and localize the presence of rupture,
delaminations, and micro-crack formations in real time. Post-damage microscale examination of the fracture surfaces was
conducted using SEM. By this systematic evaluation, the phenomena of crazing, the propagation of micro-cracks,
delaminations, and the factors that lead to catastrophic failure were investigated. Based on this study, an empirical framework
was developed to map the relationship between the sizing and location of damage precursors and the corresponding
matrix/fiber degradation mechanisms.
15. SUBJECT TERMS
damage precursors, acoustic emissions, ultrasound transmission, glass epoxy composites
16. SECURITY CLASSIFICATION OF:
17. LIMITATION OF
ABSTRACT
UU
18. NUMBER OF
PAGES
38
19a. NAME OF RESPONSIBLE PERSON
Anindya Ghoshal a. REPORT
Unclassified
b. ABSTRACT
Unclassified
c. THIS PAGE
Unclassified
19b. TELEPHONE NUMBER (Include area code)
(410) 278-7358
Standard Form 298 (Rev. 8/98)
Prescribed by ANSI Std. Z39.18
iii
Contents
List of Figures iv
List of Tables v
1. Introduction 1
2. Material Damage Precursors 3
2.1 Microstructure Damage Evolution ..................................................................................4
3. Experimental Analysis 13
3.1 Specimen Preparation ....................................................................................................13
3.2 Pulse-Echo Mode Ultrasound Monitoring ....................................................................14
3.3 Acoustic Emission Monitoring ......................................................................................15
3.4 Scanning Electron Microscopy (SEM)..........................................................................15
3.5 Fatigue Testing ..............................................................................................................15
4. Results and Discussion 16
5. Fatigue Testing 20
6. Conclusion 25
7. References 26
List of Symbols, Abbreviations, and Acronyms 29
Distribution List 30
iv
List of Figures
Figure 1. Weiss curve for composite life prediction current state of the art and using proposed methodology. .............................................................................................................................2
Figure 2. Radial distribution function, g, for all analyzed experimental results. Higher first peaks correlate to higher volume fractions. ...............................................................................6
Figure 3. Ripley’s K function computed based on optical micrographs for independent experimental observations: (a) shows the short and long range response while (b) shows the local response. ......................................................................................................................7
Figure 4. Illustrations of ordered structure found in Buryachenko’s data. ......................................7
Figure 5. Distribution of fiber radius sizes calculated using circular Hough transforms on experimental micrographs. .........................................................................................................8
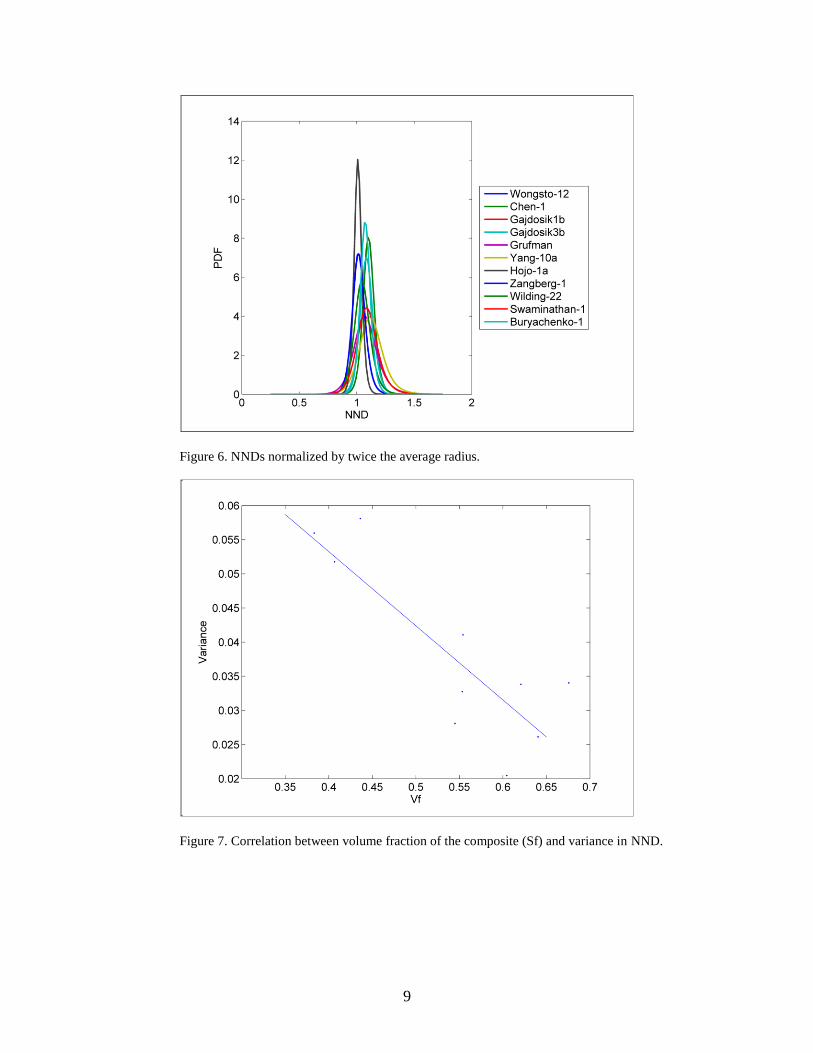
Figure 6. NNDs normalized by twice the average radius. ...............................................................9
Figure 7. Correlation between volume fraction of the composite (Sf) and variance in NND. ........9
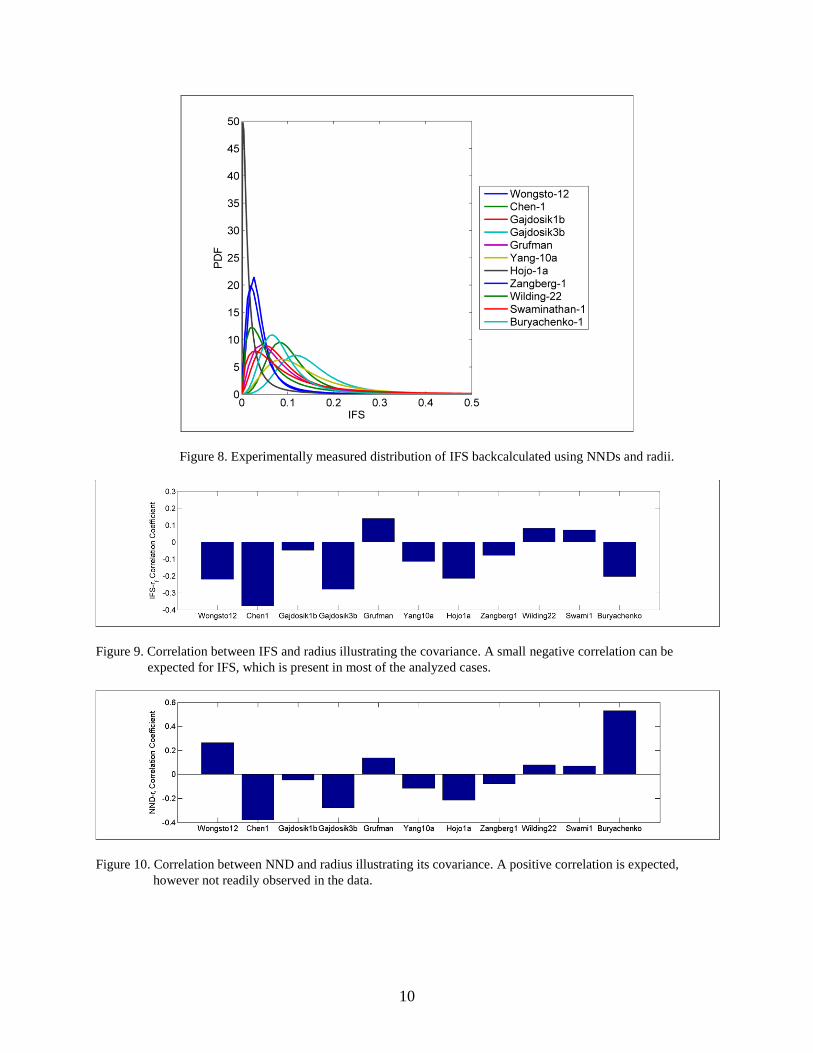
Figure 8. Experimentally measured distribution of IFS backcalculated using NNDs and radii. ...10
Figure 9. Correlation between IFS and radius illustrating the covariance. A small negative correlation can be expected for IFS, which is present in most of the analyzed cases. ............10
Figure 10. Correlation between NND and radius illustrating its covariance. A positive correlation is expected, however not readily observed in the data. .........................................10
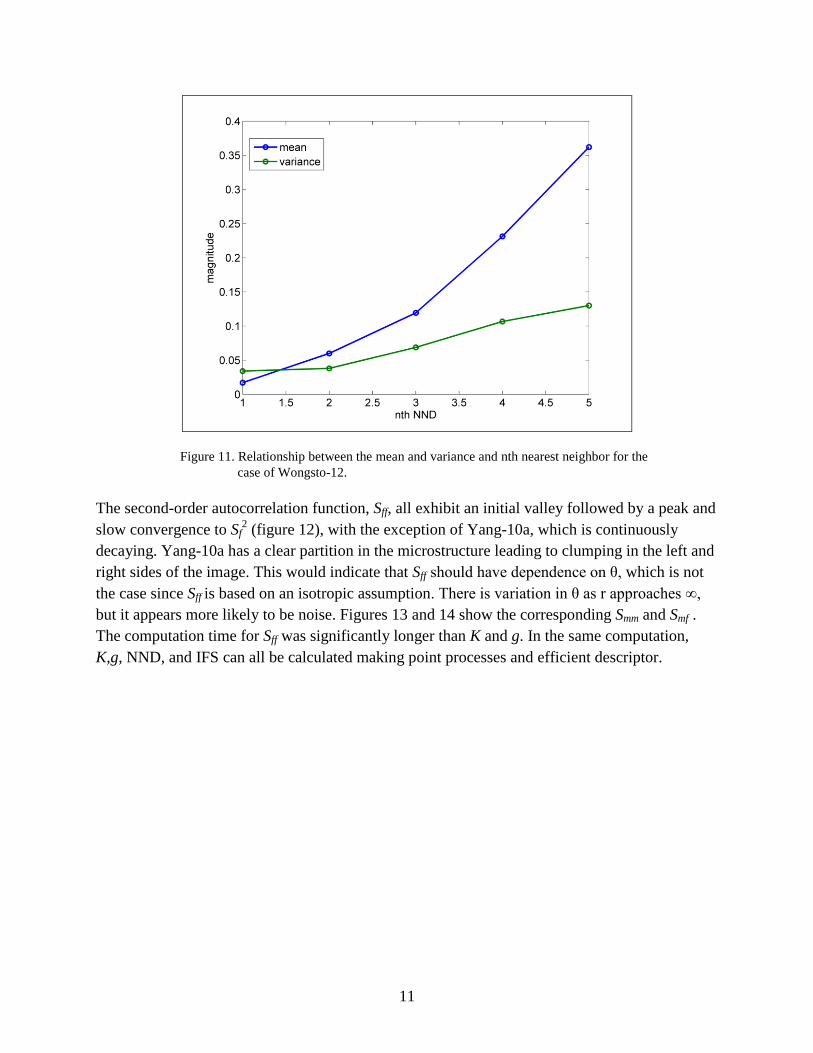
Figure 11. Relationship between the mean and variance and nth nearest neighbor for the case of Wongsto-12. ........................................................................................................................11
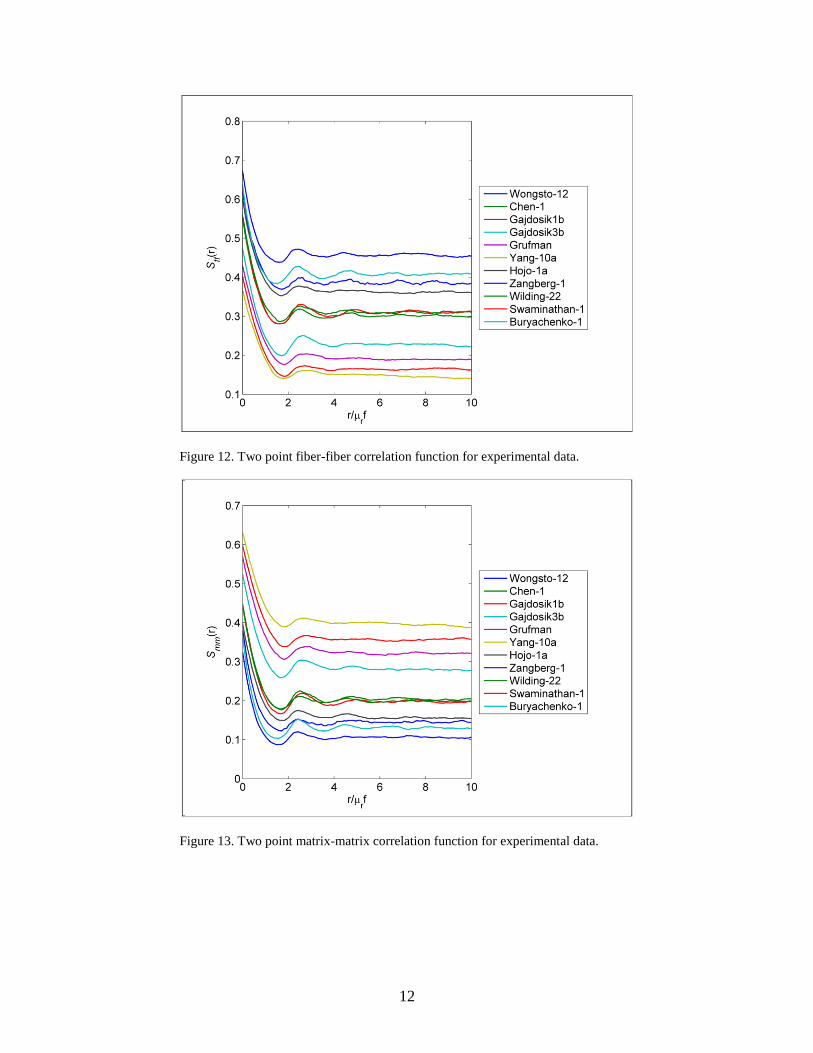
Figure 12. Two point fiber-fiber correlation function for experimental data. ...............................12
Figure 13. Two point matrix-matrix correlation function for experimental data. .........................12
Figure 14. Two point matrix-fiber correlation function for experimental data. ............................13
Figure 15. Schematic of Cycom 381 specimen with acoustic emission sensors. ..........................14
Figure 16. A-scans of a strike face and back face at 3.5 MHz. .....................................................16
Figure 17. C-scan images of a composite strike face and back face at 3.5 MHz. .........................17
Figure 18. A-scans of a strike face (gain=35 and 50 dB) at 10 MHz. ...........................................17
Figure 19. C-scan images at 10 MHz of the strike face and back face (a) top/near surface and (b) bottom surface. ...................................................................................................................18
Figure 20. C-scan image of the entire panel and individual cut samples. .....................................19
Figure 21. C-scan image of the entire panel and individual cut samples. .....................................19
Figure 22. Cross-sectional image of SEM of specimen before Fatigue cycles. ............................19
Figure 23. SEM image of 100,000 cycle specimen waiting for SEM images. ..............................20
Figure 24. Representation of AE transducer layout on specimen and Instron fatigue testing machine. ...................................................................................................................................21
v
Figure 25. Location of acoustic events between transducers for (a) 1 cycle, (b) 100 cycles, (c) 1,000 cycles, and (d) 10,000 cycles. ..................................................................................22
Figure 26. Maximum strain per cycle and temperature. ................................................................23
Figure 27. Location of AE events between transducers for (a) 1 cycle, (b) 100 cycles, (c) 1,000 cycles, and (d) 10,000 cycles. ...................................................................................24
Figure 28. Voltage decibel versus frequency for (a) 100 cycles, (b) 1,000 cycles, and (c) 10,000 cycles; ordinate is voltage (dB). ............................................................................25
List of Tables
Table 1. Naming and source of experimental micrographs. ............................................................5
Table 2. Physical, acoustic, and elastic properties of composite panel. ........................................14

vi
INTENTIONALLY LEFT BLANK.
1
1. Introduction
Fiber-reinforced composite materials (laminated composites and polymer matrix composites) are
being increasingly used in aerial and ground vehicles because of their high strength to weight
ratios. In existing Army rotorcraft such as the UH60, examples of composite structures include
the main rotor blade and the tail rotor flexbeam spar. In Future Vertical Lift (FVL) programs
including the Joint Multi-Role Rotorcraft (JMR), the use of composites as the main structural
materials for load-bearing dynamic components is likely to increase drastically. However, the
performance and behavior characteristics of nearly all in-service composite structures can be
degraded from sustained use, exposure to severe environmental conditions, or damage from
impact loading, abrasion, operator abuse, or neglect. These factors can have serious
consequences on the structures relative to safety, cost, and operational capability. Therefore, the
timely and accurate detection, characterization, and monitoring of structural damage is a major
concern in the operational environment. Current service life prediction methodologies, especially
for critical air vehicle structures, often fail to provide adequate warning of impending failure.
Fatigue life prediction based on crack length measurements and existing analytical methods can
be grossly inaccurate when based on early service life data, and are often too late for effective
action when based on easily measurable crack lengths during the final service life regime. Larsen
et al. (2004, 2010, 2008) as part of the Defense Advanced Research Projects Agency (DARPA)
Structural Integrity Prognosis System (SIPS) Program concluded that study of damage
precursors is highly important for material state awareness and remaining service life prognosis.
Baker (2012) recently presented the Research Development and Engineering Command
(RDECOM)/ Army Missile Research, Development and Engineering Center (AMRDEC) Army
Operations and Sustainment Science and Technology (S&T) Roadmap, which included Material
State Awareness and Damage Precursor Mapping topics as part of 6.1 Army (U.S. Army
Research Laboratory [ARL]) S&T research investment.
For the purposes of this research effort, material state awareness is defined as reliable
nondestructive quantitative materials damage characterization, regardless of scale (Lindgren,
2011). Damage is defined as a process or an inclusion that compromises the structural integrity
of the structure. Examples of structural damage are delamination, cracks, accumulated
dislocations, porosity, surface galling, etc. Structural integrity is the ability of a structure to
perform the designed task, e.g., structural load carrying capacity, thermal barrier, or lift. A
damage precursor is defined as the progression of structural material property degradation or
morphology that can evolve into damage. Some of the known damage precursors are dislocation
density, adiabatic shear bands, crazing, slip bands, residual stresses, and structural inclusions.
The precursor indicator is the direct or indirect measure of a precursor, such as the measurement
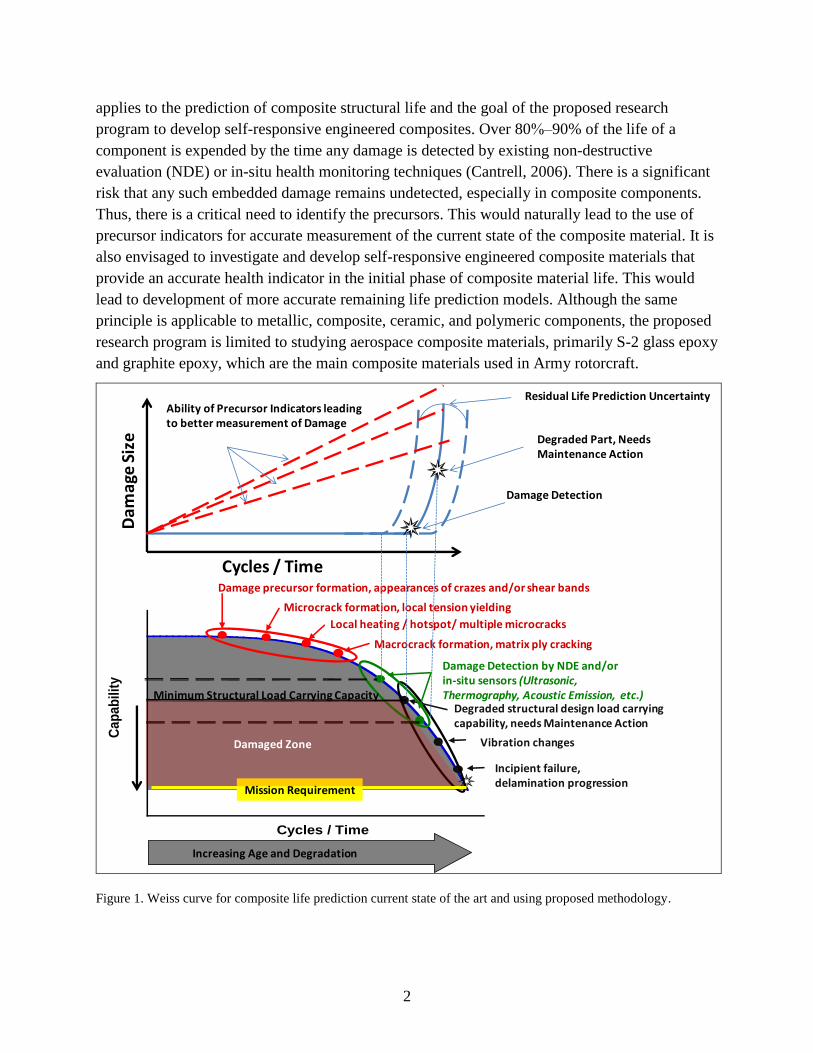
of microcrack evolution in composites. Figure 1 shows the Weiss curve, which denotes the
current state of the art. This is a modified Larsen-John-Lindgren curve (Larsen et al., 2008) as it
2
applies to the prediction of composite structural life and the goal of the proposed research
program to develop self-responsive engineered composites. Over 80%‒90% of the life of a
component is expended by the time any damage is detected by existing non-destructive
evaluation (NDE) or in-situ health monitoring techniques (Cantrell, 2006). There is a significant
risk that any such embedded damage remains undetected, especially in composite components.
Thus, there is a critical need to identify the precursors. This would naturally lead to the use of
precursor indicators for accurate measurement of the current state of the composite material. It is
also envisaged to investigate and develop self-responsive engineered composite materials that
provide an accurate health indicator in the initial phase of composite material life. This would
lead to development of more accurate remaining life prediction models. Although the same
principle is applicable to metallic, composite, ceramic, and polymeric components, the proposed
research program is limited to studying aerospace composite materials, primarily S-2 glass epoxy
and graphite epoxy, which are the main composite materials used in Army rotorcraft.
Figure 1. Weiss curve for composite life prediction current state of the art and using proposed methodology.
Increasing Age and Degradation
Ca
pa
bil
ity
Cycles / Time
Mission Requirement
Damage precursor formation, appearances of crazes and/or shear bands
Microcrack formation, local tension yielding
Local heating / hotspot/ multiple microcracks
Macrocrack formation, matrix ply cracking
Vibration changes
Degraded structural design load carrying capability, needs Maintenance Action
Damage Detection by NDE and/or in-situ sensors (Ultrasonic, Thermography, Acoustic Emission, etc.)
Incipient failure, delamination progression
Minimum Structural Load Carrying Capacity
Damaged Zone
Degraded Part, Needs Maintenance Action
Damage Detection
Residual Life Prediction Uncertainty
Dam
age
Siz
e
Cycles / Time
Ability of Precursor Indicators leading to better measurement of Damage
3
2. Material Damage Precursors
Inhomogeneity of strain, shear localization, adiabatic shear bands, and crazing are typical
damage precursors. Shear banding is defined as a narrow zone of intense shear strain. These
bands are generally plastic in nature. They develop during severe deformation of ductile
materials. They do not occur in brittle materials. The shear bands can be in the form of localized
deformations that develop in ductile materials (alloys, metals, granular materials, plastics,
polymers, and soils). They also can be observed as extreme deformations occurring within shear
bands that lead to intense damage and fracture.
Crazing is a network of fine cracks on the surface of a material such as a ceramic. Crazing
precedes fracture in glassy thermoplastic polymers. It occurs in regions of high hydrostatic
tension and can also develop in regions of localized yielding. Crazing results in the formation of
interpenetrating microvoid networks and small fibrils. In amorphous polymers (polystyrene,
polymethyl methacrylate [PMMA] and polycarbonate), the crazed region is below the surface
and generally associated with “whitening” or “frosting” that leads to brittle failure. When an
applied tensile load reaches certain criticality, the bridges elongate and break, causing the
microvoids to grow and coalesce to form cracks. The presence of crazing can be indicated by
craze growth prior to cracking, which absorbs fracture energy and effectively increases the
fracture toughness of a polymer. Crazing also occurs with an increase in volume and manifests
throughout the material (unlike shear bands, which may result in necking or striations). In resin
polymers during the damage nucleation process, the interplay between crazing and shear bands
has been observed. Depending on the loading conditions, the presence of local discontinuities,
and other parameters, either one of the failure precursor mechanisms may take over and lead to
failure (Ramsteiner and Ambrust, 2001; Kramer, 1983, Liu and Ghoshal, 2013).
The presence of fiber in rubber-toughened epoxy adds a new level of complexity to the damage
nucleation process. This is the focus of the study in section 3. Daniel and Charewicz (1986)
studied the evolution of damage in graphite/epoxy laminates under fatigue loading. A critical
observation of this research was the determination of a critical damage state (CDS) that caused
the composite material to fail when reached. They considered several damage measures,
including transverse cracks (micro-cracks), longitudinal cracks (micro-cracks), and residual
modulus. Transverse cracks were the most log-linear (linear with log-time), while residual
modulus was significantly nonlinear with a large plateau period. Therefore, transverse cracks
were selected as the damage measure. For a [0/902]s, this was approximately 250 transverse
microcracks/inch. This had been later confirmed through several publications, including in the
summary by Talreja (1999). Micro-cracking in a composite material can be thought of as a
damage precursor, similar to dislocation density in metallics. Other indirect measures of damage
that act as damage precursors also exist, such as electric resistance (Wang et al., 1998; Irving and
4
Thiagarajan, 1998; Weber and Schwartz, 2001), conductivity (Poursartip et al., 1986), and modal
frequencies (Bedewi and Kung, 1997). The resistance and resistivity methods are preferred, as
they require a minimal amount of equipment and post-processing. These methods are also highly
sensitive to early detection of fatigue (at less than 100 cycles) (Wang et al., 1998) and work well
for millions of cycles with minimal drift in measurement accuracy (Seo and Lee, 1999). Bedewi
and Kung (1997) concluded that the 5th
resonant mode of a plate decreased linearly with loading.
This was in contrast to both micro-cracking and resistance, which are logarithmically linear. The
sensitivity resistance parameter, when used as damage precursor, can be significantly improved
by adding nanoparticles, such as carbon nanotubes, (Thostenson and Chou, 2006; Thostenson
and Chou, 2008). Thostenson and Chou (2008) successfully demonstrated real-time monitoring
of fatigue damage accumulation using a composite material with carbon nanotubes dispersed
throughout the matrix.
The suitable damage precursors discussed previously all are governed by a micromechanical
property. For example, micro-cracking is determined by the bonding between the fiber and
matrix as well as the matrix strength. The resistance is a function of the local resistance of the
matrix material, which, in turn, is dependent on applied strain and micro-crack density. In order
to understand how these precursors initiate and evolve, it is important to study the nanoscale. At
this length scale, the polymer morphology can be used to determine the initiation of micro-
cracking through crazing and shear banding (Rottler et al., 2002; Rottler and Robbins, 2003;
Sharma and Socrate, 2009; Buxton and Balazs, 2005). While simulation of micro-length scales
may not be computationally feasible, studying morphology and damage evolution in pure
polymers can provide qualitative information about the evolution of damage. By applying a
series of characterization techniques before, during, and after fatigue testing, comprehensive
evaluation of structural changes throughout the lifetime of a composite test specimen can be
achieved
2.1 Microstructure Damage Evolution
To understand evolution of damage starting at the microscale, the random nature of various
experimental microstructures were studied, 11 independent micrographs in all. Detailed
descriptions of the statistical descriptors used can be found in Liu and Ghoshal (2012). Data from
literature were used in order to span a wide range of material systems and manufacturing
processes and draw conclusions about general composite behavior. The nomenclature, volume
fractions, and sources are referenced in table 1. In each micrograph, the fiber radius and center
position was extracted using a circular Hough transform. Prior to this several of images require
processing, such as unsharpening, in order to achieve reasonable results. This was due to the low
resolution nature of the published images. After the radii and positions were extracted, the results
were manually inspected to check for erroneous fibers. In some cases when the fiber cross
section is elliptical, the detected radius is very much an approximation. Similarly, overlap can
exist when the image is blurry and the radius is over estimated. To remove any overlap, the
radius of intersecting fibers were reduced a pixel at a time until there was no longer interference.
5
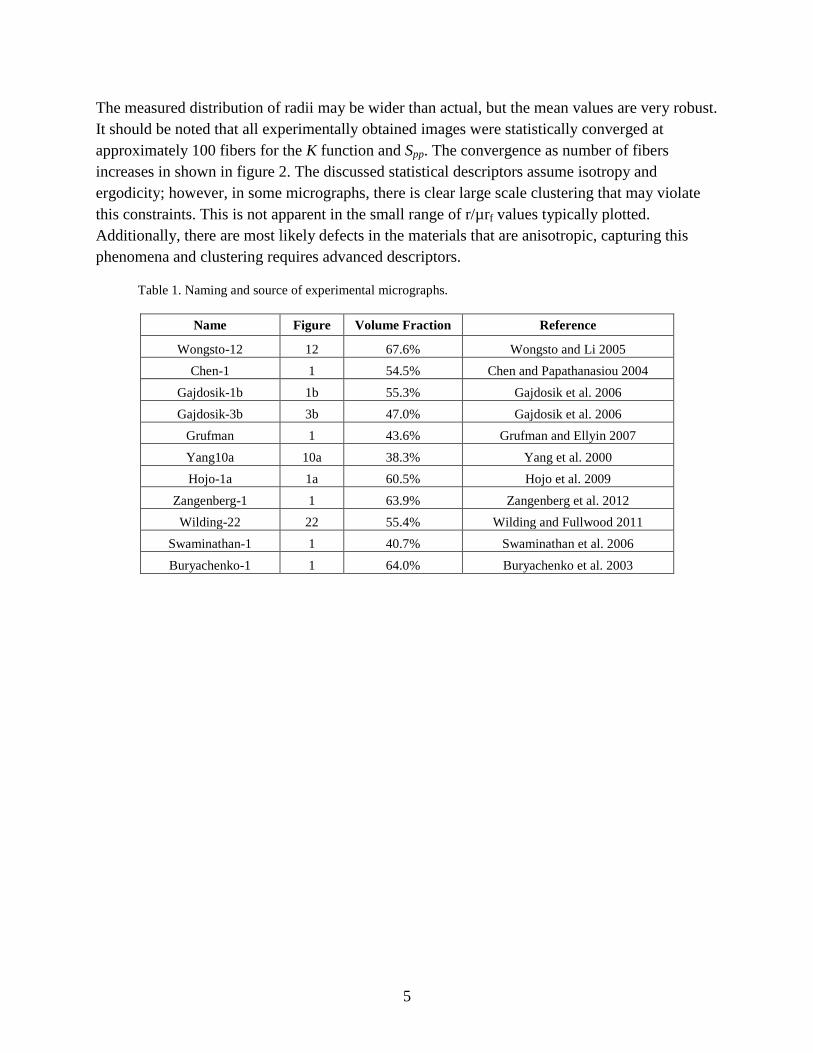
The measured distribution of radii may be wider than actual, but the mean values are very robust.
It should be noted that all experimentally obtained images were statistically converged at
approximately 100 fibers for the K function and Spp. The convergence as number of fibers
increases in shown in figure 2. The discussed statistical descriptors assume isotropy and
ergodicity; however, in some micrographs, there is clear large scale clustering that may violate
this constraints. This is not apparent in the small range of r/µrf values typically plotted.
Additionally, there are most likely defects in the materials that are anisotropic, capturing this
phenomena and clustering requires advanced descriptors.
Table 1. Naming and source of experimental micrographs.
Name Figure Volume Fraction Reference
Wongsto-12 12 67.6% Wongsto and Li 2005
Chen-1 1 54.5% Chen and Papathanasiou 2004
Gajdosik-1b 1b 55.3% Gajdosik et al. 2006
Gajdosik-3b 3b 47.0% Gajdosik et al. 2006
Grufman 1 43.6% Grufman and Ellyin 2007
Yang10a 10a 38.3% Yang et al. 2000
Hojo-1a 1a 60.5% Hojo et al. 2009
Zangenberg-1 1 63.9% Zangenberg et al. 2012
Wilding-22 22 55.4% Wilding and Fullwood 2011
Swaminathan-1 1 40.7% Swaminathan et al. 2006
Buryachenko-1 1 64.0% Buryachenko et al. 2003
6
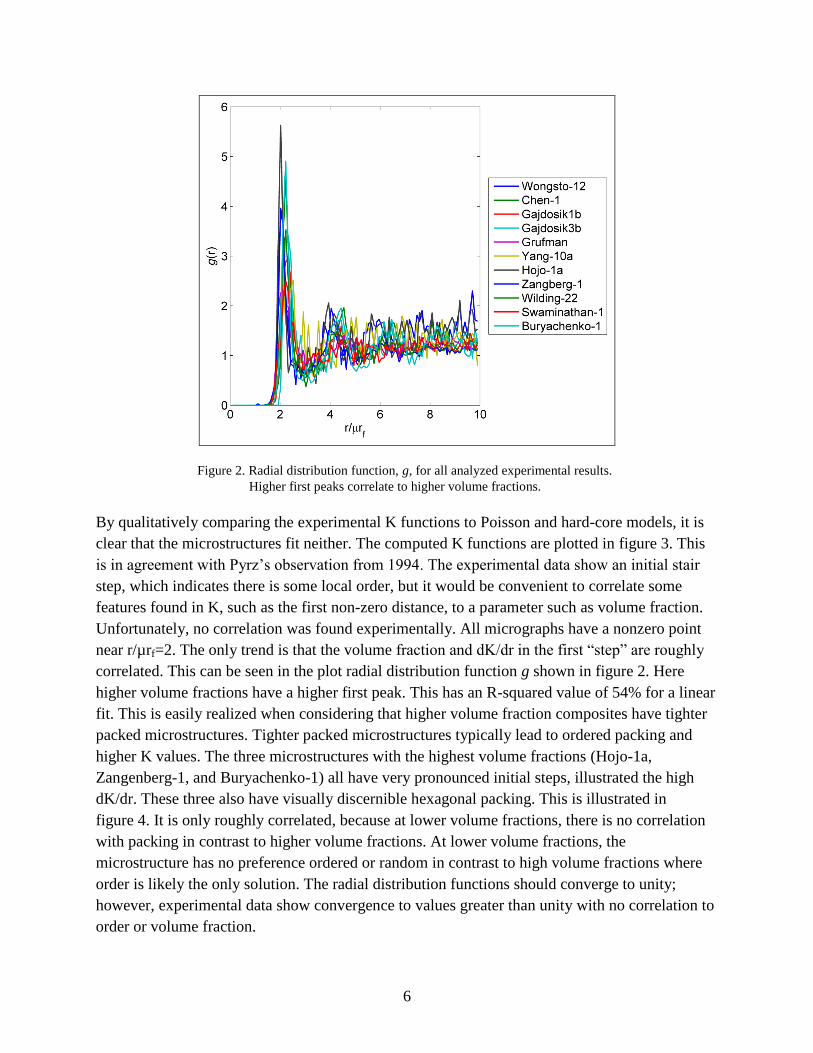
Figure 2. Radial distribution function, g, for all analyzed experimental results.
Higher first peaks correlate to higher volume fractions.
By qualitatively comparing the experimental K functions to Poisson and hard-core models, it is
clear that the microstructures fit neither. The computed K functions are plotted in figure 3. This
is in agreement with Pyrz’s observation from 1994. The experimental data show an initial stair
step, which indicates there is some local order, but it would be convenient to correlate some
features found in K, such as the first non-zero distance, to a parameter such as volume fraction.
Unfortunately, no correlation was found experimentally. All micrographs have a nonzero point
near r/µrf=2. The only trend is that the volume fraction and dK/dr in the first “step” are roughly
correlated. This can be seen in the plot radial distribution function g shown in figure 2. Here
higher volume fractions have a higher first peak. This has an R-squared value of 54% for a linear
fit. This is easily realized when considering that higher volume fraction composites have tighter
packed microstructures. Tighter packed microstructures typically lead to ordered packing and
higher K values. The three microstructures with the highest volume fractions (Hojo-1a,
Zangenberg-1, and Buryachenko-1) all have very pronounced initial steps, illustrated the high
dK/dr. These three also have visually discernible hexagonal packing. This is illustrated in
figure 4. It is only roughly correlated, because at lower volume fractions, there is no correlation
with packing in contrast to higher volume fractions. At lower volume fractions, the
microstructure has no preference ordered or random in contrast to high volume fractions where
order is likely the only solution. The radial distribution functions should converge to unity;
however, experimental data show convergence to values greater than unity with no correlation to
order or volume fraction.
7
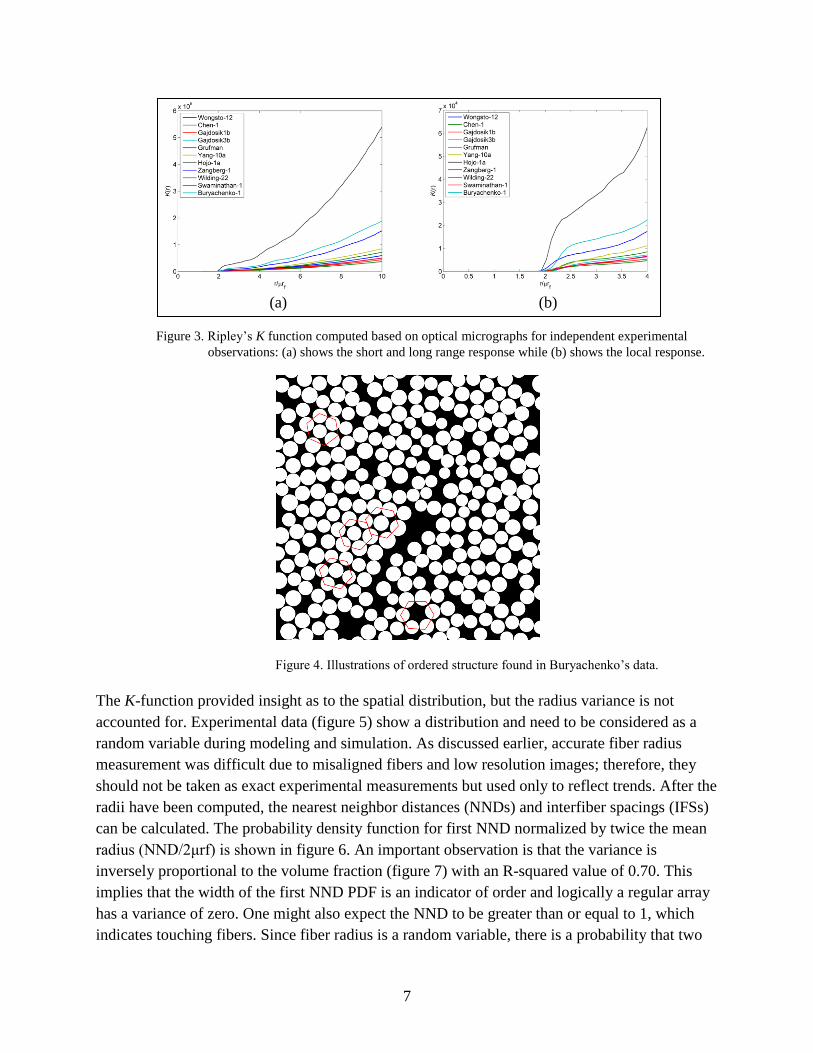
(a) (b)
Figure 3. Ripley’s K function computed based on optical micrographs for independent experimental
observations: (a) shows the short and long range response while (b) shows the local response.
Figure 4. Illustrations of ordered structure found in Buryachenko’s data.
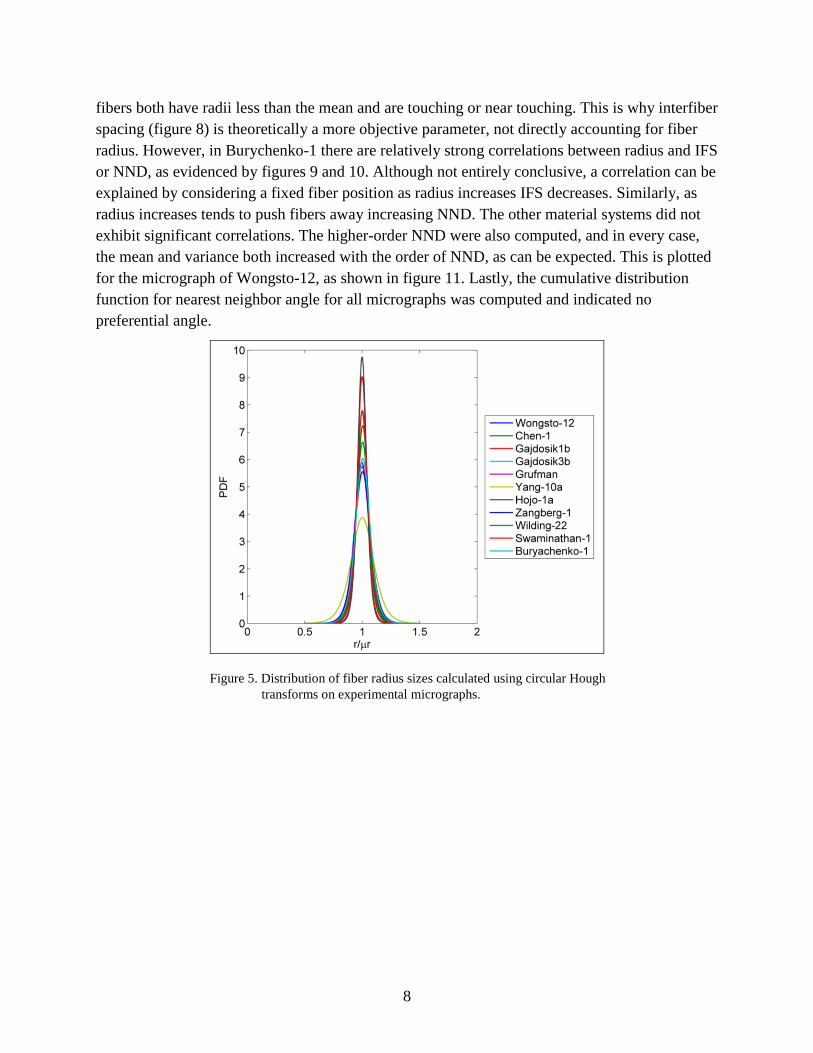
The K-function provided insight as to the spatial distribution, but the radius variance is not
accounted for. Experimental data (figure 5) show a distribution and need to be considered as a
random variable during modeling and simulation. As discussed earlier, accurate fiber radius
measurement was difficult due to misaligned fibers and low resolution images; therefore, they
should not be taken as exact experimental measurements but used only to reflect trends. After the
radii have been computed, the nearest neighbor distances (NNDs) and interfiber spacings (IFSs)
can be calculated. The probability density function for first NND normalized by twice the mean
radius (NND/2μrf) is shown in figure 6. An important observation is that the variance is
inversely proportional to the volume fraction (figure 7) with an R-squared value of 0.70. This
implies that the width of the first NND PDF is an indicator of order and logically a regular array
has a variance of zero. One might also expect the NND to be greater than or equal to 1, which
indicates touching fibers. Since fiber radius is a random variable, there is a probability that two
8
fibers both have radii less than the mean and are touching or near touching. This is why interfiber
spacing (figure 8) is theoretically a more objective parameter, not directly accounting for fiber
radius. However, in Burychenko-1 there are relatively strong correlations between radius and IFS
or NND, as evidenced by figures 9 and 10. Although not entirely conclusive, a correlation can be
explained by considering a fixed fiber position as radius increases IFS decreases. Similarly, as
radius increases tends to push fibers away increasing NND. The other material systems did not
exhibit significant correlations. The higher-order NND were also computed, and in every case,
the mean and variance both increased with the order of NND, as can be expected. This is plotted
for the micrograph of Wongsto-12, as shown in figure 11. Lastly, the cumulative distribution
function for nearest neighbor angle for all micrographs was computed and indicated no
preferential angle.
Figure 5. Distribution of fiber radius sizes calculated using circular Hough
transforms on experimental micrographs.
9
Figure 6. NNDs normalized by twice the average radius.
Figure 7. Correlation between volume fraction of the composite (Sf) and variance in NND.
10
Figure 8. Experimentally measured distribution of IFS backcalculated using NNDs and radii.
Figure 9. Correlation between IFS and radius illustrating the covariance. A small negative correlation can be
expected for IFS, which is present in most of the analyzed cases.
Figure 10. Correlation between NND and radius illustrating its covariance. A positive correlation is expected,
however not readily observed in the data.
11
Figure 11. Relationship between the mean and variance and nth nearest neighbor for the
case of Wongsto-12.
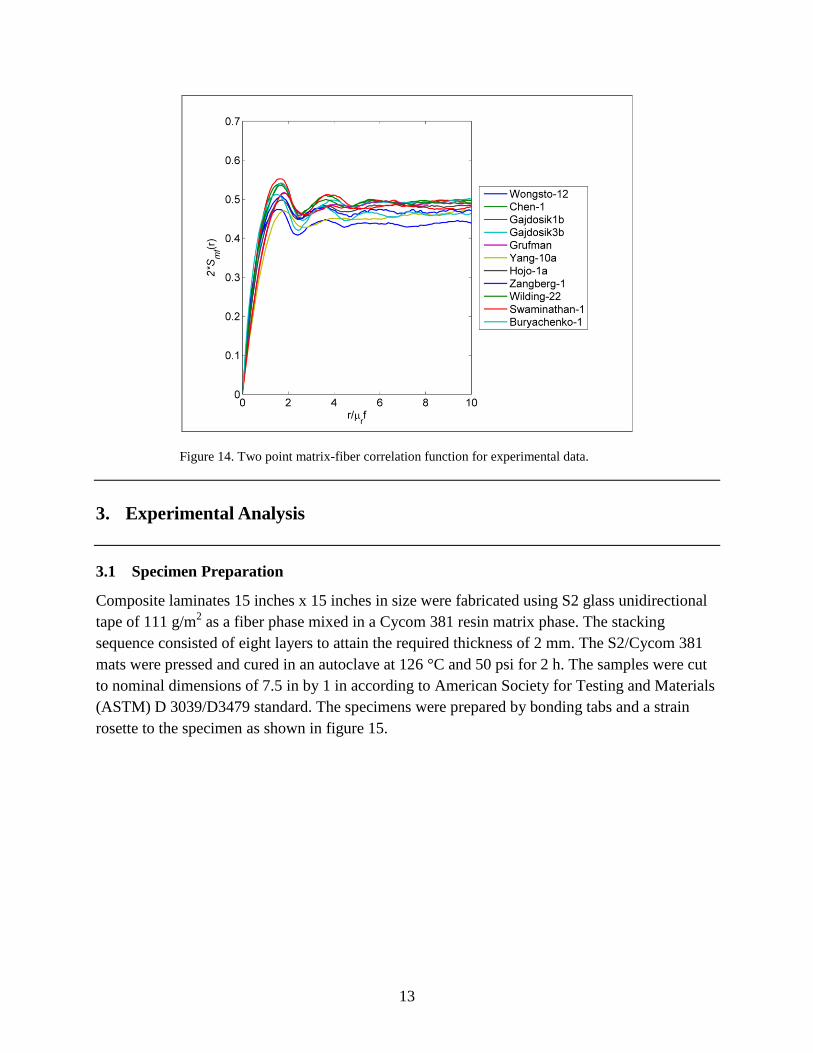
The second-order autocorrelation function, Sff, all exhibit an initial valley followed by a peak and
slow convergence to Sf2 (figure 12), with the exception of Yang-10a, which is continuously
decaying. Yang-10a has a clear partition in the microstructure leading to clumping in the left and
right sides of the image. This would indicate that Sff should have dependence on θ, which is not
the case since Sff is based on an isotropic assumption. There is variation in θ as r approaches ∞,
but it appears more likely to be noise. Figures 13 and 14 show the corresponding Smm and Smf .
The computation time for Sff was significantly longer than K and g. In the same computation,
K,g, NND, and IFS can all be calculated making point processes and efficient descriptor.
12
Figure 12. Two point fiber-fiber correlation function for experimental data.
Figure 13. Two point matrix-matrix correlation function for experimental data.
13
Figure 14. Two point matrix-fiber correlation function for experimental data.
3. Experimental Analysis
3.1 Specimen Preparation
Composite laminates 15 inches x 15 inches in size were fabricated using S2 glass unidirectional
tape of 111 g/m2 as a fiber phase mixed in a Cycom 381 resin matrix phase. The stacking
sequence consisted of eight layers to attain the required thickness of 2 mm. The S2/Cycom 381
mats were pressed and cured in an autoclave at 126 °C and 50 psi for 2 h. The samples were cut
to nominal dimensions of 7.5 in by 1 in according to American Society for Testing and Materials
(ASTM) D 3039/D3479 standard. The specimens were prepared by bonding tabs and a strain
rosette to the specimen as shown in figure 15.
14
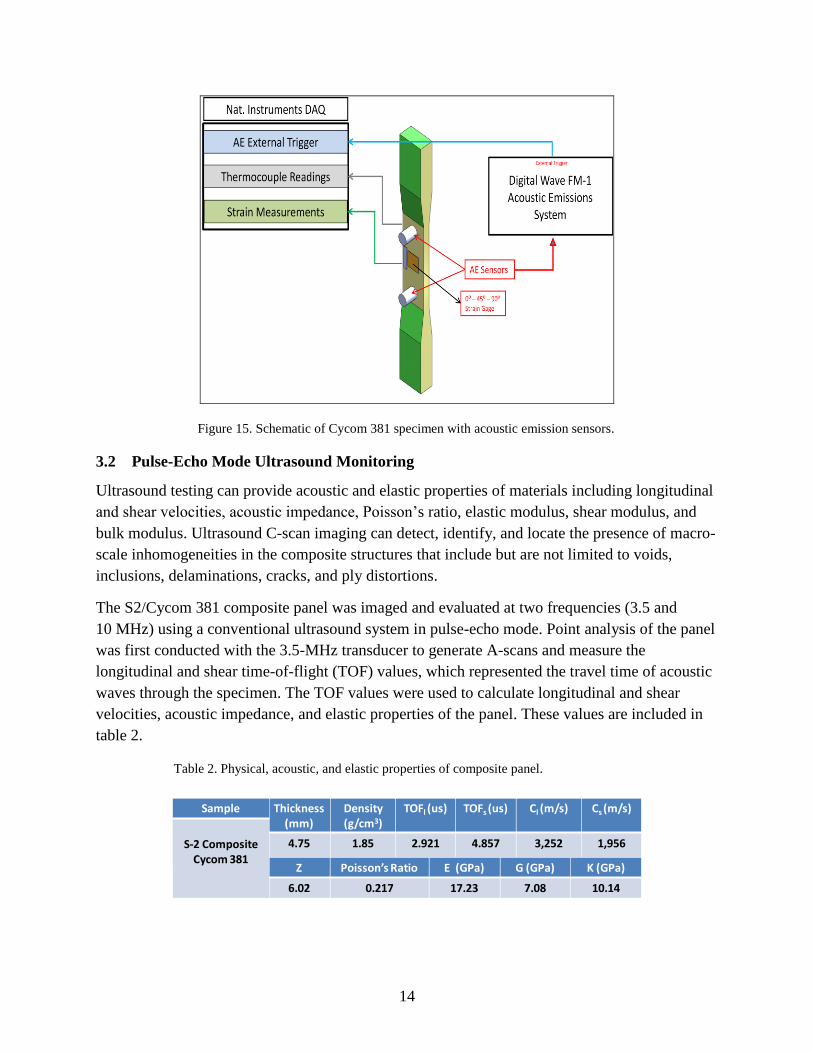
Figure 15. Schematic of Cycom 381 specimen with acoustic emission sensors.
3.2 Pulse-Echo Mode Ultrasound Monitoring
Ultrasound testing can provide acoustic and elastic properties of materials including longitudinal
and shear velocities, acoustic impedance, Poisson’s ratio, elastic modulus, shear modulus, and
bulk modulus. Ultrasound C-scan imaging can detect, identify, and locate the presence of macro-
scale inhomogeneities in the composite structures that include but are not limited to voids,
inclusions, delaminations, cracks, and ply distortions.
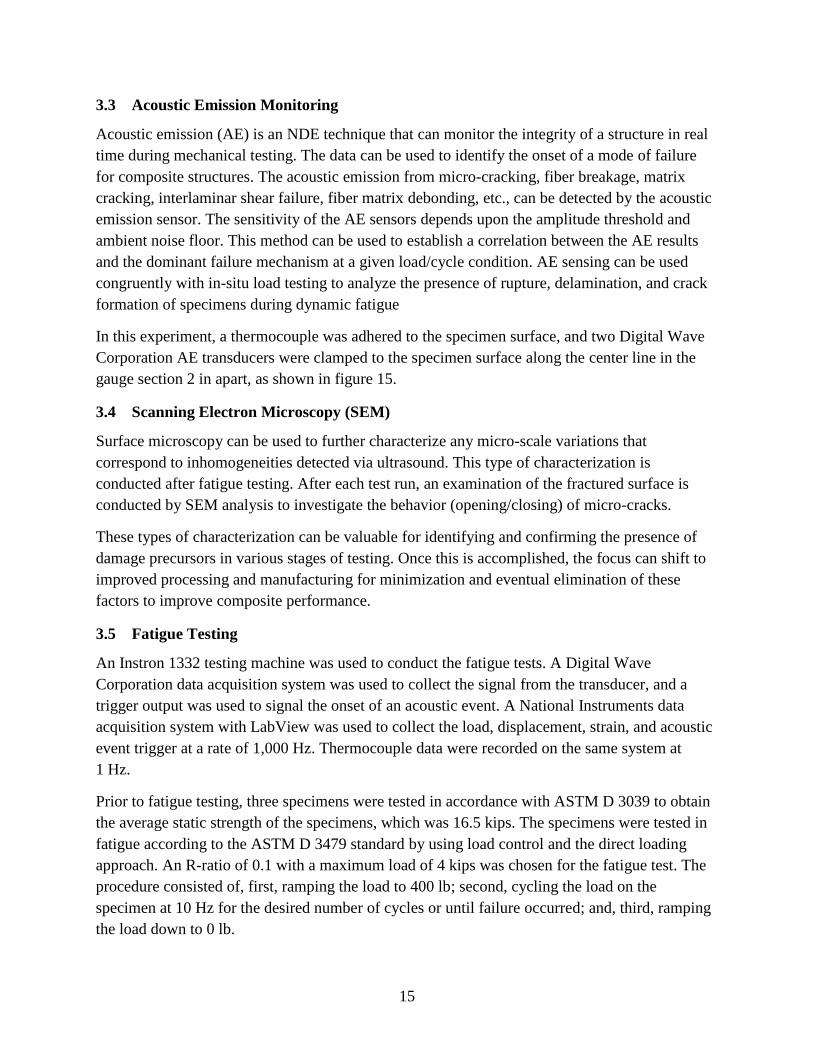
The S2/Cycom 381 composite panel was imaged and evaluated at two frequencies (3.5 and
10 MHz) using a conventional ultrasound system in pulse-echo mode. Point analysis of the panel
was first conducted with the 3.5-MHz transducer to generate A-scans and measure the
longitudinal and shear time-of-flight (TOF) values, which represented the travel time of acoustic
waves through the specimen. The TOF values were used to calculate longitudinal and shear
velocities, acoustic impedance, and elastic properties of the panel. These values are included in
table 2.
Table 2. Physical, acoustic, and elastic properties of composite panel.
Sample Thickness (mm)
Density (g/cm3)
TOFl (us) TOFs (us) Cl (m/s) Cs (m/s)
S-2 Composite Cycom 381
4.75 1.85 2.921 4.857 3,252 1,956
Z Poisson’s Ratio E (GPa) G (GPa) K (GPa)
6.02 0.217 17.23 7.08 10.14
Sample
S-2 Composite Cycom 381
15
3.3 Acoustic Emission Monitoring
Acoustic emission (AE) is an NDE technique that can monitor the integrity of a structure in real
time during mechanical testing. The data can be used to identify the onset of a mode of failure
for composite structures. The acoustic emission from micro-cracking, fiber breakage, matrix
cracking, interlaminar shear failure, fiber matrix debonding, etc., can be detected by the acoustic
emission sensor. The sensitivity of the AE sensors depends upon the amplitude threshold and
ambient noise floor. This method can be used to establish a correlation between the AE results
and the dominant failure mechanism at a given load/cycle condition. AE sensing can be used
congruently with in-situ load testing to analyze the presence of rupture, delamination, and crack
formation of specimens during dynamic fatigue
In this experiment, a thermocouple was adhered to the specimen surface, and two Digital Wave
Corporation AE transducers were clamped to the specimen surface along the center line in the
gauge section 2 in apart, as shown in figure 15.
3.4 Scanning Electron Microscopy (SEM)
Surface microscopy can be used to further characterize any micro-scale variations that
correspond to inhomogeneities detected via ultrasound. This type of characterization is
conducted after fatigue testing. After each test run, an examination of the fractured surface is
conducted by SEM analysis to investigate the behavior (opening/closing) of micro-cracks.
These types of characterization can be valuable for identifying and confirming the presence of
damage precursors in various stages of testing. Once this is accomplished, the focus can shift to
improved processing and manufacturing for minimization and eventual elimination of these
factors to improve composite performance.
3.5 Fatigue Testing
An Instron 1332 testing machine was used to conduct the fatigue tests. A Digital Wave
Corporation data acquisition system was used to collect the signal from the transducer, and a
trigger output was used to signal the onset of an acoustic event. A National Instruments data
acquisition system with LabView was used to collect the load, displacement, strain, and acoustic
event trigger at a rate of 1,000 Hz. Thermocouple data were recorded on the same system at
1 Hz.
Prior to fatigue testing, three specimens were tested in accordance with ASTM D 3039 to obtain
the average static strength of the specimens, which was 16.5 kips. The specimens were tested in
fatigue according to the ASTM D 3479 standard by using load control and the direct loading
approach. An R-ratio of 0.1 with a maximum load of 4 kips was chosen for the fatigue test. The
procedure consisted of, first, ramping the load to 400 lb; second, cycling the load on the
specimen at 10 Hz for the desired number of cycles or until failure occurred; and, third, ramping
the load down to 0 lb.
16
4. Results and Discussion
Ultrasonic NDE uses acoustic energy to detect material variations and inhomogeneities that may
be present in a test specimen. As the acoustic waves are transmitted into the specimen, any
material change will result in an acoustic impedance mismatch that causes reflection of the
waves. Material changes may include unintentional processing defects such as pores, inclusions,
cracks, or delaminations in the specimen. They may also include multi-material structural
features such as multiple stacked ply or bond layers. In amplitude scans (A-scans), the reflected
signals are graphically displayed as a function of time in s (x-axis) and amplitude in mV
(y-axis) at a single point location. In C-scan images, selected, or gated, A-scan reflected signals
are spatially mapped to form a visual plot of acoustic differences through the bulk of the sample.
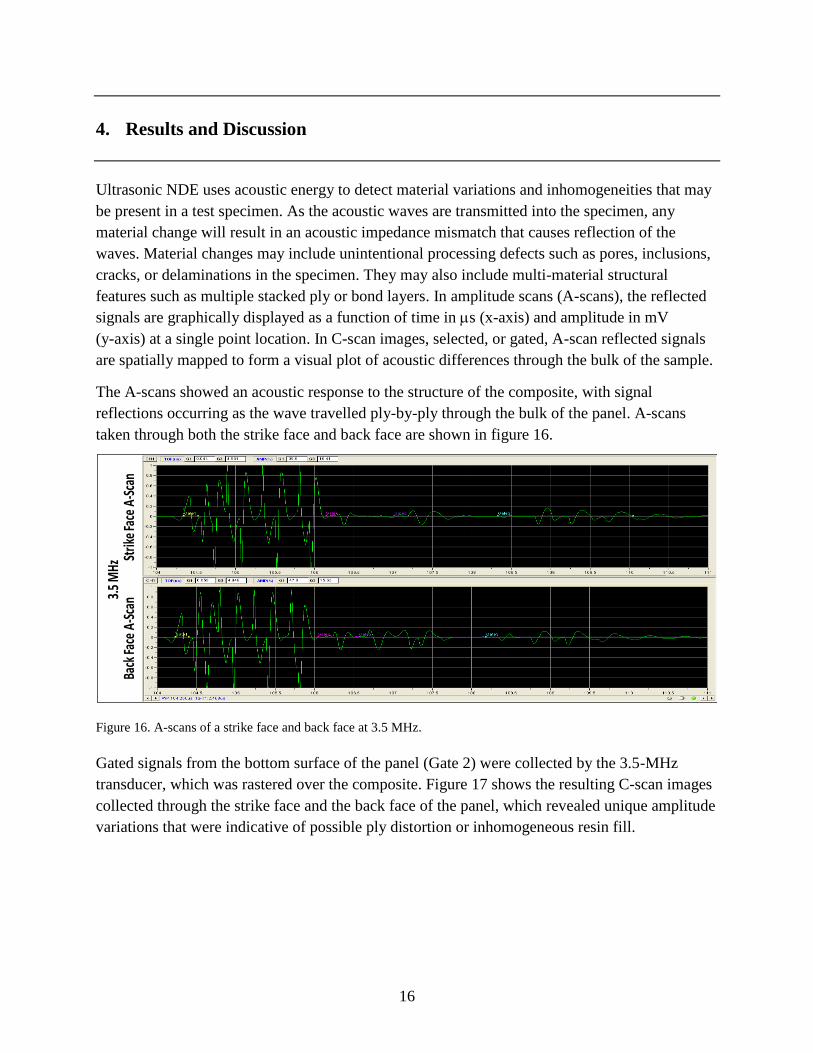
The A-scans showed an acoustic response to the structure of the composite, with signal
reflections occurring as the wave travelled ply-by-ply through the bulk of the panel. A-scans
taken through both the strike face and back face are shown in figure 16.
Figure 16. A-scans of a strike face and back face at 3.5 MHz.
Gated signals from the bottom surface of the panel (Gate 2) were collected by the 3.5-MHz
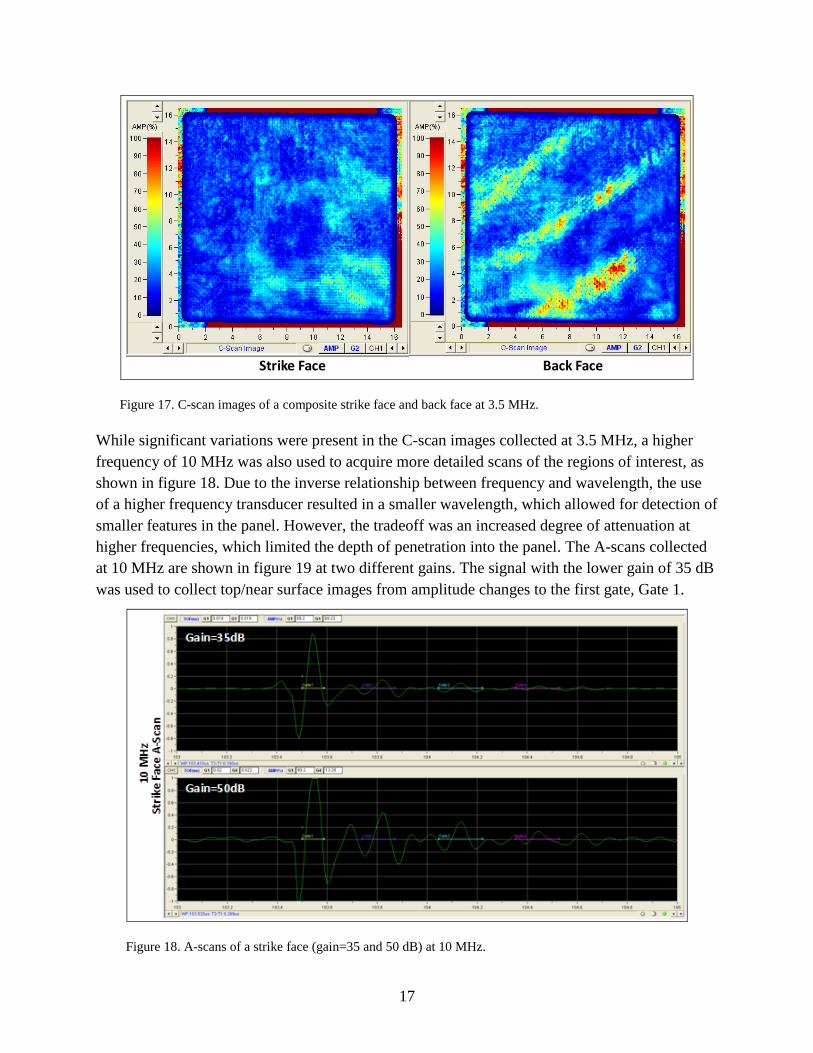
transducer, which was rastered over the composite. Figure 17 shows the resulting C-scan images
collected through the strike face and the back face of the panel, which revealed unique amplitude
variations that were indicative of possible ply distortion or inhomogeneous resin fill.
Strik
e Fac
e A-
Scan
Back
Face
A-S
can3.
5 M
Hz
17
Figure 17. C-scan images of a composite strike face and back face at 3.5 MHz.
While significant variations were present in the C-scan images collected at 3.5 MHz, a higher
frequency of 10 MHz was also used to acquire more detailed scans of the regions of interest, as
shown in figure 18. Due to the inverse relationship between frequency and wavelength, the use
of a higher frequency transducer resulted in a smaller wavelength, which allowed for detection of
smaller features in the panel. However, the tradeoff was an increased degree of attenuation at
higher frequencies, which limited the depth of penetration into the panel. The A-scans collected
at 10 MHz are shown in figure 19 at two different gains. The signal with the lower gain of 35 dB
was used to collect top/near surface images from amplitude changes to the first gate, Gate 1.
Figure 18. A-scans of a strike face (gain=35 and 50 dB) at 10 MHz.
Strike Face Back Face
18
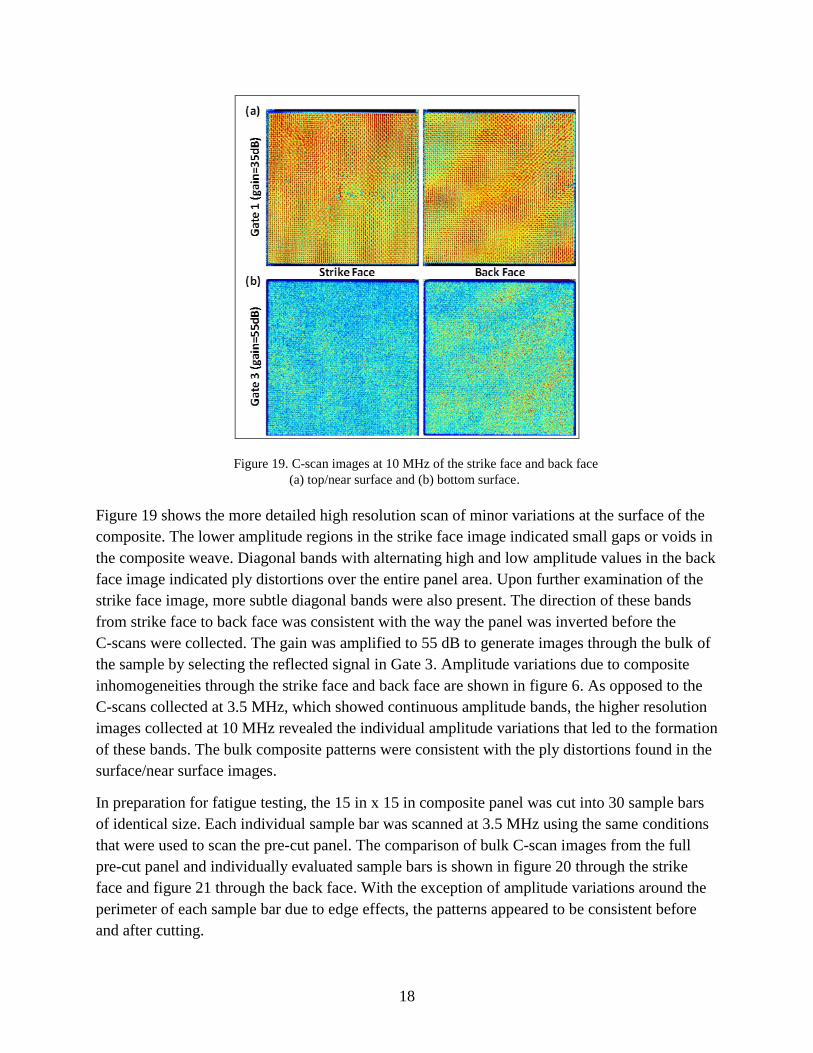
Figure 19. C-scan images at 10 MHz of the strike face and back face
(a) top/near surface and (b) bottom surface.
Figure 19 shows the more detailed high resolution scan of minor variations at the surface of the
composite. The lower amplitude regions in the strike face image indicated small gaps or voids in
the composite weave. Diagonal bands with alternating high and low amplitude values in the back
face image indicated ply distortions over the entire panel area. Upon further examination of the
strike face image, more subtle diagonal bands were also present. The direction of these bands
from strike face to back face was consistent with the way the panel was inverted before the
C-scans were collected. The gain was amplified to 55 dB to generate images through the bulk of
the sample by selecting the reflected signal in Gate 3. Amplitude variations due to composite
inhomogeneities through the strike face and back face are shown in figure 6. As opposed to the
C-scans collected at 3.5 MHz, which showed continuous amplitude bands, the higher resolution
images collected at 10 MHz revealed the individual amplitude variations that led to the formation
of these bands. The bulk composite patterns were consistent with the ply distortions found in the
surface/near surface images.
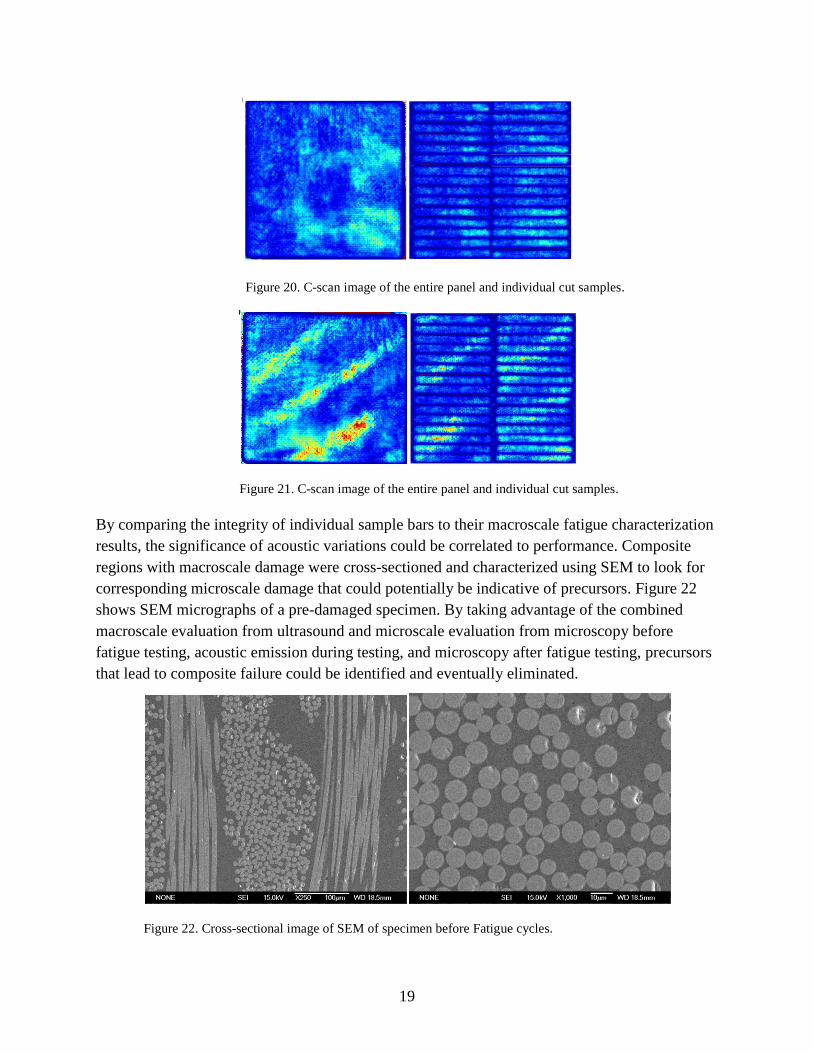
In preparation for fatigue testing, the 15 in x 15 in composite panel was cut into 30 sample bars
of identical size. Each individual sample bar was scanned at 3.5 MHz using the same conditions
that were used to scan the pre-cut panel. The comparison of bulk C-scan images from the full
pre-cut panel and individually evaluated sample bars is shown in figure 20 through the strike
face and figure 21 through the back face. With the exception of amplitude variations around the
perimeter of each sample bar due to edge effects, the patterns appeared to be consistent before
and after cutting.
19
Figure 20. C-scan image of the entire panel and individual cut samples.
Figure 21. C-scan image of the entire panel and individual cut samples.
By comparing the integrity of individual sample bars to their macroscale fatigue characterization
results, the significance of acoustic variations could be correlated to performance. Composite
regions with macroscale damage were cross-sectioned and characterized using SEM to look for
corresponding microscale damage that could potentially be indicative of precursors. Figure 22
shows SEM micrographs of a pre-damaged specimen. By taking advantage of the combined
macroscale evaluation from ultrasound and microscale evaluation from microscopy before
fatigue testing, acoustic emission during testing, and microscopy after fatigue testing, precursors
that lead to composite failure could be identified and eventually eliminated.
Figure 22. Cross-sectional image of SEM of specimen before Fatigue cycles.
(b)
20
5. Fatigue Testing
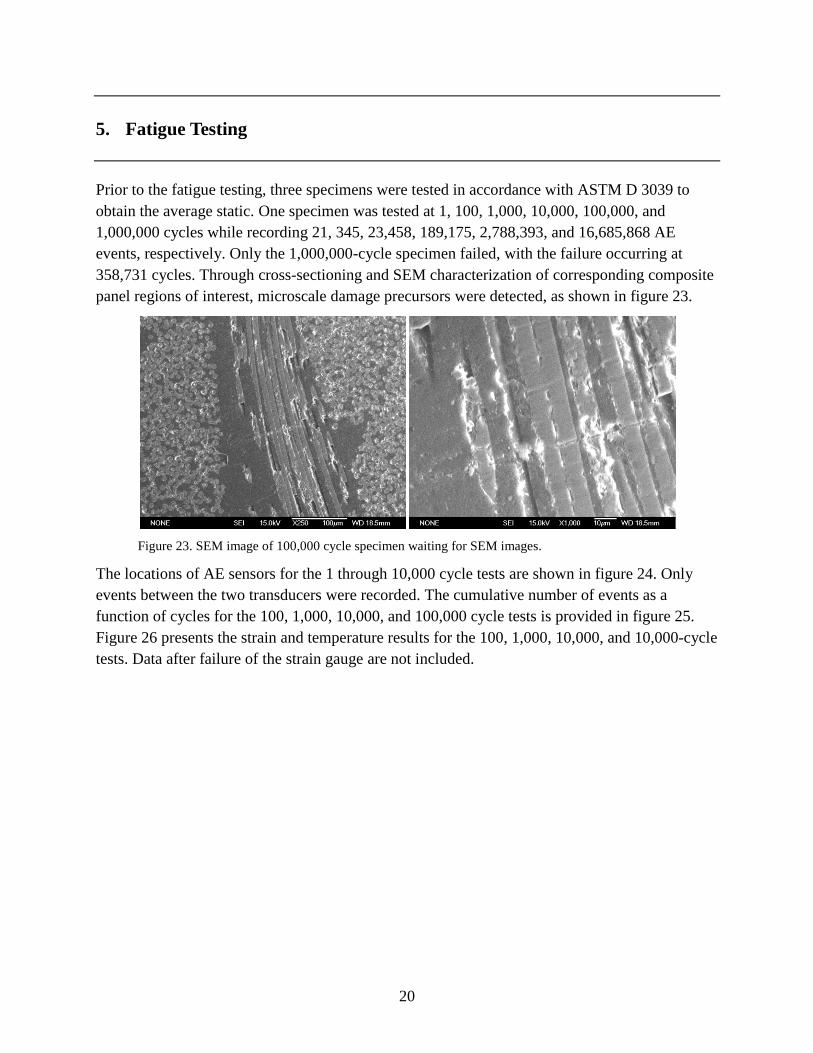
Prior to the fatigue testing, three specimens were tested in accordance with ASTM D 3039 to
obtain the average static. One specimen was tested at 1, 100, 1,000, 10,000, 100,000, and
1,000,000 cycles while recording 21, 345, 23,458, 189,175, 2,788,393, and 16,685,868 AE
events, respectively. Only the 1,000,000-cycle specimen failed, with the failure occurring at
358,731 cycles. Through cross-sectioning and SEM characterization of corresponding composite
panel regions of interest, microscale damage precursors were detected, as shown in figure 23.
Figure 23. SEM image of 100,000 cycle specimen waiting for SEM images.
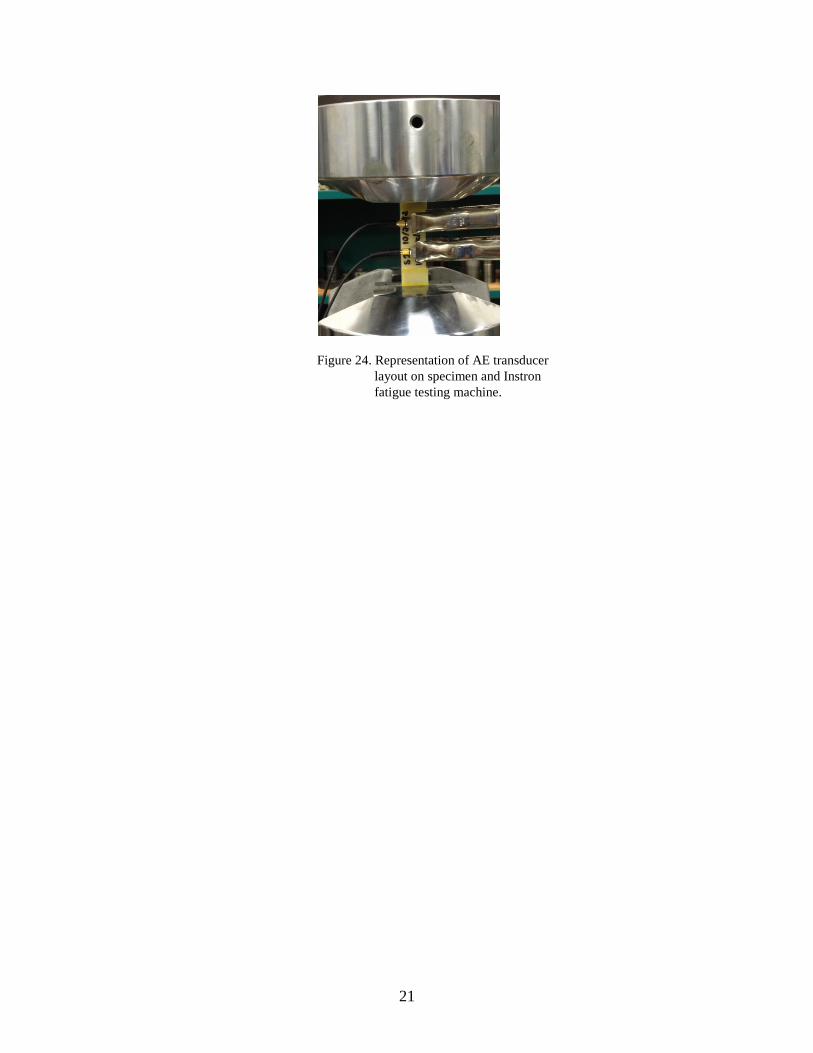
The locations of AE sensors for the 1 through 10,000 cycle tests are shown in figure 24. Only
events between the two transducers were recorded. The cumulative number of events as a
function of cycles for the 100, 1,000, 10,000, and 100,000 cycle tests is provided in figure 25.
Figure 26 presents the strain and temperature results for the 100, 1,000, 10,000, and 10,000-cycle
tests. Data after failure of the strain gauge are not included.
21
Figure 24. Representation of AE transducer
layout on specimen and Instron
fatigue testing machine.
22
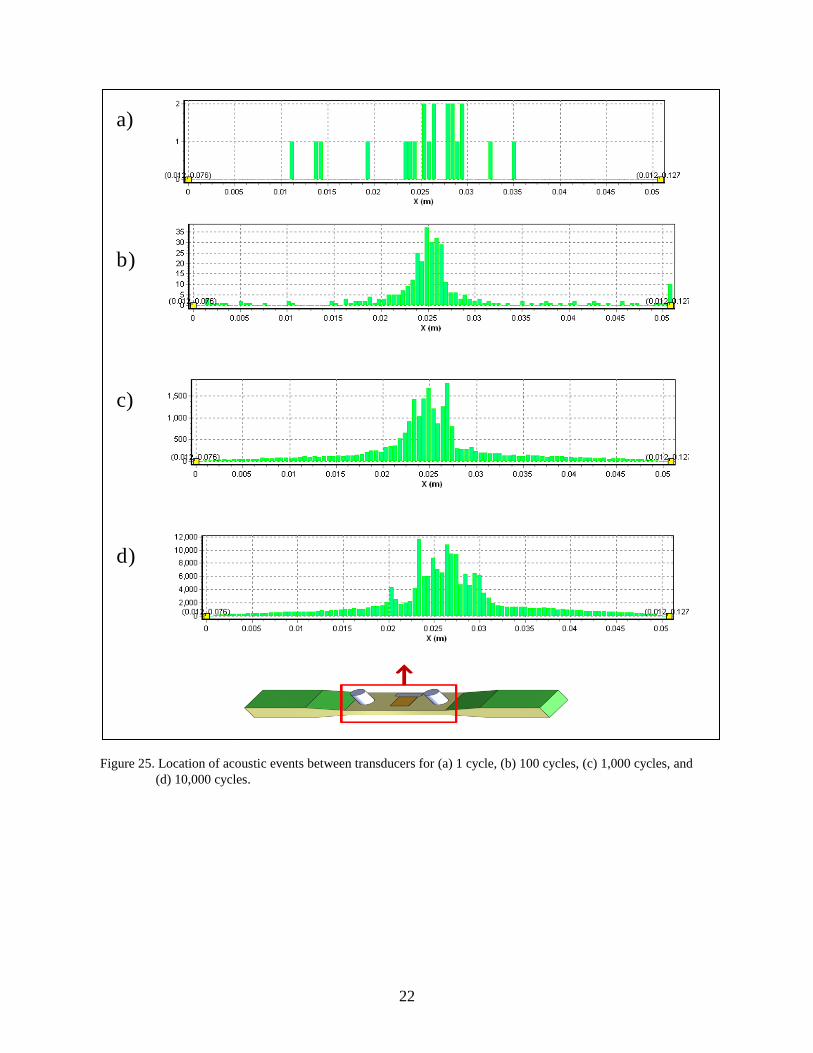
Figure 25. Location of acoustic events between transducers for (a) 1 cycle, (b) 100 cycles, (c) 1,000 cycles, and
(d) 10,000 cycles.
a)
c)
b)
d)
Figure 22 Location of AE events between transducers for a) 1
cycle, b) 100 cycles c) 1,000 cycles, d) 10,000 cycles
23
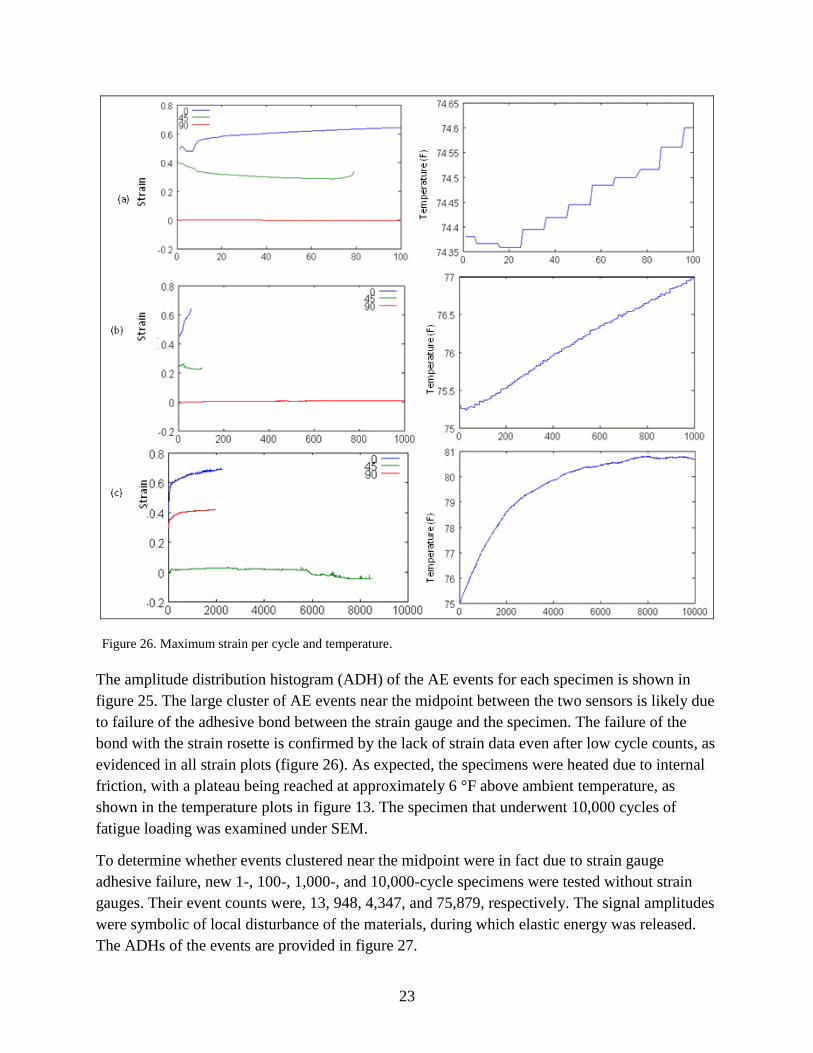
Figure 26. Maximum strain per cycle and temperature.
The amplitude distribution histogram (ADH) of the AE events for each specimen is shown in
figure 25. The large cluster of AE events near the midpoint between the two sensors is likely due
to failure of the adhesive bond between the strain gauge and the specimen. The failure of the
bond with the strain rosette is confirmed by the lack of strain data even after low cycle counts, as
evidenced in all strain plots (figure 26). As expected, the specimens were heated due to internal
friction, with a plateau being reached at approximately 6 °F above ambient temperature, as
shown in the temperature plots in figure 13. The specimen that underwent 10,000 cycles of
fatigue loading was examined under SEM.
To determine whether events clustered near the midpoint were in fact due to strain gauge
adhesive failure, new 1-, 100-, 1,000-, and 10,000-cycle specimens were tested without strain
gauges. Their event counts were, 13, 948, 4,347, and 75,879, respectively. The signal amplitudes
were symbolic of local disturbance of the materials, during which elastic energy was released.
The ADHs of the events are provided in figure 27.
24
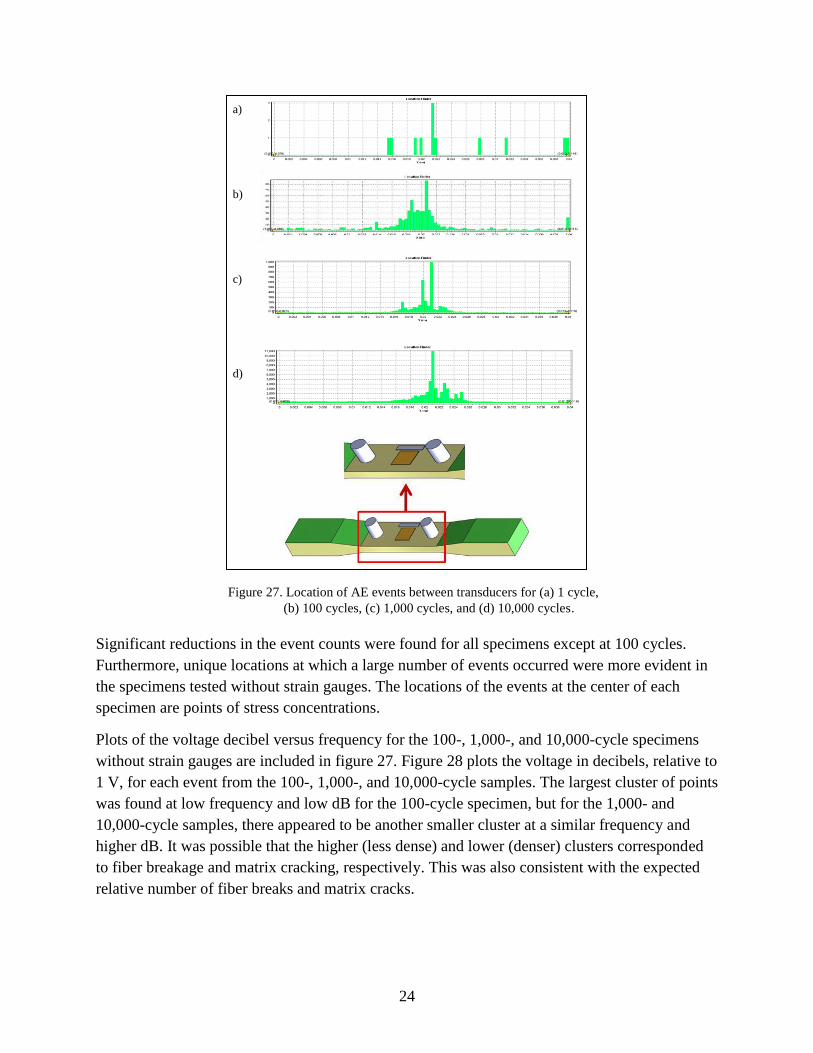
Figure 27. Location of AE events between transducers for (a) 1 cycle,
(b) 100 cycles, (c) 1,000 cycles, and (d) 10,000 cycles.
Significant reductions in the event counts were found for all specimens except at 100 cycles.
Furthermore, unique locations at which a large number of events occurred were more evident in
the specimens tested without strain gauges. The locations of the events at the center of each
specimen are points of stress concentrations.
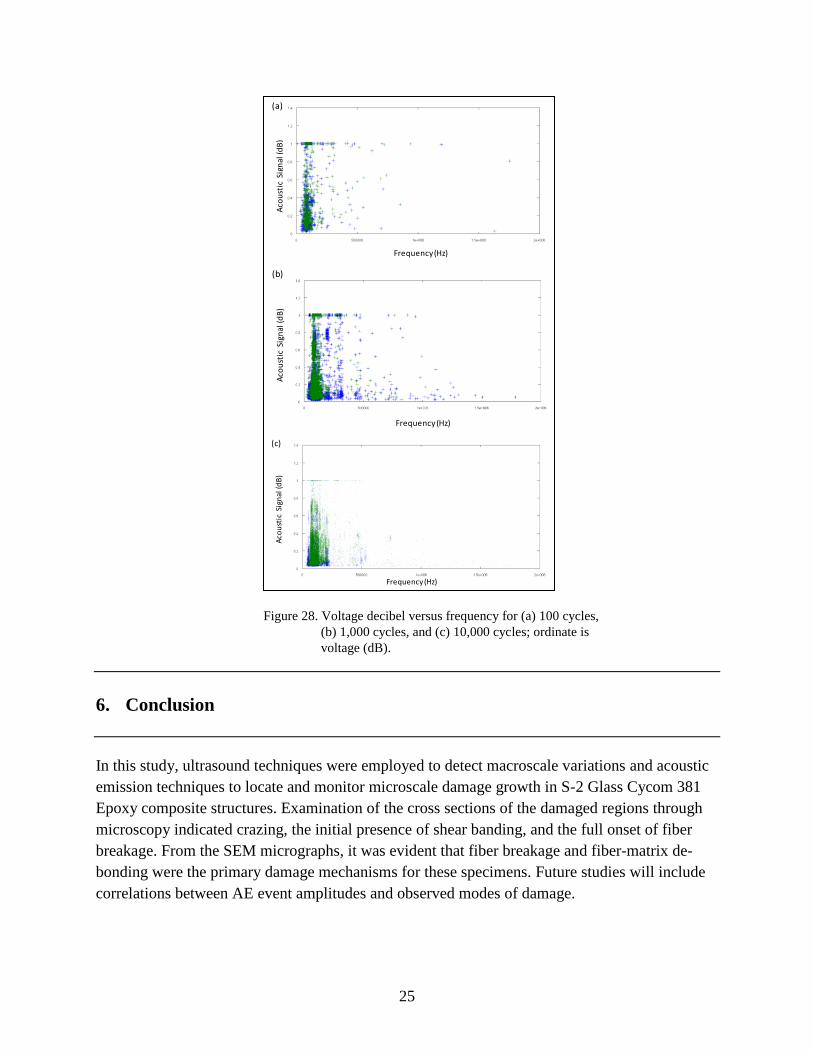
Plots of the voltage decibel versus frequency for the 100-, 1,000-, and 10,000-cycle specimens
without strain gauges are included in figure 27. Figure 28 plots the voltage in decibels, relative to
1 V, for each event from the 100-, 1,000-, and 10,000-cycle samples. The largest cluster of points
was found at low frequency and low dB for the 100-cycle specimen, but for the 1,000- and
10,000-cycle samples, there appeared to be another smaller cluster at a similar frequency and
higher dB. It was possible that the higher (less dense) and lower (denser) clusters corresponded
to fiber breakage and matrix cracking, respectively. This was also consistent with the expected
relative number of fiber breaks and matrix cracks.
a)
c)
b)
d)
25
Figure 28. Voltage decibel versus frequency for (a) 100 cycles,
(b) 1,000 cycles, and (c) 10,000 cycles; ordinate is
voltage (dB).
6. Conclusion
In this study, ultrasound techniques were employed to detect macroscale variations and acoustic
emission techniques to locate and monitor microscale damage growth in S-2 Glass Cycom 381
Epoxy composite structures. Examination of the cross sections of the damaged regions through
microscopy indicated crazing, the initial presence of shear banding, and the full onset of fiber
breakage. From the SEM micrographs, it was evident that fiber breakage and fiber-matrix de-
bonding were the primary damage mechanisms for these specimens. Future studies will include
correlations between AE event amplitudes and observed modes of damage.
Aco
ust
ic S
ign
al(d
B)
Frequency(Hz)
(a)
Aco
ust
ic S
ign
al(d
B)
Frequency(Hz)
(b)
(b)
Aco
ust
ic S
ign
al(d
B)
Frequency(Hz)
(c)
26
7. References
Baker, T. FVL-Medium S&T Investment Strategy (Power and O&S Focus Areas), Herndon, VA,
May 10–11, 2012.
Bedewi, N. E.; Kung, D. N. Effect of Fatigue Loading on the Modal Properties of Composite
Structures and its Utilization for Prediction of Residual Life. Composite Structures 1997,
37.3, 357–371.
Buxton, G. A.; Balazs, A. C. Micromechanical Simulation of the Deformation and Fracture of
Polymer Blends. Macromolecules 2005, 38.2, 488–500.
Cantrell, J. H. Quantitative Assessment of Fatigue Damage Accumulation in Wavy Slip Metals
from Acoustic Harmonic Generation, Publication Year: 2006, Document ID: 20080014272,
NASA Langley Research Center, Hampton, VA.
http://ntrs.nasa.gov/archive/nasa/casi.ntrs.nasa.gov/20080014272_2008014221.pdf.
Christodoulou, L.; Larsen, J. M. Using Materials Prognosis to Maximize the Utilization Potential
of Complex Mechanical Systems. Journal of the Minerals, Metals, and Materials Society
March 2004, 56 (3), 15–19.
Daniel, I. M.; Charewicz, A. Fatigue Damage Mechanisms and Residual Properties of
Graphite/Epoxy Laminates. Engineering Fracture Mechanics 1986, 25.5, 793–808.
Larsen, J. M. et al. Understanding Materials Uncertainty for Prognosis of ATE Materials;
AFRL-RX-WP-TP-2010-4139; April 2010.
Larsen, J. et al. Opportunities and Challenges in Damage Prognosis for Materials and Structures
in Complex Systems, AFOSR Discovery Challenge Thrust (DCT) Workshop on Prognosis of
Aircraft and Space Devices, Components and Systems, Cincinnati, Ohio, Feb 19–20, 2008.
Lindgren, E. Materials State Awareness for Structures: Needs and Challenges, AA&S
Conference, San Diego, CA, April 2011.
Poursartip, A.; Ashby, M. F.; Beaumont, P.W.R. The Fatigue Damage Mechanics of a Carbon
Fibre Composite Laminate: I—Development of the Model. Composites Science and
Technology 1986, 25.3, 193–218.
Rottler, J.; Barsky, S.; Robbins, M. O. Cracks and Crazes: On Calculating the Macroscopic
Fracture Energy of Glassy Polymers from Molecular Simulations. Physical Review Letters
2002, 89.14, 148304.
Rottler, J.; Robbins, M. O. Growth, Microstructure, and Failure of Crazes in Glassy Polymers.
Physical Review E 2003, 68.1, 011801.
27
Seo, D.-C.; Lee, J.-J. Damage Detection of CFRP Laminates Using Electrical Resistance
Measurement and Neural Network. Composite Structures 1999, 47.1, 525–530.
Sharma, R.; Socrate, S. Micromechanics of Uniaxial Tensile Deformation and Failure in High
Impact Polystyrene (HIPS). Polymer 2009, 50.14, 3386–3395.
Talreja, R. Damage Mechanics and Fatigue Life Assessment of Composite Materials.
International Journal of Damage Mechanics 1999, 8.4, 339–354.
Thostenson, E. T.; Chou, T.-W. Real-time In Situ Sensing of Damage Evolution in Advanced
Fiber Composites Using Carbon Nanotube Networks. Nanotechnology 2008, 19.21, 215713.
Thostenson, E. T.; Chou, T.‐W. Carbon Nanotube Networks: Sensing of Distributed Strain and
Damage for Life Prediction and Self Healing. Advanced Materials 2006, 18.21, 2837–2841.
Wang, S. et al. Early Fatigue Damage in Carbon-Fibre Composites Observed by Electrical
Resistance Measurement. Journal of Materials Science 1998, 33.15, 3875–3884.
Weber, I.; Schwartz, P. Monitoring Bending Fatigue in Carbon-Fibre/Epoxy Composite Strands:
A Comparison Between Mechanical and Resistance Techniques. Composites Science and
Technology 2001, 61.6, 849–853.
Buryachenko, V. A. et al. Quantitative Description and Numerical Simulation of Random
Microstructures of Composites and Their Effective Elastic Moduli. International Journal of
Solids and Structures 2003, 40.1, 47–72.
Chen, X.; Papathanasiou, T. D. Interface Stress Distributions in Transversely Loaded Continuous
Fiber Composites: Parallel Computation in Multi-Fiber RVEs Using the Boundary Element
Method. Composites Science and Technology 2004, 64.9, 1101–1114.
Gajdošík, J.; Zeman, J.; Šejnoha, M. Qualitative Analysis of Fiber Composite Microstructure:
Influence of Boundary Conditions. Probabilistic Engineering Mechanics 2006, 21.4, 317–
329.
Grufman, C.; Ellyin, F. Determining a Representative Volume Element Capturing the
Morphology of Fibre Reinforced Polymer Composites. Composites Science and Technology
2007, 67.3, 766–775.
Hojo, M. et al. Effect of Fiber Array Irregularities on Microscopic Interfacial Normal Stress
States of Transversely Loaded UD-CFRP from Viewpoint of Failure Initiation. Composites
Science and Technology 2009, 69.11, 1726–1734.
Irving, P. E.; Thiagarajan, C. Fatigue Damage Characterization in Carbon Fibre Composite
Materials Using an Electrical Potential Technique. Smart Materials and Structures 1999, 7.4,
456.
28
Kramer, E. J. Microscopic and Molecular Fundamentals of Crazing. Crazing in Polymers ed:. H.
H. Kausch, Springer Verlag, Berlin, 1983 pp 1–57.
Liu, K. C.; Ghoshal, A. Validity of Random Microstructures Simulation in Fiber Reinforced
Composite Materials. Composites Part B: Engineering August 20, 2013,
http://dx.doi.org/10.1016/j.compositesb.2013.08.006.
Pyrz, R. Quantitative Description of the Microstructure of Composites. Part I: Morphology of
Unidirectional Composite Systems. Composites Science and Technology 1994, 50.2, 197–
208.
Ramsteiner, F.; Ambrust. Fatigue Crack Growth in Polymers. Polymer Testing 2001, 20 (3),
321–327.
Ramsteiner, F.; McKee, G. E.; Breulmann. Influence of Void Formation on Impact Toughness in
Rubber Modified Styrenic-Polymers. M. Polymer 2002, 43 (22), 5995–6003.
Swaminathan, S.; Ghosh, S.; Pagano, N. J. Statistically Equivalent Representative Volume
Elements for Unidirectional Composite Microstructures: Part I-Without Damage. Journal of
Composite Materials 2006, 40.7, 583–604.
Wilding, S. E.; Fullwood, David T. Clustering Metrics for Two-Phase Composites.
Computational Materials Science 2011, 50.7, 2262–2272.
Wongsto, A.; Li., S. Micromechanical FE Analysis of UD Fibre-Reinforced Composites with
Fibres Distributed at Random Over the Transverse Cross-Section. Composites Part A:
Applied Science and Manufacturing 2005, 36.9, 1246–1266.
Yang, S.; Gokhale, A. M.; Shan, Z. Utility of Microstructure Modeling for Simulation of Micro-
Mechanical Response of Composites Containing Non-Uniformly Distributed Fibers. Acta
materialia 2000, 48.9, 2307–2322.
Zangenberg, J. et al. Methodology for Characterisation of Glass Fibre Composite Architecture.
Plastics, Rubber and Composites 2012, 41.4-5, 4–5.

29
List of Symbols, Abbreviations, and Acronyms
ADH amplitude distribution histogram
AE acoustic emission
AMRDEC Army Missile Research, Development and Engineering Center
ARL U.S. Army Research Laboratory
A-scans amplitude scans
ASTM American Society for Testing and Materials
CDS critical damage state
DARPA Defense Advanced Research Projects Agency
FVL Future Vertical Lift
IFS interfiber spacings
JMR Joint Multi-Role Rotorcraft
NDE non-destructive evaluation
NND nearest neighbor distances
PMMA polymethyl methacrylate
RDECOM Research Development and Engineering Command
S&T science and technology
SEM scanning electron microscopy
SIPS Structural Integrity Prognosis System
TOF time-of-flight
30
NO. OF
COPIES ORGANIZATION
1 DEFENSE TECHNICAL
(PDF) INFORMATION CTR
DTIC OCA
2 DIRECTOR
(PDFS) US ARMY RESEARCH LAB
RDRL CIO LT
IMAL HRA MAIL & RECORDS MGMT
16 DIRECTOR
(PDFS) US ARMY RESEARCH LAB
RDRL VT M
ASHA J HALL
MICHAEL COATNEY
ROBERT HAYNES
NATASHA BRADLEY
DY D LE
MARK BUNDY
RDRL VT P
ANINDYA GHOSHAL
ELIAS RIGAS
BRIAN DYKAS
RDRL WMM D
RAYMOND E BRENNAN IV
RDRL D
VOLKER WEISS
MARK J VALCO
RDRL WMM A
JEROME TZENG
RYAN EMERSON
RDRL WMM B
TRAVIS BOGETTI
RDRL WMM D
MARC PEPI
RDRL SER E
KWOK TOM
1 US ARMY RESEARCH OFFICE
(PDF) RDRL ROE M
DAVID STEPP
4 AFRL
(PDFS) ERIK LINDGREN
ERIC TUEGEL
PAMELA KOBRYN
JEFFERY BAUER
NO. OF
COPIES ORGANIZATION
5 AATD-AMRDEC
(PDFS) JON SCHUCK
TREVEN BAKER
NATHANIEL BORDICK
JOHN CROCCO
MARK ROBESON
4 NAVAIR
(PDFS) NAM PHAN
ANISUR RAHMAN
KISHAN GOEL
MADAN KITTUR
3 AED-AMRDEC
(PDFS) ROBERT E. BENTON
ROBERT VAUGHAN
KYLE HAMLIN
3 NASA LANGLEY
(PDFS) RICHARD ROSS
CARA LECKEY
ERIC GLAESSGEN