Embed Size (px)
Citation preview
8/6/2019 Damages Per Tonne Emission of...Cafe_cba_externalities
http://slidepdf.com/reader/full/damages-per-tonne-emission-ofcafecbaexternalities 1/31
AEA Technology Environment
Service Contract for Carrying outCost-Benefit Analysis of Air Quality Related Issues,
in particular in theClean Air for Europe (CAFE) Programme
Damages per tonne emission ofPM2.5, NH3, SO2, NOx and VOCs from each
EU25 Member State (excluding Cyprus) andsurrounding seas
March 2005
8/6/2019 Damages Per Tonne Emission of...Cafe_cba_externalities
http://slidepdf.com/reader/full/damages-per-tonne-emission-ofcafecbaexternalities 2/31
AEA Technology Environment
Title Damages per tonne emission of PM2.5, NH3, SO2, NOx
and VOCs from each EU25 Member State (excluding
Cyprus) and surrounding seas, for
Service Contract for carrying out cost-benefit analysis of air
quality related issues, in particular in the clean air for Europe
(CAFE) programme Customer European Commission DG Environment
Customer reference ENV.C.1/SER/2003/0027
Confidentiality,
copyright and
reproduction
This document has been prepared by AEA Technology plc in
connection with a contract to supply goods and/or services and
is submitted only on the basis of strict confidentiality. Thecontents must not be disclosed to third parties other than in
accordance with the terms of the contract.
Validity Issue 1
File reference AEAT/ED51014/CAFE CBA damage costs
Reference number AEAT/ED51014/ CAFE CBA damage costs
AEA Technology Environment
Bdg 154 Harwell Business Centre
Didcot, Oxon, OX11 0QJ
United Kingdom
Telephone +44 (0) 870 190 6592
Facsimile +44 (0) 870 190 6327
Email: [email protected]
AEA Technology Environment is a business division of
AEA Technology plc
AEA Technology Environment is certificated to ISO9001 & ISO 14001
Name Signature Date
Authors Mike Holland (EMRC)
Steve Pye, Paul Watkiss
(AEA Technology), Bert
Droste-Franke, Peter Bickel
(IER)
8/3/05
Reviewed by Paul Watkiss 8/3/05
Approved by Paul Watkiss 8/3/05
8/6/2019 Damages Per Tonne Emission of...Cafe_cba_externalities
http://slidepdf.com/reader/full/damages-per-tonne-emission-ofcafecbaexternalities 3/31
i
Executive Summary
This report provides the damage per tonne of pollutant (PM2.5, SO2, NOx, NH3 and
VOCs), accounting for variation in the site of emission by providing estimates for
each country in the EU25 (excluding Cyprus) and for surrounding sea areas.
The new results include a number of refinements:
• They add NH3 (ammonia) to the list of pollutant emissions considered
(originally, just NOx, SO2, PM2.5 and VOCs were included).
• The countries for which results are provided have increased from the EU15
(excluding Luxembourg) to the EU25 excluding Cyprus.
• Dispersion modelling is based on the new EMEP model, with a 50 x 50 km
resolution and updated chemistry and meteorology. The modelling was
carried out for a series of scenarios where emissions for the baseline 2010
scenario were changed individually by country and pollutant.
• Dispersion modelling has provided data specific to the assessment of the four
major sea areas around Europe (Eastern Atlantic, Baltic Sea, Mediterranean
Sea and North Sea).
• Impact assessment has been carried out using the CAFE CBA methodology,
published on the internet1 in 2005. This includes refinements to the suite of
health functions for which impacts have been assessed, updates to the
functions and updates to the valuation. Crop damage assessment has also been
performed, though at present there is no analysis of damage to materials. The
omission of materials is of most significance for SO2, though should not make
a major difference to the results.
Summary results are presented in the table below as averages for the EU25 (excludingCyprus) and the four sea areas considered, to show the order of magnitude of
damages. The range takes account of variation in the method used to value mortality,
reflecting the use of the median and mean estimates of the value of a life year
(VOLY) from NewExt (2004) (€50,000 and €120,000 respectively), and the use of the
median and mean estimates of the value of statistical life (VSL), also from NewExt
(€980,000 and €2,000,000 respectively). The overall range shown also includes
sensitivity to the range of effects included, and to the use of a zero cut-point for
assessment of ozone impacts2. Detailed results with damages per tonne disaggregated
to the level of country and sea area are presented in the main text.
In interpreting the data given in this and other tables presented in the report, it is
essential to remember that a number of effects are excluded from quantification,
including impacts on ecosystems and cultural heritage. Inclusion of these effects
would further increase the results. A listing of effects included and excluded from the
analysis is given in the main text.
1
http://europa.eu.int/comm/environment/air/cafe/index.htm 2The core analysis is based on use of a cut-point of 35 ppb for ozone impacts. No cut-point is used for
assessment of PM2.5 effects.
8/6/2019 Damages Per Tonne Emission of...Cafe_cba_externalities
http://slidepdf.com/reader/full/damages-per-tonne-emission-ofcafecbaexternalities 4/31
ii
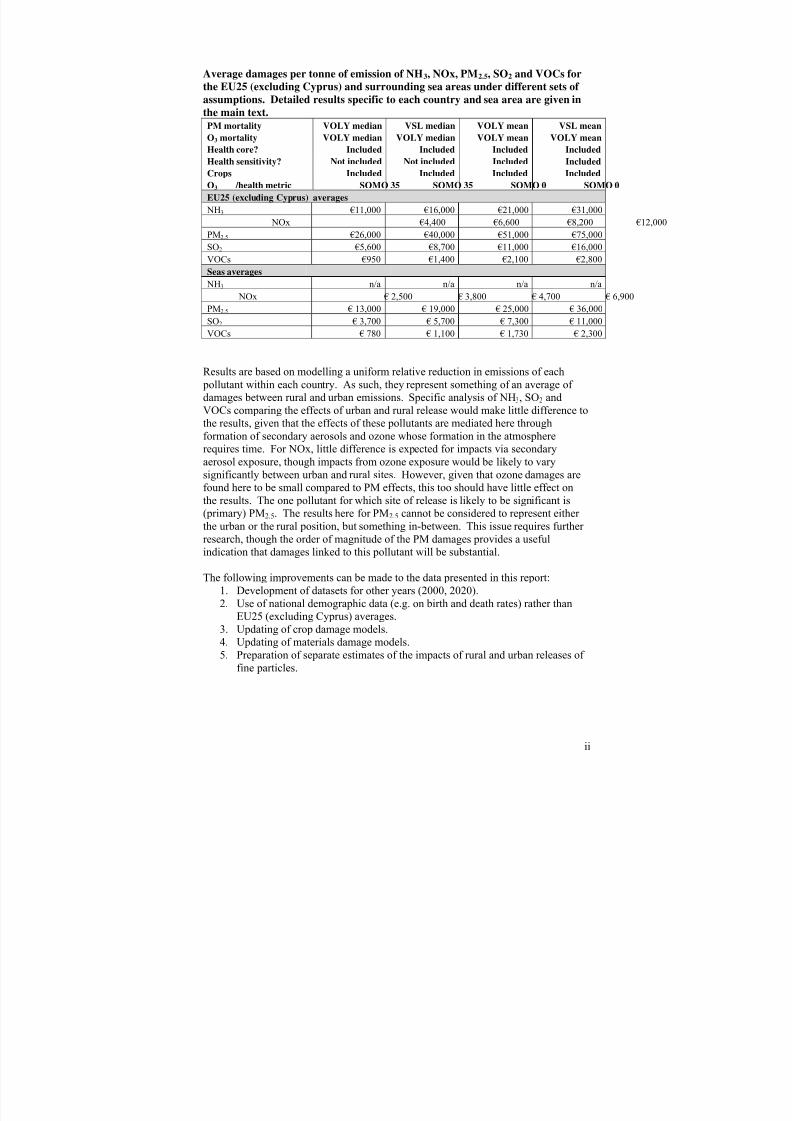
Average damages per tonne of emission of NH3, NOx, PM2.5, SO2 and VOCs for
the EU25 (excluding Cyprus) and surrounding sea areas under different sets of
assumptions. Detailed results specific to each country and sea area are given in
the main text.
PM mortality VOLY median VSL median VOLY mean VSL mean
O3 mortality VOLY median VOLY median VOLY mean VOLY meanHealth core? Included Included Included Included
Health sensitivity? Not included Not included Included Included
Crops Included Included Included Included
O3 /health metric SOMO 35 SOMO 35 SOMO 0 SOMO 0
EU25 (excluding Cyprus) averages
NH3 €11,000 €16,000 €21,000 €31,000
NOx €4,400 €6,600 €8,200 €12,000
PM2.5 €26,000 €40,000 €51,000 €75,000
SO2 €5,600 €8,700 €11,000 €16,000
VOCs €950 €1,400 €2,100 €2,800
Seas averages
NH3 n/a n/a n/a n/a
NOx € 2,500 € 3,800 € 4,700 € 6,900
PM2.5 € 13,000 € 19,000 € 25,000 € 36,000
SO2 € 3,700 € 5,700 € 7,300 € 11,000
VOCs € 780 € 1,100 € 1,730 € 2,300
Results are based on modelling a uniform relative reduction in emissions of each
pollutant within each country. As such, they represent something of an average of
damages between rural and urban emissions. Specific analysis of NH3, SO2 and
VOCs comparing the effects of urban and rural release would make little difference tothe results, given that the effects of these pollutants are mediated here through
formation of secondary aerosols and ozone whose formation in the atmosphere
requires time. For NOx, little difference is expected for impacts via secondary
aerosol exposure, though impacts from ozone exposure would be likely to vary
significantly between urban and rural sites. However, given that ozone damages are
found here to be small compared to PM effects, this too should have little effect on
the results. The one pollutant for which site of release is likely to be significant is
(primary) PM2.5. The results here for PM2.5 cannot be considered to represent either
the urban or the rural position, but something in-between. This issue requires further
research, though the order of magnitude of the PM damages provides a useful
indication that damages linked to this pollutant will be substantial.
The following improvements can be made to the data presented in this report:
1. Development of datasets for other years (2000, 2020).
2. Use of national demographic data (e.g. on birth and death rates) rather than
EU25 (excluding Cyprus) averages.
3. Updating of crop damage models.
4. Updating of materials damage models.
5. Preparation of separate estimates of the impacts of rural and urban releases of
fine particles.

8/6/2019 Damages Per Tonne Emission of...Cafe_cba_externalities
http://slidepdf.com/reader/full/damages-per-tonne-emission-ofcafecbaexternalities 5/31
iii
AcknowledgementsThe authors would like to acknowledge the contribution of the following to the
production of this report:
• David Simpson, Peter Wind, EMEP, for providing the original model runs
used to quantify the impacts of changes in emissions.
• Fintan Hurley, Institute of Occupational Medicine, for work on the health
impact assessment model.
• Alistair Hunt, University of Bath, for work on valuation data.
8/6/2019 Damages Per Tonne Emission of...Cafe_cba_externalities
http://slidepdf.com/reader/full/damages-per-tonne-emission-ofcafecbaexternalities 6/31
iv
ContentsIntroduction....................................................................................................................1
Background and objectives ........................................................................................1
Updates ......................................................................................................................1
Overview of methods.................................................................................................2
Impacts considered and omitted from the analysis ....................................................2Other uncertainties considered...................................................................................4
Methods..........................................................................................................................5
Development of source-receptor relationships ..........................................................5
Implementation of CAFE-CBA methodology for quantifying benefits per unit of
pollutant release .........................................................................................................6
Quantification of health damages ..........................................................................6
Quantification of ozone-crop damages ................................................................10
Results..........................................................................................................................11
Crop damage ............................................................................................................11
Total damages, by pollutant .....................................................................................12
NH3 ..........................................................................................................................13
NOx..........................................................................................................................14
PM2.5 ........................................................................................................................15
SO2 ...........................................................................................................................16
VOCs........................................................................................................................17
Discussion....................................................................................................................18
References....................................................................................................................20
Appendix 1: Relationships between emissions of each pollutant and exposure to
particles and ozone in 2010..........................................................................................21
Effects on European PM2.5 exposure ...................................................................22
Effects on European SOMO 35 exposure ............................................................23Effects on European SOMO 0 exposure ..............................................................25
8/6/2019 Damages Per Tonne Emission of...Cafe_cba_externalities
http://slidepdf.com/reader/full/damages-per-tonne-emission-ofcafecbaexternalities 7/31
1
Introduction
Background and objectives
The objective of this analysis is to generate damage estimates per tonne emission for a
range of air pollutants in different situations. The analysis recognises that the location
of emission is important, and so distinguishes between countries and also between
different sea areas in Europe, and between urban and rural emissions. Much interest
was expressed in earlier work (Holland and Watkiss, 2002). As part of the Clean Air
for Europe Programme the most recent data and methodological advances have been
used to derive the new set of marginal damage of air pollution (AEAT 2005).
Updates The results contained in this report update the earlier estimates in a number of ways:
• Impact assessment has been carried out using the CAFE CBA methodology,
published on the internet in 2005. This includes refinements to the suite of
health functions for which impacts have been assessed, updates to the
functions and updates to the valuation. Crop damage assessment has also been
performed, though at present there is no analysis of damage to materials. The
omission of materials is of most significance for SO2.3
• Dispersion modelling is based on the new EMEP model, with a 50 x 50 km
resolution and updated chemistry and meteorology. The modelling was
carried out for a series of scenarios where emissions for the baseline 2010
scenario were changed individually by country and pollutant.
• NH3 (ammonia) has been added to the list of pollutant emissions considered
(originally, just NOx, SO2, PM2.5 and VOCs were included).
• The countries for which results are provided have increased from the EU15
(excluding Luxembourg) to the EU25 (excluding Cyprus).
• Dispersion modelling has provided data specific to the assessment of the four
major sea areas around Europe (Eastern Atlantic, Baltic Sea, Mediterranean
Sea and North Sea).
Use of the methodology agreed for impact assessment and valuation in the CAFE-
CBA analysis is important, as it means that the methods used to quantify impacts and perform valuation have been subject to intensive scrutiny and peer review. Three
areas where methodological advances are most significant relate to:
• Change in scale used for the dispersion modelling (resolution increases by a
factor of 9, going from 150 x 150 km to 50 x 50 km).
• The approach used for quantification of deaths linked to chronic exposure to
fine particles. This is now carried out directly, rather than through the use of
assumptions concerning the average loss of life years per death.
• The valuation of mortality effects, now based on survey work which is likely
to better reflect the valuation of death in relation to air pollution.
3Information on the CAFE CBA, including the methodology reports is provided at
http://www.cafe-cba.org/ and http://europa.eu.int/comm/environment/air/cafe/index.htm
8/6/2019 Damages Per Tonne Emission of...Cafe_cba_externalities
http://slidepdf.com/reader/full/damages-per-tonne-emission-ofcafecbaexternalities 8/31
2
Overview of methods
Analysis contained in this report follows the impact pathway methodology developed
in the ExternE Project funded by EC DG Research4. The pathway described by the
analysis is as follows:
Emission of pollutants
→ Dispersion of pollutants
→ Exposure of people, ecosystems, materials, etc.
→ Quantification of impacts
→ Valuation of impacts
The dispersion modelling is carried out in a way that tracks pollutants through the
atmosphere, and follows their chemical reactions, enabling quantification of effects
linked to emission, not simply to atmospheric concentration of the pollutant in the
chemical state in which it was released. An important consequence of this is that
effects caused by secondary particulates are not assigned to PM2.5, but to the primary
pollutant from which they are formed (e.g. SO2 for sulphate aerosol, NOx for nitrate
aerosol and NH3 for ammonium aerosol). It also enables account to be taken of less
obvious interactions between air pollutants, for example the effects of VOC emissions
on inorganic particle concentrations1, or the effects of SO2 and NH3 emissions on
ozone.
Further details on the methods that underpin the quantification made here are given
below.
Impacts considered and omitted from the analysis
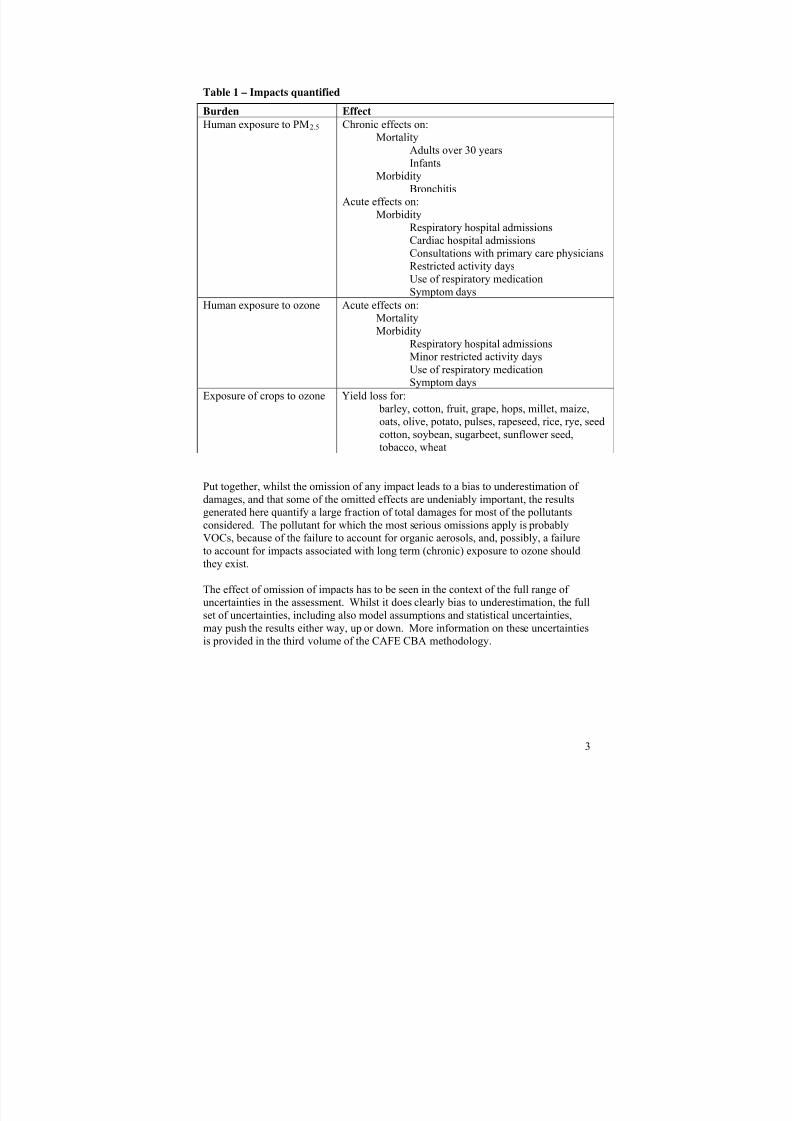
The impacts that have been quantified for this report are listed in Table 1. It is
important not to forget those effects that remain unquantified as a result of limitations
in the availability of data on response functions and / or valuation. These are listed in
Table 2, which shows that a large number of effects have not been quantified. To
interpret the information presented in the two tables it is important to be aware that:
1. The effects that have been quantified are substantial, and
2. Several of the effects that have not been quantified here are likely to be
negligible (e.g. direct effects of SO2 and NOx on crops) and would not lead to
a significant increase in damages per tonne emission.
4For further information on ExternE, see http://www.externe.info/
8/6/2019 Damages Per Tonne Emission of...Cafe_cba_externalities
http://slidepdf.com/reader/full/damages-per-tonne-emission-ofcafecbaexternalities 9/31
3
Table 1 – Impacts quantified
Burden Effect
Human exposure to PM2.5 Chronic effects on:
MortalityAdults over 30 years
Infants
Morbidity
Bronchitis
Acute effects on:
Morbidity
Respiratory hospital admissions
Cardiac hospital admissions
Consultations with primary care physicians
Restricted activity days
Use of respiratory medicationSymptom days
Human exposure to ozone Acute effects on:
Mortality
Morbidity
Respiratory hospital admissions
Minor restricted activity days
Use of respiratory medication
Symptom days
Exposure of crops to ozone Yield loss for:
barley, cotton, fruit, grape, hops, millet, maize,
oats, olive, potato, pulses, rapeseed, rice, rye, seed
cotton, soybean, sugarbeet, sunflower seed,
tobacco, wheat
Put together, whilst the omission of any impact leads to a bias to underestimation of
damages, and that some of the omitted effects are undeniably important, the results
generated here quantify a large fraction of total damages for most of the pollutants
considered. The pollutant for which the most serious omissions apply is probably
VOCs, because of the failure to account for organic aerosols, and, possibly, a failure
to account for impacts associated with long term (chronic) exposure to ozone shouldthey exist.
The effect of omission of impacts has to be seen in the context of the full range of
uncertainties in the assessment. Whilst it does clearly bias to underestimation, the full
set of uncertainties, including also model assumptions and statistical uncertainties,
may push the results either way, up or down. More information on these uncertainties
is provided in the third volume of the CAFE CBA methodology.
8/6/2019 Damages Per Tonne Emission of...Cafe_cba_externalities
http://slidepdf.com/reader/full/damages-per-tonne-emission-ofcafecbaexternalities 10/31
4
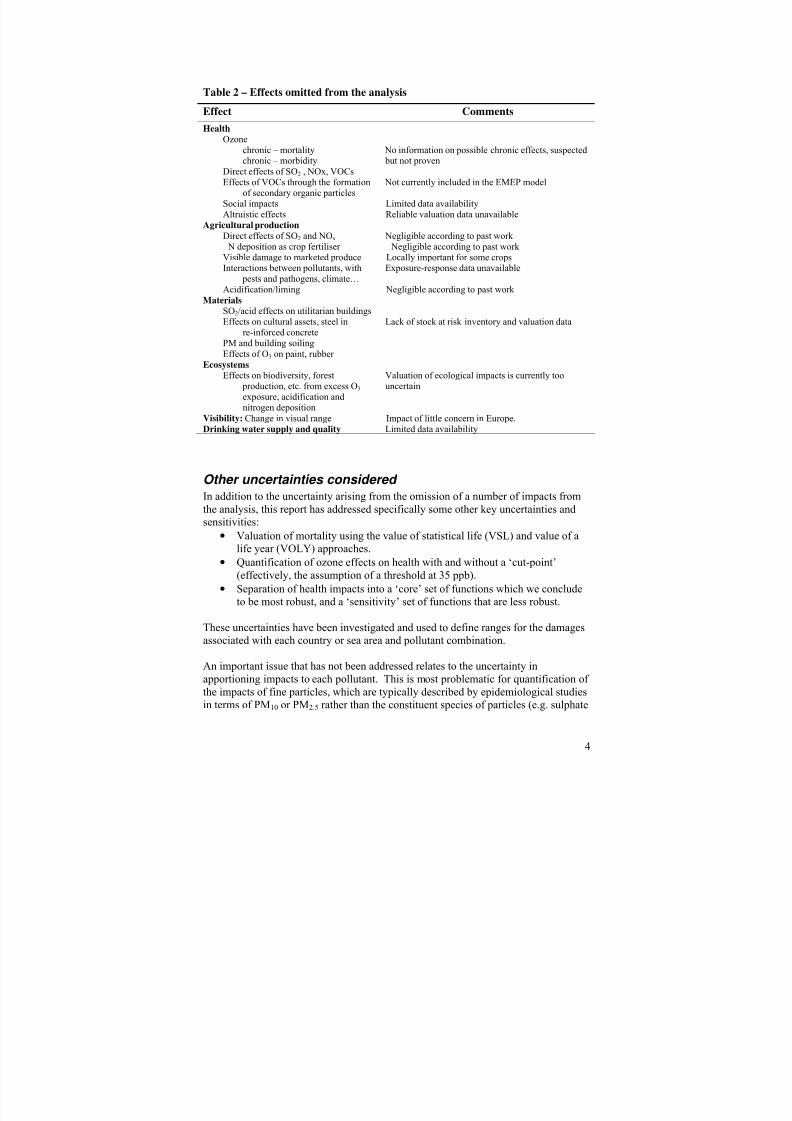
Table 2 – Effects omitted from the analysis
Effect Comments
Health
Ozonechronic – mortalitychronic – morbidity
No information on possible chronic effects, suspected but not proven
Direct effects of SO2 , NOx, VOCsEffects of VOCs through the formation
of secondary organic particles Not currently included in the EMEP model
Social impacts Limited data availabilityAltruistic effects Reliable valuation data unavailable
Agricultural production
Direct effects of SO2 and NOx Negligible according to past work N deposition as crop fertiliser Negligible according to past work Visible damage to marketed produce Locally important for some cropsInteractions between pollutants, with
pests and pathogens, climate…
Exposure-response data unavailable
Acidification/liming Negligible according to past work
Materials SO2/acid effects on utilitarian buildingsEffects on cultural assets, steel in
re-inforced concreteLack of stock at risk inventory and valuation data
PM and building soiling
Effects of O3 on paint, rubber
Ecosystems Effects on biodiversity, forest
production, etc. from excess O3 exposure, acidification andnitrogen deposition
Valuation of ecological impacts is currently toouncertain
Visibility: Change in visual range Impact of little concern in Europe.Drinking water supply and quality Limited data availability
Other uncertainties considered
In addition to the uncertainty arising from the omission of a number of impacts from
the analysis, this report has addressed specifically some other key uncertainties and
sensitivities:
• Valuation of mortality using the value of statistical life (VSL) and value of a
life year (VOLY) approaches.• Quantification of ozone effects on health with and without a ‘cut-point’
(effectively, the assumption of a threshold at 35 ppb).
• Separation of health impacts into a ‘core’ set of functions which we conclude
to be most robust, and a ‘sensitivity’ set of functions that are less robust.
These uncertainties have been investigated and used to define ranges for the damages
associated with each country or sea area and pollutant combination.
An important issue that has not been addressed relates to the uncertainty in
apportioning impacts to each pollutant. This is most problematic for quantification of
the impacts of fine particles, which are typically described by epidemiological studiesin terms of PM10 or PM2.5 rather than the constituent species of particles (e.g. sulphate
8/6/2019 Damages Per Tonne Emission of...Cafe_cba_externalities
http://slidepdf.com/reader/full/damages-per-tonne-emission-ofcafecbaexternalities 11/31
5
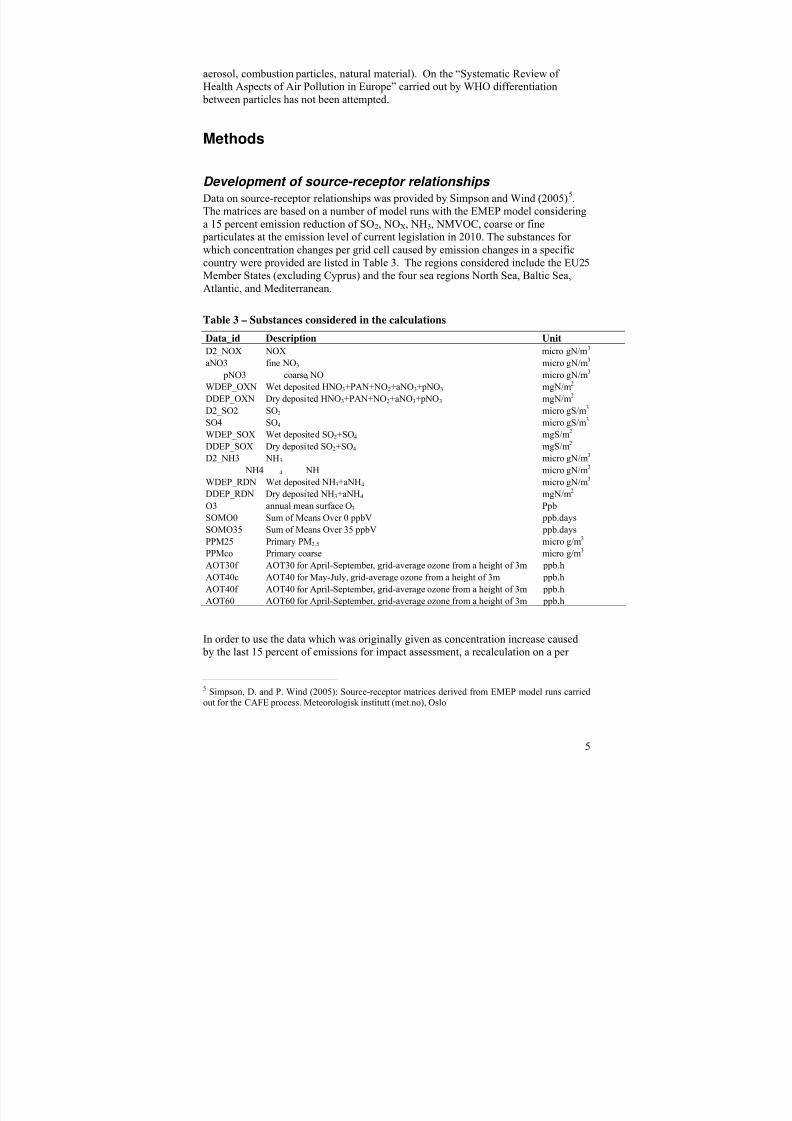
aerosol, combustion particles, natural material). On the “Systematic Review of
Health Aspects of Air Pollution in Europe” carried out by WHO differentiation
between particles has not been attempted.
Methods
Development of source-receptor relationships
Data on source-receptor relationships was provided by Simpson and Wind (2005)5.
The matrices are based on a number of model runs with the EMEP model considering
a 15 percent emission reduction of SO2, NOX, NH3, NMVOC, coarse or fine
particulates at the emission level of current legislation in 2010. The substances for
which concentration changes per grid cell caused by emission changes in a specific
country were provided are listed in Table 3. The regions considered include the EU25
Member States (excluding Cyprus) and the four sea regions North Sea, Baltic Sea,Atlantic, and Mediterranean.
Table 3 – Substances considered in the calculations
Data_id Description Unit
D2_NOX NOX micro gN/m3
aNO3 fine NO3 micro gN/m3
pNO3 coarse NO3 micro gN/m3
WDEP_OXN Wet deposited HNO3+PAN+NO2+aNO3+pNO3 mgN/m2
DDEP_OXN Dry deposited HNO3+PAN+NO2+aNO3+pNO3 mgN/m2
D2_SO2 SO2
micro gS/m3
SO4 SO4 micro gS/m3
WDEP_SOX Wet deposited SO2+SO4 mgS/m2
DDEP_SOX Dry deposited SO2+SO4 mgS/m2
D2_NH3 NH3 micro gN/m3
NH4 NH4 micro gN/m3
WDEP_RDN Wet deposited NH3+aNH4 micro gN/m3
DDEP_RDN Dry deposited NH3+aNH4 mgN/m2
O3 annual mean surface O3 Ppb
SOMO0 Sum of Means Over 0 ppbV ppb.days
SOMO35 Sum of Means Over 35 ppbV ppb.days
PPM25 Primary PM2.5 micro g/m3
PPMco Primary coarse micro g/m3
AOT30f AOT30 for April-September, grid-average ozone from a height of 3m ppb.h
AOT40c AOT40 for May-July, grid-average ozone from a height of 3m ppb.h
AOT40f AOT40 for April-September, grid-average ozone from a height of 3m ppb.h
AOT60 AOT60 for April-September, grid-average ozone from a height of 3m ppb.h
In order to use the data which was originally given as concentration increase caused
by the last 15 percent of emissions for impact assessment, a recalculation on a per
5
Simpson, D. and P. Wind (2005): Source-receptor matrices derived from EMEP model runs carriedout for the CAFE process. Meteorologisk institutt (met.no), Oslo
8/6/2019 Damages Per Tonne Emission of...Cafe_cba_externalities
http://slidepdf.com/reader/full/damages-per-tonne-emission-ofcafecbaexternalities 12/31
6
kilo-tonne basis was necessary. Additionally, the concentration at the emission level
of current legislation in 2010 was provided. Results are shown in Appendix 1.
Implementation of CAFE-CBA methodology for quantifying
benefits per unit of pollutant release The methodology used here has been developed through extensive discussion and
consultation with stakeholders from the EU Member States, various European
Agencies, WHO, industry and NGOs from October 2003 to January 2005.
Documentation, including comments made by the peer reviewers, is available at
http://cafe-cba.org/ and
http://europa.eu.int/comm/environment/air/cafe/activities/cba.htm.
The analysis presented here is limited to assessment of exposure of people and crops
to PM2.5 and ozone. This limitation to the analysis should not be interpreted to imply
that non-quantified effects are unimportant: it is simply that there is not currently anadequate basis to permit their quantification with an acceptable level of reliability.
The one exception concerns damages to materials in ‘utilitarian’ applications, which
will be brought into the analysis when the necessary pollution data become available.
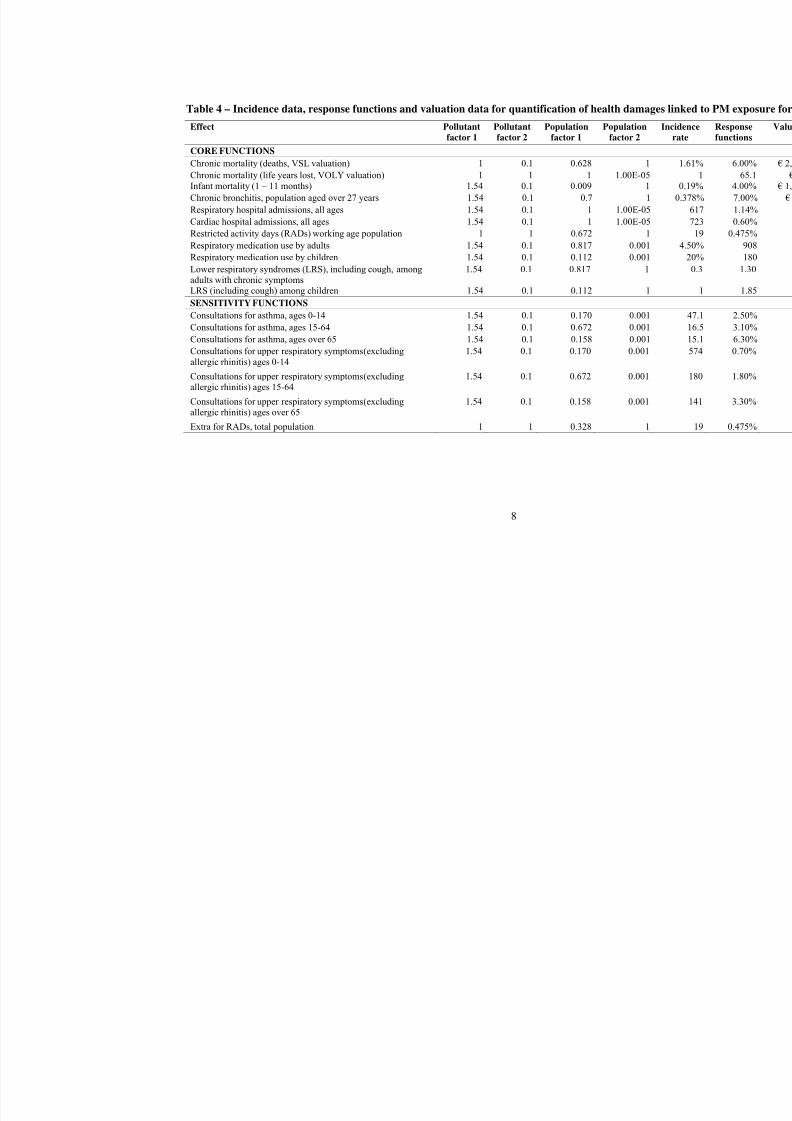
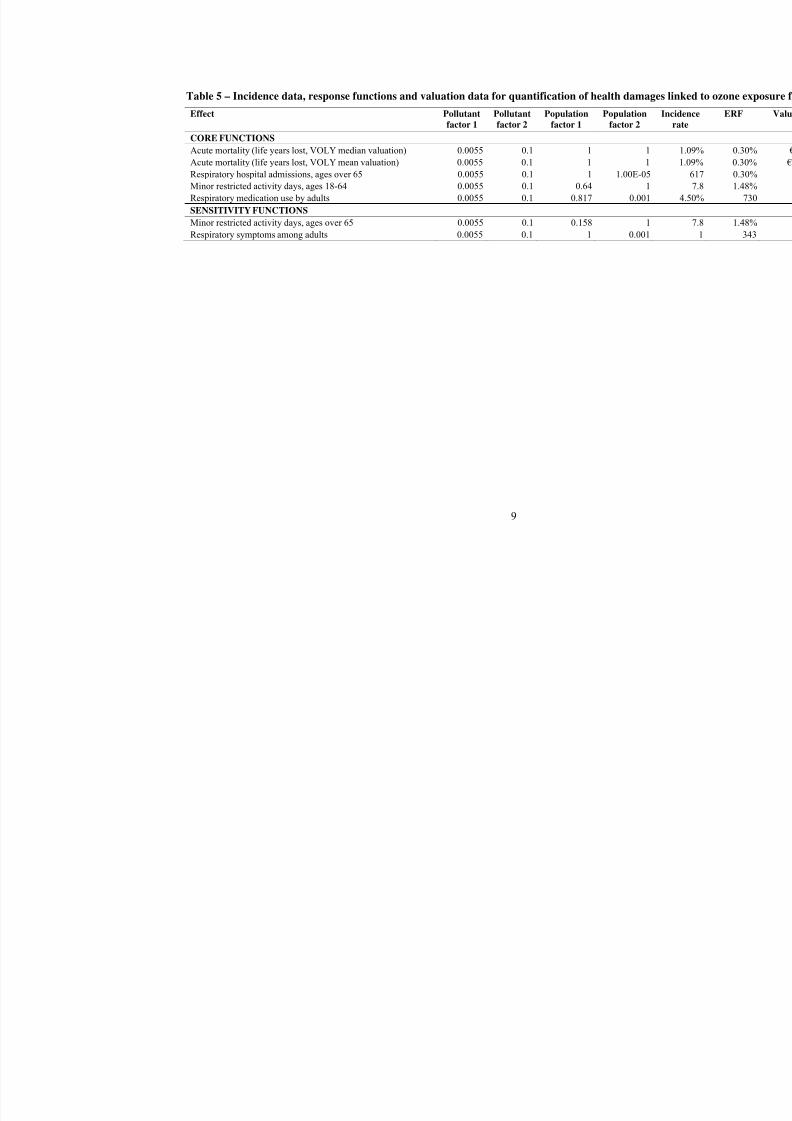
Quantification of health damages
The data used for quantification of health damages, based on information from UN
health statistics and data, functions and valuations presented in Volume 2 of the
CAFE-CBA methodology report, are given in Table 4 for effects of exposure to PM2.5
and Table 5 for effects of exposure to ozone. It should be noted that:
• Chronic mortality estimates for PM2.5 based on VSL/VOLY or median/meanestimates are not additive, but are used as alternatives in sensitivity analysis.
• Similarly, for the VOLY mean and median valuations listed for ozone.
• Several effects listed in CAFE-CBA Methodology volume 2 have not been
included in the quantification as further validation of incidence data is
required:
o Upper bound estimate for chronic bronchitis, recommended for
inclusion in the sensitivity functions for PM2.5.
o Respiratory medication use and lower respiratory symptoms among
children, recommended for inclusion in the core functions for ozone.
o Consultations for allergic rhinitis in adults and children, recommended
for inclusion in the sensitivity functions for ozone.
• Valuation of ozone mortality impacts using the VOLY approach assumes an
average loss of life expectancy amongst those affected of 1 year.
• The ‘pollution factors’ and ‘population factors’ convert from units (etc.)
defined in the CAFE-CBA Methodology report volume 2 to units that match
the population weighted pollution metrics that form the basis of the
quantification.
• Population factors are specific to 2010.
• Valuation data refer to the year 2000.
8/6/2019 Damages Per Tonne Emission of...Cafe_cba_externalities
http://slidepdf.com/reader/full/damages-per-tonne-emission-ofcafecbaexternalities 13/31
7
Sufficient data is given in Table 4 and Table 5 to reconstruct the final result tables
presented in this report (below, in Table 8 to Table 12), when combined with the
population exposure data given in Appendix 1 and the crop damage results in Table 7.
Some explanation of the parameters in Table 4 and Table 5 is likely to be useful.
Note that in any column a figure of 1 is the default, given that quantification simplymultiplies all of the variables shown together:
Pollutant factor 1 for PM2.5: Uses a figure of 1 or 1.54 where the original function is
expressed in terms of PM2.5 or PM10 respectively. For ozone, a factor of 0.0055
(calculated as 2/365) is used to convert from the metric produced by the EMEP
model (SOMO 0 or 35 as ppb.hours) to change in annual 8 hr mean (with and
without the cut point) in µg.m-3.
Pollutant factor 2: Where the original function is expressed per µg.m-3 the factor = 1,
where it is expressed per 10 µg.m-3 a factor of 0.1 is used.
Population factor 1: This factor accounts for most functions applying to only part of
the population. For example, the chronic mortality function (deaths) is
applicable only to those aged over 30, who account for 62.8% of the populationin the modelled domain.
Population factor 2: This factor accounts for some functions being expressed per
thousand or per hundred thousand of population.
Incidence rate, response functions, valuation data: These are all given in Volume 2
of the CAFE CBA methodology report.
8/6/2019 Damages Per Tonne Emission of...Cafe_cba_externalities
http://slidepdf.com/reader/full/damages-per-tonne-emission-ofcafecbaexternalities 14/31
8
Table 4 – Incidence data, response functions and valuation data for quantification of health damages li
Effect Pollutant
factor 1
Pollutant
factor 2
Population
factor 1
Population
factor 2
Inc
rCORE FUNCTIONS
Chronic mortality (deaths, VSL valuation) 1 0.1 0.628 1
Chronic mortality (life years lost, VOLY valuation) 1 1 1 1.00E-05
Infant mortality (1 – 11 months) 1.54 0.1 0.009 1
Chronic bronchitis, population aged over 27 years 1.54 0.1 0.7 1 0
Respiratory hospital admissions, all ages 1.54 0.1 1 1.00E-05
Cardiac hospital admissions, all ages 1.54 0.1 1 1.00E-05
Restricted activity days (RADs) working age population 1 1 0.672 1
Respiratory medication use by adults 1.54 0.1 0.817 0.001
Respiratory medication use by children 1.54 0.1 0.112 0.001
Lower respiratory syndromes (LRS), including cough, amongadults with chronic symptoms
1.54 0.1 0.817 1
LRS (including cough) among children 1.54 0.1 0.112 1
SENSITIVITY FUNCTIONS
Consultations for asthma, ages 0-14 1.54 0.1 0.170 0.001
Consultations for asthma, ages 15-64 1.54 0.1 0.672 0.001
Consultations for asthma, ages over 65 1.54 0.1 0.158 0.001
Consultations for upper respiratory symptoms (excluding
allergic rhinitis) ages 0-14
1.54 0.1 0.170 0.001
Consultations for upper respiratory symptoms (excludingallergic rhinitis) ages 15-64
1.54 0.1 0.672 0.001
Consultations for upper respiratory symptoms (excluding
allergic rhinitis) ages over 65
1.54 0.1 0.158 0.001
Extra for RADs, total population 1 1 0.328 1
8/6/2019 Damages Per Tonne Emission of...Cafe_cba_externalities
http://slidepdf.com/reader/full/damages-per-tonne-emission-ofcafecbaexternalities 15/31
9
Table 5 – Incidence data, response functions and valuation data for quantification of health damages li
Effect Pollutant
factor 1
Pollutant
factor 2
Population
factor 1
Population
factor 2
Inc
r
CORE FUNCTIONSAcute mortality (life years lost, VOLY median valuation) 0.0055 0.1 1 1
Acute mortality (life years lost, VOLY mean valuation) 0.0055 0.1 1 1
Respiratory hospital admissions, ages over 65 0.0055 0.1 1 1.00E-05
Minor restricted activity days, ages 18-64 0.0055 0.1 0.64 1
Respiratory medication use by adults 0.0055 0.1 0.817 0.001
SENSITIVITY FUNCTIONS
Minor restricted activity days, ages over 65 0.0055 0.1 0.158 1
Respiratory symptoms among adults 0.0055 0.1 1 0.001
8/6/2019 Damages Per Tonne Emission of...Cafe_cba_externalities
http://slidepdf.com/reader/full/damages-per-tonne-emission-ofcafecbaexternalities 16/31
10
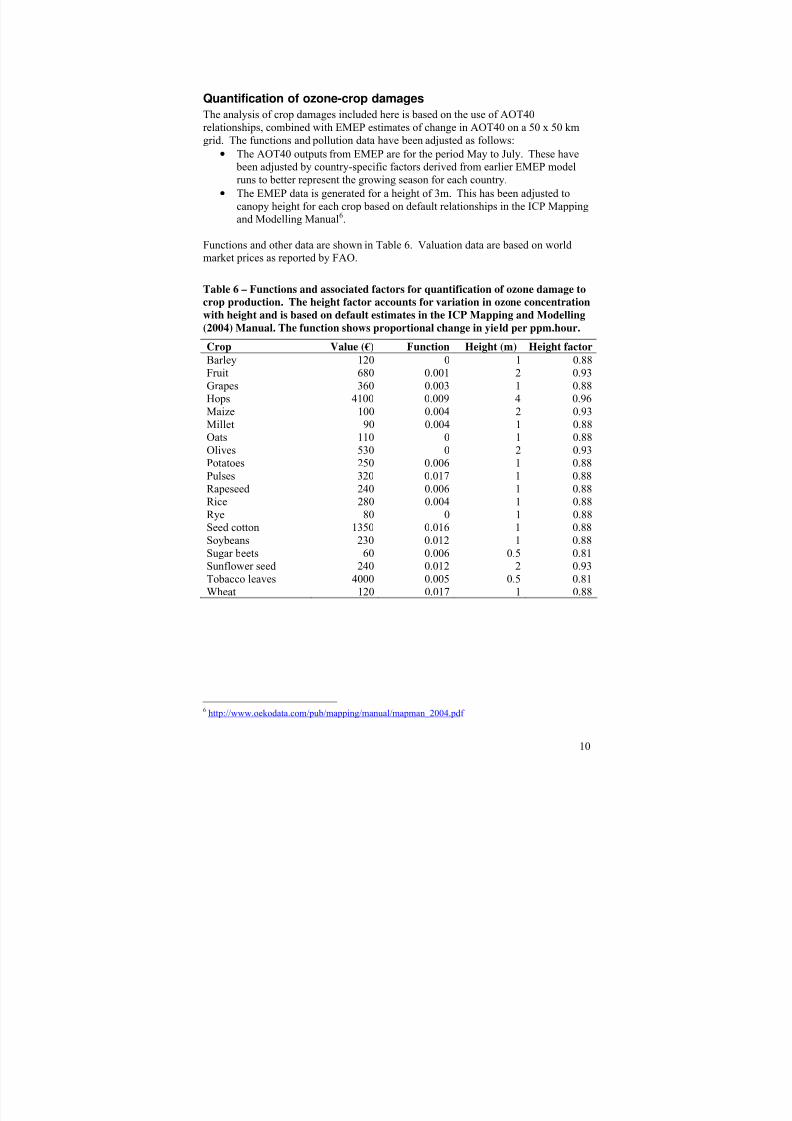
Quantification of ozone-crop damages
The analysis of crop damages included here is based on the use of AOT40
relationships, combined with EMEP estimates of change in AOT40 on a 50 x 50 km
grid. The functions and pollution data have been adjusted as follows:• The AOT40 outputs from EMEP are for the period May to July. These have
been adjusted by country-specific factors derived from earlier EMEP model
runs to better represent the growing season for each country.
• The EMEP data is generated for a height of 3m. This has been adjusted to
canopy height for each crop based on default relationships in the ICP Mapping
and Modelling Manual6.
Functions and other data are shown in Table 6. Valuation data are based on world
market prices as reported by FAO.
Table 6 – Functions and associated factors for quantification of ozone damage to
crop production. The height factor accounts for variation in ozone concentration
with height and is based on default estimates in the ICP Mapping and Modelling
(2004) Manual. The function shows proportional change in yield per ppm.hour.
Crop Value (€) Function Height (m) Height factor
Barley 120 0 1 0.88
Fruit 680 0.001 2 0.93
Grapes 360 0.003 1 0.88
Hops 4100 0.009 4 0.96
Maize 100 0.004 2 0.93Millet 90 0.004 1 0.88
Oats 110 0 1 0.88
Olives 530 0 2 0.93
Potatoes 250 0.006 1 0.88
Pulses 320 0.017 1 0.88
Rapeseed 240 0.006 1 0.88
Rice 280 0.004 1 0.88
Rye 80 0 1 0.88
Seed cotton 1350 0.016 1 0.88
Soybeans 230 0.012 1 0.88
Sugar beets 60 0.006 0.5 0.81Sunflower seed 240 0.012 2 0.93
Tobacco leaves 4000 0.005 0.5 0.81
Wheat 120 0.017 1 0.88
6 http://www.oekodata.com/pub/mapping/manual/mapman_2004.pdf
8/6/2019 Damages Per Tonne Emission of...Cafe_cba_externalities
http://slidepdf.com/reader/full/damages-per-tonne-emission-ofcafecbaexternalities 17/31
11
Results
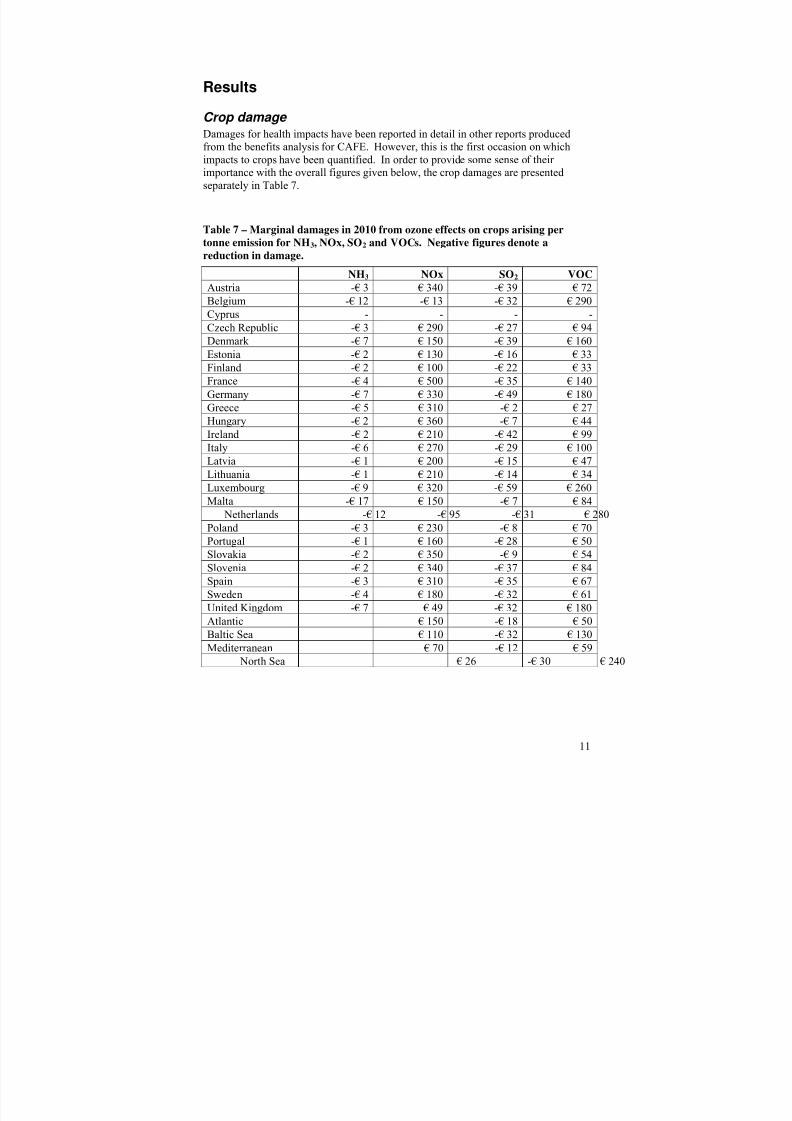
Crop damage
Damages for health impacts have been reported in detail in other reports producedfrom the benefits analysis for CAFE. However, this is the first occasion on which
impacts to crops have been quantified. In order to provide some sense of their
importance with the overall figures given below, the crop damages are presented
separately in Table 7.
Table 7 – Marginal damages in 2010 from ozone effects on crops arising per
tonne emission for NH3, NOx, SO2 and VOCs. Negative figures denote a
reduction in damage.
NH3 NOx SO2 VOCAustria -€ 3 € 340 -€ 39 € 72
Belgium -€ 12 -€ 13 -€ 32 € 290
Cyprus - - - -
Czech Republic -€ 3 € 290 -€ 27 € 94
Denmark -€ 7 € 150 -€ 39 € 160
Estonia -€ 2 € 130 -€ 16 € 33
Finland -€ 2 € 100 -€ 22 € 33
France -€ 4 € 500 -€ 35 € 140
Germany -€ 7 € 330 -€ 49 € 180
Greece -€ 5 € 310 -€ 2 € 27
Hungary -€ 2 € 360 -€ 7 € 44
Ireland -€ 2 € 210 -€ 42 € 99
Italy -€ 6 € 270 -€ 29 € 100
Latvia -€ 1 € 200 -€ 15 € 47
Lithuania -€ 1 € 210 -€ 14 € 34
Luxembourg -€ 9 € 320 -€ 59 € 260
Malta -€ 17 € 150 -€ 7 € 84
Netherlands -€ 12 -€ 95 -€ 31 € 280
Poland -€ 3 € 230 -€ 8 € 70
Portugal -€ 1 € 160 -€ 28 € 50
Slovakia -€ 2 € 350 -€ 9 € 54Slovenia -€ 2 € 340 -€ 37 € 84
Spain -€ 3 € 310 -€ 35 € 67
Sweden -€ 4 € 180 -€ 32 € 61
United Kingdom -€ 7 € 49 -€ 32 € 180
Atlantic € 150 -€ 18 € 50
Baltic Sea € 110 -€ 32 € 130
Mediterranean € 70 -€ 12 € 59
North Sea € 26 -€ 30 € 240
8/6/2019 Damages Per Tonne Emission of...Cafe_cba_externalities
http://slidepdf.com/reader/full/damages-per-tonne-emission-ofcafecbaexternalities 18/31
12
Total damages, by pollutant
Total damages from each of the 5 pollutants considered in this analysis are given in
the tables for 4 combinations of sensitivity: The low end is calculated on the
following basis:
• Inclusion of core health functions and crop functions
• Use of the median estimate of VOLY from the NewExt study for mortality
impacts of PM2.5 and ozone
• Use of the 35 ppb cut-point for quantification of ozone health impacts
The change in magnitude of damages for the central scenarios is largely a reflection of
the unit values used for mortality valuation, rather than a response to the other
sensitivities explored. It is notable that there is not clear separation of the results
based on the VSL and VOLY approaches – although VOLY gives generally lower
results than VSL, the result based on mean VOLY is greater than the one based on
median VSL.
The upper end is calculated on the following basis:
• Inclusion of core and sensitivity health functions and crop functions
• Use of the mean estimate of VSL from the NewExt study for mortality impacts
of PM2.5 and the mean estimate of VOLY for mortality impacts of ozone
• Use of no cut-point for quantification of ozone health impacts
Assumptions specific to each set of results are shown at the top of each table.
The results show very large variations in damage per tonne emission between
countries. Generally, the highest damages are found from emissions in central Europeand the lowest from countries around the edges of Europe. This simply reflects
variation in exposure of people and crops to the pollutants of interest – emissions at
the edges of Europe will affect fewer people than emissions at the centre of Europe.
The results for Cyprus looked to be artificially low most likely due to modelling
uncertainties and have been omitted from the tables.
8/6/2019 Damages Per Tonne Emission of...Cafe_cba_externalities
http://slidepdf.com/reader/full/damages-per-tonne-emission-ofcafecbaexternalities 19/31
13
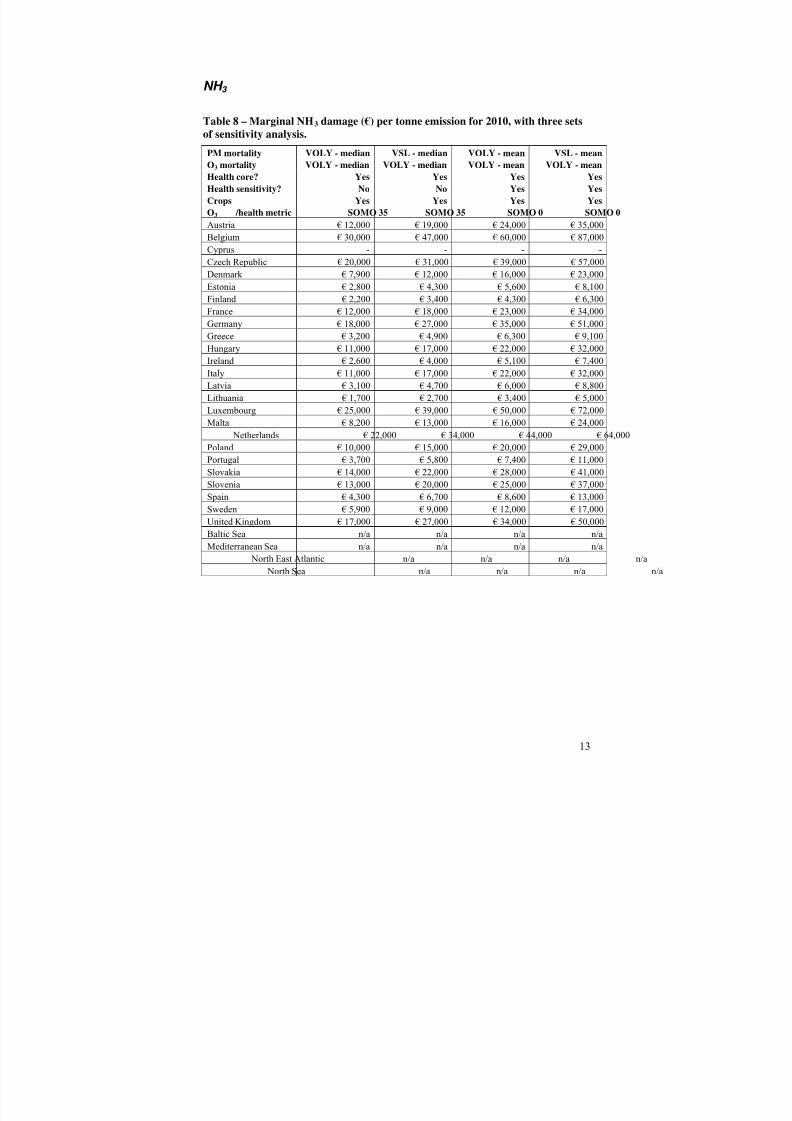
NH 3
Table 8 – Marginal NH3 damage (€) per tonne emission for 2010, with three sets
of sensitivity analysis.PM mortality VOLY - median VSL - median VOLY - mean VSL - mean
O3 mortality VOLY - median VOLY - median VOLY - mean VOLY - mean
Health core? Yes Yes Yes Yes
Health sensitivity? No No Yes Yes
Crops Yes Yes Yes Yes
O3 /health metric SOMO 35 SOMO 35 SOMO 0 SOMO 0
Austria € 12,000 € 19,000 € 24,000 € 35,000
Belgium € 30,000 € 47,000 € 60,000 € 87,000
Cyprus - - - -
Czech Republic € 20,000 € 31,000 € 39,000 € 57,000
Denmark € 7,900 € 12,000 € 16,000 € 23,000Estonia € 2,800 € 4,300 € 5,600 € 8,100
Finland € 2,200 € 3,400 € 4,300 € 6,300
France € 12,000 € 18,000 € 23,000 € 34,000
Germany € 18,000 € 27,000 € 35,000 € 51,000
Greece € 3,200 € 4,900 € 6,300 € 9,100
Hungary € 11,000 € 17,000 € 22,000 € 32,000
Ireland € 2,600 € 4,000 € 5,100 € 7,400
Italy € 11,000 € 17,000 € 22,000 € 32,000
Latvia € 3,100 € 4,700 € 6,000 € 8,800
Lithuania € 1,700 € 2,700 € 3,400 € 5,000
Luxembourg € 25,000 € 39,000 € 50,000 € 72,000
Malta € 8,200 € 13,000 € 16,000 € 24,000
Netherlands € 22,000 € 34,000 € 44,000 € 64,000
Poland € 10,000 € 15,000 € 20,000 € 29,000
Portugal € 3,700 € 5,800 € 7,400 € 11,000
Slovakia € 14,000 € 22,000 € 28,000 € 41,000
Slovenia € 13,000 € 20,000 € 25,000 € 37,000
Spain € 4,300 € 6,700 € 8,600 € 13,000
Sweden € 5,900 € 9,000 € 12,000 € 17,000
United Kingdom € 17,000 € 27,000 € 34,000 € 50,000
Baltic Sea n/a n/a n/a n/a
Mediterranean Sea n/a n/a n/a n/a
North East Atlantic n/a n/a n/a n/a
North Sea n/a n/a n/a n/a

8/6/2019 Damages Per Tonne Emission of...Cafe_cba_externalities
http://slidepdf.com/reader/full/damages-per-tonne-emission-ofcafecbaexternalities 20/31
14
NOx
Table 9 – Marginal NOx, damage (€) per tonne emission for 2010, with three sets
of sensitivity analysis.PM mortality VOLY - median VSL - median VOLY - mean VSL – mean
O3 mortality VOLY - median VOLY - median VOLY - mean VOLY – mean
Health core? Yes Yes Yes Yes
Health sensitivity? No No Yes Yes
Crops Yes Yes Yes Yes
O3/health metric SOMO 35 SOMO 35 SOMO 0 SOMO 0
Austria € 8,700 € 13,100 € 16,000 € 24,000
Belgium € 5,200 € 8,200 € 9,100 € 14,000
Cyprus - - - -
Czech Republic € 7,300 € 11,000 € 13,700 € 20,000
Denmark € 4,400 € 6,700 € 8,300 € 12,100Estonia € 810 € 1,100 € 1,600 € 2,200
Finland € 750 € 1,100 € 1,500 € 2,000
France € 7,700 € 12,000 € 14,000 € 21,000
Germany € 9,600 € 15,000 € 18,000 € 26,000
Greece € 840 € 1,100 € 1,400 € 1,900
Hungary € 5,400 € 8,100 € 10,000 € 15,000
Ireland € 3,800 € 5,600 € 7,500 € 11,000
Italy € 5,700 € 8,600 € 11,000 € 16,000
Latvia € 1,400 € 1,900 € 2,700 € 3,700
Lithuania € 1,800 € 2,700 € 3,700 € 5,000
Luxembourg € 8,700 € 13,000 € 16,000 € 24,000
Malta € 670 € 930 € 1,300 € 1,700
Netherlands € 6,600 € 10,000 € 12,000 € 18,000
Poland € 3,900 € 5,800 € 7,100 € 10,000
Portugal € 1,300 € 1,900 € 2,200 € 3,200
Slovakia € 5,200 € 7,800 € 9,700 € 14,000
Slovenia € 6,700 € 10,000 € 13,000 € 18,000
Spain € 2,600 € 3,800 € 5,200 € 7,200
Sweden € 2,200 € 3,200 € 4,100 € 5,900
United Kingdom € 3,900 € 6,000 € 6,700 € 10,000
Baltic Sea € 2,600 € 4,000 € 4,900 € 7,200
Mediterranean Sea € 530 € 760 € 990 € 1,400
North East Atlantic € 1,600 € 2,400 € 3,500 € 4,800
North Sea € 5,100 € 7,900 € 9,500 € 14,000

8/6/2019 Damages Per Tonne Emission of...Cafe_cba_externalities
http://slidepdf.com/reader/full/damages-per-tonne-emission-ofcafecbaexternalities 21/31
15
PM 2.5
Table 10 –Marginal PM2.5 damage (€) per tonne emission for 2010, with three
sets of sensitivity analysis.PM mortality VOLY - median VSL - median VOLY - mean VSL - mean
O3 mortality VOLY - median VOLY - median VOLY - mean VOLY - mean
Health core? Yes Yes Yes Yes
Health sensitivity? No No Yes Yes
Crops Yes Yes Yes Yes
O3/health metric SOMO 35 SOMO 35 SOMO 0 SOMO 0
Austria € 37,000 € 56,000 € 72,000 € 110,000
Belgium € 61,000 € 94,000 € 120,000 € 180,000
Cyprus - - - -
Czech Republic € 32,000 € 49,000 € 62,000 € 91,000
Denmark € 16,000 € 25,000 € 33,000 € 48,000Estonia € 4,200 € 6,500 € 8,300 € 12,000
Finland € 5,400 € 8,300 € 11,000 € 16,000
France € 44,000 € 68,000 € 87,000 € 130,000
Germany € 48,000 € 74,000 € 95,000 € 140,000
Greece € 8,600 € 13,000 € 17,000 € 25,000
Hungary € 25,000 € 39,000 € 50,000 € 72,000
Ireland € 15,000 € 22,000 € 29,000 € 42,000
Italy € 34,000 € 52,000 € 66,000 € 97,000
Latvia € 8,800 € 14,000 € 17,000 € 25,000
Lithuania € 8,400 € 13,000 € 17,000 € 24,000
Luxembourg € 41,000 € 63,000 € 81,000 € 120,000
Malta € 9,300 € 14,000 € 18,000 € 27,000
Netherlands € 63,000 € 96,000 € 120,000 € 180,000
Poland € 29,000 € 44,000 € 57,000 € 83,000
Portugal € 22,000 € 34,000 € 44,000 € 64,000
Slovakia € 20,000 € 31,000 € 40,000 € 58,000
Slovenia € 22,000 € 34,000 € 44,000 € 64,000
Spain € 19,000 € 29,000 € 37,000 € 54,000
Sweden € 12,000 € 18,000 € 23,000 € 34,000
United Kingdom € 37,000 € 57,000 € 73,000 € 110,000
Baltic Sea € 12,000 € 19,000 € 24,000 € 35,000
Mediterranean Sea € 5,600 € 8,700 € 11,000 € 16,000
North East Atlantic € 4,800 € 7,400 € 9,400 € 14,000
North Sea € 28,000 € 42,000 € 54,000 € 80,000

8/6/2019 Damages Per Tonne Emission of...Cafe_cba_externalities
http://slidepdf.com/reader/full/damages-per-tonne-emission-ofcafecbaexternalities 22/31
16
SO 2
Table 11 – Marginal SO2 damage (€) per tonne emission for 2010, with three sets
of sensitivity analysis.PM mortality VOLY - median VSL - median VOLY - mean VSL - mean
O3 mortality VOLY - median VOLY - median VOLY - mean VOLY - mean
Health core? Yes Yes Yes Yes
Health sensitivity? No No Yes Yes
Crops Yes Yes Yes Yes
O3/health metric SOMO 35 SOMO 35 SOMO 0 SOMO 0
Austria € 8,300 € 13,000 € 16,000 € 24,000
Belgium € 11,000 € 16,000 € 21,000 € 31,000
Cyprus - - - -
Czech Republic € 8,000 € 12,000 € 16,000 € 23,000
Denmark € 5,200 € 8,100 € 10,000 € 15,000Estonia € 1,800 € 2,800 € 3,600 € 5,200
Finland € 1,800 € 2,700 € 3,500 € 5,100
France € 8,000 € 12,000 € 16,000 € 23,000
Germany € 11,000 € 17,000 € 22,000 € 32,000
Greece € 1,400 € 2,100 € 2,700 € 4,000
Hungary € 4,800 € 7,300 € 9,400 € 14,000
Ireland € 4,800 € 7,500 € 9,500 € 14,000
Italy € 6,100 € 9,300 € 12,000 € 18,000
Latvia € 2,000 € 3,100 € 3,900 € 5,700
Lithuania € 2,400 € 3,600 € 4,700 € 6,800
Luxembourg € 9,800 € 15,000 € 19,000 € 28,000
Malta € 2,200 € 3,300 € 4,300 € 6,200
Netherlands € 13,000 € 21,000 € 26,000 € 39,000
Poland € 5,600 € 8,600 € 11,000 € 16,000
Portugal € 3,500 € 5,400 € 6,900 € 10,000
Slovakia € 4,900 € 7,500 € 9,600 € 14,000
Slovenia € 6,200 € 9,500 € 12,000 € 18,000
Spain € 4,300 € 6,600 € 8,400 € 12,000
Sweden € 2,800 € 4,300 € 5,500 € 8,100
United Kingdom € 6,600 € 10,000 € 13,000 € 19,000
Baltic Sea € 3,700 € 5,800 € 7,400 € 11,000
Mediterranean Sea € 2,000 € 3,200 € 4,000 € 5,900
North East Atlantic € 2,200 € 3,400 € 4,300 € 6,300
North Sea € 6,900 € 11,000 € 14,000 € 20,000
8/6/2019 Damages Per Tonne Emission of...Cafe_cba_externalities
http://slidepdf.com/reader/full/damages-per-tonne-emission-ofcafecbaexternalities 23/31
17
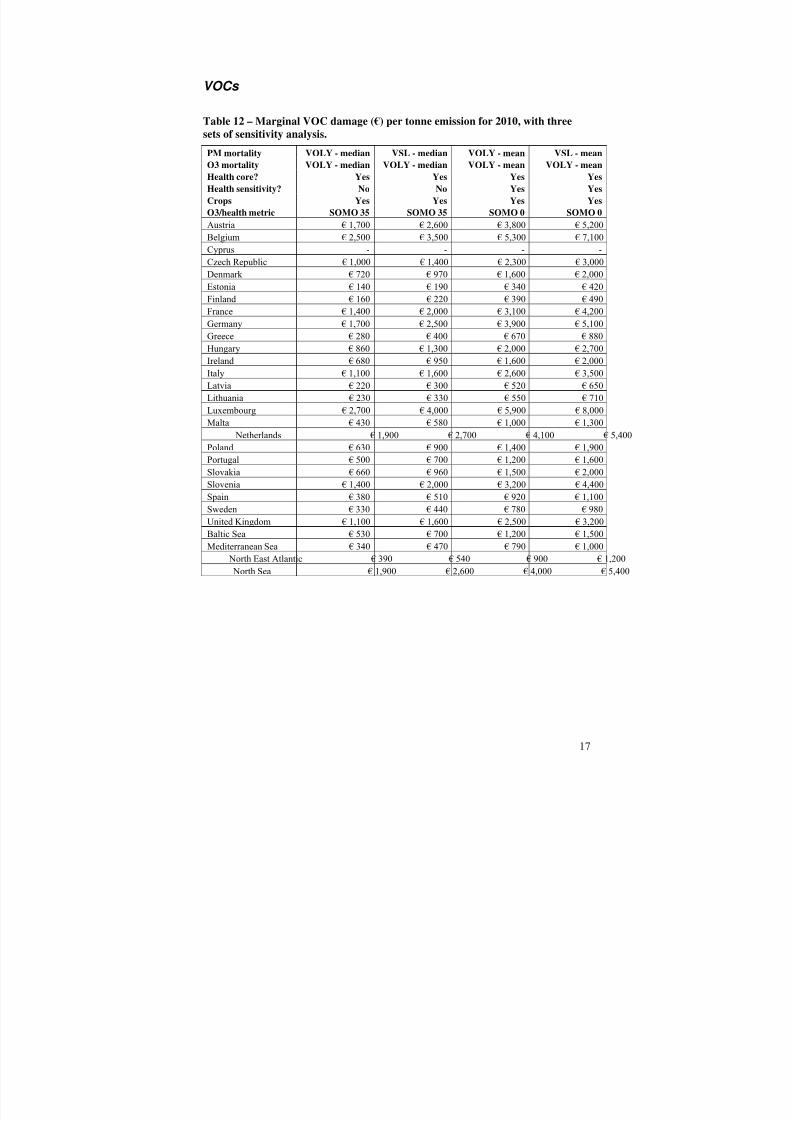
VOCs
Table 12 – Marginal VOC damage (€) per tonne emission for 2010, with three
sets of sensitivity analysis.PM mortality VOLY - median VSL - median VOLY - mean VSL - mean
O3 mortality VOLY - median VOLY - median VOLY - mean VOLY - mean
Health core? Yes Yes Yes Yes
Health sensitivity? No No Yes Yes
Crops Yes Yes Yes Yes
O3/health metric SOMO 35 SOMO 35 SOMO 0 SOMO 0
Austria € 1,700 € 2,600 € 3,800 € 5,200
Belgium € 2,500 € 3,500 € 5,300 € 7,100
Cyprus - - - -
Czech Republic € 1,000 € 1,400 € 2,300 € 3,000
Denmark € 720 € 970 € 1,600 € 2,000Estonia € 140 € 190 € 340 € 420
Finland € 160 € 220 € 390 € 490
France € 1,400 € 2,000 € 3,100 € 4,200
Germany € 1,700 € 2,500 € 3,900 € 5,100
Greece € 280 € 400 € 670 € 880
Hungary € 860 € 1,300 € 2,000 € 2,700
Ireland € 680 € 950 € 1,600 € 2,000
Italy € 1,100 € 1,600 € 2,600 € 3,500
Latvia € 220 € 300 € 520 € 650
Lithuania € 230 € 330 € 550 € 710
Luxembourg € 2,700 € 4,000 € 5,900 € 8,000
Malta € 430 € 580 € 1,000 € 1,300
Netherlands € 1,900 € 2,700 € 4,100 € 5,400
Poland € 630 € 900 € 1,400 € 1,900
Portugal € 500 € 700 € 1,200 € 1,600
Slovakia € 660 € 960 € 1,500 € 2,000
Slovenia € 1,400 € 2,000 € 3,200 € 4,400
Spain € 380 € 510 € 920 € 1,100
Sweden € 330 € 440 € 780 € 980
United Kingdom € 1,100 € 1,600 € 2,500 € 3,200
Baltic Sea € 530 € 700 € 1,200 € 1,500
Mediterranean Sea € 340 € 470 € 790 € 1,000
North East Atlantic € 390 € 540 € 900 € 1,200
North Sea € 1,900 € 2,600 € 4,000 € 5,400
8/6/2019 Damages Per Tonne Emission of...Cafe_cba_externalities
http://slidepdf.com/reader/full/damages-per-tonne-emission-ofcafecbaexternalities 24/31
18
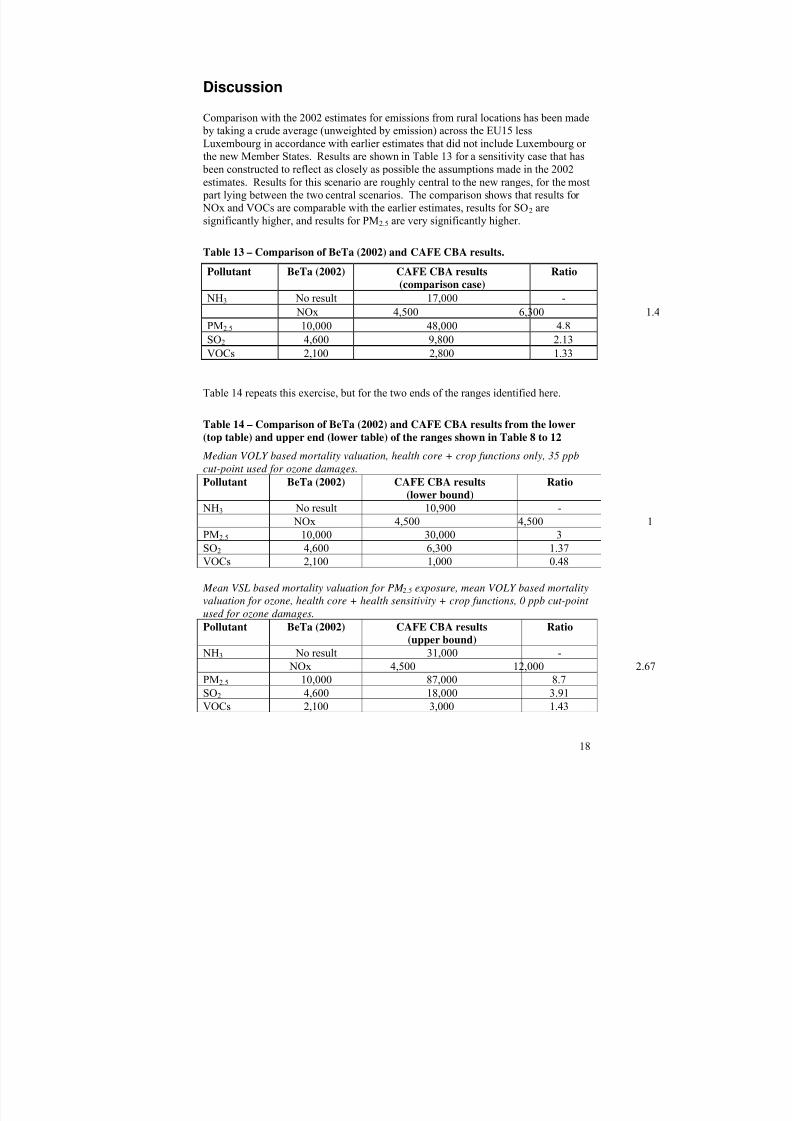
Discussion
Comparison with the 2002 estimates for emissions from rural locations has been made
by taking a crude average (unweighted by emission) across the EU15 less
Luxembourg in accordance with earlier estimates that did not include Luxembourg or
the new Member States. Results are shown in Table 13 for a sensitivity case that has
been constructed to reflect as closely as possible the assumptions made in the 2002
estimates. Results for this scenario are roughly central to the new ranges, for the most
part lying between the two central scenarios. The comparison shows that results for
NOx and VOCs are comparable with the earlier estimates, results for SO2 are
significantly higher, and results for PM2.5 are very significantly higher.
Table 13 – Comparison of BeTa (2002) and CAFE CBA results.
Pollutant BeTa (2002) CAFE CBA results(comparison case) Ratio
NH3 No result 17,000 -
NOx 4,500 6,300 1.4
PM2.5 10,000 48,000 4.8
SO2 4,600 9,800 2.13
VOCs 2,100 2,800 1.33
Table 14 repeats this exercise, but for the two ends of the ranges identified here.
Table 14 – Comparison of BeTa (2002) and CAFE CBA results from the lower
(top table) and upper end (lower table) of the ranges shown in Table 8 to 12
Median VOLY based mortality valuation, health core + crop functions only, 35 ppb
cut-point used for ozone damages.
Pollutant BeTa (2002) CAFE CBA results
(lower bound)
Ratio
NH3 No result 10,900 -
NOx 4,500 4,500 1
PM2.5 10,000 30,000 3
SO2
4,600 6,300 1.37
VOCs 2,100 1,000 0.48
Mean VSL based mortality valuation for PM 2.5 exposure, mean VOLY based mortality
valuation for ozone, health core + health sensitivity + crop functions, 0 ppb cut-point
used for ozone damages.
Pollutant BeTa (2002) CAFE CBA results
(upper bound)
Ratio
NH3 No result 31,000 -
NOx 4,500 12,000 2.67
PM2.5 10,000 87,000 8.7
SO2 4,600 18,000 3.91VOCs 2,100 3,000 1.43
8/6/2019 Damages Per Tonne Emission of...Cafe_cba_externalities
http://slidepdf.com/reader/full/damages-per-tonne-emission-ofcafecbaexternalities 25/31
19
The most striking increase in estimated damages concerns PM2.5. It is possible that
the increase arises in part because of the increased resolution of the EMEP model,
with the effect of emissions in densely populated areas being more sharply focused on
the population around the emission source. Consideration of a uniform abatementacross all sources may also go to explain the higher damage primary PM2.5, given that
the earlier estimates were specifically for high level sources in rural areas. Further
work is needed to improve the understanding of damage caused by PM2.5.
Results for VOCs are particularly interesting, as they can be attributed in large
measure to the effect of VOCs on inorganic particle concentrations, through
formation of ozone and subsequent oxidation of NOx and SO2 closer to the site of
emission. As noted elsewhere, no account is taken of effects of VOC emissions on
exposure to organic aerosols as these are not yet included in the EMEP model. This
is a clear bias to underestimation in the VOC estimates.
When considering the results presented in this report it is important not to forget the
impacts that have not been quantified. These were listed in Table 2.
Further results will be provided for the years 2000 and 2020 as soon as pollution data
are available.
A series of other useful results can also be generated, for example:
• Analysis showing how much of the benefit accruing to each country under any
scenario is a result of its own emission control and action taken in other
countries.
• Analysis showing the benefits arising from emission control by each country,
in contrast to the existing scenario results from CAFE which instead show the
benefit accruing to each country from pan-European action on air quality
improvement. This will enable an alternative way of comparing costs and
benefits for each country.
The following improvements can be made to the data presented in this report:
1. Development of datasets for other years.
2. Use of national demographic data rather than EU25 averages.
3. Updating of crop damage models.
4. Updating of materials damage models.
8/6/2019 Damages Per Tonne Emission of...Cafe_cba_externalities
http://slidepdf.com/reader/full/damages-per-tonne-emission-ofcafecbaexternalities 26/31
20
References
AEAT (2005) Methodology for the Cost-Benefit Analysis for CAFE. Reports
prepared for the Clean Air for Europe Programme. Volumes 1, 2 and 3.
http://europa.eu.int/comm/environment/air/cafe/activities/cba.htm
Holland, M.R. and Watkiss, P. (2002) Benefits Table database: Estimates of the
marginal external costs of air pollution in Europe BeTa Version E1.02a.
http://europa.eu.int/comm/environment/enveco/air/betaec02aforprinting.pdf
ICP Mapping and Modelling (2004) Manual on methodologies and criteria for
modelling and mapping critical loads and levels and air pollution effects, risks
and trends. http://europa.eu.int/comm/environment/air/cafe/activities/cba.htm
Krupnick A. et al (2004) Peer Review of the Methodology of Cost-Benefit Analysisof the Clean Air For Europe Programme. Paper prepared for European
Commission, Environment Directorate General. October 12, 2004.
http://europa.eu.int/comm/environment/air/cafe/activities/krupnick.pdf
NewExt (2004) New Elements for the Assessment of External Costs from Energy
Technologies”. Funded under the EC 5th Framework Programme (1998 – 2002),
Thematic programme: Energy, Environment and Sustainable Development, Part
B: Energy; Generic Activities: 8.1.3. Externalities ENG1-CT2000-00129.
Simpson, D. and P. Wind (2005): Source-receptor matrices derived from EMEP
model runs carried out for the CAFE process. Meteorologisk institutt, Oslo
WHO (2004) Systematic Review of Health Aspects of Air Pollution in Europe.
http://www.euro.who.int/eprise/main/WHO/Progs/AIQ/Activities/20020530_1

8/6/2019 Damages Per Tonne Emission of...Cafe_cba_externalities
http://slidepdf.com/reader/full/damages-per-tonne-emission-ofcafecbaexternalities 27/31
21
Appendix 1: Relationships between emissions of eachpollutant and exposure to particles and ozone in 2010
The following tables describe the processed outputs from the EMEP pollutionchemistry and dispersion modelling, showing the change in population-weighted
concentration across Europe for PM2.5. (Table 15), SOMO 35 (Table 17) and SOMO 0
(Table 19) associated with a 1000t increase or decrease in emission of ammonia,
PM2.5, NOx, SO2 or VOCs for the year 2010. A brief commentary is given below
these tables reviewing the overall direction of effect linked to each emitted pollutant
and the mechanisms involved.
These data can be combined with the information presented in Table 4, Table 5 and
Table 7 to recreate the results given in this report should readers so wish.
Subsequent reports will provide similar data for the years 2000 and 2020.
8/6/2019 Damages Per Tonne Emission of...Cafe_cba_externalities
http://slidepdf.com/reader/full/damages-per-tonne-emission-ofcafecbaexternalities 28/31
22
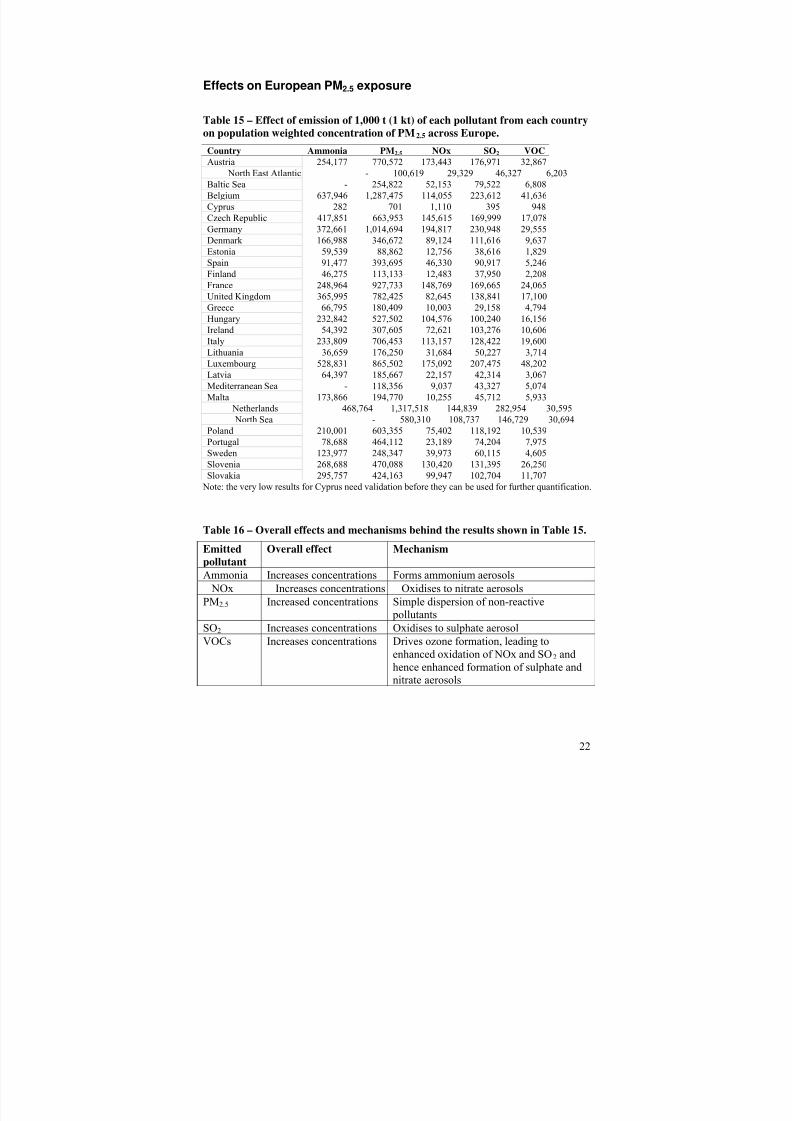
Effects on European PM2.5 exposure
Table 15 – Effect of emission of 1,000 t (1 kt) of each pollutant from each country
on population weighted concentration of PM2.5 across Europe.Country Ammonia PM2.5 NOx SO2 VOC
Austria 254,177 770,572 173,443 176,971 32,867
North East Atlantic - 100,619 29,329 46,327 6,203
Baltic Sea - 254,822 52,153 79,522 6,808
Belgium 637,946 1,287,475 114,055 223,612 41,636
Cyprus 282 701 1,110 395 948
Czech Republic 417,851 663,953 145,615 169,999 17,078
Germany 372,661 1,014,694 194,817 230,948 29,555
Denmark 166,988 346,672 89,124 111,616 9,637
Estonia 59,539 88,862 12,756 38,616 1,829
Spain 91,477 393,695 46,330 90,917 5,246
Finland 46,275 113,133 12,483 37,950 2,208France 248,964 927,733 148,769 169,665 24,065
United Kingdom 365,995 782,425 82,645 138,841 17,100
Greece 66,795 180,409 10,003 29,158 4,794
Hungary 232,842 527,502 104,576 100,240 16,156
Ireland 54,392 307,605 72,621 103,276 10,606
Italy 233,809 706,453 113,157 128,422 19,600
Lithuania 36,659 176,250 31,684 50,227 3,714
Luxembourg 528,831 865,502 175,092 207,475 48,202
Latvia 64,397 185,667 22,157 42,314 3,067
Mediterranean Sea - 118,356 9,037 43,327 5,074
Malta 173,866 194,770 10,255 45,712 5,933
Netherlands 468,764 1,317,518 144,839 282,954 30,595
North Sea - 580,310 108,737 146,729 30,694
Poland 210,001 603,355 75,402 118,192 10,539
Portugal 78,688 464,112 23,189 74,204 7,975
Sweden 123,977 248,347 39,973 60,115 4,605
Slovenia 268,688 470,088 130,420 131,395 26,250
Slovakia 295,757 424,163 99,947 102,704 11,707
Note: the very low results for Cyprus need validation before they can be used for further quantification.
Table 16 – Overall effects and mechanisms behind the results shown in Table 15.
Emittedpollutant Overall effect Mechanism
Ammonia Increases concentrations Forms ammonium aerosols
NOx Increases concentrations Oxidises to nitrate aerosols
PM2.5 Increased concentrations Simple dispersion of non-reactive
pollutants
SO2 Increases concentrations Oxidises to sulphate aerosol
VOCs Increases concentrations Drives ozone formation, leading to
enhanced oxidation of NOx and SO2 and
hence enhanced formation of sulphate and
nitrate aerosols
8/6/2019 Damages Per Tonne Emission of...Cafe_cba_externalities
http://slidepdf.com/reader/full/damages-per-tonne-emission-ofcafecbaexternalities 29/31
23
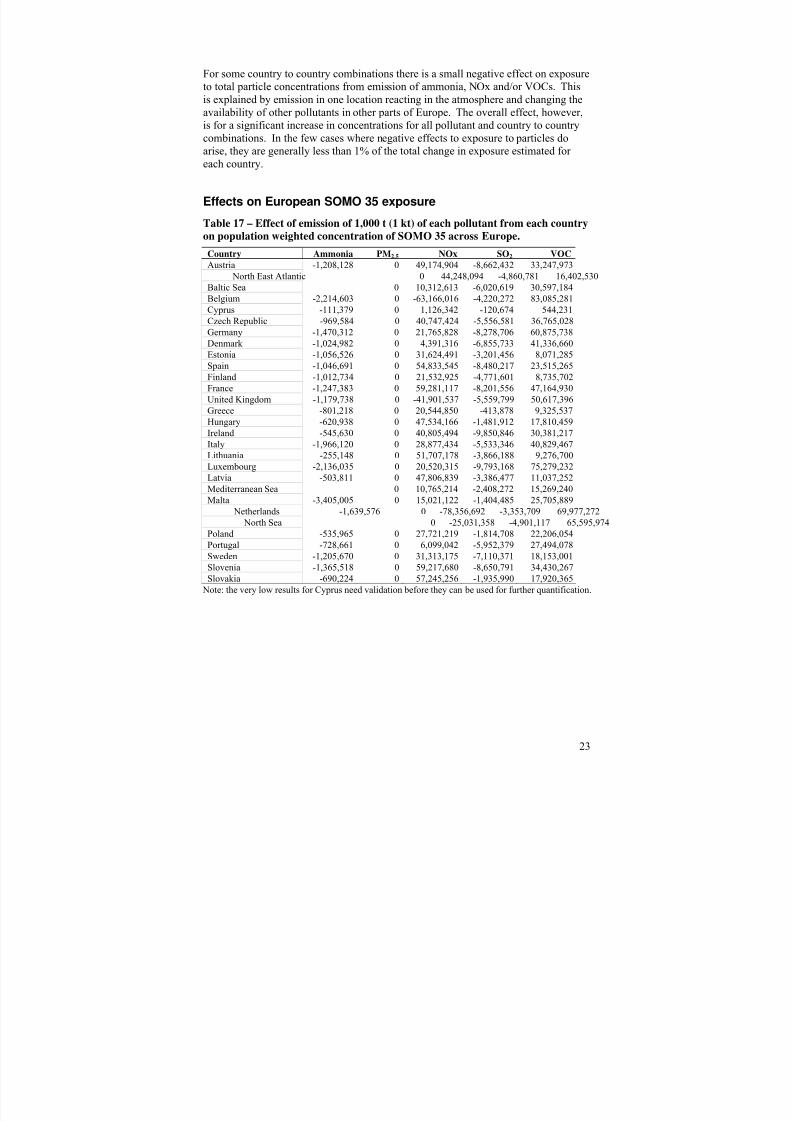
For some country to country combinations there is a small negative effect on exposure
to total particle concentrations from emission of ammonia, NOx and/or VOCs. This
is explained by emission in one location reacting in the atmosphere and changing the
availability of other pollutants in other parts of Europe. The overall effect, however,
is for a significant increase in concentrations for all pollutant and country to country
combinations. In the few cases where negative effects to exposure to particles doarise, they are generally less than 1% of the total change in exposure estimated for
each country.
Effects on European SOMO 35 exposure
Table 17 – Effect of emission of 1,000 t (1 kt) of each pollutant from each country
on population weighted concentration of SOMO 35 across Europe.
Country Ammonia PM2.5 NOx SO2 VOC
Austria -1,208,128 0 49,174,904 -8,662,432 33,247,973
North East Atlantic 0 44,248,094 -4,860,781 16,402,530Baltic Sea 0 10,312,613 -6,020,619 30,597,184
Belgium -2,214,603 0 -63,166,016 -4,220,272 83,085,281
Cyprus -111,379 0 1,126,342 -120,674 544,231
Czech Republic -969,584 0 40,747,424 -5,556,581 36,765,028
Germany -1,470,312 0 21,765,828 -8,278,706 60,875,738
Denmark -1,024,982 0 4,391,316 -6,855,733 41,336,660
Estonia -1,056,526 0 31,624,491 -3,201,456 8,071,285
Spain -1,046,691 0 54,833,545 -8,480,217 23,515,265
Finland -1,012,734 0 21,532,925 -4,771,601 8,735,702
France -1,247,383 0 59,281,117 -8,201,556 47,164,930
United Kingdom -1,179,738 0 -41,901,537 -5,559,799 50,617,396
Greece -801,218 0 20,544,850 -413,878 9,325,537
Hungary -620,938 0 47,534,166 -1,481,912 17,810,459
Ireland -545,630 0 40,805,494 -9,850,846 30,381,217
Italy -1,966,120 0 28,877,434 -5,533,346 40,829,467
Lithuania -255,148 0 51,707,178 -3,866,188 9,276,700
Luxembourg -2,136,035 0 20,520,315 -9,793,168 75,279,232
Latvia -503,811 0 47,806,839 -3,386,477 11,037,252
Mediterranean Sea 0 10,765,214 -2,408,272 15,269,240
Malta -3,405,005 0 15,021,122 -1,404,485 25,705,889
Netherlands -1,639,576 0 -78,356,692 -3,353,709 69,977,272
North Sea 0 -25,031,358 -4,901,117 65,595,974
Poland -535,965 0 27,721,219 -1,814,708 22,206,054
Portugal -728,661 0 6,099,042 -5,952,379 27,494,078
Sweden -1,205,670 0 31,313,175 -7,110,371 18,153,001Slovenia -1,365,518 0 59,217,680 -8,650,791 34,430,267
Slovakia -690,224 0 57,245,256 -1,935,990 17,920,365
Note: the very low results for Cyprus need validation before they can be used for further quantification.

8/6/2019 Damages Per Tonne Emission of...Cafe_cba_externalities
http://slidepdf.com/reader/full/damages-per-tonne-emission-ofcafecbaexternalities 30/31
24
Table 18 – Overall effects and mechanisms behind the results shown in Error!
Reference source not found..
Emitted
pollutant
Effect Mechanism
Ammonia Reduces concentrations Formation of ammonium nitrate aerosol,
reducing availability of NO2 for ozone
formation
NOx Increases concentrations
in some place, reduces
them in others
NOx emissions can increase ozone levels
through reaction with VOCs and sunlight,
or reduce concentrations through reaction
of NO2 with O3. Effect dependent on
balance of O3, VOCs, NO and NO2 in the
atmosphere.
PM2.5 No effect
SO2 Reduces concentrations Reacts with ozone, but unlike NOx has norole in ozone formation
VOCs Increases concentrations Drives ozone formation in reaction with
NOx, sunlight
8/6/2019 Damages Per Tonne Emission of...Cafe_cba_externalities
http://slidepdf.com/reader/full/damages-per-tonne-emission-ofcafecbaexternalities 31/31
Effects on European SOMO 0 exposure
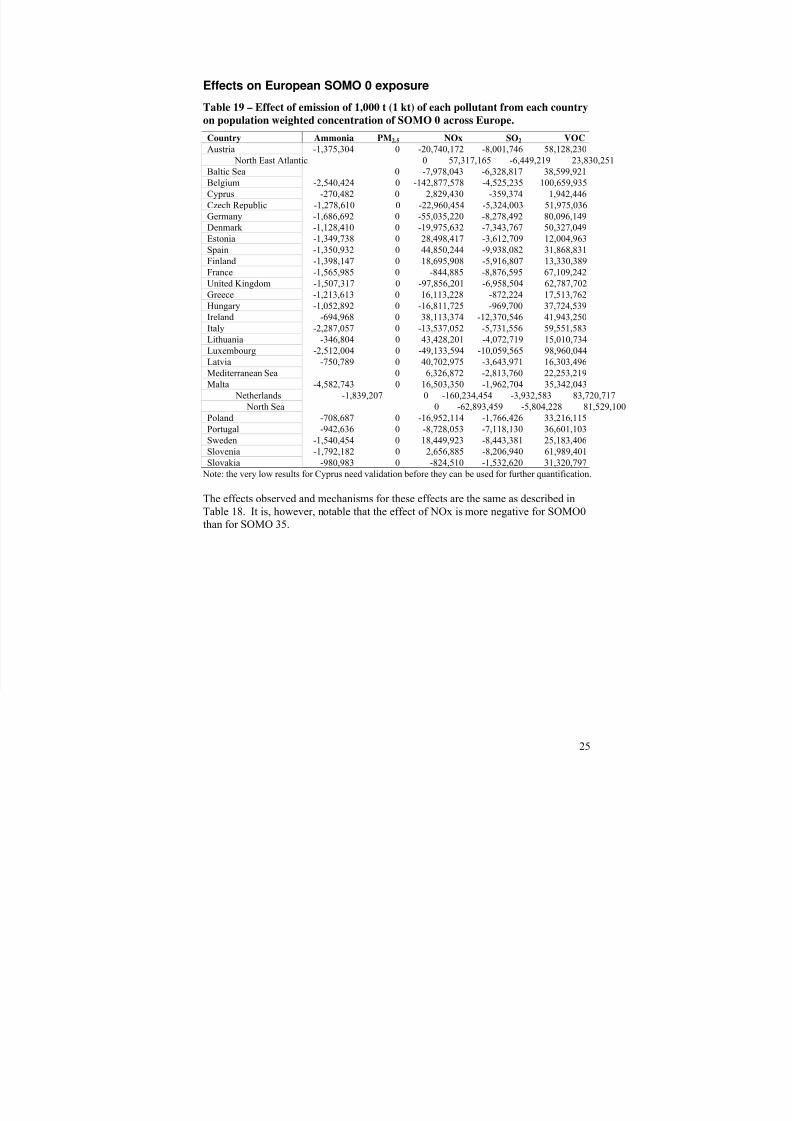
Table 19 – Effect of emission of 1,000 t (1 kt) of each pollutant from each country
on population weighted concentration of SOMO 0 across Europe.
Country Ammonia PM2.5 NOx SO2 VOCAustria -1,375,304 0 -20,740,172 -8,001,746 58,128,230
North East Atlantic 0 57,317,165 -6,449,219 23,830,251
Baltic Sea 0 -7,978,043 -6,328,817 38,599,921
Belgium -2,540,424 0 -142,877,578 -4,525,235 100,659,935
Cyprus -270,482 0 2,829,430 -359,374 1,942,446
Czech Republic -1,278,610 0 -22,960,454 -5,324,003 51,975,036
Germany -1,686,692 0 -55,035,220 -8,278,492 80,096,149
Denmark -1,128,410 0 -19,975,632 -7,343,767 50,327,049
Estonia -1,349,738 0 28,498,417 -3,612,709 12,004,963
Spain -1,350,932 0 44,850,244 -9,938,082 31,868,831
Finland -1,398,147 0 18,695,908 -5,916,807 13,330,389
France -1,565,985 0 -844,885 -8,876,595 67,109,242United Kingdom -1,507,317 0 -97,856,201 -6,958,504 62,787,702
Greece -1,213,613 0 16,113,228 -872,224 17,513,762
Hungary -1,052,892 0 -16,811,725 -969,700 37,724,539
Ireland -694,968 0 38,113,374 -12,370,546 41,943,250
Italy -2,287,057 0 -13,537,052 -5,731,556 59,551,583
Lithuania -346,804 0 43,428,201 -4,072,719 15,010,734
Luxembourg -2,512,004 0 -49,133,594 -10,059,565 98,960,044
Latvia -750,789 0 40,702,975 -3,643,971 16,303,496
Mediterranean Sea 0 6,326,872 -2,813,760 22,253,219
Malta -4,582,743 0 16,503,350 -1,962,704 35,342,043
Netherlands -1,839,207 0 -160,234,454 -3,932,583 83,720,717
North Sea 0 -62,893,459 -5,804,228 81,529,100
Poland -708,687 0 -16,952,114 -1,766,426 33,216,115Portugal -942,636 0 -8,728,053 -7,118,130 36,601,103
Sweden -1,540,454 0 18,449,923 -8,443,381 25,183,406
Slovenia -1,792,182 0 2,656,885 -8,206,940 61,989,401
Slovakia -980,983 0 -824,510 -1,532,620 31,320,797
Note: the very low results for Cyprus need validation before they can be used for further quantification.
The effects observed and mechanisms for these effects are the same as described in
Table 18. It is, however, notable that the effect of NOx is more negative for SOMO0
than for SOMO 35.