Embed Size (px)
Citation preview
N A S A TECHNICAL NOTE
DAMPING OF A TORSIONAL OSCILLATOR I N LIQUID HELIUM 4 AND 3 FROM 0.4" TO 2.5O K
N A T I O N A L A E R O N A U T I C S A N D SPACE A D M I N I S T R A T I O N W A S H I N G T O N , D. C. 0 M A R C H 1968
https://ntrs.nasa.gov/search.jsp?R=19680008125 2020-03-29T15:52:11+00:00Z
TECH LIBRARY KAFB, NM
DAMPING OF A TORSIONAL OSCILLATOR IN LIQUID
HELIUM 4 AND 3 FROM 0.4' T O 2.5' K
By Rayjor W. H. Webeler and David C. Hammer
Lewis Research Center Cleveland, Ohio
NATIONAL AERONAUTICS AND SPACE ADMINISTRATION _ _ _ _ ~ ~ ~ ~ ~ -
For. sale by the Clearinghouse far Federal Scientific and Technical Information Springfield, Virginia 22151 - CFSTI prico $3.00
I
DAMPING OF A TORSIONAL OSCILLATOR IN LIQUID
HELIUM 4 AND 3 FROM 0.4' TO 2.5' K
by Rayjor W. H. Webeler and David C. Hammer
Lewis Research Center
SUMMARY
The logarithmic decrements of a piezoelectric, cylindrical, quartz crystal driven in a torsional mode of vibration were determined as a function of temperature with the crystal immersed in liquid helium 3 (He ) and in helium 4 (He ). These measurements were then used to calculate the applicable "viscosity-density" product of each of these two liquids as a function of temperature.
extensive and precise viscosity-density values for He that a r e available to date. Inspec- tion of this viscosity-normal density product (qnpn) data near the lambda point (TX) in- dicates that a discontinuity in qnpn may exist.
Results from this investigation between 2.0' and 1.35' K in liquid He are in reason- ably good agreement with three other investigations. Between 1.1' and 0.95' K, the data presented here substantiate to a large extent only the rotating viscometer results of Woods and Hollis Hallett. At temperatures below 0.6' K where there are no comparable investigations, this crystal decrement has a different significance than at higher temper- atures. In this temperature region this investigation found the phonon density temper- a ture dependence to be T 4'0*0' ', confirming the temperature dependence of the Landau expression for the phonon density.
separating the phonon and roton viscous contributions, but there was evidence of suppres- sion of the phonon viscous contribution.
Viscosity values for liquid He were determined between 0.4' and 2.5' K and are compared with the results of other investigators. Below 0.6' K, these data are in ex- cellent agreement with those of Betts, et al., but they disagree at higher temperatures. ,
3 4
The results of this investigation in the interval 2.14' to 2.20' K represent the most 4
4
No evidence was found that the torsional crystal technique provided a means of
3
INTRODUCTION
In terms of a simple working model, liquid helium 4 (He ) below the h point con- 4
sists of a normal component and a superfluid component. The total density of the liquid is the sum of the superfluid density and the normal density. The superfluid component does not take part in the momentum transfer or viscous properties of the liquid so that only the normal component has a nonzero viscosity coefficient. The Landau theory applied to this model would consider the normal component to consist of two types of thermal excitations called phonons and rotons which transfer momentum as a result of various scattering processes. The normal component may be described as consisting of "particles" with rotons represented by relatively heavy particles and phonons by rela- tively light particles. The density of both rotons and phonons is highly temperature dependent. The roton density is higher above 1' K than the phonon density. Below 0.6' K, the normal component consists mostly of phonons. Thus well below 0.6' K, phonon-phonon scattering predominates.
ponent as a gas of phonons and rotons with very weak interactions below 1.6' K so that a n ideal gas model may be used. The phonons and rotons are t reated as particles. Landau and Khalatnikov divide the viscosity of the normal component into a phonon viscosity
Landau and Khalatnikov (see ref. 1, pp. 106-110) have considered the normal com-
77Ph and a roton viscosity qR. Assuming that phonon-roton collisions ensure the same
drift velocity for both phonons and rotons, 77, = qR + qph where 7, is the total viscosity of the normal component. The roton viscosity is due primarily to roton-roton collisions. The phonon viscosity is due to phonon-roton and phonon-phonon collisions. In addition they have suggested that the roton viscosity is plausibly temperature independent. The phonon viscosity on the other hand is highly temperature dependent. It may be expressed in the form qph = (Ypphc Zph where CY is a constant of proportionality, pph is the phonon density which decreases rapidly with decreasing temperature, c is the velocity of ordin- a r y sound in the liquid, and I is the phonon mean free path which increases rapidly with decreasing temperature. Above 0.9' K, I is determined primarily from phonon- roton collisions. At lower temperatures where the roton density decreases rapidly, phonon-phonon collisions determine I With decreasing temperature, Z increases more rapidly than the phonon density decreases, so that the phonon viscosity increases. If the roton viscosity is constant with temperature, the total viscosity for liquid He4 will be nearly temperature independent just below 1.8' K and then increase as the temper- ature decreases, which agrees with experimental results.
1.0' K between a mechanical rotation technique and one which measured the attenuation of second sound from viscous effects at the wall of a resonant cavity. Also Atkins (ref. 1, p. 110) suggested the torsional crystal technique may partially suppress the
Ph Ph
Ph' Ph
The present work was motivated partly by the discrepancy in viscosity data below
2
phonon viscous decrement but measure the full roton viscous decrement. This would provide a method of separating the roton and phonon viscous decrement. This sugges- tion further stimulated interest in the temperature region just below 1' K, where this effect would be most evident.
The X point transition in liquid He can be carefully examined with the torsional crystal technique as demonstrated by Welber and Quimby (ref. 2). We believed that even better resolution was possible in this region giving very precise viscosity-density mea- surements in the temperature interval on either side of the transition.
4
Liquid He is a system of bosons which may be considered to undergo an imperfect bose condensation at its X point while liquid helium 3 (He ) is a system of fermions which from first principles is not expected to undergo such a condensation. Liquid He 3 is an isotropic collection of like particles having no charge and spin 1/2 with strong interatomic forces. The Landau theory for a strongly interacting system of fermions at temperatures below 0.1' K predicts a viscosity coefficient which varies as T-2. Mea- surements of the viscosity coefficient of liquid He below l. 0' K are available from two previous investigations, but the values disagree by 20 percent. The present investiga- tion was undertaken to resolve this discrepancy.
4 3
3
SYMBOLS
C'
cPX
c S
cx
' 6 6 C
E
F
Fe
FR
KO
Lx
I
2L
additional capacitance
capacitance in parallel with crystal
capacitance
capacitance
applicable rigidity modulus
velocity of ordinary sound in liquid
root mean square voltage across crystal at resonance, IR, V
resonant frequency of ideal torsional rod
electrical resonant frequency of series branch
mechanical resonant frequency
root mean square current, A
"constant" of crystal system
total length of rod
inductance
" .
Ph
Mx N
P
P
Re
RS
RX
Rx, vac
S
TX
vM
'm v (x, t)
vS
wV
z, za,
wd
'b' 'n' ' s ) Q
6F2R A
77
phonon mean free path
mass of crystal, M
number of particles per cm
classical momentum per particle
pressure
radial coordinate of end faces
variable bridge resistance
measured crystal resistance at resonance, ohm
crystal resistance in vacuum corresponding to temperature at which Rx is
3
measured
radius of crystal cylinder
total surface area of crystal
temperature at X point
maximum velocity of point on rim of cylinder
maximum velocity of point on element of area
velocity of particle in fluid at distance x from plane surface at time t
velocity of shear in quartz
energy dissipated per cycle, J/cycle
energy of vibration (maximum)
impedance
constant of proportionality
width of resonance curve at half power point
logarithmic decrement
logarithmic decrement due to fluid surrounding crystal
viscosity coefficient of liquid (shearing stress/velocity gradient normal to flow)
total viscosity of normal component, 77, = vph + qR phonon viscosity
roton viscosity
4
e polar angle
instantaneous angular velocity
maximum angular velocity corresponding to point on end face or rim of cylinder
C . B. L. thickness (depth)
density of liquid (fluid)
density of normal component of liquid helium 4
density of quartz crystal
phonon density
roton density
ANALYTICAL CONSIDERATION
A cylindrical alpha quartz crystal may be driven in a fundamental torsional mode of vibration by the proper application of an alternating electrical field. Such a crystal, ground in the shape of a right circular cylinder, must have one of the three "electric axes" of its lattice alined parallel to the geometric cylindrical axis in order to produce a fundamental torsional mode of vibration. This torsional mode will be relatively pure provided additional care is taken to aline the alternating electric field with respect to the 'lOPtiC", 1tX" , and "y" axes of the quartz crystal. Such alinement of the alternating
field with respect to the crystal lattice is discussed by Mason (ref. 3, p. 91) in his treatise on piezoelectricity and need not be repeated here.
perpendicular to the longitudinal axis of the quartz cylinder with a stress node at either end. The crystal is suspended freely at the central strain node.
The fundamental torsional mode of vibration consists of a s t ra in node at the midplane
When this cylindrical quartz crystal is oscillating at resonance in a fluid such as liquid helium, energy is dissipated because of
(1) Internal friction of the quartz crystal, (2) Mounting or suspension losses, and (3) Viscous forces of the liquid
Additional sources of energy dissipation arise from sound waves because of imperfect alinement of the crystal and from deviations in the shape of the crystal from a perfect right circular cylinder during torsion (ref. 4). Specifically when half the circumference of the c rys ta l o r half the inside circumference of the electrode boundary wall is not less than one wavelength of sound in the sample fluid, an &wanted resonant condition will probably exist at certain sample fluid temperatures. This will result from the formation of standing sound waves around the inside of the boundary wall, with one or more integral
5
4
number of wavelengths around one-half the "crystal" circumference. This resonance may be eliminated by selecting a crystal with a satisfactory small ratio of diameter to length and placing the electrode boundary wall near the crystal surface.
As a consequence of the previously mentioned causes of dissipation, electrical energy must be supplied externally in order to maintain a constant amplitude at resonance. One expects the crystal amplitude and the power dissipated to be a maximum at resonance for a given peak alternating voltage of the driving electric field. The "viscosity times density" of the surrounding fluid is a function of the logarithmic decrement A for the crystal system.
The logarithmic decrement of a piezoelectric crystal or of any mechanical vibratory system is defined by the quotient of energy dissipated per cycle wd divided by twice the energy of vibration Wv. In this case the energy of vibration is simply the maximum kinetic energy attained by the crystal during a cycle.
Mechanically this crystal is simply a torsional rod clamped at the center with both ends free such that these ends may twist in opposite directions. If the total length of such a rod is taken as 2L and this rod is oriented such that the applicable rigidity modulus is c669 then the resonant frequency of the torsional rod F is given by (ref. 3, P. 67)
where p is the density of the quartz crystal. Q The mechanical resonant frequency FR for this crystal rod will be nearly equal to
the resonant frequency of the ideal crystal described. The equivalent circuit for the crystal in the system (fig. 1) consists of a series resonant branch having an inductance
capacitance Cx, and resistance Rx; these being in parallel with an additional capacitance C'. (A detailed analysis of crystal equivalent circuits is given by both Mason and Cady, refs. 3 (p. 67) and '5, respectively). The electrical resonant frequency for the series branch of this circuit is well-known and given by Fe = (1/27r)(l/'-LC). This is also equal to the resonant frequency of the entire circuit provided it is defined as that frequency at which the external current flow is a maximum. There is also a frequency for the equivalent circuit at which the external current flow is a minimum. This is called the antiresonant frequency. In a high "Q" system such as this one, this antiresonant frequency wil l be very near to but slightly higher than the resonant fre- quency FR.
At the resonant frequency of the series branch, the crystal exhibits only electrical resistance and no reactance. Under these conditions there is a relation between viscosity times density of the surrounding fluid and the crystal resistance in ohms (see appendix).
Lx9
-
6

I
Crystal equivalent
C'
(a) Crystal equivalent circuit.
(b) AC capacitance bridge for viscosity times density measurements. c" = C + C', X represents crystal reactance (0 at resonance), and z,, zb, z,, 5, are arm impedances. PX
Figure 1. - Equivalent circuitry.
7
II I II I I I I I I I 1111 I I .I I
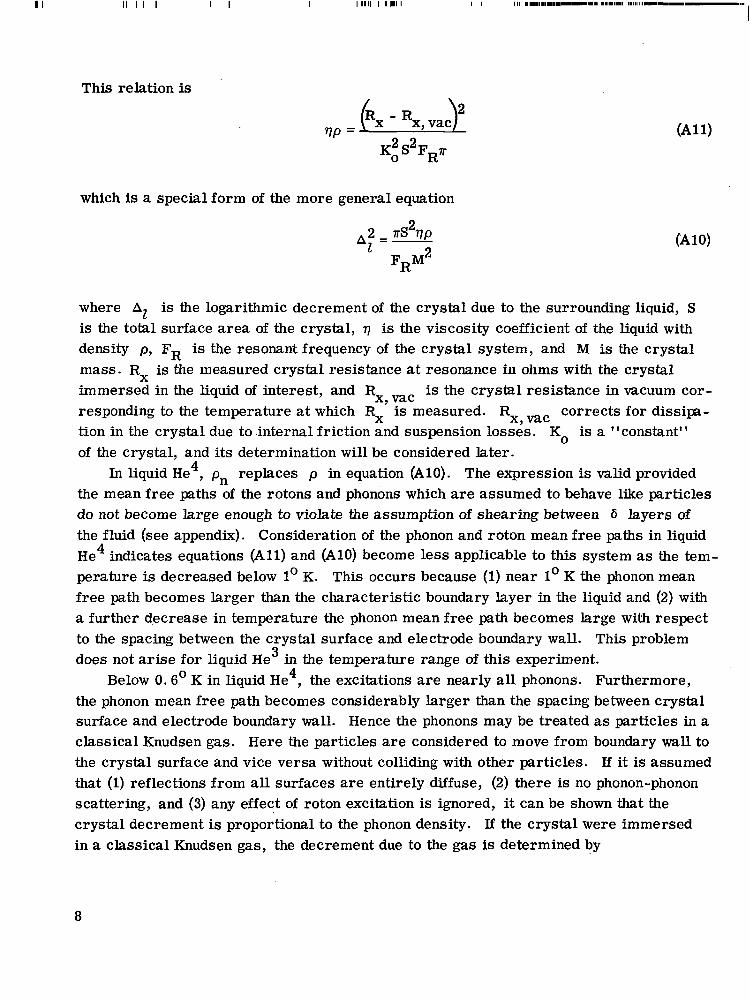
This relation is
which is a special form of the more general equation
A 2 =- aS271p 2
F ~ M ~ (A 10)
where AI is the logarithmic decrement of the crystal due to the surrounding liquid, S is the total surface area of the crystal, q is the viscosity coefficient of the liquid with density p, FR is the resonant frequency of the crystal system, and M is the crystal mass . R, is the measured crystal resistance at resonance in ohms with the crystal immersed in the liquid of interest, and Rx, is the crystal resistance in vacuum cor- responding to the temperature at which Rx is measured. corrects for dissipa- tion in the crystal due to .internal friction and suspension losses. KO is a "constant" of the crystal, and its determination will be considered later.
Rx, vac
In liquid He , pn replaces p in equation (A10). The expression is valid provided the mean free paths of the rotons and phonons which are assumed to behave like particles do not become large enough to violate the assumption of shearing between 6 layers of the fluid (see appendix). Consideration of the phonon and roton mean free paths in liquid He indicates equations (Al l ) and (A10) become less applicable to this system as the tem- perature is decreased below 1' K. This occurs because (1) near 1' K the phonon mean free path becomes larger than the characteristic boundary layer in the liquid and (2) with a further decrease in temperature the phonon mean free path becomes large with respect to the spacing between the crystal surface and electrode boundary wall. This problem does not arise for liquid He in the temperature range of this experiment.
Below 0.6' K in liquid He4, the excitations are nearly all phonons. Furthermore,
4
3
the phonon mean free path becomes considerably larger than the spacing between crystal surface and electrode boundary wall. Hence the phonons may be treated as particles in a classical Knudsen gas. Here the particles are considered to move from boundary wall to the crystal surface and vice versa without colliding with other particles. If it is assumed that (1) reflections from all surfaces are entirely diffuse, (2) there is no phonon-phonon scattering, and (3) any effect of roton excitation is ignored, it can be shown that the crystal decrement is proportional to the phonon density. If the crystal were immersed in a classical Knudsen gas, the decrement due to the gas is determined by
8
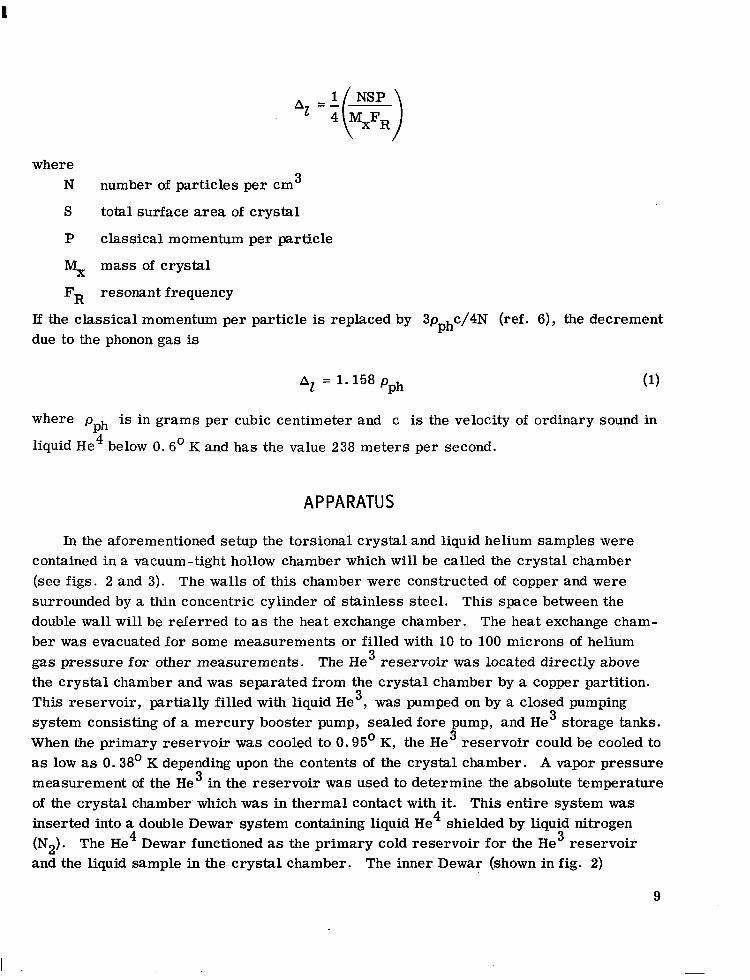
where N number of particles per cm 3
S total surface area of crystal
P classical momentum per particle
Mx mass of crystal
FR resonant frequency
If the classical momentum per particle is replaced by 3p c/4N (ref. 6), the decrement due to the phonon gas is
Ph
Az = 1.158 p Ph
where p is in grams per cubic centimeter and c is the velocity of ordinary sound in
liquid He below 0.6' K and has the value 238 meters per second. Ph 4
APPARATUS
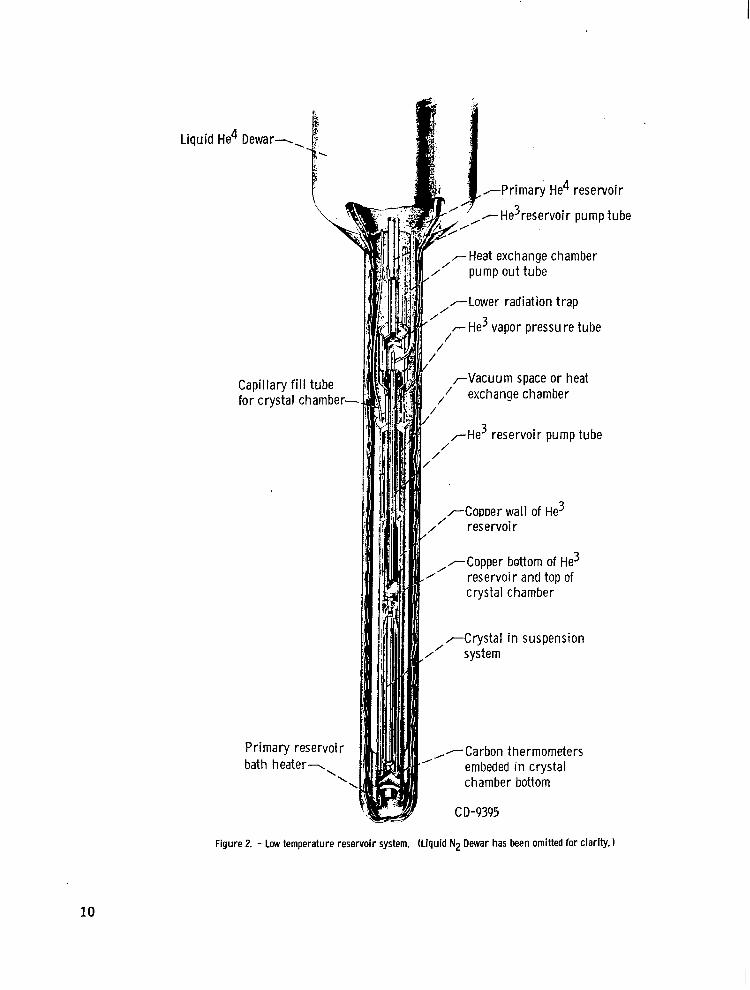
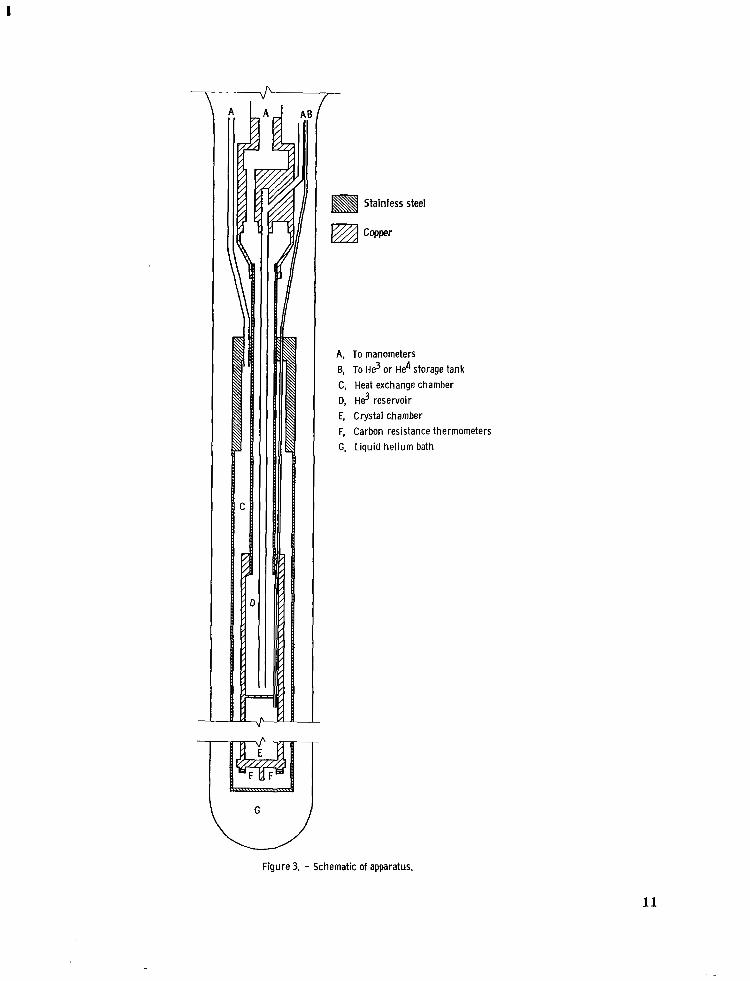
In the aforementioned setup the torsional crystal and liquid helium samples were contained in a vacuum-tight hollow chamber which will be called the crystal chamber (see figs. 2 and 3). The walls of this chamber were constructed of copper and were surrounded by a thin concentric cylinder of stainless steel. This space between the double wall will be referred to as the heat exchange chamber. The heat exchange cham- ber was evacuated for some measurements or filled with 10 to 100 microns of helium gas pressure for other measurements. The He reservoir was located directly above the crystal chamber and was separated from the crystal chamber by a copper partition. This reservoir, partially filled with liquid He3, was pumped on by a closed pumping system consisting of a mercury booster pump, sealed fore pump, and He storage tanks. When the primary reservoir was cooled to 0.95' K, the He reservoir could be cooled to as low as 0.38' K depending upon the contents of the crystal chamber. A vapor pressure measurement of the He in the reservoir was used to determine the absolute temperature of the crystal chamber which was in thermal contact with it. This entire system was inserted into a double Dewar system containing liquid He shielded by liquid nitrogen (N2). The He Dewar functioned as the primary cold reservoir for the He reservoir and the liquid sample in the crystal chamber. The inner Dewar (shown in fig. 2)
3
3 3
3
4 4 3
9
Liqu lid H
,- He vapor pressure tube 3
Capillary fill tube for crystal chamber--
,-Vacuum space o r heat ' exchange chamber
,-He reservoir DumD tube 3
Pr imary reservoir
r C o p o e r w a l l of He3 /' reservoir
-Copper bottom of He3
crystal chamber ' reservoir and top of /
-Crystal in suspension I // system
,-Carbon thermometers embeded in crystal chamber bottom
" jL ' / 1 - P r F a r y He 4 resen
- -He reservoir pump /
,
-Heat exchange chamber pump out tube
11 ,/-Lower radiation trap
C D-9395
/oi r
tube
Figure 2. - Low temperature reservoir system. (Liquid N2 Dewar has been omitted for clarity.)
10
I
A, To manometers B, To He3 or He4 storage tank C, Heat exchange chamber D, He3 reservoir E, Crystal chamber F, Carbon resistance thermometers G. Liquid helium bath
Figure 3. - Schematic of apparatus.
11
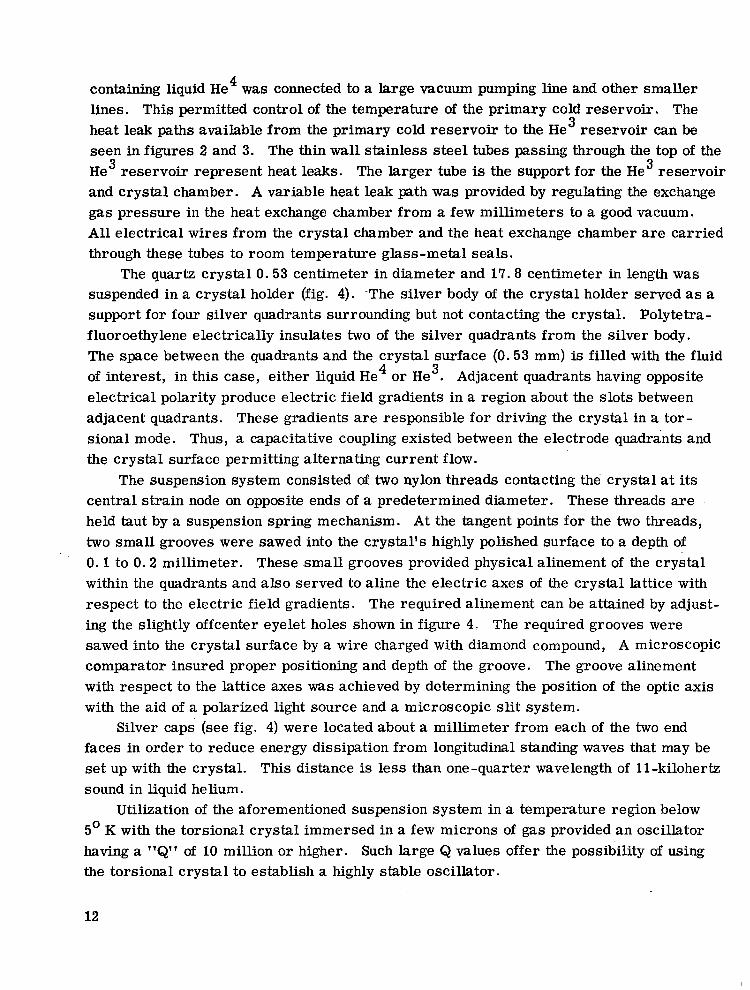
containing liquid He was connected to a large vacuum pumping line and other smaller lines. This permitted control of the temperature of the primary cold reservoir. The heat leak paths available from the primary cold reservoir to the He reservoir can be seen in figures 2 and 3. The thin wall stainless steel tubes passing through the top of the He reservoir represent heat leaks. The larger tube is the support for the He reservoir and crystal chamber. A variable heat leak path was provided by regulating the exchange gas pressure in the heat exchange chamber from a few millimeters to a good vacuum. All electrical wires from the crystal chamber and the heat exchange chamber are carr ied through these tubes to room temperature glass-metal seals.
suspended in a crystal holder (fig. 4). 'The silver body of the crystal holder served as a support for four silver quadrants surrounding but not contacting the crystal. Polytetra- fluoroethylene electrically insulates two of the silver quadrants from the silver body. The space between the quadrants and the crystal surface (0.53 mm) is filled with the fluid of interest, in this case, either liquid He or He . Adjacent quadrants having opposite 4 3
electrical polarity produce electric field gradients in a region about the slots between adjacent quadrants. These gradients are responsible for driving the crystal in a tor- sional mode. Thus, a capacitative coupling existed between the electrode quadrants and the crystal surface permitting alternating current flow.
4
3
3 3
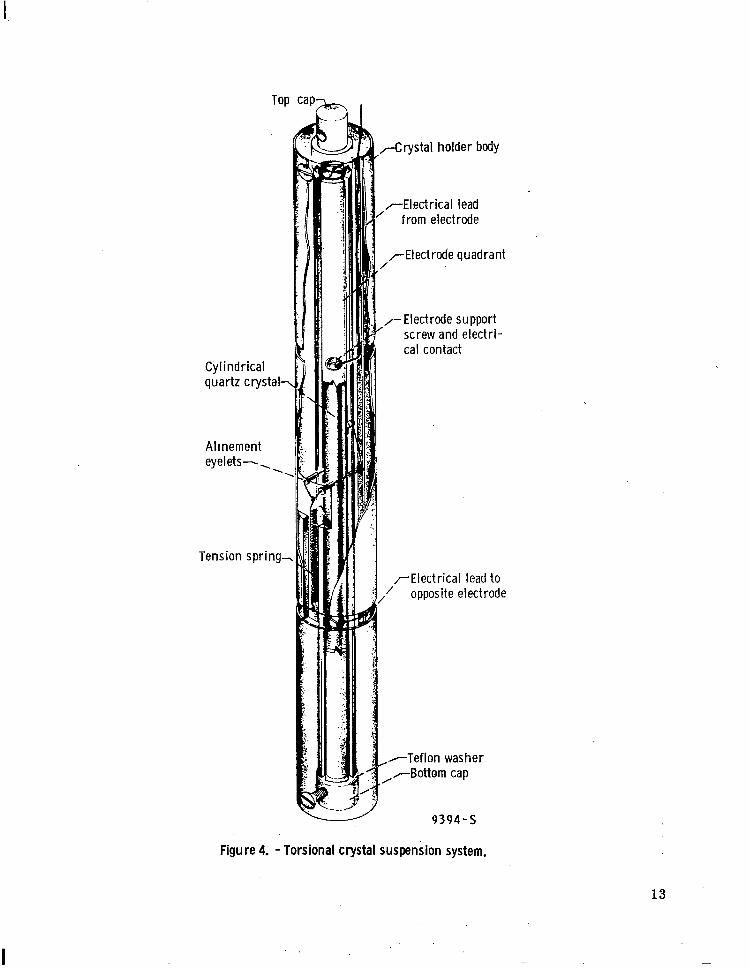
The quartz crystal 0.53 centimeter in diameter and 17.8 centimeter in length was
The suspension system consisted of two nylon threads contacting the crystal at its central strain node on opposite ends of a predetermined diameter. These threads are held taut by a suspension spring mechanism. At the tangent points for the two threads, two small grooves were sawed into the crystal's highly polished surface to a depth of 0 .1 to 0.2 millimeter. These small grooves provided physical alinement of the crystal within the quadrants and also served to aline the electric axes of the crystal lattice with respect to the electric field gradients. The required alinement can be attained by adjust- ing the slightly offcenter eyelet holes shown in figure 4. The required grooves were sawed into the crystal surface by a wire charged with diamond compound, A microscopic comparator insured proper positioning and depth of the groove. The groove alinement with respect to the lattice axes was achieved by determining the position of the optic axis with the aid of a polarized light source and a microscopic slit system.
Silver caps' (see fig. 4) were located about a millimeter from each of the two end faces in order to reduce energy dissipation from longitudinal standing waves that may be set up with the crystal. This distance is less than one-quarter wavelength of 11-kilohertz sound in liquid helium.
Utilization of the aforementioned suspension system in a temperature region below 5' K with the torsional crystal immersed in a few microns of gas provided an oscillator having a "Q" of 10 million or higher. Such large Q values offer the possibility of using the torsional crystal to establish a highly stable oscillator.
12
Cylindrical quartz crystal-
Allnement eyelets-,..
Tension spring-
rCrystal holder body
/-Electrical lead
TElectrode quadrant
/-Electrode support screw and electri-
r E l e c t r i c a l lead to
-Teflon washer
I
9394-s
Figure 4. - Torsional crystal suspension system.
13
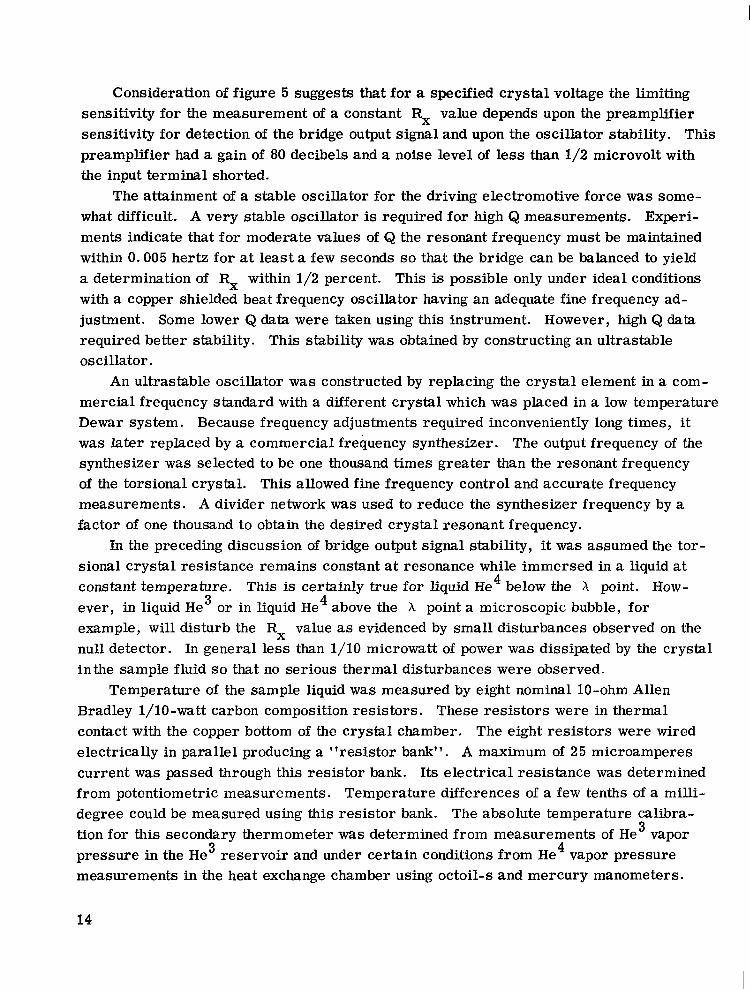
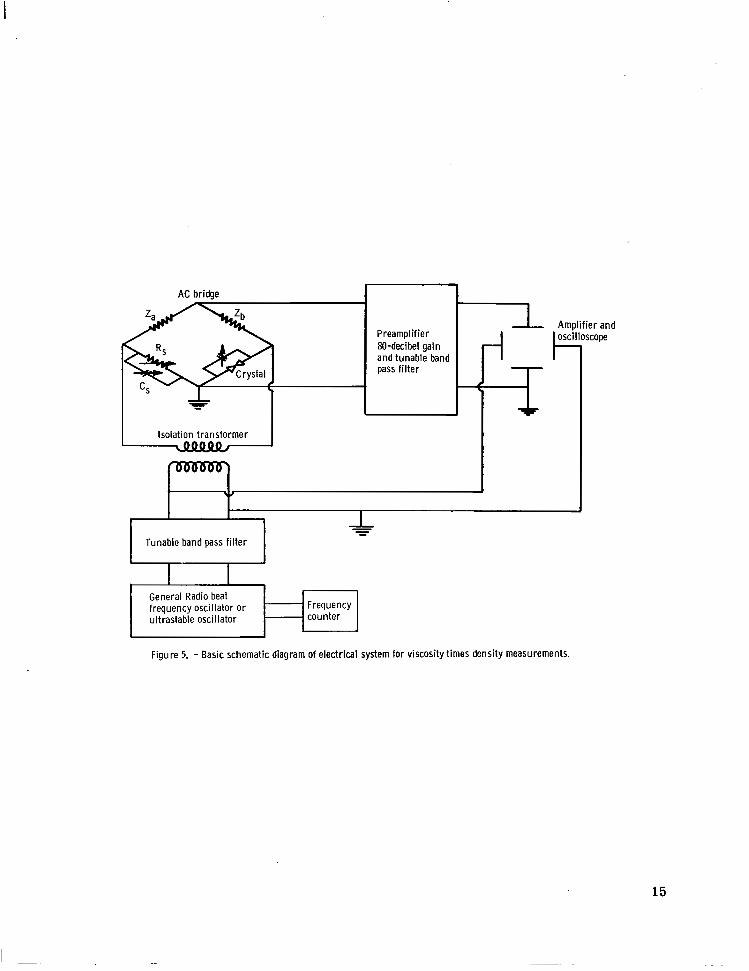
Consideration of figure 5 suggests that for a specified crystal voltage the limiting sensitivity for the measurement of a constant Rx value depends upon the preamplifier sensitivity for detection of the bridge output signal and upon the oscillator stability. This preamplifier had a gain of 80 decibels and a noise level of less than 1/2 microvolt with the input terminal shorted.
The attainment of a stable oscillator for the driving electromotive force was some- what difficult. A very stable oscillator is required for high Q measurements. Experi- ments indicate that for moderate values of Q the resonant frequency must be maintained within 0.005 hertz for at least a few seconds so that the bridge can be balanced to yield a determination of Rx within 1/2 percent. This is possible only under ideal conditions with a copper shielded beat frequency oscillator having an adequate fine frequency ad- justment. Some lower Q data were taken using this instrument. However, high Q data required better stability. This stability was obtained by constructing an ultrastable oscillator.
An ultrastable oscillator was constructed by replacing the crystal element in a com- mercial frequency standard with a different crystal which was placed in a low temperature Dewar system. Because frequency adjustments required inconveniently long times, it was later replaced by a commercial frequency synthesizer. The output frequency of the synthesizer was selected to be one thousand times greater than the resonant frequency of the torsional crystal. This allowed fine frequency control and accurate frequency measurements. A divider network was used to reduce the synthesizer frequency by a factor of one thousand to obtain the desired crystal resonant frequency.
In the preceding discussion of bridge output signal stability, it was assumed the tor- sional crystal resistance remains constant at resonance while immersed in a liquid at constant temperature. This is certainly t r u e for liquid He below the X point. How- ever , in liquid He or in liquid He above the X point a microscopic bubble, for example, will disturb the Rx value as evidenced by small disturbances observed on the null detector. In general less than 1/10 microwatt of power was dissipated by the crystal inthe sample fluid so that no serious thermal disturbances were observed.
4 3 4
Temperature of the sample liquid was measured by eight nominal 10-ohm Allen Bradley l/lO-watt carbon composition resistors. These resistors were in thermal contact with the copper bottom of the crystal chamber. The eight resistors were wired electrically in parallel producing a "resistor bank". A maximum of 25 microamperes current was passed through this resistor bank. Its electrical resistance was determined from potentiometric measurements. Temperature differences of a few tenths of a milli- degree could be measured using this resistor bank. The absolute temperature calibra- tion for this secondary thermometer was determined from measurements of He vapor pressure in the He reservoir and under certain conditions from He vapor pressure 3 4
measurements in the heat exchange chamber using octoil-s and mercury manometers.
3
14
AC bricbe n
Isolation transformer
.I
Amplifier and oscilloscope
1 I I.". J
- - - Tunable band pass fi l ter
General Radio beat frequency oscillator or Frequency ultrastable oscillator counter
Figure 5. - Basic schematic diagram of electrical system for viscosity times density measurements.
15
Later the manometers were replaced by fused quartz precision bourdon tube pressure gages. These were found to be very satisfactory for vapor pressure determinations because of their rapid read out and excellent sensitivity. A graphical f i t was then applied to these calibration points which determined "resistor bank" resistance as a function of temperature. At lower temperatures, a vented germanium thermometer immersed in the sample liquid proved very reliable. Temperature cycles from helium temperature to room temperature have much less effect on the calibration of germanium thermometers than carbon thermometers.
EXPERIMENTAL PROCEDURE
The crystal resistance was measured by capacitance coupling to the electrode quad- rants thereby eliminating the need for a mechanical contact. The electrode quadrants were connected to one a r m of a modified Schering capacitance bridge by small electrical wires running within the capillary f i l l tube from the crystal chamber. A capacitance C (fig. 1, p. 7) was inserted in parallel with the crystal to keep the a r m containing the crystal capacitative at frequencies slightly above the resonance frequency. The bridge is always used with impedance Za set equal to impedance zb' Hence, when a null signal is observed on the oscilloscope, the bridge is balanced and Zu = Zs. The follow- ing procedure was used to establish the resonant frequency FR and the crystal resistance at resonance.
The bridge was first balanced at frequencies far from resonance where the crystal
PX
branch containing R,, Lx, and C, essentially exhibits an infinite impedance. This was done by setting Rs = ~0 and varying the resultant pure capacitance Cs in a r m S. The capacitance Cs at which the bridge balances is then equal to the capacitance C" of the crystal arm. Keeping Cs = C" results in the bridge being balanced at FR- Under this condition a balance at FR can only be obtained with Rs = R,. Hence such a balance yields both FR and R, simultaneously.
t imer which has a maximum input frequency rate of 15 megahertz and a maximum gate time of 10 seconds.
The resonant frequency at bridge balance was obtained by viewing a counter and
The crystal constant KO was determined by measuring the logarithmic decrement directly from the half width of the resonant peak. A plot of R,/Z, consists ideally of a symmetric sharp peak. The half power point of this peak occurs when the bridge resist- ance Rs equals 2R,. The Q of the peak is defined as
16
where 6F2R is the width of the resonance curve at the half power point. From the previous equation and equation (A2) the following equation may be Witten:
K = RX nM6FZR
which is the expression employed in the determination of KO for the particular temper- ature of interest. .The pr.evious expression indicates that the frequency must be measured with good precision.
The crystal chamber was evacuated and gradually cooled from room temperature to liquid nitrogen temperature over a period of about 36 hours. The primary reservoir was then cooled to about 1.2' K. Next He gas was condensed into the He reservoir and the sample fluid was condensed into the crystal chamber. For liquid He measurements considerable care was taken to find a favorable liquid level for reasons considered below. When the crystal chamber was slowly filled with liquid He at 1.2' K, the crystal resist- ance varied a number of t imes between maximum and minimum values. A favorable level was considered to correspond to a minimum crystal resistance value. This variation in crystal resistance at constant temperature with liquid level was observed only in liquid He . It was a resonance condition that may be due to second sound waves inducing first sound waves in the He vapor at the liquid vapor interface. At certain liquid levels this could produce first sound standing waves in the vapor between the liquid surface and the crystal chamber top thereby producing additional damping of the crystal. However, if the liquid was at a favorable level this unwanted additional loading of the crystal was reduced considerably. Not to be confused with the aforementioned problem, unwanted first sound loading of the crystal may also be produced by an improper choice of crystal circumference for a given crystal length as mentioned previously in the section ANALYTICAL CONSIDERATIONS.
3 3 4
4
4 4
Procedure for Measurements Near the A Point
After condensation of liquid He was complete in the crystal chamber, the carbon 4
resistor thermometer bank was calibrated from He vapor pressure measurements and later from He vapor pressure measurements.' A series of calibration points was taken at nearly constant temperature in the range 1.9' to 2.15' K and then later above the X point (TX = 2.172' K) by correlating resistor bank voltages with the corresponding vapor pressure. Over this temperature range below TX, the liquid He bath reservoirs are at uniform temperature. Both the He and He vapor pressures are rapidly changing
3 4
4 3 4
17
functions of temperature so that very accurate absolute temperature determinations are possible. Between calibrations, crystal resistance measurements were taken simulta- neously with resistance bank voltage measurements. Near 2.15' K the temperature cali- bration of the resistor bank below TX was stopped. Only measurements of crystal resistance against resistor bank voltage were taken as the temperature slowly increased through TX. For the small temperature range above the X point, a reliable calibration of the resistor bank was obtained by extrapolating from calibration points taken near but below the X point. Calibration points taken above the X point were considered less reliable because of the poor heat transfer properties of liquid He above TX. The rate of change of temperature of the crystal chamber was small enough so that about fifteen crystal resistance measurements (and hence qnpn determinations) could be synchronized with resis tor bank voltages between 2.15' K and the X point. No data were obtained between TX - 0.0015° and TX + 0.0005° K. The reason for this is that in this small temperature interval the ac bridge could not be balanced because the values changed too rapidly. Above the X point, measurements were continued to about 2.20' K. Also here it was necessary to depend upon the silver crystal holder body, silver electrode quad- rants, and copper wall to produce a uniform temperature in the sample fluid. This ex- periment near the h point was performed also with the temperature slowly decreasing and with different fluids in the He reservoir and heat exchange chamber with nearly identical results.
4
3
Procedure for Measurements in Liquid He4 Below lo K
In order to reduce the crystal chamber temperature below 1' K, the He reservoir 3
was pumped with either a fore pump or a mercury booster pump. The thermometer res is tor bank was calibrated from He reservoir vapor pressure measurements using a McLeod gage and making any applicable thermomolecular correction (ref. 7). Consider- able care was taken to avoid contaminating the pure liquid He with He . A t 0.4' K, 10 parts per million of He in liquid He alters the density of the normal component of He significantly, since He effectively becomes part of the "normal component. I ' The density of the normal component of liquid He at 0.4' K is only about 0.5~10-~ gram per 4
cubic centimeter. Various pump down temperatures for the He reservoir were selected by adjusting a metering valve. Measurements of crystal resistance and resistor bank voltage were synchronized as the temperature of the crystal chamber was slowly cycled from 1.0' to 0.38' K. At low temperatures in He4, an accurate determination of crystal resistance in "vacuum" is important since it becomes a significant portion of the total crystal resistance in liquid He (for heat exchange purposes a vacuum was approximated by a few microns of exchange gas). This was accomplished by measuring the crystal
3
4 3 3 4
4 3
3
4
18
resistance as a function of temperature in a few microns of He gas before the liquid He experiment and in a few microns of He gas after the experiment. The "vacuum" resistance for this crystal system varied from 81 ohms at 2.0' K to 114 ohms at 0.4' K.
4 4 3
Procedure for Measurements in Liquid He3
The procedure for measurements in liquid He was similar to that already described 3
for liquid He . As mentioned previously, the liquid level of He in the crystal chamber had no detectable effect provided the crystal was completely covered. The crystal resistance in liquid He at low temperatures was small compared to that for liquid He . 4 3
Therefore the correction for the "vacuum" resistance is less important in He3. ' Liquid He is a very poor thermal conductor so that the silver crystal holder body, silver electrode quadrants, and copper wall again had to be depended on to provide uniform tem- perature for the sample bath. As a consequence, measurements were taken with the temperature changing at much slower rates than for liquid He below the h point.
4 3
3
4
RESULTS AND DISCUSSION
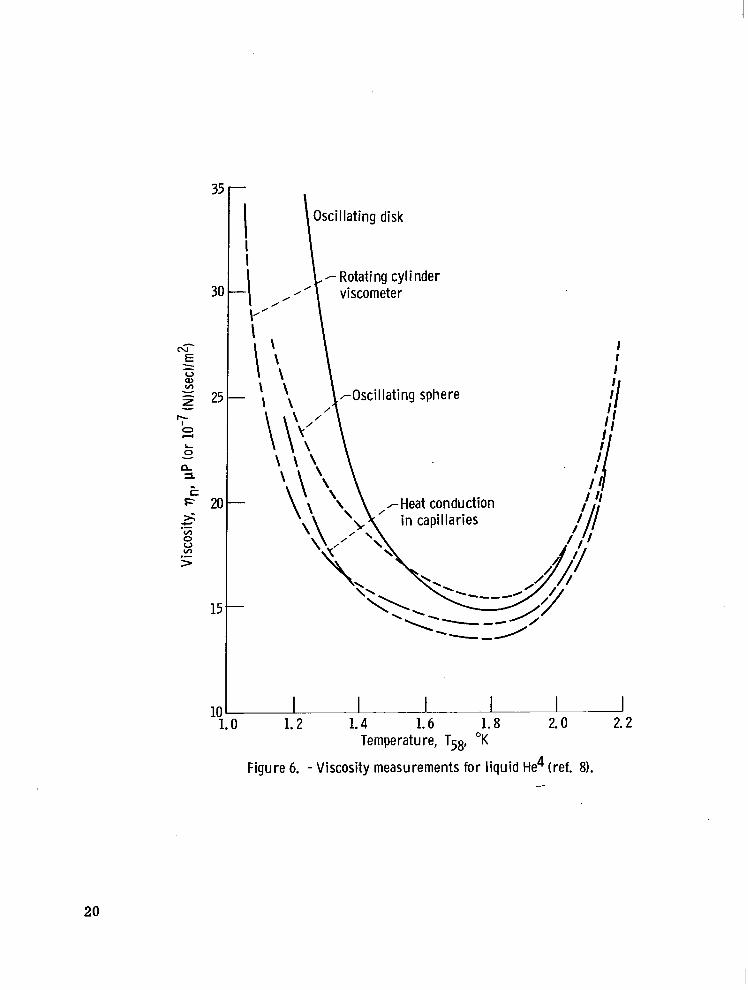
Wide divergence of viscosity values for liquid He as a function of temperature was 4
reported by Reynolds, et al. (ref. 8). Their figure is shown in figure 6. The wide discrepancies are in part due to the very small viscous dissipation that takes place in the liquid even though the viscosity coefficient of the normal component is substantial. Measurements of such small viscous dissipations are easily disturbed by perturbations which would have no effect in a more dissipative liquid.
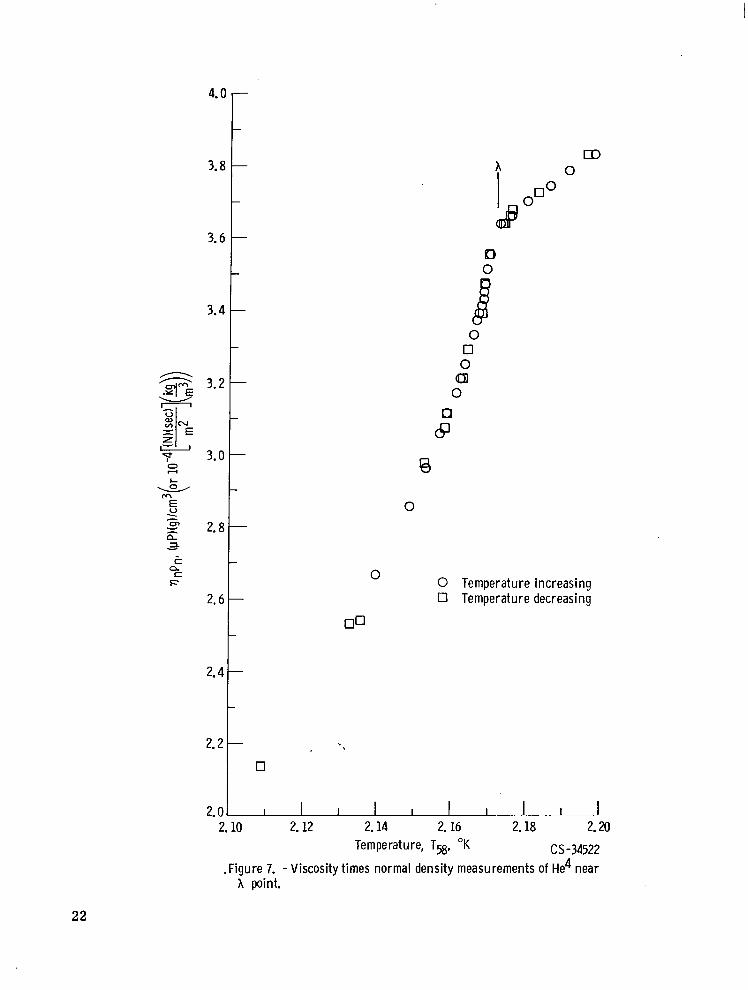
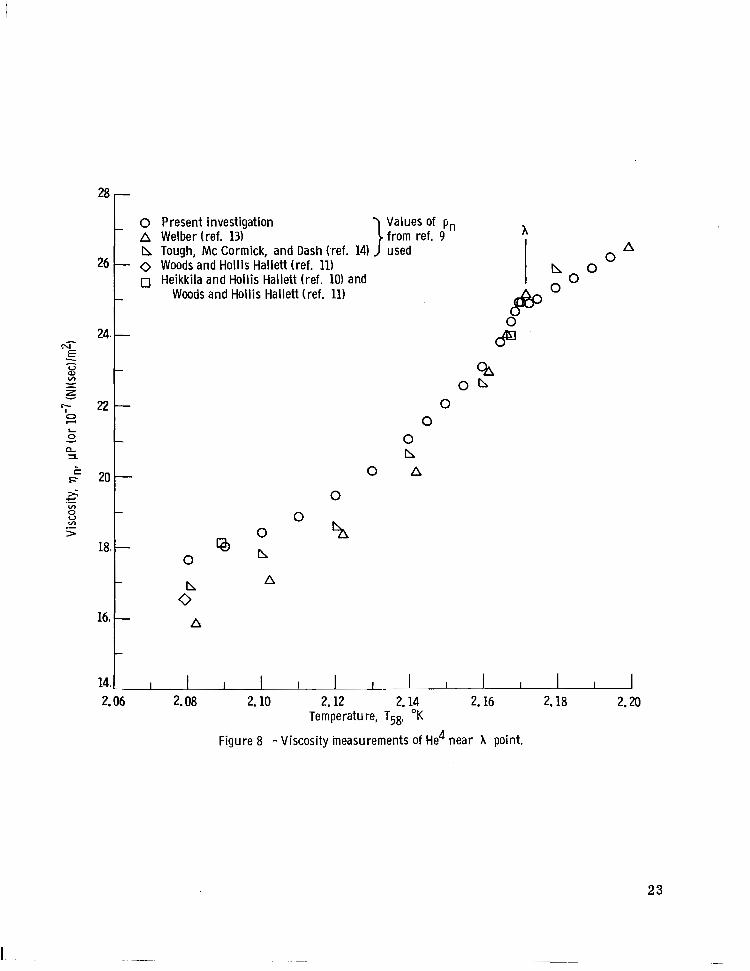
The temperature dependence of qnpn near TA has been measured with better precision in this experiment than in previous investigations. The temperature dependence of viscosity alone was determined using normal density values calculated by Reynolds, e t al. (ref. 9). The resultant viscosity values near TA are in good agreement with values quoted in references 10 and 11. These values were obtained with a rotating cylin- der viscometer which measures viscosity independent of normal density. The qnpn data shown in figure 7 represent two separate experiments covering approximately the same temperature range. In one the temperature of the liquid increased slowly, while in the other the temperature decreased slowly. These two experiments differed in their rates of change of temperature and also in the fluids that occupied the heat exchange chamber and the He reservoir. Temperature differences between successive data points were measured to better than 0.2 millidegree below TA. The absolute temper- ature calibration may be in error by a greater amount. The rate of change of crystal
3
19
35
Oscillating disk
-Rotating cylinder 30 viscometer
10 >- 1.0 1.2 1.4 1.6 1.8 2.0 2.2
Temperature, T5& "K
Figure 6. - Viscosity measurements for liquid He4 (ref. 8). -
20
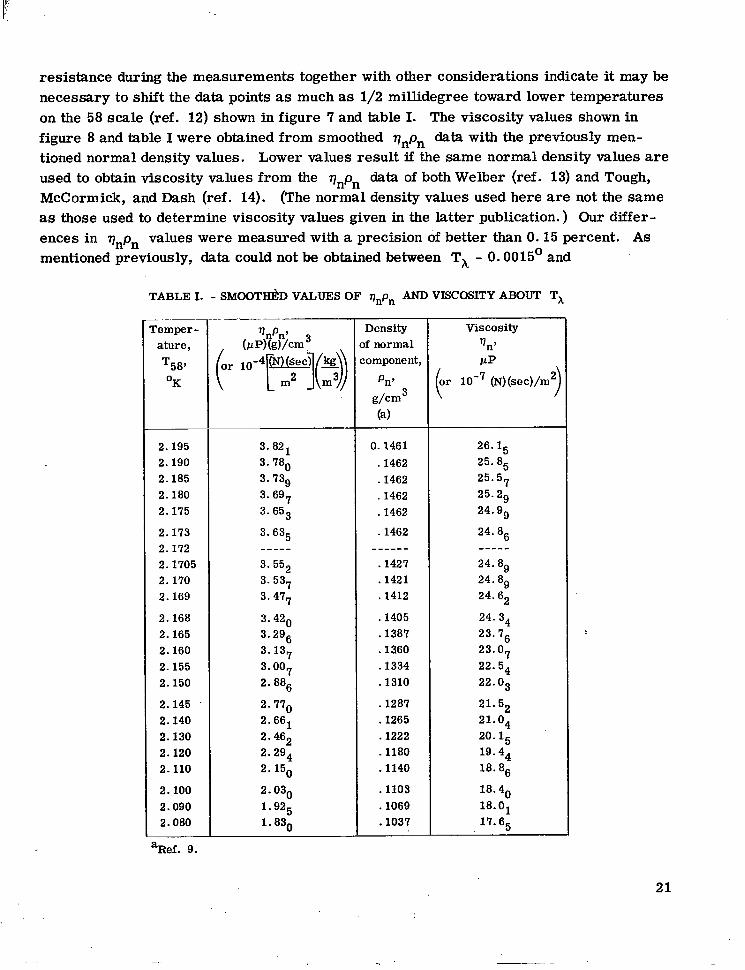
resistance during the measurements together with other considerations indicate it may be necessary to shift the data points as much as 1/2 millidegree toward lower temperatures on the 58 scale (ref. 12) shown in figure 7 and table I. The viscosity values shown in figure 8 and table I were obtained from smoothed qnpn data with the previously men- tioned normal density values. Lower values result if the same normal density values are used to obtain viscosity values from the qnpn data of both Welber (ref. 13) and Tough, McCormick, and Dash (ref. 14). (The normal density values used here are not the same as those used to determine viscosity values given in the latter publication. ) Our differ- ences in qnpn values were measured with a precision of better than 0.15 percent. As mentioned previously, data could not be obtained between TX - 0.0015° and
TABLE I. - SMOOTH~D VALUES OF vnpn AND VISCOSITY ABOUT T~
~
aRef. 9.
remper - ature , T58y O K
2.195 2.190 2.185 2.180 2.175
2.173 2.172 2.1705 2.170 2.169
2.168 2.165 2.160 2.155 2.150
2.145 .
2.140 2.130 2.120 2.110
2.100 2.090 2.080
3. 821 3. 780
3. 6g7 3. 653
3. 635
3. 739
""_ 3. 552 3. 537 3. 4v7
3.420 3. 2g6 3. 137 3. 007 2. 886
2. 2. 661 2. 462 2. 2g4 2. 150
2. 030 1. 925 1. 830
Density )f normal :omponent,
Pn7
( 4 d c m 3
-.
0.1461 . 1462 .1462 . 1462 .1462
.1462 """
.1427
.1421
.1412
.1405
.1387
.1360
.1334
.1310
.1287
.1265
.1222 -1180 .1140
.1103
. lo69
. lo37
~ ~~
26. l5 25. 85 25. 57 25. 29 24. g9
24. 86
24. 89 24. 89 24. 62
24. 34 23. 76 23. O7
""_
22. s4 22. o3
21. o4 20. l5 19. 44
21. 52
18. 86
18. 40 18. O1 17. 65
21
Q 0
0 0 0 Q 0 0
67
0
0 0 Temperature increasing 0 Temperature decreasing
I I I 1 I I I
2.10 2.12 2.14 2. 16 2.18 2.20 Temperature, TB, "K C S -34522
.Figure 7. - Viscosity times normal density measurements of He4 near h point.
22
0 Present investigation Values of p,, A Welber (ref. 13) from ref. 9 h n Tough, M c Cormick, and Dash (ref. 14) A 0 Woods and Hollis Hallett (ref. 11) 0
0 Heikkila and Hollis Hallett (ref. 10) and Woods and Hollis Hallett (ref. 11)
N- E - - v) 0) V 0, - 1 z o n
22 0 s 0 L
1 0 0 I n a
F ti 20 0 A
0 n
A
A
14. I I I 1 I I I I", I I I
2.06 2.08 2.10 2.12 2.14 2.16 2.18 2.20 Temperature, T5& "K
Figure 8 -Viscosity measurements of He4 near h point.
L
23
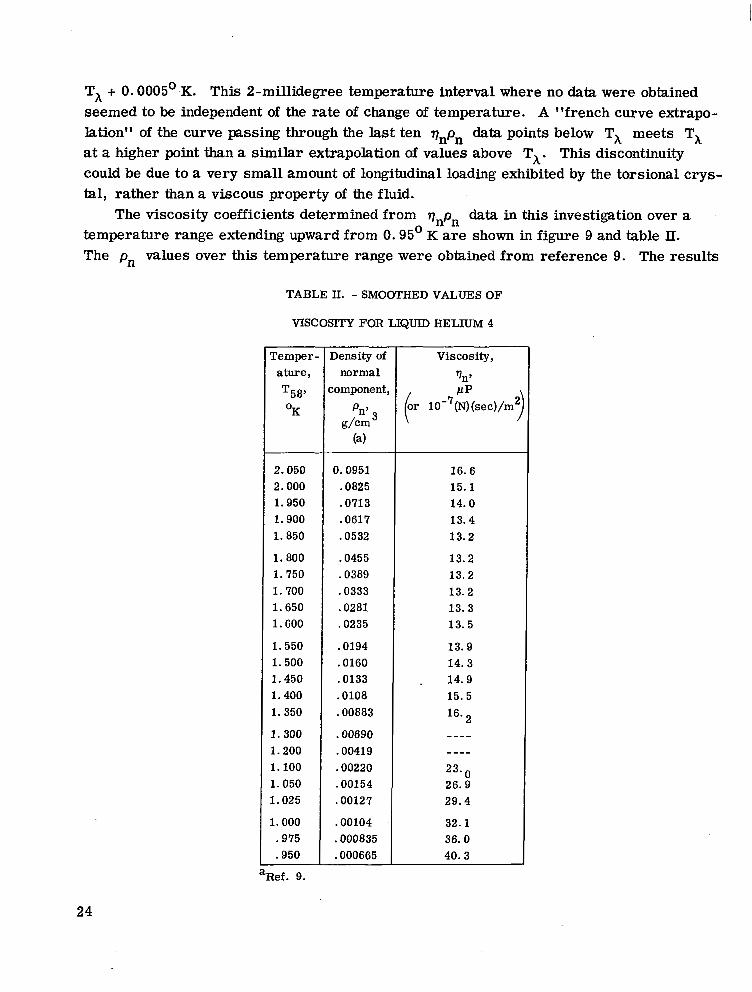
TA + 0.0005° K. This 2-millidegree temperature interval where no data were obtained seemed to be independent of the rate of change of temperature. A "french curve extrapo- lation" of the curve passing through the last ten ~~p~ data points below TA meets TA at a higher point than a similar extrapolation of values above TA. This discontinuity could be due to a very small amount of longitudinal loading exhibited by the torsional crys- tal, rather than a viscous property of the fluid.
The viscosity coefficients determined from qnpn data in this investigation over a temperature range extending upward from 0.95' K are shown in figure 9 and table II. The pn values over this temperature range were obtained from reference 9. The results
TABLE II. - SMOOTHED VALUES OF
VISCOSITY FOR LIQUID HELIUM 4
Temper- ature,
T58' OK
2.050 2.000 1.950 1.900 1.850
1.800 1.750 1.700 1.650 1.600
1.550 1.500 1.450 1.400 1.350
1.300 1.200 1.100 1.050 1.025
1.000 .975 .950
=Ref. 9.
Density of normal
zomponent:
pn, g/cm
(a)
0.0951 .0825 .0713 .0617 .0532
.0455
.0389
.0333
.0281
.0235
.0194
.0160
.0133
.0108
.00883
.00690
.00419
.00220
.00154
.00127
.00104 .000835 .000665
16. 6 15.1 14.0 13.4 13.2
13.2 13.2 13.2 13. 3 13. 5
13.9 14. 3
. 14.9 15.5 16.
""
""
23. 26.9 29.4
32.1 36.0 40.3
24
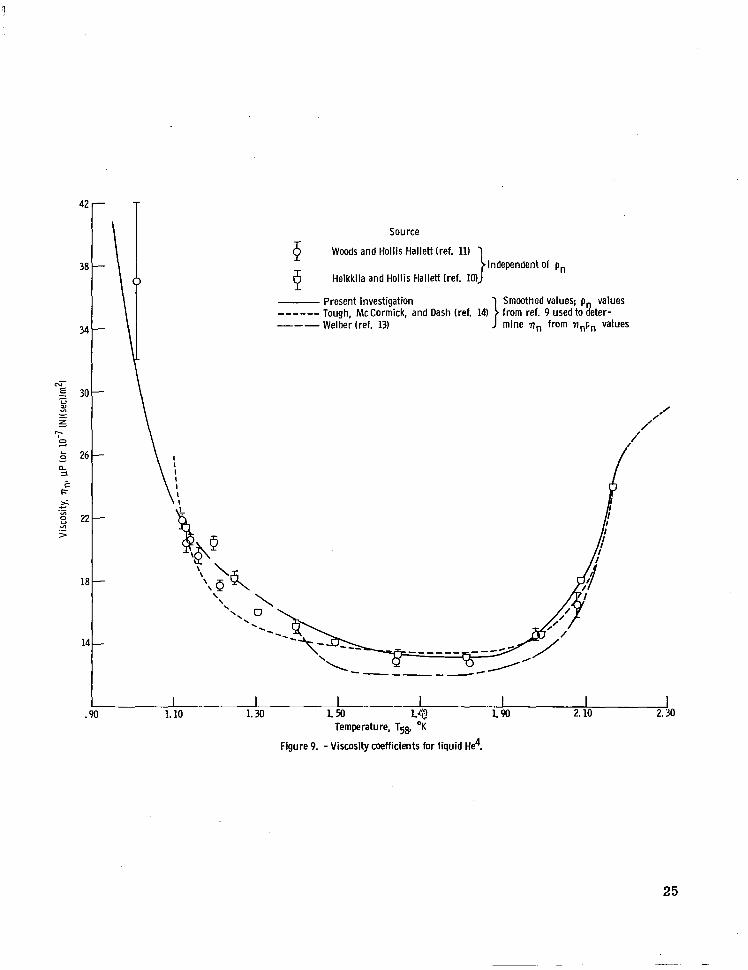
Source
$ Woods and Hollis Hallett (ref. 11)
I$ Heikkila and Hollis Hallett (ref. IO) Independent of pn
- Present investigation Smoothed values; p values """ Tough, McCormick, and Dash (ref. 14) from ref. 9 used to aeter- "- Welber (ref. 13) mine '0, from nnpn values
I I I I I I 1.10 1.30 1. 50 1.8 1.90 2.10 2.30
Temperature, T5& OK
Figure 9. - Viscosity coefficients for liquid He4.
25
reported herein are shown with the values of four other investigations (refs. 10, 11, 13, and 14). Except for temperatures near the h point and below 1.4' K the viscosity values are in fair agreement. We do not consider our viscosity values reliable between 1.1' and 1.35' K because of the previously mentioned problem of the coupling between second and f irst sound at the liquid-vapor interface. The dashed portion of the curve in figure 9 was obtained by smoothly connecting the data on both sides of this region. Some of the measured values were 25 percent higher than the dashed curve. For reasons stated in the section ANALYTICAL CONSIDERATIONS, equation (A10) becomes less applicable for liquid He as the temperature decreases below 1.0' K. Upon evaluation of the constants in equation (A10) appropriate to this experiment, the result is
4
Az = 2 . 3 3 3 ~ 1 0 - ~ 2 VnPn
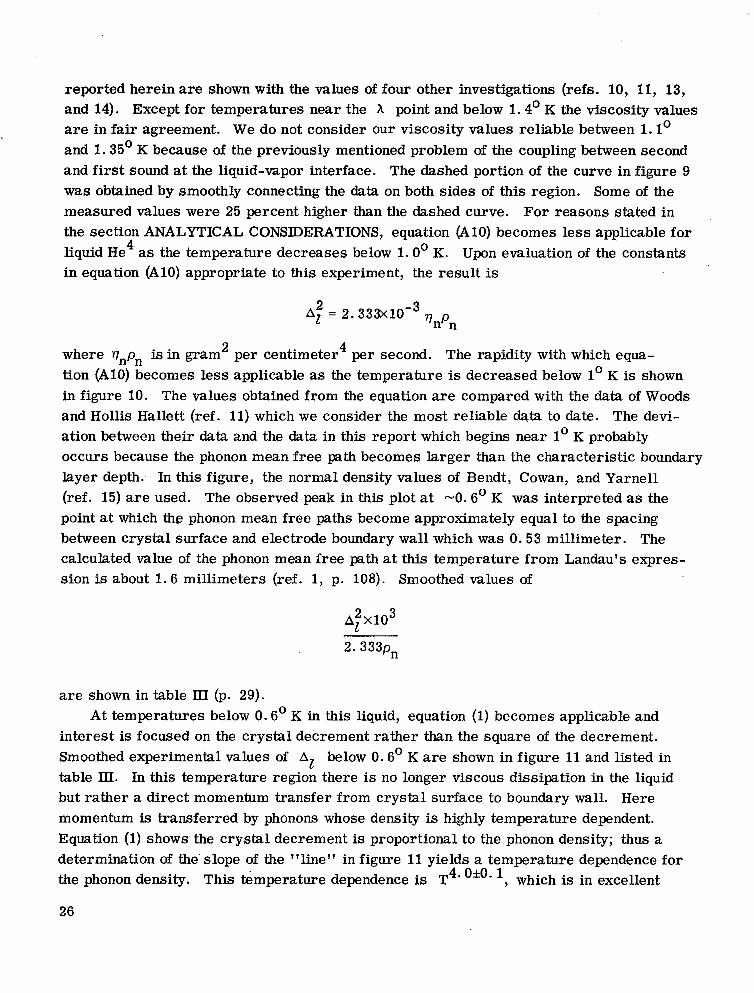
where Vnpn is in gram per centimeter per second. The rapidity with which equa- tion (A10) becomes less applicable as the temperature is decreased below 1' K is shown in figure 10. The values obtained from the equation are compared with the data of Woods and Hollis Hallett (ref. 11) which we consider the most reliable data to date. The devi- ation between their data and the data in this report which begins near 1' K probably occurs because the phonon mean free path becomes larger than the characteristic boundary layer depth: In this figure, the normal density values of Bendt, Cowan, and Yarnell (ref. 15) are used. The observed peak in this plot at -0.6' K was interpreted as the point at which the phonon mean free paths become approximately equal to the spacing between crystal surface and electrode boundary wall which was 0.53 millimeter. The calculated value of the phonon mean free path at this temperature from Landau's expres- sion is about 1.6 millimeters (ref. 1, p. 108). Smoothed values of
2 4
2. 333pn
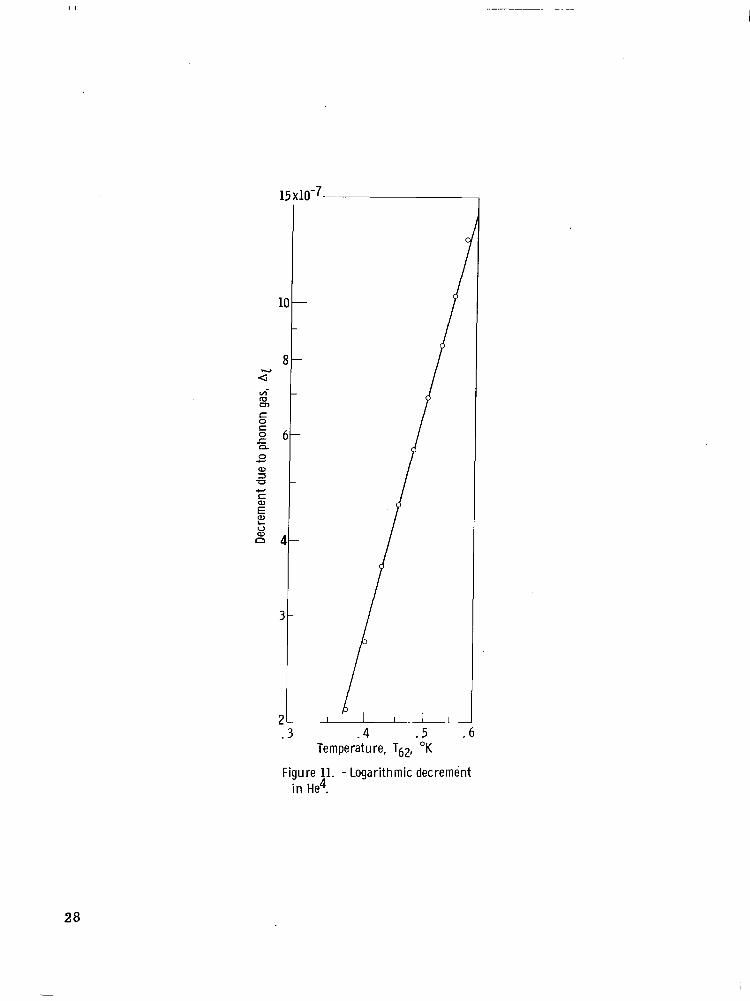
a r e shown in table III (p. 29). At temperatures below 0.6' K in this liquid, equation (1) becomes applicable and
interest is focused on the crystal decrement rather than the square of the decrement. Smoothed experimental values of Az below 0.6' K a r e shown in figure 11 and listed in table III. In this temperature region there is no longer viscous dissipation in the liquid but rather a direct momentum transfer from crystal surface to boundary wall. Here momentum is transferred by phonons whose density is highly temperature dependent. Equation (1) shows the crystal decrement is proportional to the phonon density; thus a determination of the. slope of the "line" in figure 11 yields a temperature dependence for the phonon density. This temperature dependence is T4' ', which is in excellent
26
I 0
1 Woods and Hol l is Hal let t ( ref . 11) in pP 0 Present invest igat ion
Of €
0 O €
0 0
1 0 I -1 I I I I I I I . 3 . 4 .5 . 6 .I .8 .9 1.0 1.1 1.2
Temperature, T5& "K
F igu re 10. - Measuremen ts on l i qu id He4. M a x i m u m amplitude, -1/2 micron; maximum veloci ty, <O. 3 cent imeter per second; boundary wal l -1/2 m i l l i - meter. At 1.3' K: C. B. L. z 0 . 2 6 ~ 1 0 ' ~ m i l l i m e t e r , phonon mean f ree path ZphzO. 0 7 ~ 1 0 - ~ m i l l i m e t e r ; at 0.95O K: C. B. L. -0.013 mi l l imeter, phonon mean f ree path - 0.03 mi l l imeter .
bh -
27
15~10-~- 1
. 3 . 4 . 5 .6 Temperature, T62, "K
Figure 11. - Logarithmic decrement in He4.
28
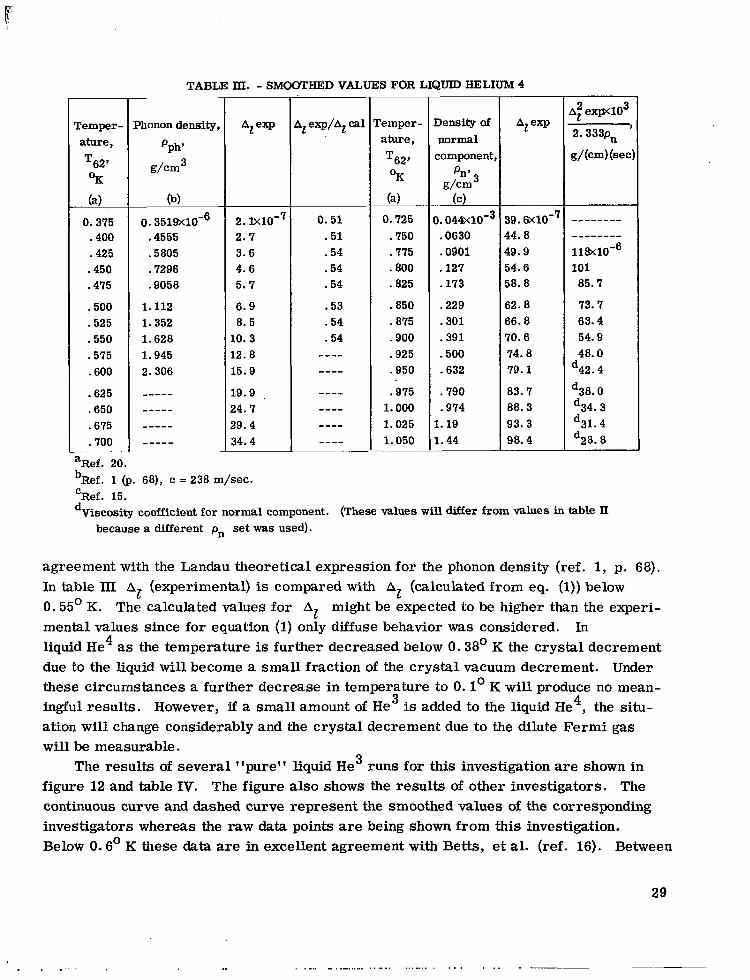
TABLE m. - SMOOTHED VALUES FOR LIQUID HELIUM 4
ature ,
0.375 .400 .425 .450 .475
.500
.525
.550
.575
.600
.625
.650
.675
.700
aRef. 20. bRef. 1 (p.
Ref. 15.
. .
C
Phonon density,
pph7
g/cm
(b)
0 . 3519x10-6 .4555 .5805 .7296 .9058
1.112 1.352 1.628 1.945 2.306
_"" _"" _"" _""
2. I X I O - ~ 2.7 3.6 4.6 5.7
6 .9 8. 5
LO. 3 L2. 8 15.9
19.9 .
24.7 29.4 34.4
c = 238 m/sec.
0.51 .51 .54 .54 .54
.53
.54
.54 ""
""
""
""
""
""
, cal 'emper- ature , T62' OK
(4 0.725
.750
.775
.800
.825
.850
.875
.goo
.925
.950
.975 1.000 1.025 1.050
normal zomponent,
pnp g/cm
( 4
). 0 4 4 ~ 1 0 - ~ .0630 .0901 .127 .173
39.6x10"
58.8
.229
79.1 .632 74.8 .500 70.6 .391 66.8 .301 62.8
.790 83.7
.974 88.3 1. 19 93.3 1.44 98.4
""""
""""
118x10-6 101 85.7
73.7 63.4 54.9 48.0
d42. 4
d38. 0
d31. 4 d28. 8
d34.3
dViscosity coefficient for normal component. (These values will diHer from values in table II because a different pn set was used).
agreement with the Landau theoretical expression for the phonon density (ref. 1, p. 68). In table III At (experimental) is compared with AZ (calculated from eq. (1)) below 0.55' K. The calculated values for Az might be expected to be higher than the experi- mental values since for equation (1) only diffuse behavior was considered. In liquid He as the temperature is further decreased below 0.38' K the crystal decrement due to the liquid will become a small fraction of the crystal vacuum decrement. Under these circumstances a further decrease in temperature to 0.1' K will produce no mean- ingful results. However, if a small amount of He is added to the liquid He4, the situ- ation will change considerably and the crystal de.crement due to the dilute Fermi gas will be measurable.
4
3
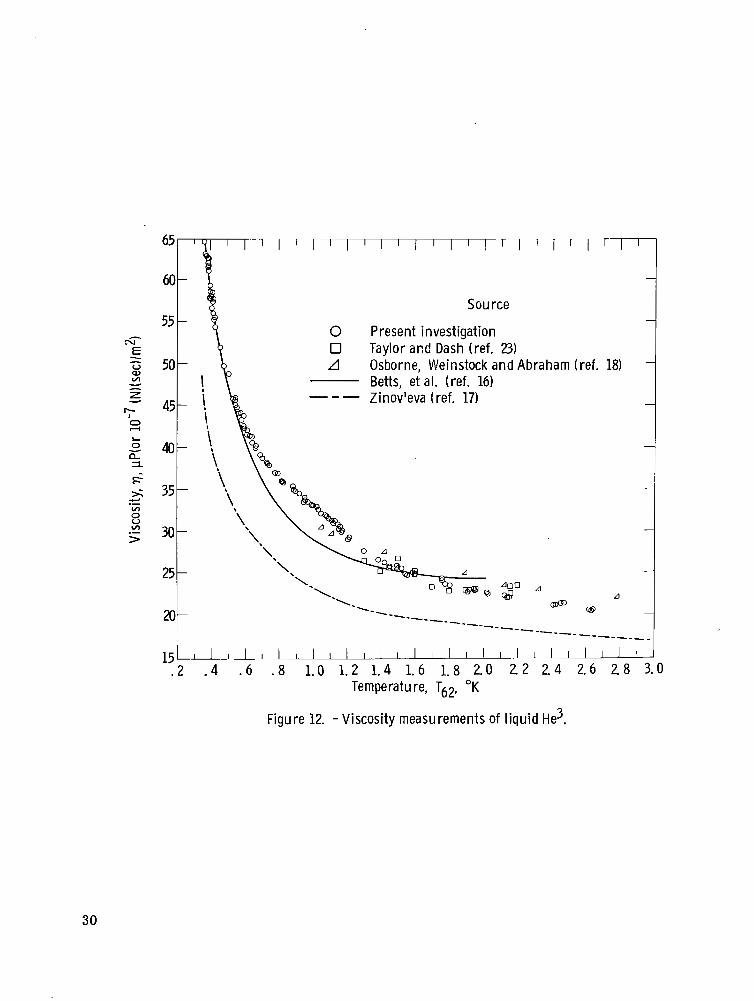
The results of several "pure" liquid He runs for this investigation are shown in 3
figure 12 and table IV. The figure also shows the results of other investigators. The continuous curve and dashed curve represent the smoothed values of the corresponding investigators whereas the raw data points are being shown from this investigation. Below 0.6' K these data are in excellent agreement with Betts, et al. (ref. 16). Between
29
.... . ._.._....... ....... ........ . . . . . ... -
Source
0 Present invest igat ion 0 Taylor and Dash (ref . 23)
50 A Osborne, Weinstock and Abraham (ref . 18) Betts, et al. (ref. 16) Zinov'eva (ref . 17) "-
1 5 ~ ' ~ ' ' ~ i " ~ ' i " ' ' 1 " ~ ' 1 1 r ' ' . 2 . 4 . 6 . 8 1.0 1.2 1.4 1.6 1.8 2.0 2 2 2.4 2.6 2.8 3.0
Temperature, Tb2, "K
Figure 12. - V iscos i t y measuremen ts o f l i qu id He3.
30
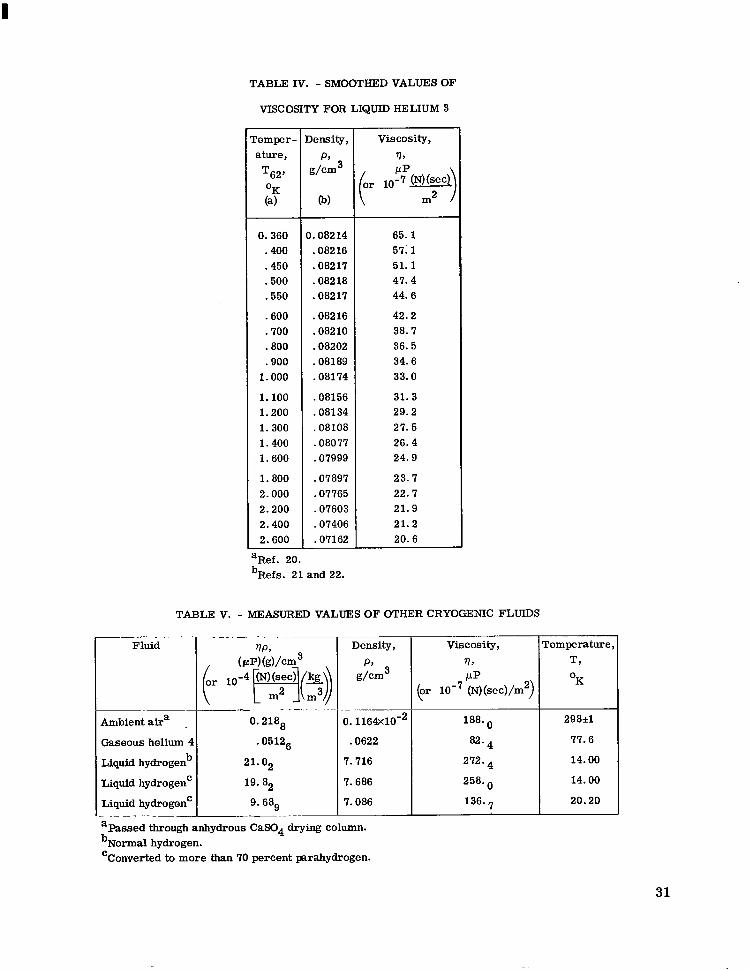
TABLE IV. - SMOOTHED VALUES OF
VISCOSITY FOR LIQUID HELIUM 3
'emper- ature,
T62' O K (a)
0.360 .400 .450 .500 .550
.600
.700
.800
.goo 1.000
1.100 1.200 1.300 1.400 1.600
1.800 2.000 2.200 2.400 2.600
Iensity, P,
g/cm3
04
1.08214 .08216 .08217 .08218 .082 17
.08216
.08210
.08202
.08189
.08174
.08156
.08134
.08108
.08077
.07999
.07897
.07765
.07603
.07406
.07162
Viscosity, 9,
65. 1 57; 1 51. 1 47.4 44.6
42.2 38. 7 36. 5 34.6 33.0
31. 3 29.2 27.5 26.4 24.9
23. 7 22.7 21.9 21.2 20.6
aRef. 20. bRefs. 21 and 22.
TABLE V. - MEASURED VALUES OF OTHER CRYOGENIC FLUIDS
~~~
Ambient aira . Gaseous helium 4
Liquid hydrogen 21. o2 Liquid hydrogen'
Liquid hydrogen'
_ _
"" " -
Viscosity,
(.. (N)(sec)/m2)
aPassed through anhydrous C a m 4 drying column. bNormal hydrogen. 'Converted to more than 70 percent parahydrogen.
0. 116&10-2 I 188.
.0622 82.
7.716 272.
7.686 258.
7.086 136.
'emperaturt T,
K 0
2 9 8 4
77.6
14.00
14.00
20.20
31
Ill I I l l I 1
-0.8' and 1.2' K, these values could be slightly high possibly because of some weak resonance condition which is independent of the liquid level in the sample chamber. Above 1.2' K, these values of viscosity fall off faster with increasing temperature than the values of Betts, et al. In fact the slope dq/dT of the curve in this region above 1.2 degrees is in agreement with that of Zinov'eva (ref. 17) and -borne, et al. (ref. 18). The values lie between those of Betts, et al. and Zinov'eva. If these values were in e r ro r , they would be expected to be high. The reason for this is that any significant e r r o r would probably be the result of a nontorsional component of crystal motion. Such motion increases the energy dissipated by the crystal thus adding to the decrement caused by pure torsional motion. For this reason we expect these values above 1.6' K to be more acceptable than those of Betts, et al. The experimental precision for qp of liquid He is about 0.2 percent. 3
In addition, the same technique was used to measure the viscosity-density product for other fluids. These values are presented in table V to provide an opportunity to compare this method with other techniques.
Lewis Research Center, National Aeronautics and Space Administration,
Cleveland, Ohio, October 25, 1967, 129-01-02-04-22.
32
APPENDIX - DEVELOPMENT OF EQUATIONS OF INTEREST
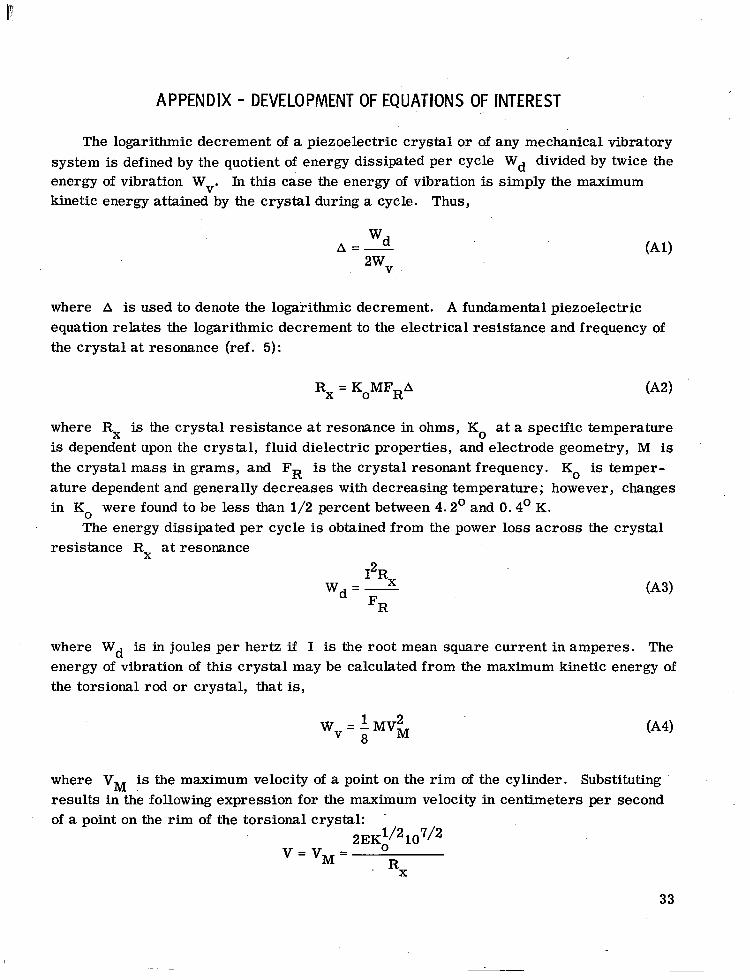
The logarithmic decrement of a piezoelectric crystal or of any mechanical vibratory system is defined by the quotient of energy dissipated per cycle wd divided by twice the energy of vibration Wv. In this case the energy of vibration is simply the maximum kinetic energy attained by the crystal during a cycle. Thus,
2wV
where A is used to denote the logarithmic decrement. A fundamental piezoelectric equation relates the logarithmic decrement to the electrical resistance and frequency of the crystal at resonance (ref. 5):
Rx = KoMFRA (A2)
where Rx is the crystal resistance at resonance in ohms, KO at a specific temperature is dependent upon the crystal, fluid dielectric properties, and electrode geometry, M is the crystal mass in grams, and FR is the crystal resonant frequency. KO is temper- ature dependent and generally decreases with decreasing temperature; however, changes in KO were found to be less than 1/2 percent between 4.2' and 0.4' K.
resistance Rx at resonance The energy dissipated per cycle is obtained from the power loss across the crystal
12Rx
where w d is in joules per hertz if I is the root mean square current in amperes. The energy of vibration of this crystal may be calculated from the maximum kinetic energy of the torsional rod or crystal, that is,
W = -MVM 1 2 v 8
where VM is the maximum velocity of a point on the r im of the cylinder. Substituting results in the following expression for the maximum velocity in centimeters per second of a point on the rim of the torsional crystal:
2 ~ ~ ~ / 2 1 0 7 / 2
. Rx v = v M = 0
33
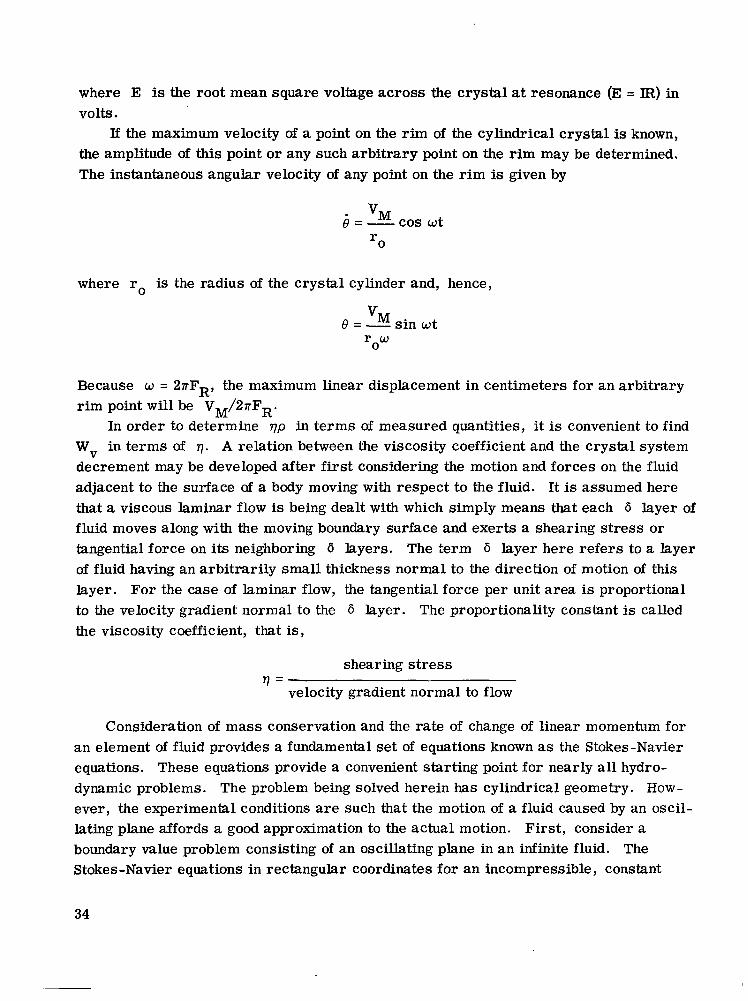
where E is the root mean square voltage across the crystal at resonance (E = Et) in volts.
If the maximum velocity of a point on the rim of the cylindrical crystal is known, the amplitude of this point or any such arbitrary point on the r im may be determined. The instantaneous angular velocity of any point on the r i m is given by
- 'M 8 = - cos w t
where ro is the radius of the crystal cylinder and, hence,
VM 8 = -sin w t r w 0
Because w = 27rFR, the maximum linear displacement in centimeters for an arbitrary r im point will be VM/27rFR.
In order to determine qp in terms of measured quantities, it is convenient to find Wv in terms of 77. A relation between the viscosity coefficient and the crystal system decrement may be developed after first considering the motion and forces on the fluid adjacent to the surface of a body moving with respect to the fluid. It is assumed here that a viscous laminar flow is being dealt with which simply means that each 6 layer of fluid moves along with the moving boundary surface and exerts a shearing stress o r tangential force on its neighboring 6 layers. The term 6 layer here refers to a layer of fluid having an arbitrarily small thickness normal to the direction of motion of this layer. For the case of laminar flow, the tangential force per unit area is proportional to the velocity gradient normal to the 6 layer. The proportionality constant is called the viscosity coefficient, that is,
shearing stress
velocity gradient normal to flow 77=
Consideration of mass conservation and the rate of change of linear momentum for an element of fluid provides a fundamental set of equations known as the Stokes-Navier equations. These equations provide a convenient starting point for nearly all hydro- dynamic problems. The problem being solved herein has cylindrical geometry. How- ever, the experimental conditions are such that the motion of a fluid caused by an oscil- lating plane affords a good approximation to the actual motion. First, consider a boundary value problem consisting of an oscillating plane in an infinite fluid. The Stokes-Navier equations in rectangular coordinates for an incompressible, constant
34
density fluid with zero body forces are (ref. 19) the following:
where u, v, and w are the x, y, and z components of the fluid velocity, p is the pressure, and
Next determine the motion and forces of the fluid adjacent to the surface of an infinite plane oscillating with respect to the fluid. Consider the oscillating plane as lying in the y-z plane of this coordinate system and oscillating in the y-direction. The fluid lies to the right of this boundary plane along the x-axis as shown in the following sketch:
V
Now apply the Stokes-Navier equations to this problem. As set up, within the fluid u = w = 0 and conditions at a point depend only on the x-coordinate of that point. Equa- tion (A5c) may be eliminated since the quantities are all zero. Equation (A5a) reduces to the simple relation ap/ax = 0, while equation (A5b) becomes
The boundary condition at x = 0 is based on the assumption that the first layer of fluid atoms immediately adjacent to the surface of the plane moves with the plane and exhibits no slippage, that is, at x = 0 , v = V cos w t where Vm is the maximum velocity of the m
35
Ill1 Ill1 lllIll1lll111lllll1llIIlIIll I
plane boundary. Also due to friction, v = 0 at x = m.
The aforementioned differential equation is identical in form to certain heat flow and vibrating string problems and may be handled by separating variables. The solution may be written as
where v(x, t) specifies the velocity of a particle in the fluid at a distance x from the plane surface at time t and
Hence, the velocity of fluid particles is reduced exponentially as the normal distance from the infinite plane increases. At a distance x = 1/A the velocity is reduced to one eth of its value at x = 0. This distance, 1/X, is the thickness of the Characteristic Boundary Layer and henceforth will be referred to as C. B. L.
An expression for the velocity of a given fluid particle as a function of its distance x from the plane surface has been obtained. Under certain conditions, a cylindrical surface may be treated hydrodynamically as though it were comprised of a large number of small plane areas. These conditions are the following:
(1) The C. B. L. is very small in comparison with the radius of the cylinder ro. (2) The maximum amplitude of any point on the surface of the cylinder is very small
in comparison with ro. (3) The length of the cylinder 2L is large in comparison with the radius ro. This approximation may be further extended to the case of a cylindrical rod in tor-
sion provided that the following conditions are met: (4) The nonzero shearing stress due to av/az is very small compared with the
s t r e s s due to the velocity gradient av/an normal to the cylindrical surface.
to av/aRe is very small as compared-to the stress due to the velocity gradient av/an normal to the end faces, where Re is the radial coordinate of the end faces. Note that, for the crystal being considered, v = 0 at Re = 0 and v = VM cos w t at Re = ro;
(5) The nonzero shearing stress on the end faces of the torsional rod or crystal due
thus, av/aRe f 0. In general, conditions (1) to (5) are not assured; but for the case of a piezoelectric
torsional crystal having a resonant frequency of 11 kilohertz, these conditions are certainly satisfied for the most part. One would suspect this to be the case since high frequency implies a very small C. B. L. which in turn implies enormous velocity gradients normal to the crystal surface as contrasted to the other gradients av/az and
36
av/aRe. The C . B. L. of this crystal in liquid He was only 2. 6x10⁻⁴ centimeter at 1.30' K. On the surface of the cylinder, the maximum values of the various velocity gradients are (av/an)max = V d , (av/az)max = (7r/2L)VM, and (av/aRe)max = bM.
obtained by differentiating equation (A6) with respect to n (which has replaced x) and noting that the velocity Vm on the surface of the cylinder is a function of position.
variable n where n is measured everywhere normal to the cylindrical surface including the ends and has a value n = 0 at the crystal surface. Consider a torsional rod of length 2L which is oriented such that the longitudinal axis of the rod lies on the z-coordinate axis with the end faces of the rod at z = L and z = -L (as defined before, VM is the maximum velocity of a point on the rim). The torsional motion for an undamped rod is described by the following equation: .
4
The velocity gradient normal to each element of area of this crystal surface may be
Essentially the variable x of the oscillating plane problem has been replaced by the
where 0 is the polar angle and vs is the velocity of shear in quartz. The solution of this equation corresponding to the lowest fundamental mode with strain node at z = 0 is
and
. .
This mode of vibration is the same one which was previously called the fundamental mode of vibration possessing the frequency FR given in equation (All) . The angular velocity w may be written as
7TV w = 2sFR = - S
2L
Provided that conditions (1) to (5) are met, the fundamental definition of viscosity enables one to formulate an expression for the energy dissipated per cycle for an element of area, either on the cylinder or an end face. Thus from fundamental considerations the following may be written:
37
dwd = -q12’’u v(z, Re, n=O, t)
Now using equation (A€) and noting that Vm is a function of position, that is,
v = vm(z) e-An cos (wt - An)
for the cylindrical surface or
v = V, (R,) e-Xn cos (wt - An)
for the end face result in the velocity gradient for an element of area on the crystal surface
where for the cylindrical surface
v = v ( z ) = v m m
and for the end faces
Vm = Vm(Re) = ReoM
Then the energy dissipated per cycle for the entire crystal surface including the ends is
R 8 (cos wt)ReeM(sin ot - cos ot)2rrRe dRe dt (A8) e M
where X = (p~/277)l’~, 1 / X is C. B. L. , VM is the maximum velocity of a point on the r im of the cylinder and is constant for a given driving voltage across the crystal, 6,
38
is the maximum angular velocity corresponding to a point on the end face or rim of the cylinder and is also a constant, and Re is the radial distance to an arbitrary area strip on the end face and varies from 0 to ro (cylinder radius). Integration of equation (A8) yields
where S is the entire surface area of the crystal including the two ends. equation (A7) in equation (A9) and then equations (A9) and (A4) in equation
,2 - rlP
F ~ M ~
2 I - -
Upon further substitution from equation (A2), the following is obtained:
CRX - Rx, vac )2 77P =
KoS FRn 2 2
Substituting (Al) result in
39
REFERENCES
1. Atkins, Kenneth R. : Liquid Helium. Cambridge University Press, 1959.
2. Welber, Benjamin; and Quimby, S. L. : Measurement of the Product of Viscosity and Density of Liquid Helium with a Torsional Crystal. Phys. Rev. , vol. 107, no. 3, Aug. 1, 1957, pp. 645-646.
3. Mason, Warren P. : Piezoelectric Crystals and Their Application to Ultrasonics. D. Van Nostrand Co., Inc., 1950.
4. Mason, W. P. : Measurement of the Viscosity and Shear Elasticity of Liquids by Means of a Torsionally Vibrating Crystal. Trans. ASME, vol. 69, no. 4, May 1947, pp. 359-370.
5. Cady, Walter G. : Piezoelectricity. McGraw-Hill Book Co., Inc., 1946.
6. Whitworth, R. W. : Experiments on the Flow of Heat in Liquid Helium Below 0.7' K. Proc. Roy. SOC. (London), Ser. A, vol. 246, no. 1246, Aug. 19, 1958, pp. 390-405.
7. Roberts, Thomas R. ; and Sydoriak, Stephen G. : Thermomolecular Pressure Ratios for He and He . Phys. Rev., vol. 102, no. 2, Apr. 15, 1956, pp. 304-308. 3 4
8. Reynolds, Joseph M. ; Hussey, Robert G. ; Thibodeaux, Devron P. ; Tucker, Bert E. ; Urrechaga-Altuna, Jesus: The Oscillation of Cylinders and Spheres in Liquid Helium 11. (AFASD-TDR-63-817, pt. 1, DDC No. AD-428267), Louisiana State Univ., Dec. 1963.
9. Reynolds, J M. ; Hussey, R. G. ; Thibodeux, D. P. ; Tucker, B. E. ; and Folse, R. F. : The Oscillation of Cylinders and Spheres in Liquid Helium II. (AFML- TDR-64-314, DDC No. .AD-456901), Louisiana State Univ. , Nov. 1964.
10. Heikkila, W. J. ; and Hollis Hallett, A. C. : The Viscosity of Helium II. Can. J. Phys., vol. 33, no. 8, Aug. 1955, pp. 420-435.
11. Woods, A. D. B. ; and Hollis Hallett, A. C. : The Viscosity of Liquid Helium II Between 0.79Oand the Lambda Point. Can. J. Phys., vol. 41, no. 4, Apr. 1963, pp. 596-609.
12. Brickwedde, F. G. ; van Dijk, H. ; Durieux, M. ; Clement, J. R. ; and Logan, J. K. : The 1958 He Scale of Temperatures. Monograph 10, National Bureau of Standards, June 17, 1960.
4
13. Welber, Benjamin: Damping of a Torsionally Oscillating Cylinder in Liquid Helium at Various Temperatures and Densities. Phys. Rev. , vol. 119, no. 6, Sept. 15, 1960, pp. 1816-1822.
40
14. Tough, J. T. ; McCormick, W. D. ; and Dash, J. G. : Viscosity of Liquid He 11. Phys. Rev., vol. 132, no. 6, Dec. 15, 1963, pp. 2373-2378.
15. Bendt, P. J. ; Cowan, R. D. ; and Yarnell, J. L. : Excitations in Liquid Helium: Thermodynamic Calculations. Phys. Rev., vol. 113, no. 6, Mar. 15, 1959, pp. 1386-1395.
16. Betts, D. S. ; Osborne, D. W. ; Welber, B. ; and Wilks, J. : The Viscosity of Helium 3. Phil. Mag., vol. 8, no. 90, June 1963, pp. 977-987.
17. Zinov'eva, K. N. : Viscosity of Liquid He in the Range 0.35-3.2' K and He above 3 4
the Lambda-Point. Soviet Phys. -JETP, vol. 7, no. 3, Sept. 1958, pp. 421-425.
18. Osborne, Darrell W. ; Weinstock, Bernard; and Abraham, Bernard M. : Comparison of the Flow of Isotopically Pure Liquid He and He . Phys. Rev., vol. 75, no. 6, Mar. 15, 1949, p. 988.
3 4
19. Pai, Shih-i: Laminar Flow. Vol. 1 of Viscous Flow Theory. D. Van Nostrand Co., In., 1956, pp. 33-85.
20. Sherman, R. H. ; Sydoriak, S . G. ; and Roberts, T. R. : The 1962 He Scale of 3
Temperatures. IV. Tables. National Bureau of Standards, J. Res., vol. 68A, no. 6, Nov. -Dec. 1964, pp. 579-588.
21. Sherman, R. H. ; and Edeskuty, F. J. : Pressure-Volume-Temperature Relations of Liquid He from 1.00 to 3.30' K. Ann. Phys. (N.Y.), vol. 9, no. 4, Apr. 1960, 3
pp. 522-547.
22. Kerr, Eugene C. ; and Taylor, R. Dean: Molar Volume and Expansion Coefficient of Liquid He . Ann. Phys. (N.Y.), vol. 20, no. 3, Dec. 1962, pp. 450-463.
23. Taylor, R. Dean; and Dash, J. G. : Hydrodynamics of Oscillating Disks in Viscous Fluids: Viscosities of Liquids He and He . Phys. Rev., vol. 106, no. 3, 3 4
May 1, 1967, pp. 398-403.
3
NASA-Langley, 1967 - 23 E -3907
I ~~
41
National Aeronautics and Space Administration WASHINGTON, D. C.
OFFICIAL BUSINESS -
FIRST CLASS MAIL
POSTMASTER: If Undellverable (Section 15: Postal Manual) Do Not Retul
" . ~ ~ . - "
"The aeronautical and space actiuities of the United States shall be conducted so as to contribute . . . to the expansion of human knowl- edge of phenomena in the atmosphere and space. The Administration shall provide for the widest practicable and appropriate dissemination of information concerning its activities and the results thereof."
"NATIONAL AERONAUTICS AND SPACE ACT OF 1958
NASA SCIENTIFIC AND TECHNICAL PUBLICATIONS
I'
TECHNICAL REPORTS: Scientific and technical information considered important, complete, and a lasting contribution to existing.knowldge.
TECHNICAL NOTES: Information less broad in scope but nevertheless of importance as a contribution to existing knowledge.
TECHNICAL MEMORANDUMS: Information receiving limited distribu- tion because of preliminary data, security classification, or other reasons.
CONTRACTOR REPORTS: Scientific and technical information generated under a NASA contract or grant and considered an important contribution to existing knowledge.
TECHNICAL TRANSLATIONS: Information published in a foreign language considered to merit NASA distribution in English.
SPECIAL PUBLICATIONS: Information derived from or of value to NASA activities. Publications include conference proceedings, monographs, data compilations, handbooks, sourcebooks, and special bibliographies.
TECHNOLOGY UTILIZATION PUBLICATIONS: Information on tech- nology used by NASA that may be of particular interest in commercial and other non-aerospace applications. Publications indude Tech Briefs, Technology Utilization Reports and Notes, and Technology Surveys.
Dotails on the availabilify of these publications may be obtained from:
SCIENTIFIC AND TECHNICAL INFORMATION DIVISION
NATIONAL AERONAUTICS AND SPACE ADMINISTRATION
Warhindon, D.C. PO546


![Measuring Moment of Inertia Based on the Identification of ... · Torsional pendulum method[1-13] and string pendulum method[14-19] are widely used in measuring ... acting as damping](https://img.pdfslide.net/doc/110x75/5e915c09f2cda572ee35b1ca/measuring-moment-of-inertia-based-on-the-identification-of-torsional-pendulum.jpg)