Embed Size (px)
Citation preview
Dan Cayan Scripps Institution of
Oceanography, UC San Diego USGS Water Resources Discipline
much support from David Pierce, Mary Tyree, and other colleagues
Sponsors: California Energy Commission NOAA RISA program Southwest Climate Science Center U.S. Army Corps of Engineers
El Nino 2015
will it alleviate the 2012-2015 drought?
CEC Workshop Sacramento 8/28/2015
Highest sea levels occur during big storms, high waves Highest sea levels occur during big storms, high waves
During high sea levels, the sea is often not quiescent January 1983 Monterey Bay, California
1983
1998
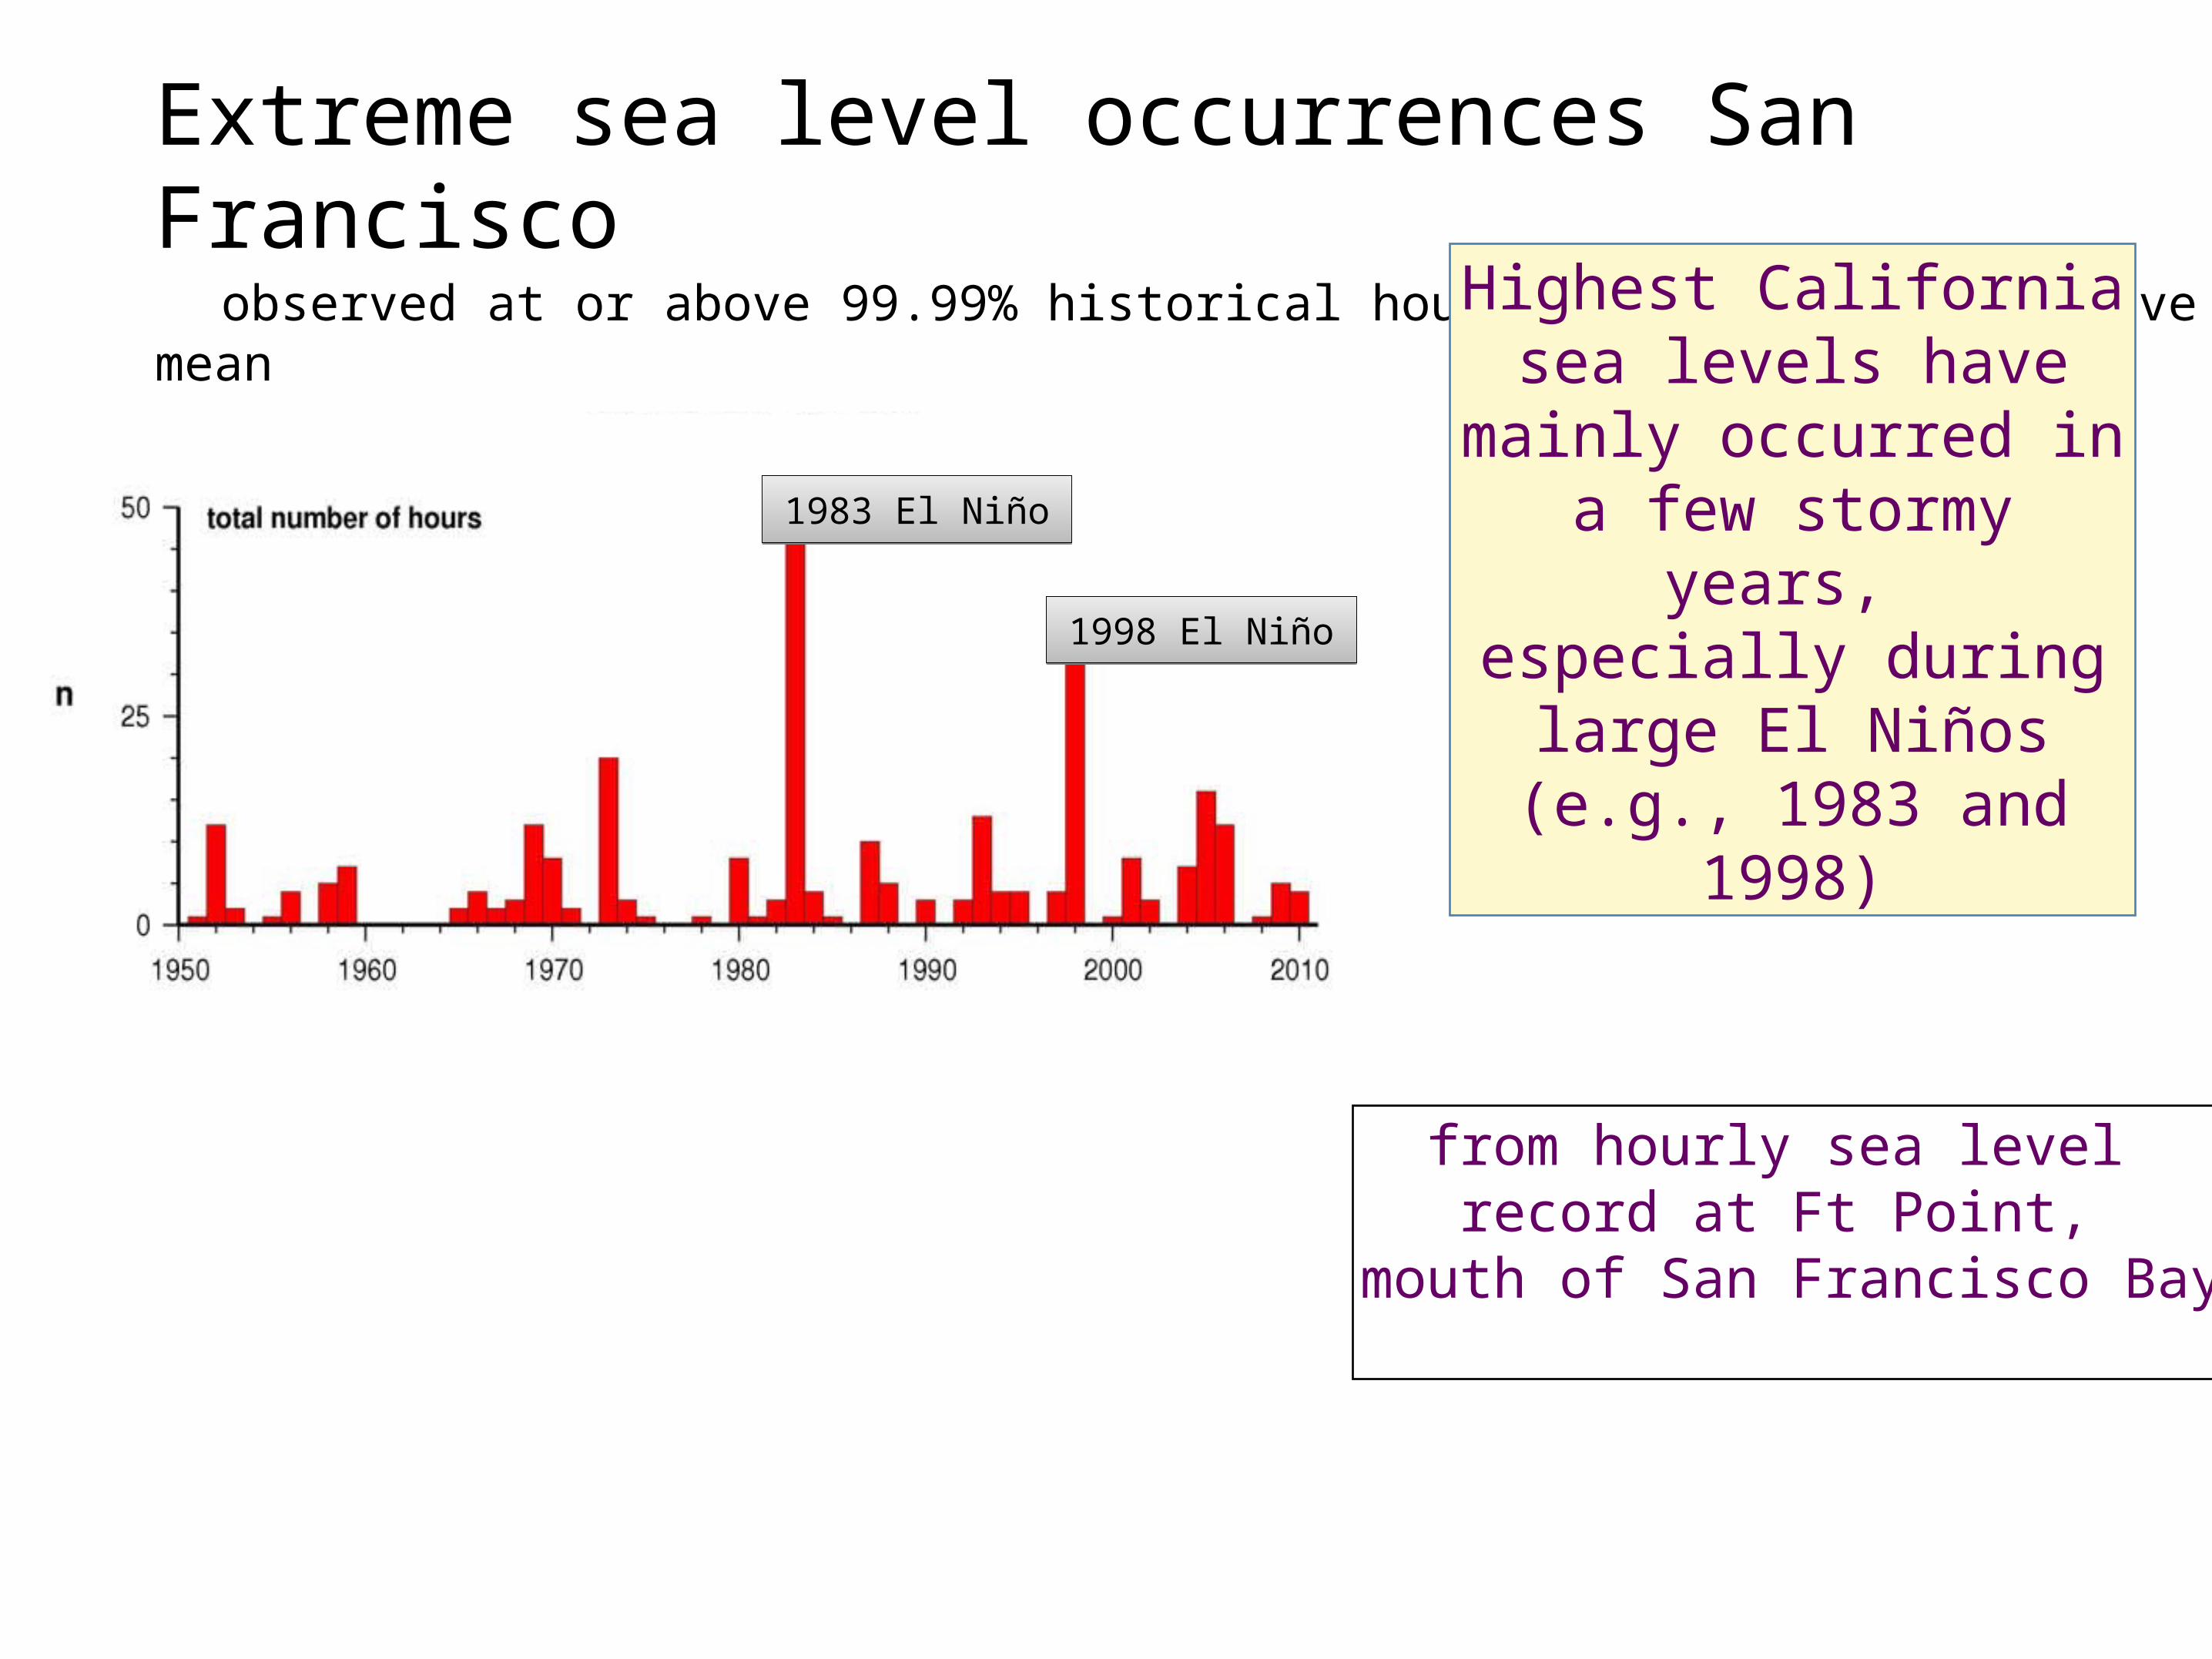
Extreme sea level occurrences San Francisco observed at or above 99.99% historical hourly threshold 1.41m above mean
Highest Californiasea levels have
mainly occurred ina few stormy years,
especially during large El Niños (e.g.,
1983 and 1998)
from hourly sea level record at Ft Point,
mouth of San Francisco Bay
1983 El Niño1983 El Niño
1998 El Niño1998 El Niño
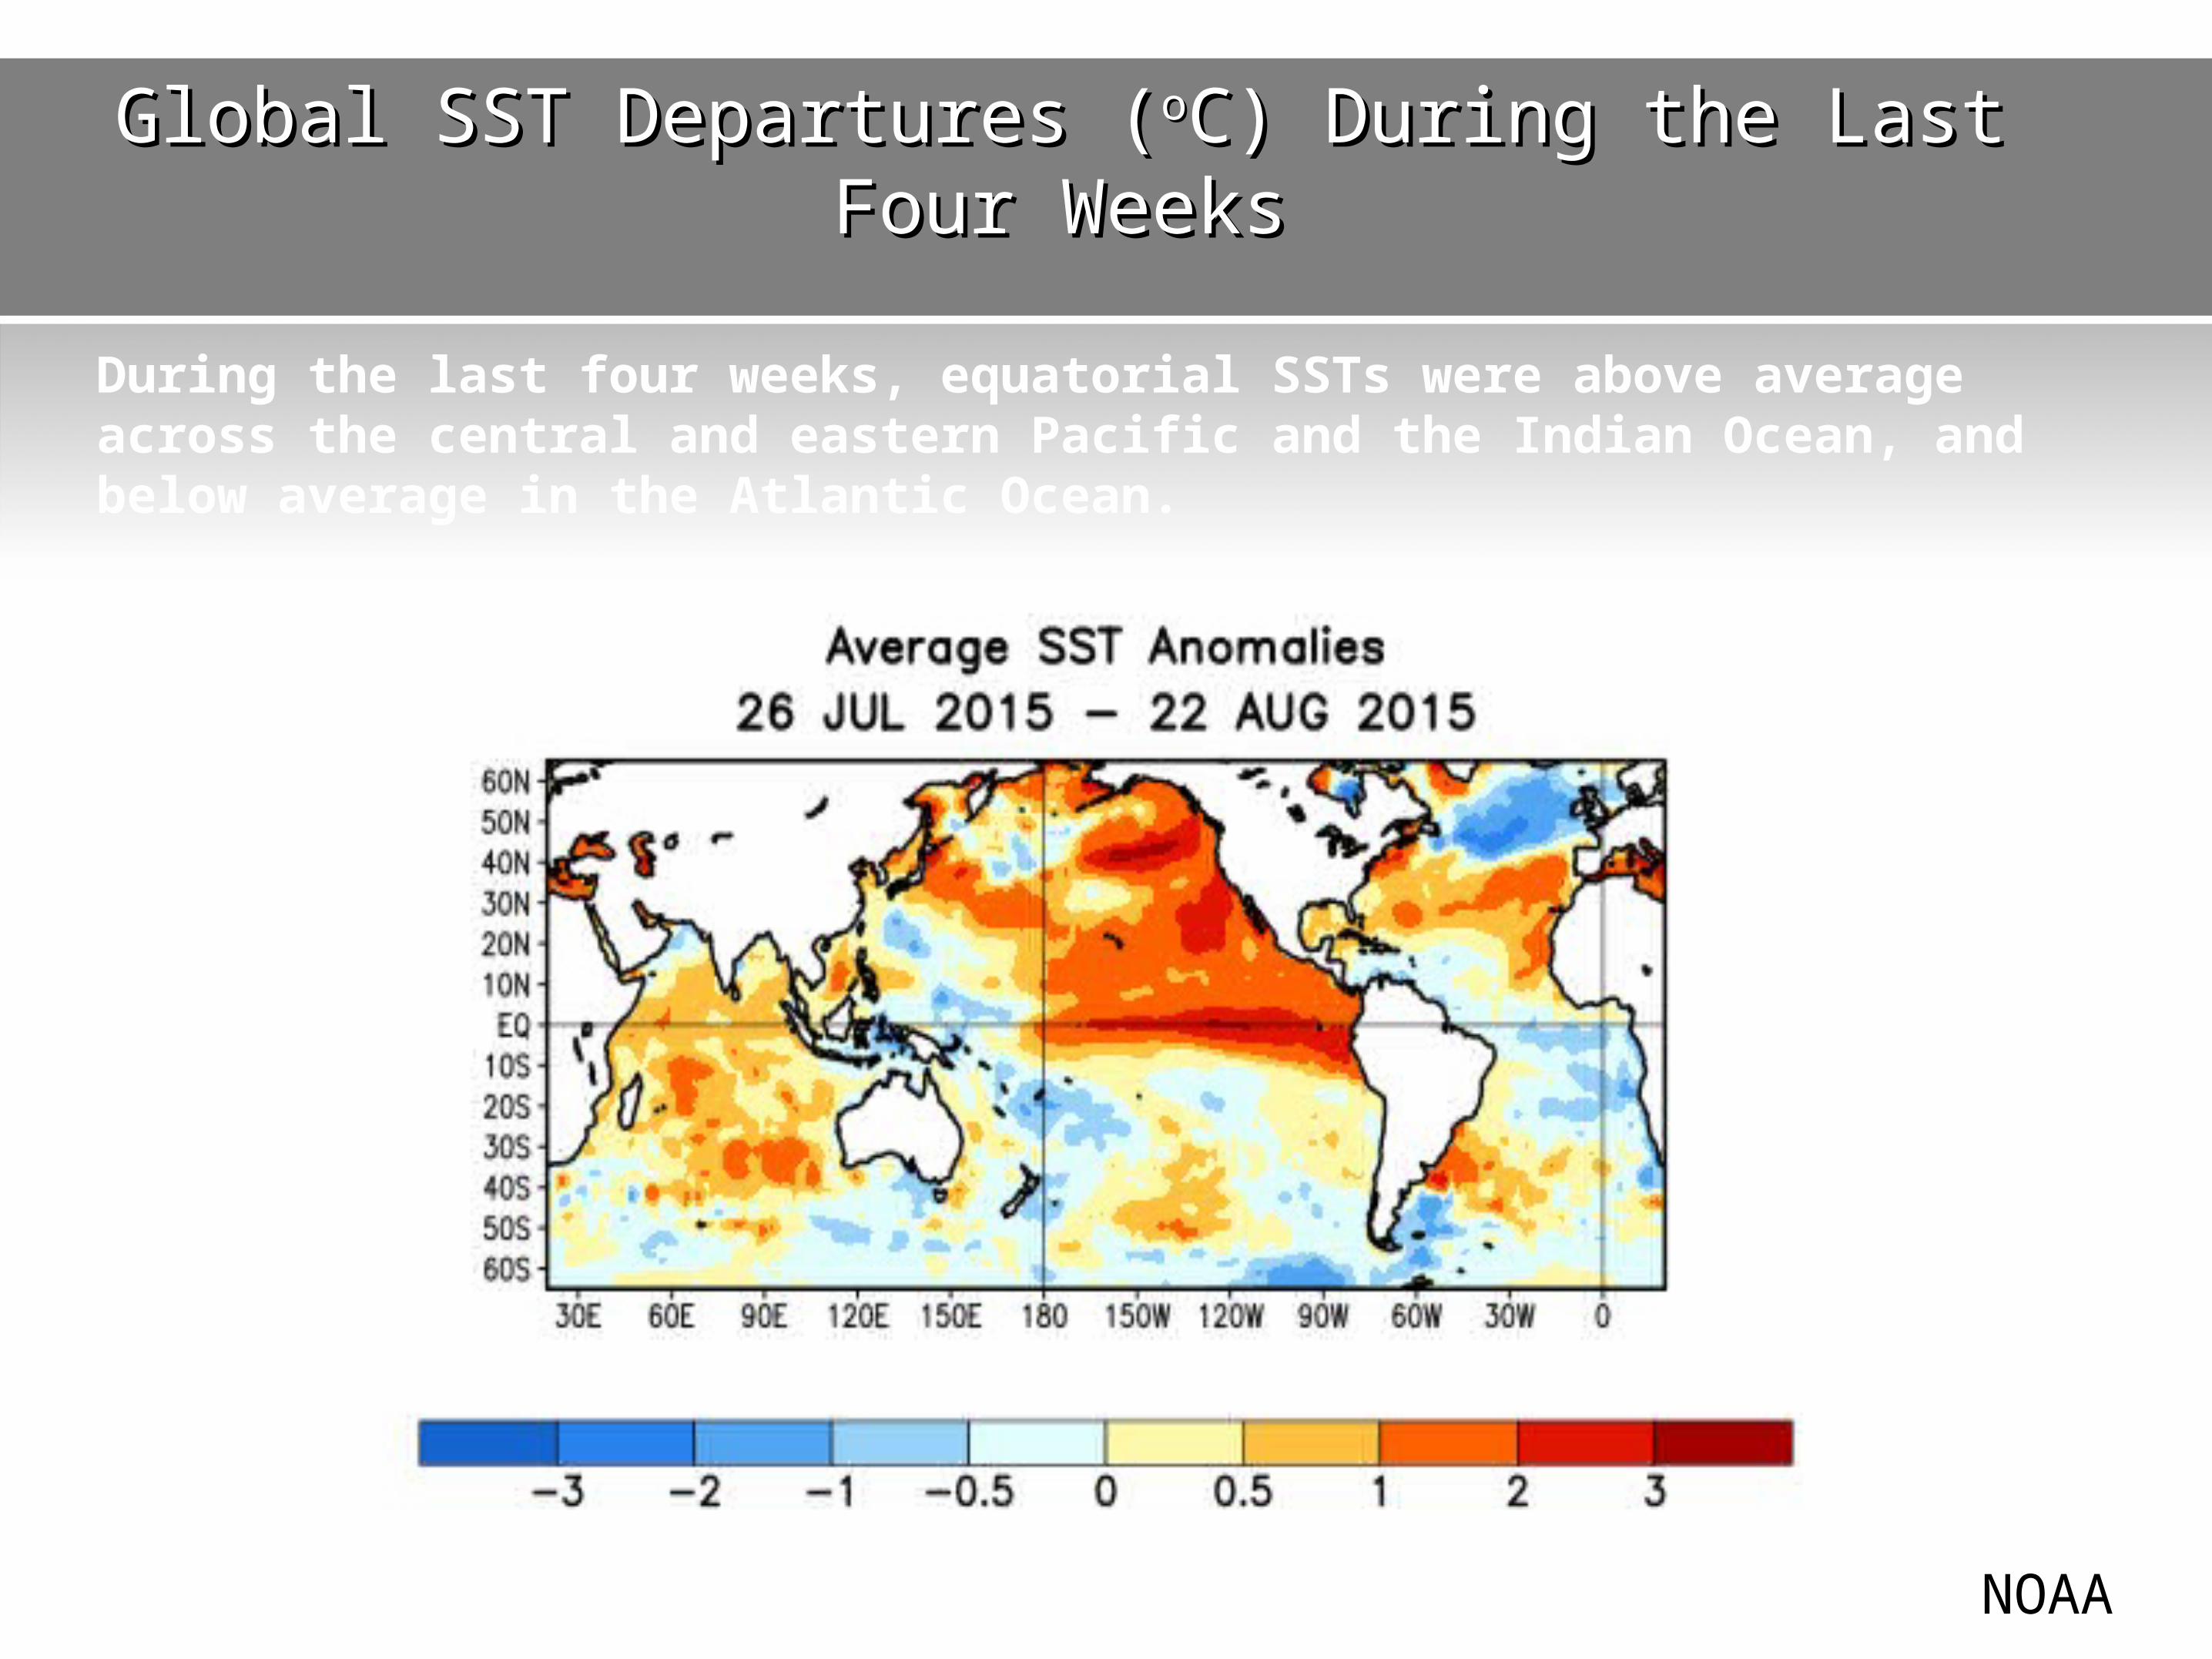
Global SST Departures (Global SST Departures (ooC) During the Last Four C) During the Last Four WeeksWeeks
During the last four weeks, equatorial SSTs were above average across the central and eastern Pacific and the Indian Ocean, and below average in the Atlantic Ocean.
NOAA
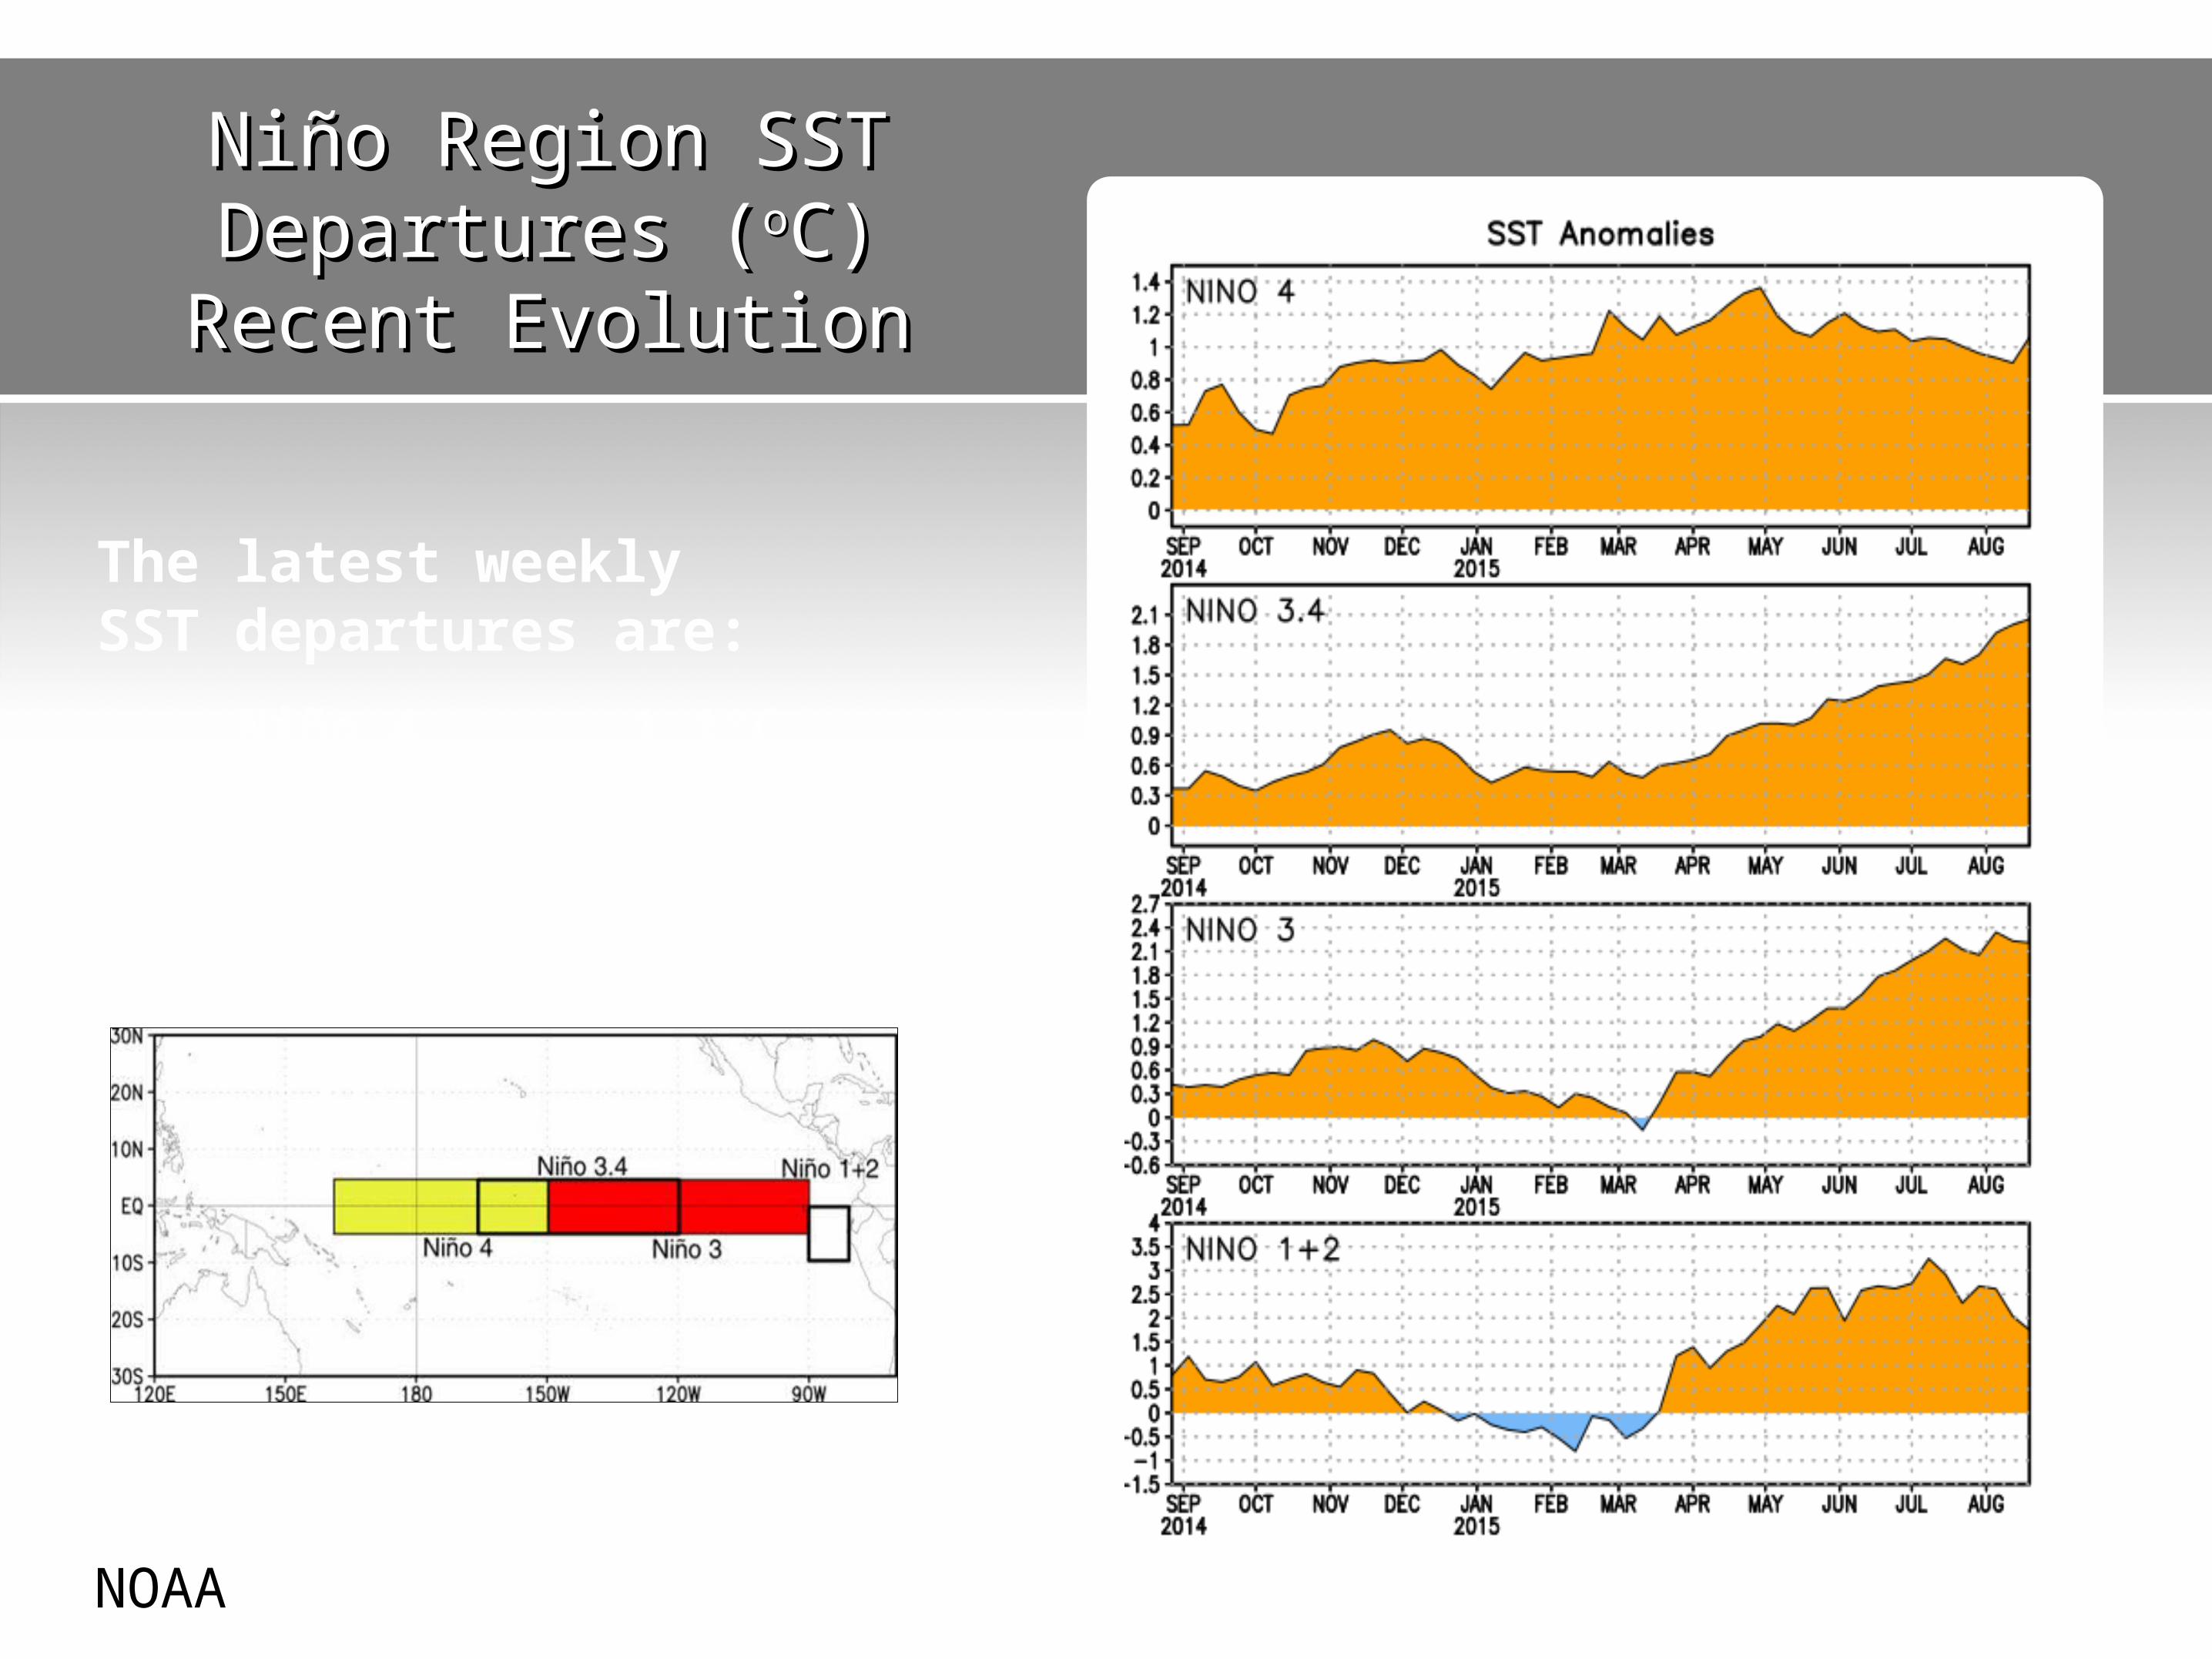
Niño Region SST Niño Region SST Departures (Departures (ooC) Recent C) Recent
EvolutionEvolution
The latest weekly SST departures are:
Niño 4 1.1ºCNiño 3.4 2.1ºCNiño 3 2.2ºCNiño 1+2 1.7ºC
NOAA
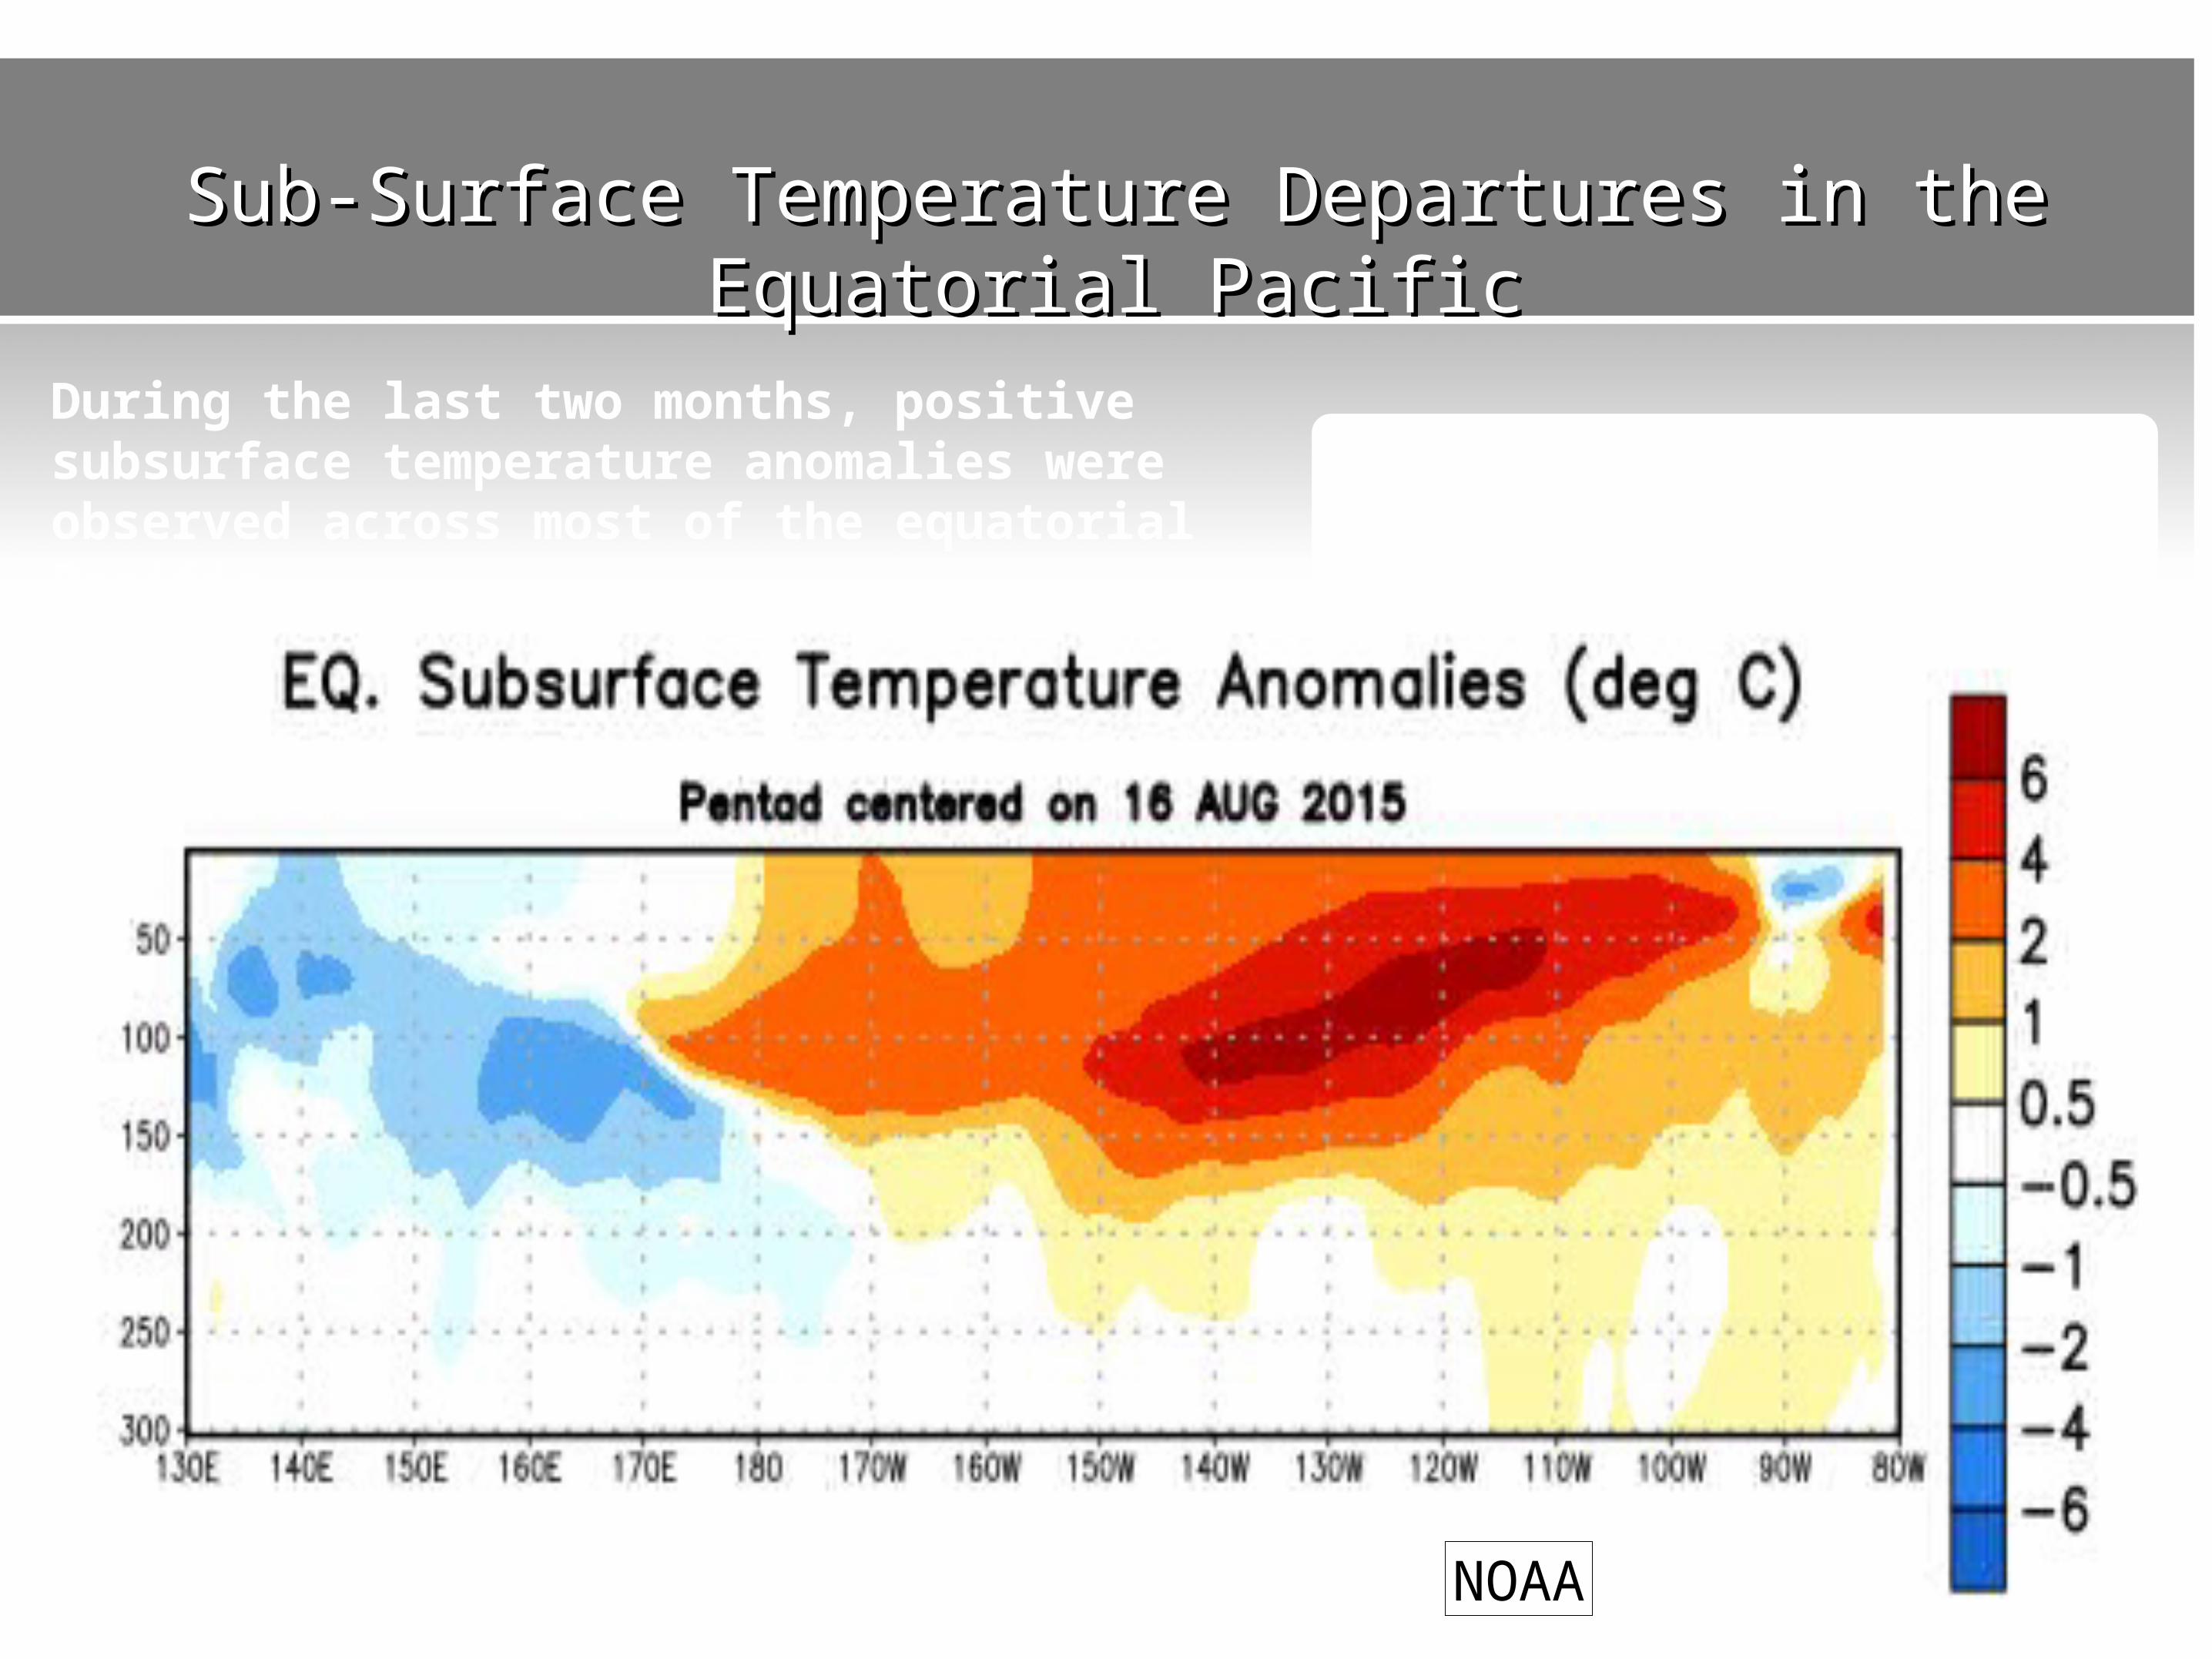
Sub-Surface Temperature Departures in the Sub-Surface Temperature Departures in the Equatorial PacificEquatorial Pacific
Most recent pentad analysis
Recently, negative anomalies were evident in the far eastern Pacific and western Pacific, while positive anomalies have persisted across the central and eastern Pacific.
During the last two months, positive subsurface temperature anomalies were observed across most of the equatorial Pacific
NOAA
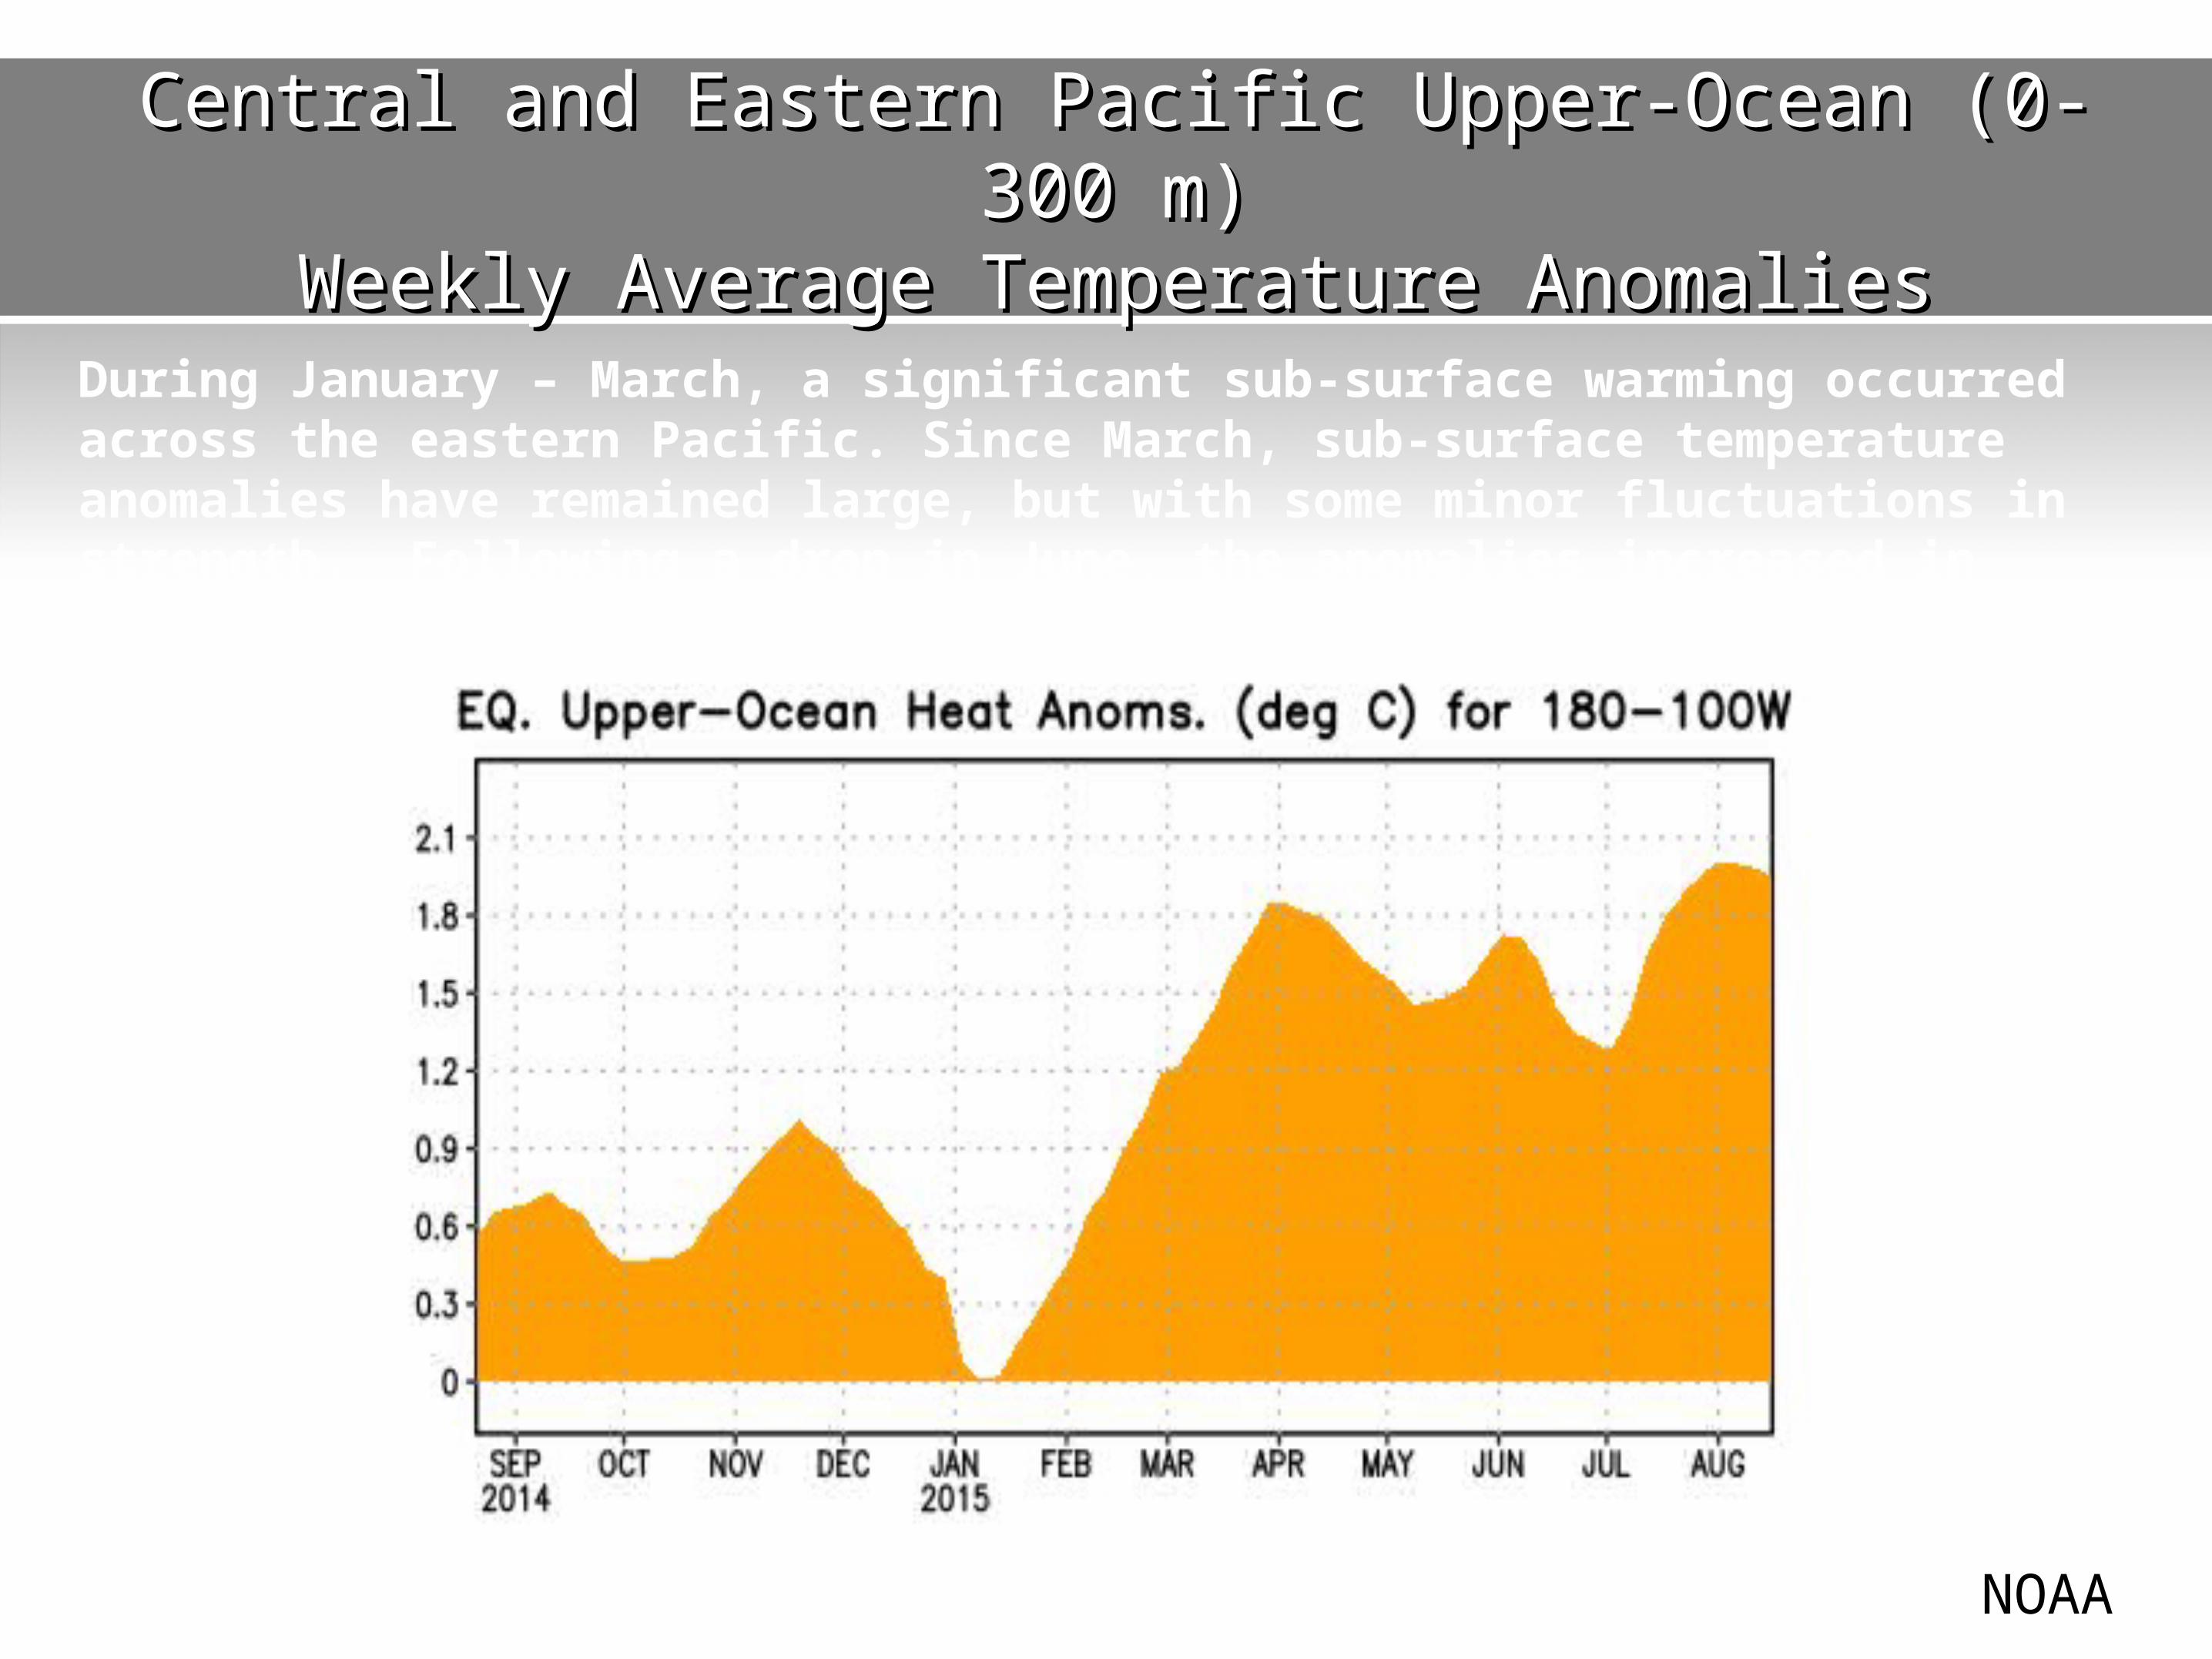
Central and Eastern Pacific Upper-Ocean (0-300 m)Central and Eastern Pacific Upper-Ocean (0-300 m)Weekly Average Temperature AnomaliesWeekly Average Temperature Anomalies
During January – March, a significant sub-surface warming occurred across the eastern Pacific. Since March, sub-surface temperature anomalies have remained large, but with some minor fluctuations in strength. Following a drop in June, the anomalies increased in July. Since early August, positive anomalies have persisted.
NOAA
8
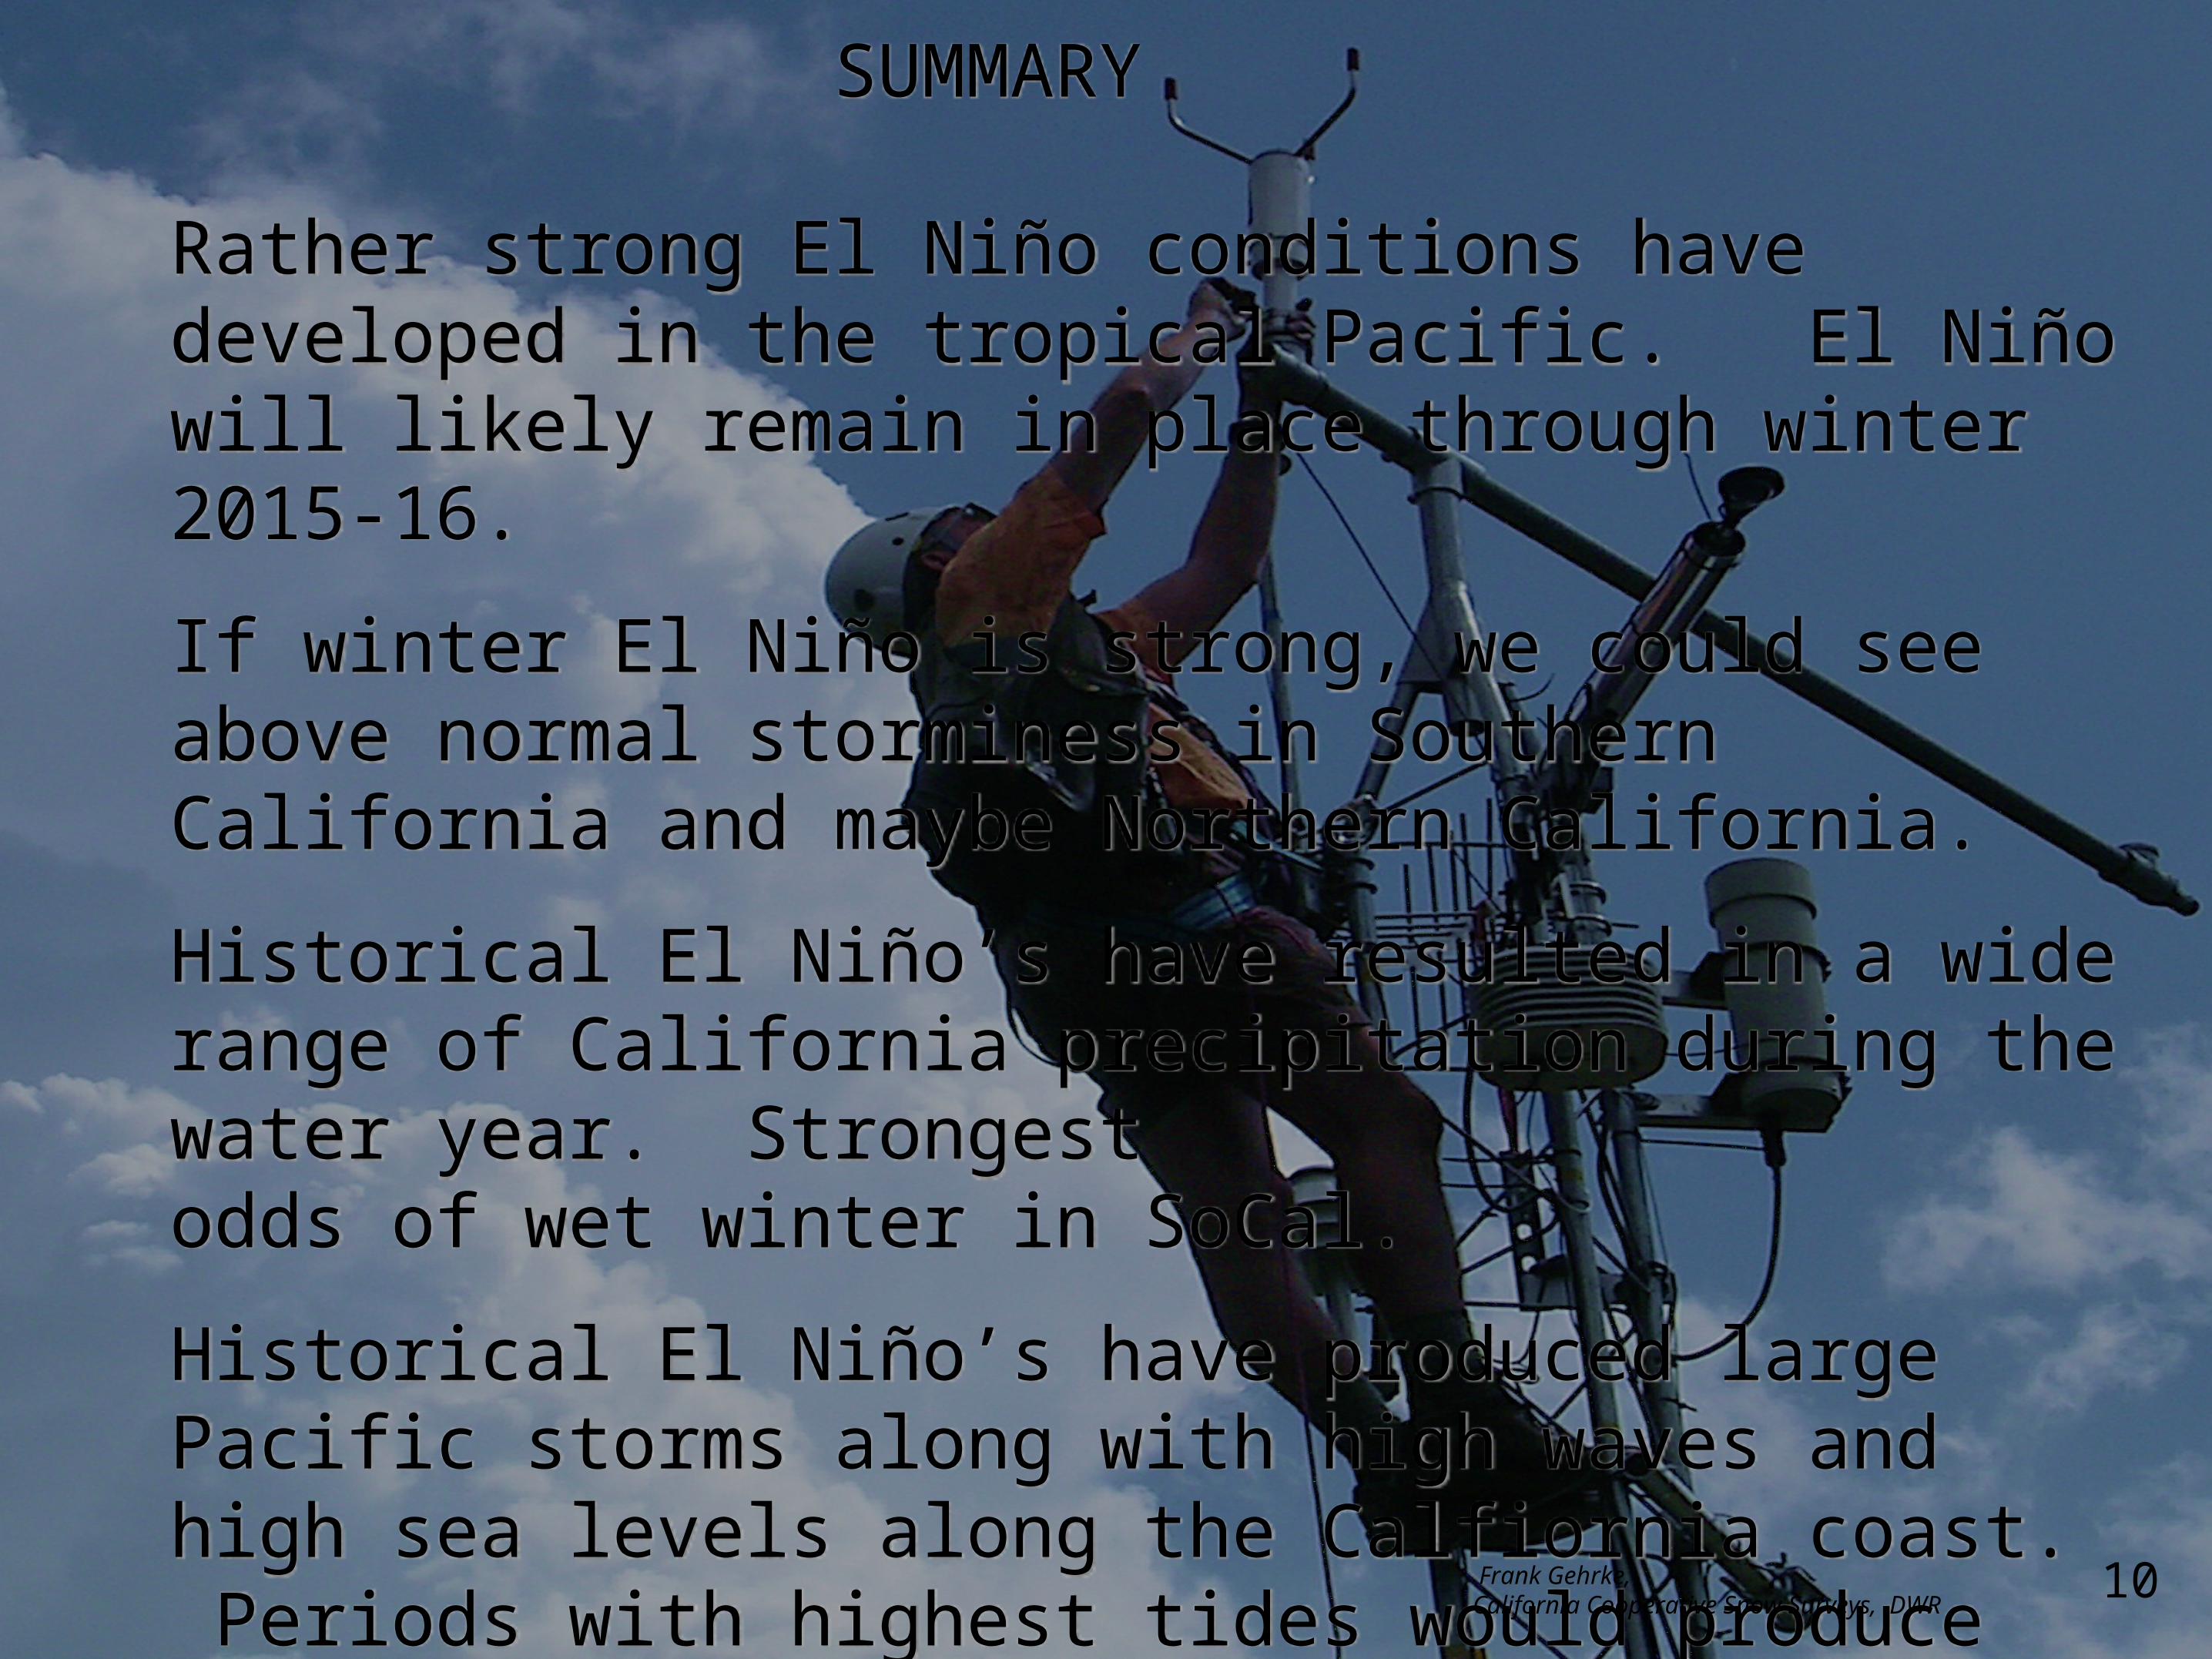
SUMMARY
Rather strong El Niño conditions have developed in the tropical Pacific. El Niño will likely remain in place through winter 2015-16.
If winter El Niño is strong, we could see above normal storminess in Southern California and maybe Northern California.
Historical El Niño’s have resulted in a wide range of California precipitation during the water year. Strongest odds of wet winter in SoCal.
Historical El Niño’s have produced large Pacific storms along with high waves and high sea levels along the Calfiornia coast. Periods with highest tides would producestrongest impacts if large storms were present
Frank Gehrke, California Cooperative Snow Surveys, DWR 10
11