Embed Size (px)
Citation preview

Dan PiettSTAT 211-019
West Virginia University
Lecture 6

Last WeekExpected Value of Probability DistributionsBinomial Distributions
ProbabilitiesMeanStandard Deviation

OverviewPoisson DistributionPoisson Probabilities
Poisson DistributionSuppose an experiment possesses the following
properties:1. The random variable X counts the number of
occurrences of some event of interest in a unit of time or space (or both)
2. The events occur randomly3. The mean number events per unit of space/time is
constant4. The random variable X has no fixed upper limit
(This will usually be false, but assume that if there is an upper limit, it is reasonably large)
This is a Poisson experiment (NOT pronounced Poison) Note that Poisson Distributions are Discrete (You cannot
have 1.9976 occurrences)

Example: Number of Pieces of Mail in a Day (Mean of 5 per day)
Requirements This Experiment1. Random variable X
counts the number of occurrences of some event of interest in a unit of time or space (or both)
2. The events occur randomly
3. The mean number events per unit of space/time is constant (lambda)
4. The random variable X has no fixed upper limit
1. Random variable X counts the number of pieces of mail occurring in 1 day.
2. We can assume that the pieces of mail occur randomly
3. Mean number of events per day is constant ( We can assume this as long as we assume that this mean holds true for the times we are interested in)
4. There is no upper-limit to the mail you can receive in 1 day (Debatable, but immaterial)

General Poisson DistributionSuppose X counts the number of
occurrences in a Poisson experiment. Then X follows a Poisson Distribution
Notation:Pois stands for Poisson distributionlambda stands for the mean number of
occurrences per unit time/spaceFor the previous example X~Pois(5)
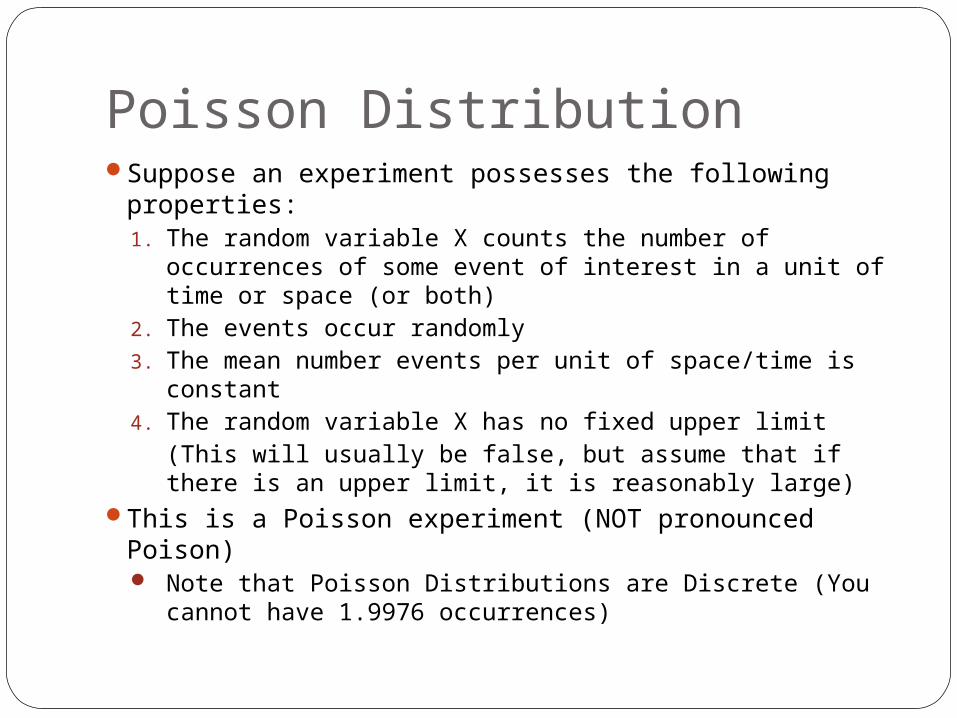
Formula for a Poisson DistributionProbability of Success in a Poisson
Distribution

Problem on BoardAssume the mean number of people who
visit the emergency room of a particular hospital is 6 per hour.
Does this constitute a Poisson Experiment?Find
The prob that 0 people will visit the emergency room in 1 hour.
The prob that 7 people will visit the emergency room in1 hour.
Cumulative Poisson ProbabilitiesThe previous formula can be used to find
the probability that X equal to exactly some value
What about other probabilities of interest?X equal to less than some value?X equal to more than some value?X is between two values?
How do we do this?EXACTLY like Binomial Probabilities

Back to the Previous ExampleWhat is the probability that at most 3
people visit the emergency room in 1 hour?At most = less than or equal toAt most 3 people= {0, 1, 2, 3, 4,…}P(At most 3 people) = P(X=0)+P(X=1) +
P(X=2)+P(X=3)Note: The probability of this event is
defined as the sums of the probabilities.Remember that this only works because
Poisson Probabilities are discreteLooking pretty familiar? I’m sure you can
guess an easier way.

New ExampleSuppose that an archaeologist finds artifacts at a
dig site at an average rate of 2 per day. What is the probability that the archaeologist finds fewer than 4 artifacts in a day. Fewer than 4= {0, 1, 2, 3, 4, 5, …}P(3 or less) = P(X=0) + P(X=1) + P(X=2) + P(X=3)We would need to compute 4 probabilities to solve
this.Is there a better way?Unlike Binomial, we only have 1 alternative method
Using cumulative probability tablesWhy doesn’t the complementary rule work for less
than probabilities?

Cumulative Probability TablesBecause of the difficulty of calculating
these probabilities (and how common the poisson distribution is). Cumulative probabilities for specific values of lambda and x have been tabulated.Note: These tables will be provided on
exams.How to read the table:
Find the appropriate lambda value, look for xThis is the probability that X is less than or
equal to that value

Back to our ExampleWe have our archaeologist finding 2
artifacts on average per day. What is the probability that he:
Finds at most 1 artifact?Finds less than 7 artifacts

Greater than ProbabilitiesSo we now know how to calculate the
probability that X is equal to exactly some value or the probability that X is less than/less than or equal to some value.
What about the probability that X is greater than/greater than or equal to some value?Think back to complementary probabilities

Headed back to our ExampleSuppose the archaeologist moves to a new dig
site and can find an average of 4 artifacts per day now. What is the probability that he finds 5 or more artifacts?
5 or more = {0, 1, 2, 3, 4, 5, 6, 7, 8, 9, …}P(5 or more) = P(5) + P(6) + … P(infinity)Remember back to how we handled this with
binomial probabilitiesP(5 or more) and P(4 or less) are complementary
eventsWhat does this mean?
P(5 or more) = 1 – P(4 or less)

Greater than ProbabilitiesRemember back to our use of the tables for
calculating less than or equal to probabilities
We can likewise calculate greater than/greater than or equal to probabilities using the table.Watch the = We want to get our greater than probabilities in
terms of less than or equal toP(X>3) = 1 – P(X<=3)
{1, 2, 3, 4, 5, …)P(X>=3) = 1 – P(X<3) = P(X<=2)
{1,2 ,3, 4, 5, 6}
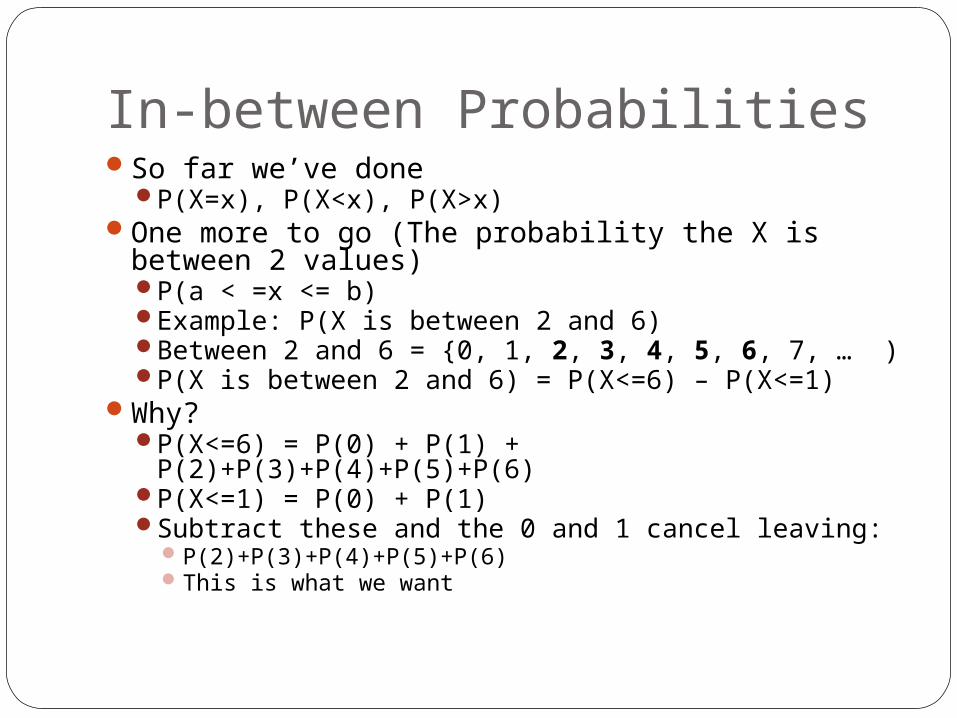
In-between ProbabilitiesSo far we’ve done
P(X=x), P(X<x), P(X>x)One more to go (The probability the X is
between 2 values)P(a < =x <= b)Example: P(X is between 2 and 6)Between 2 and 6 = {0, 1, 2, 3, 4, 5, 6, 7, … )P(X is between 2 and 6) = P(X<=6) – P(X<=1)
Why?P(X<=6) = P(0) + P(1) +
P(2)+P(3)+P(4)+P(5)+P(6)P(X<=1) = P(0) + P(1)Subtract these and the 0 and 1 cancel leaving:
P(2)+P(3)+P(4)+P(5)+P(6)This is what we want

Coming back to Exact ProbabilitiesWe can use the cumulative table to find
exact probability as wellP(X=2) = P(X<=2) – P(X<=1)
Same logic as the previous examplesP(X<=2) = P(X=0) + P(X=1) + P(X=2)P(X<=1) = P(X=0) + P(X=1)Subtract and you are left with P(X=2)

Mean and Standard Deviation of a Poisson DistributionMean of a Poisson Distribution
lambdaStandard Deviation of a Poisson
DistributionSqrt(lambda)


![7HPHW I|OGHN 6]i]KDORPEDWWD · 2017-07-06 · 022 a b a b sz 7 019/94 L a b 019/95 019/98 L L L L 019/99 L 019/100 019/101 019/102 019/103 019/87 019/96 019/88 019/89 019/90 019/91](https://img.pdfslide.net/doc/110x75/5e4940c49568aa74b4721e0b/7hphw-ioghn-6i-2017-07-06-022-a-b-a-b-sz-7-01994-l-a-b-01995-01998-l-l-l.jpg)