Embed Size (px)
Citation preview
1
Dangers of a Double-Bottom Line? A Poverty Targeting Experiment Misses Both Targets
Dean Karlan, Adam Osman and Jonathan Zinman1
April 2021
Abstract
Two for-profit Philippine banks, aiming to increasing microlending to the poor, incorporated a widely used poverty measurement tool into their loan applications and tested the tool using randomized training content. Treated loan officers were provided an explanation of the tool’s purpose; exhortation tying the tool to the organizations’ social missions; and reassurance that these data, conditional on other characteristics, do not predict default and thus should not jeopardize incentive pay based on portfolio performance. The control group training merely labeled the tool “additional household information.” The strategy backfired, leading to no additional poor applicants and potentially lower-performing loans. Descriptive evidence suggests the training exacerbated loan officer misperceptions about compensation incentives and multitasking problems. This cautionary tale is an example of why management may want include social outcomes directly into employee performance evaluations, or silo corporate social responsibility efforts from core operations.
Keywords: Double-bottom line, management, multi-tasking, social business, poverty targeting, discrimination, microfinance, microcredit, corporate social responsibility.
JEL: D12; D22; D92; G21; M1; O12; O16
1Contact information: Dean Karlan, [email protected], Northwestern University, IPA, J-PAL, and NBER; Adam Osman, [email protected], University Illinois at Urbana-Champaign, J-PAL; Jonathan Zinman, [email protected], Dartmouth College, IPA, J-PAL, and NBER. Approval from the Yale University Human Subjects Committee, IRB0510000752 and from the Innovations for Poverty Action Human Subjects Committee, IRB #07October-002. The project was registered on the AEA RCT Registry (AEARCTR-0000165). For funding we thank the Bill and Melinda Gates Foundation, the Consultative Group for Assistance to the Poor (CGAP), and AusAID. For project management and field support we thank Innovations for Poverty Action; specifically: Varun Kshirsagar, Kareem Haggag, Megan McGuire, Faith McCollister, Mark Miller, Sarah Oberst and Bernie Seville. For collaboration we thank the senior management and staffs at First Macro Bank, FICO Bank, and Grameen Foundation. The authors retained full intellectual freedom to report and interpret the results throughout the study. The data that support the findings of this study are available from the corresponding author upon reasonable request and will be made available in a public repository upon acceptance. All errors and opinions are those of the authors.
2
I. Introduction
Some for-profit firms seek to “do well by doing good,” maximizing a double-bottom line where both profits and social impacts are important objectives (e.g., Dees 2001; Yunus 2008; Battilana and Dorado 2010; Pache and Santos 2012; Besley and Ghatak 2017). Indeed, most Fortune 500 businesses have made substantial investments in corporate social responsibility (“CSR”) that introduce elements of a second bottom line (e.g., Kitzmueller and Shimshack 2012; Servaes and Tamayo 2013; Flammer 2015; Hart and Zingales 2017).2 Although CSR elements are often siloed from core operations of the business (e.g., a corporate foundation), in many cases they are embedded into operations (e.g., explicitly targeting low-income consumers; promising a portion of each sale to be donated to charity).
Can enterprises pursue twin objectives without comprising one or both of them? What is the role of management in charting out these twin strategies and ensuring their successful implementation? In particular, can firms in microcredit—"the leading example of a broader push for social investment in the health, education, and energy sectors” (Conning and Morduch 2011)—succeed in maximizing profits while expanding access to credit for the poor? Work on multi-tasking, beginning with the seminal theory of Holmstrom and Milgrom (1991; 1994),3 highlights the challenge from a mechanism design perspective: if employees (or managers) face relatively strong incentives for one of the objectives, they may neglect the other.4 Another challenge is that poverty targeting is nontrivial (Alatas et al. 2012; Banerjee et al. 2015; Alatas et al. 2016; Hanna and Karlan 2017; Karlan and Thuysbaert 2016), and finding the efficient frontier of the traditional bottom line is difficult (Karlan and Zinman 2018). In short, maximizing either objective for a social enterprise like a microlender seems challenging enough; trying to maximize twin objectives may backfire.
We examine the social enterprise balancing act using a poverty targeting experiment implemented by two for-profit banks in the Philippines. Bank management sought to increase their lending to poorer microentrepreneurs without sacrificing the banks’ profits. To this end we worked with the banks to integrate a widely used poverty targeting tool into loan officers’ standard application workflow for new clients. Specifically, each bank included the tool’s 10 questions, along with standard questions used for underwriting, in its new loan application management and credit scoring software. The research team trained all 27 loan officers that worked in microlending in 20 branches to use the new software. Of the 20 branches, 10 were randomly assigned to
2 Some CSR activities could be disingenuous (Doane 2005); e.g., “greenwashing” (misleading claims of being environmentally friendly) or “astroturfing” (misleading claims of grassroots support). 3 In particular, Holmstrom and Milgrom (1994) examines multitasking challenges when firms face differential cost of measuring outcomes, much like the situation here in which profitability is easier to measure than a client’s poverty status or private benefit from getting a loan. 4 See e.g., Palacios (2018) for a review of the empirical literature on multi-tasking problems in firms. Luca et al (2016) describes a case where a singular focus on one outcome also may lead to unintended consequences.
3
treatment and 10 to control. Loan officers in treatment branches were informed that the new questions should be used to improve identification of poor households, reassured that the poverty indicators were not linked to credit risk or the assessment thereof, and reminded of the bank’s social mission to reach poor households.5 Loan officers in control branches were informed simply that the 10 new questions were “additional household information.” The loan officers in both cases were tasked with recruiting new clients to expand the bank’s portfolio.
The bank’s management implemented the poverty targeting tool with the intention of making it easier for loan officers to identify poor households and encourage them to apply.6 The treatment group training made this objective prominent and tied it explicitly to the banks’ social missions. Beyond the introduction of the tool and senior management’s exhortation and expectations, loan officers faced no additional inducements to bring in poor households. Nonetheless, the exhortations and expectations by senior management were sincere: the plan was for the training to increase lending to the poor and then to use that exogenous increase to study the impact of the banks’ microlending on poverty alleviation.
Loan officers also faced standard incentives to maximize the traditional bottom line in the form of performance pay based on number of loans originated and the timeliness of loan repayments. By making identifying poor clients easier and included in a system that would automatically screen out clients who were bad credit risks, along with bank management, we expected the poverty targeting tool to alleviate a classic multi-tasking problem where loan officers faced relatively strong incentives to maximize profits, potentially at the expense of bringing in more poor clients.
Treatment effects of the poverty targeting tool, estimated on outcomes measured over a two-year horizon, suggest that it backfired. On the social side of the bottom line, the tool failed to increase lending to the poor: treated loan officers brought in weakly more applicants (12 additional applicants, but imprecisely estimated), but the total number of poor applicants remained low, averaging just one applicant per loan officer (out of 45 applications). At the same time the applicants brought in by the treatment group were objectively richer than those in the control, with higher monthly incomes and more total assets (0.36 & 0.54 log-points, statistically significant). On the traditional side of the bottom line, there is suggestive evidence that the intervention failed to hold profits constant: loans brought in by treatment group officers have higher default rates (3.4 pp), while loan size and other terms do not change. An increase in default rates is bad not just for
5 Explaining the significance of a task has been shown to improve performance of that task for employees in different contexts (e.g., Grant 2008; DellaVigna and Pope 2018). 6 Ashraf and Bandiera (2018) reviews the literature on the importance of social incentives in organizations, including “vertical social groups,” where employees can be motivated by improving the lives of those they serve.
4
the banks but also for the individual loan officers since higher default rates can lead to reprimands and missed incentive bonuses7.
Surprised by these results, two years after the experimental period we worked with the banks to administer a survey of all bank loan officers (not just those who cover microcredit; N=68) to explore their beliefs and attitudes. We use these surveys to explore mechanisms, specifically employee attitudes and beliefs, with one strong note of caution: these credit officer surveys were conducted after the experimental period and on all loan officers, not just the ones that cover microcredit loans.8 We observe two important insights from the employee survey. First, loan officers view the profit-making side of their job as more important than the social welfare side. Second, loan officers perceive poorer borrowers to be less profitable, despite bank management exhortations and empirical evidence to the contrary.9
Taking the experimental and descriptive results together, we speculate that treatment group loan officers were trying to act like canonical multi-taskers: maximize profits without making any additional effort to bring in more poor borrowers.10 But treated loan officers may have mistakenly thought that the new poverty targeting tool was helping them do a better job of bringing in profitable borrowers by screening out poor credit risks. Perhaps this was a salience-driven overreaction (Bordalo, Gennaioli, and Shleifer 2019); after all, all loan officers in the experiment had access to the tool, with the treatment merely drawing attention to it and to the banks’ social objective. Another possibility is that treatment group default rates rose because of a monitoring failure: perhaps loan officers failed to anticipate the challenges of managing more borrowers.
Our study contributes to the above-cited literatures on multi-tasking, poverty targeting, social enterprise, and social incentives in businesses. In particular, our findings speak to how social incentives and financial incentives can interact and affect organizational performance. While other studies have shown that financial incentives can help mitigate the tendency to favor “in-group” members (e.g. Ashraf and Bandiera (2018), Bandiera et al. (2009)), our context shows how financial incentives can instead exacerbate this tendency when performance is hard to predict and social and financial incentives are perceived to be misaligned. Giné, Mansuri, and Shrestha (2018) find that providing financial incentives to the front-line staff of a nonprofit microlender leads to
7 The 95% randomization inference confidence intervals for these 5 results are (a) number of applicants: [-13.7, 39.1] ; (b) number of poor applicants: [-0.388,1.468]; (c) income: [0.138,0.570]; (d) assets: [0.232,0.852] ; (e) default: [CI: 0.001, 0.089]. 8 Too few loan officers from the experimental period were still employed at the time of the survey to focus the analysis on them. 9 In this sense our study adds to the literatures on biases in expert judgment (e.g., Soll, Milkman and Payne 2015) on the economics of discrimination in product markets and credit markets in particular (e.g., Blanchflower, Levine, and Zimmerman 2003; Hanson et al. 2016), and on the importance of the motivation of front-line employees (e.g., Ashraf, Bandiera, and Lee 2016). 10 Note that “maximizing profits” could instead be “maximizing utility” and thus incorporate the possibility that the treatment reduces employees’ intrinsic motivation or changes their effort costs.
5
negative social impacts on clients, and our results compliment this line of inquiry by demonstrating how even non-financial incentives can backfire in a setting with a double bottom line.
We also contribute to work on CSR, by adding insights on the production of CSR to a literature that has focused largely on whether firms should invest in it. The CSR literature has only recently begun to use within-firm experiments to examine effects of CSR on employees. The employees in those experiments have been freelancers, with their tasks and customers assigned exogenously, and their responsibilities focused on maximizing profits (V. Burbano 2016; V. C. Burbano 2019; Hedblom, Hickman, and List 2019; List and Momeni 2017). Our experiment complements this work by taking place in long-established firms, with longer-tenured employees who are responsible for bringing in customers and juggling both sides of the bottom line. This setup provides more ecological validity for learning about how to achieve social objectives in most types of firms—especially social enterprises.
Finally, this study also speaks to the literature on organizational and worker identity in hybrid organizations (Battilana and Dorado 2010; Battilana and Lee 2014; Pache and Santos 2012; 2013; Pache, Battilana, and Spencer 2018). While much of the literature utilizes comparative studies to improve our understanding of how these organizations work, we are able to show that in mature hybrid organizations direct efforts that attempt to put more emphasis on the social side of the organization can have deleterious effects if not properly integrated into the incentive structure and culture of the organization.
II. Setting
We developed and conducted the poverty targeting experiment in close cooperation with the senior management and microlending operations of two longstanding, family-owned-and-operated, for-profit banks.11 First Macro Bank (FMB) has eight branches in Metro Manila (serving mostly peri-urban areas) and FICO Bank has twelve branches in Northern Luzon (a more rural region). Both banks offer a range of products and services, with microlending composing a small fraction of their portfolios.12
Each bank touts improving social welfare as a key objective. For example, during our study period FICO’s website stated: “[we] believe in the noble cause of community banking… [the] bank is supportive of the economic ascendancy of the greatest number.” Similarly, FMB’s website stated during our study period that it was founded to help improve the quality of the lives of the poor and “commit[ted] to the development of clients.” During our study FMB received subsidized technical assistance from a USAID-funded program to streamline its microlending processes with the
11 This poverty targeting experiment was part of a larger experiment in which a portion of marginal applicants had their loan decision randomized. These randomized loan decisions do not impact the results presented in this paper. More details can be found in Karlan, Osman and Zinman (2016). 12 At the time of the experiment FICO had approximately 26,000 microcredit clients and FMB had 2,700.
6
objective of bringing in more low-income borrowers (this is commonplace: Cull and Morduch (2017) find that for-profit microlenders obtain more subsidies than do non-profits).
Microcredit’s small loan sizes make it a natural focal point for a poverty targeting effort. FICO and FMB offer individual liability loans with terms and targeting that are in line with their many competitors. Loan amounts range from 5,000 pesos to 50,000 pesos (45 pesos ≈ 1 USD during our experiment, PPP conversion factor = 17.8). Repayments are amortized over a 3- to 6-month maturity and are due weekly. Annual percentage rates are around 60% (and, given low inflation, approximate real rates). In order to be approved, applicants must have an existing business, be between the ages of 18 and 65, and demonstrate sufficient cash flow to service a new loan. Loan officers were tasked with recruiting new borrowers, as well as servicing the slate of existing borrowers from the bank’s portfolio.
Senior managers at both banks view microlending as an entry point for expanding financial inclusion (social mission) and expanding the bank’s customer base (traditional bottom line). Yet loan officers face no quantitative directives or incentives on how to implement the social mission; indeed, the poverty targeting tool the banks implemented for the study was the most tangible effort to-date to translate exhortation into the concrete action of bringing in more poor clients. Loan officers face clearer incentives on the traditional side of the bottom line, with an incentive bonus based on meeting quantitative monthly targets for portfolio at risk (PAR) and generating new loans. The loan officers are tasked with actively going out and recruiting new clients in addition to continuing to service their existing clients. Our experiment is focused on the new potential clients that the loan officers bring to the bank, and not on existing clients.
Poverty targeting itself is a non-trivial task. In wealthier countries the poor are often identified using measures of formal income, but in developing countries the poor tend to work in the informal economy, making income measurement difficult. Organizations use a variety of different targeting methods to address this challenge (Hanna and Karlan 2017).
Our loan officers thus face a difficult problem: they have front-line responsibility for both sides of the bottom line but face quantitative incentives and directives only on the traditional side. There may well be tension between maximizing profits and bringing in more poor clients. If poor clients are worse credit risks, or are perceived to be worse by officers, they could jeopardize loan officers’ incentive pay. And if poor clients are difficult to identify—if it is difficult to measure whether a given borrower actually contributes to the bank’s objective of expanding lending to the poor—then finding poor borrowers could leave less time for other screening and monitoring activities that are key inputs to the traditional bottom line.
The intervention was designed to alleviate tension in the loan officers’ juggling act by making it easier to identify new applicants who are poor, signaling the importance of bringing in more poor clients, and clarifying the bank management’s belief that credit risk and poverty status are uncorrelated, conditional on the other applicant characteristics considered in underwriting.
7
III. Experimental Design
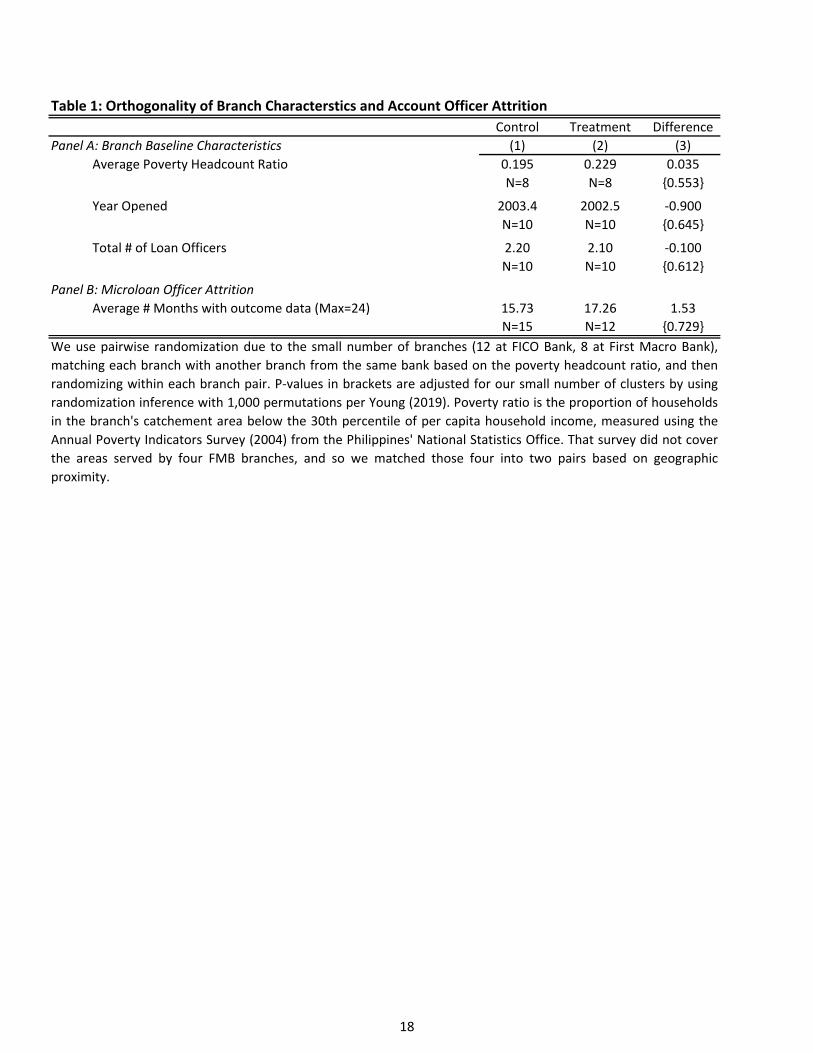
Management at both banks sought to make it easier and more salient for loan officers to bring in more new, poor applicants. To this end the banks worked with us to design and implement a simple experiment on poverty targeting training. In March 2010 we randomized the population of loan officers from the two banks (NL=27), pairwise at the branch level (NB=20), to one of two groups: Treatment and Control.13 The randomization produces twelve treated and fifteen control loan officers, from ten treatment and ten control branches. Table 1 Panel A shows that we cannot reject equality of means for treatment and control branches across the few branch characteristics for which we have data at baseline: poverty headcount in the branch’s catchment area, total number of loan officers (including those not included in the experiment because they are not responsible for microloans), and year opened. Panel B shows no evidence of differential loan officer attrition across the two arms. The null effects in Table 1—and below when we estimate treatment effects—are subject to the important caveat that they are imprecisely estimated.
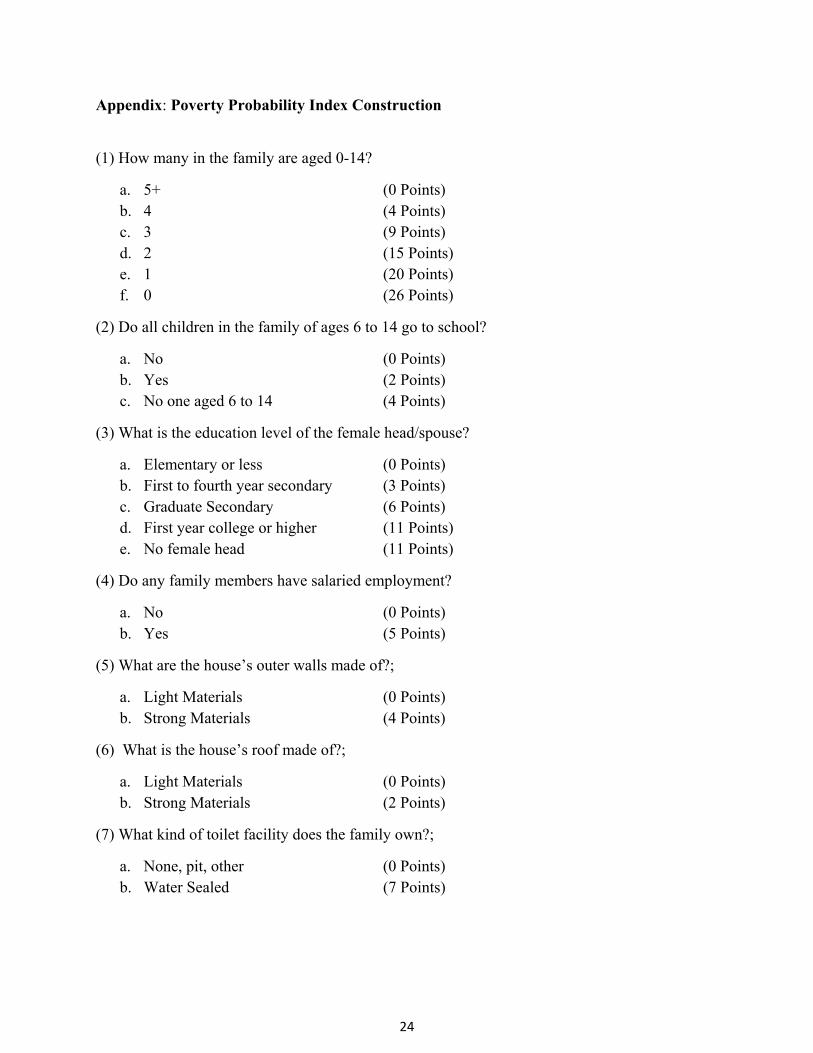
Both treatment and control groups used the same loan application process. Specifically, the start of our experiment coincided with the banks changing from paper applications and manual underwriting to electronic and more-automated underwriting for new applicants. We embedded the Poverty Probability Index (PPI) into the new electronic application.14 The PPI is comprised of ten simple, country-specific questions used to calculate a poverty likelihood (the Appendix details the questions and scoring for the Philippines).
The treatment was simple. As part of the training on the new system, treated loan officers received: 1) Explanation that the purpose of the ten questions was to make it easier to identify and service poor applicants (training for the control loan officers simply referred to these questions as “additional household information); 2) Exhortation tying the PPI to the organization’s social mission of helping the poor by providing them access to microfinance (the control loan officers received no such exhortation), 3) Reassurance that, taking into account the other information required of applicants and thus conditioning on being approved for a loan, poverty status does not impact credit risk.15 Hence management asserted to credit officers that bringing in more poor
13 We use pairwise randomization due to the small number of branches (NB=20), matching each branch with another branch from the same bank based on the poverty headcount ratio of each branch’s catchment area, and then randomizing within each branch pair. 14 The PPI was developed by the Grameen Foundation in 2006 and is now used by organizations in 45 countries. The Philippines index was based on data from the Philippines’ Annual Poverty Indicators Survey (APIS). In 2016, Grameen transferred management of the index to Innovations for Poverty Action (IPA), which then changed the PPI name from the Progress out of Poverty Index to the Poverty Probability Index. The new name was chosen to reflect the static nature of the index, i.e., the index estimates the likelihood of being below the poverty line at a particular point in time, and does not estimate or predict changes over time. 15 By design the answers to the PPI questions had no direct bearing on whether an applicant was approved for a loan. The PPI score was not calculated directly on the loan application, and so loan officers only saw the answers to the questions and not an actual index.
8
borrowers would not affect loan officers’ ability to meet their incentive targets for loan performance. The control loan officers were only told that these questions were part of the loan application and received no explanation of the deeper purpose of the questions, and hence there was no exhortation nor a need for reassurance. The treatment was part of a larger training on how to use the new loan application system, and this was the only part of the content that differed across groups. The training was provided by IPA staff and attended by loan officers and reinforced by branch managers.
Although the social mission of the organization was included in official documents, conversations with loan officers and management made clear that it was not usually a central focus on the job. The exhortation described as part of the treatment was different from normal procedure, as loan officers were neither asked nor trained to focus on intentionally reaching out to the poor in a systematic way before the start of the study.
IV. Results
We estimate treatment effects of the poverty targeting training on loan officer behavior by regressing an outcome 𝑦 , pertinent to the traditional or social side of the banks’ bottom lines and e measured over the 24-months post-random assignment, on a treatment group indicator 𝑇 and our randomization strata 𝛿 (i.e., our branch-pair fixed effects):
𝑦 𝛽 ∗ 𝑇 𝛿 ∗ 𝑃𝑎𝑖𝑟 𝜀
i indexes loan officers, loan applicants, or loans, depending on the outcome. We cluster standard errors at the level of randomization: the bank branch.16 Because we have a small number of branches (20), we use randomization inference to generate our p-values and associated confidence intervals with 1,000 permutations (Young 2019; Heß 2017). Table 2 reports treatment effect estimates for various outcomes in Column 3, with regression-adjusted means for each outcome in Columns 1 and 2 (for control and treatment observations, respectively).
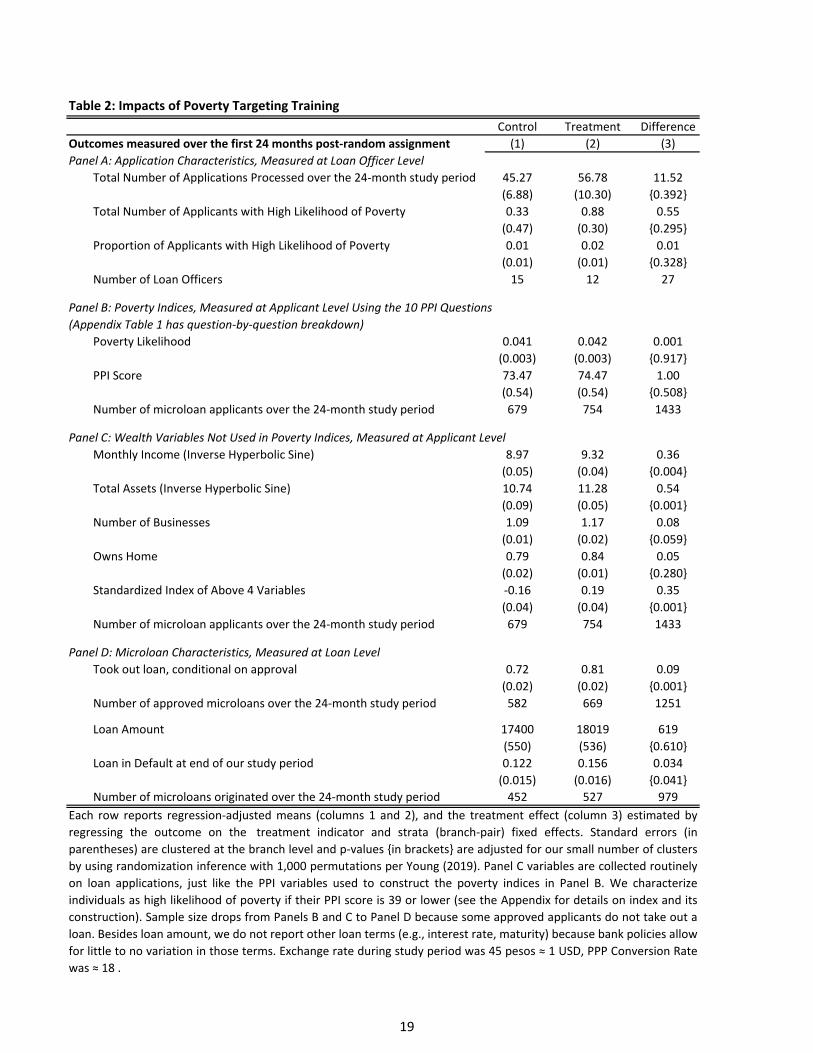
Starting with the social side of the bottom lines, Table 2 Panel A considers application characteristics, measured at the loan officer level. These data include all applicants irrespective of whether they were eventually approved for the loan. Treated loan officers bring in weakly more new loan applicants over the 24 months post-treatment (12 more with a confidence interval of [-13.7, 39.1], on a base of 45 applicants in the control group17), but there is no economically or statistically significant difference in the number or proportion of poor applicants brought in by the treatment group (e.g., a 0.55 increase, CI: [-0.38, 1.46], on a base of 0.33 applicants with a high likelihood of poverty in the control group). Panel B provides additional evidence that the treatment
16 Chaisemartin and Ramirez-Cuellar (2020) suggests clustering standard errors at the pair level, instead of the unit of randomization. When we do so, our main results on income and default persist. 17 The loan officers already had an existing portfolio of borrowers that they were servicing, and so these 45 applicants were potential new borrowers and did not include repeat borrowers.
9
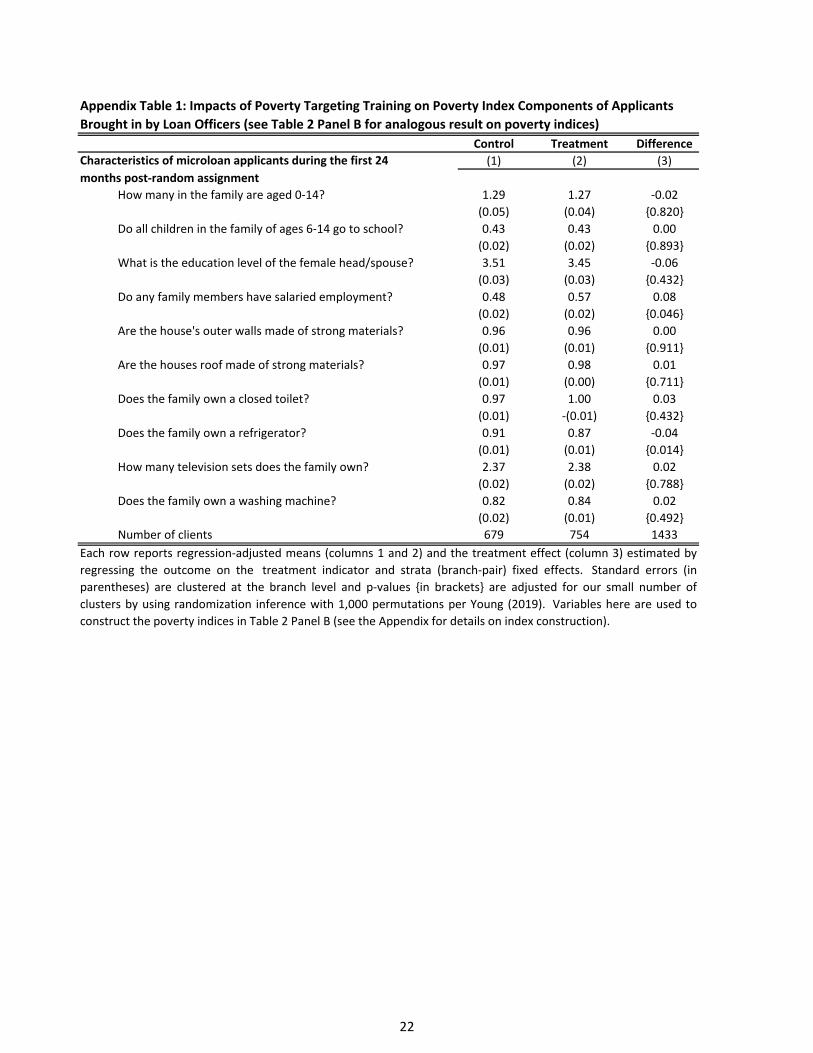
loan officers did not bring in more poor applicants, showing that the average PPI Score and corresponding poverty likelihood are basically unchanged (e.g., a 1 point increase in the PPI score relative to a base score of 65.9 in the control group).18
On the other hand, Panel C shows that loan officers use the PPI training to select richer applicants, with variables collected for underwriting purposes but not included in the PPI index indicating higher-income and higher-wealth applicants. Monthly income is 36% higher (CI: [0.138,0.570]), total assets are 54% higher (CI: [0.232,0.852 ]), the number of businesses per applicant is 0.08 higher (CI: [-0.004,0.176]), and homeownership is 5% higher (CI: [-0.043,0.138]).19
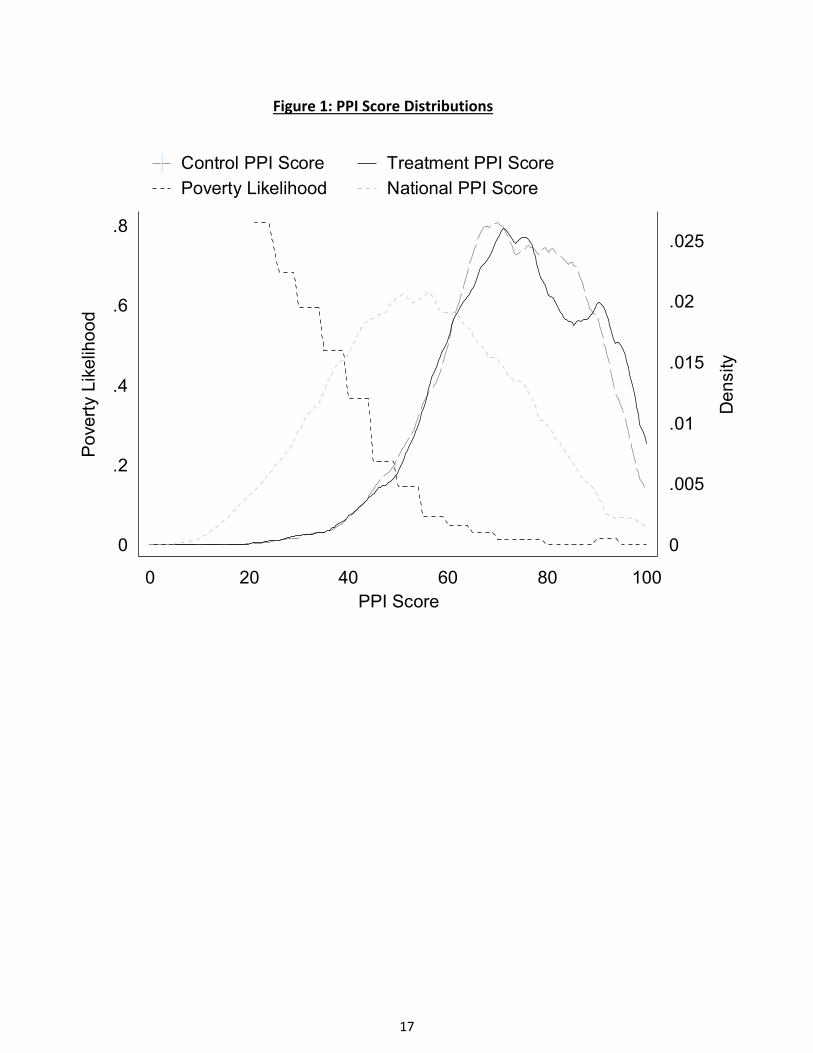
The apparent contradiction that Panel C’s strong increase in wealth is not reflected in a strong decrease in poverty likelihood in Panels A or B is resolved by noting that the PPI tool is calibrated to assess poverty likelihood changes at lower levels of income and wealth than the great majority of applicants in our sample. Figure 1 plots the distribution of PPI scores against poverty likelihood in a nationally representative sample.20 It shows that our sample is relatively rich, with our treatment and control distributions lying mostly in the flat part of the score-likelihood gradient. Thus the failure of our intervention to bring in more poor applicants produces, mechanically, an attenuation of the relationship between the PPI score and poverty likelihood. By construction, the score is not meant to be predictive for those with a very low poverty likelihood.
Comparing treatment vs. control, we find that the distributions are significantly different from each other (p-value=0.035 from a Kolmogorov-Smirnov test) with a treatment effect on right-skewness that is consistent with the higher wealth found in Table 1 Panel C.
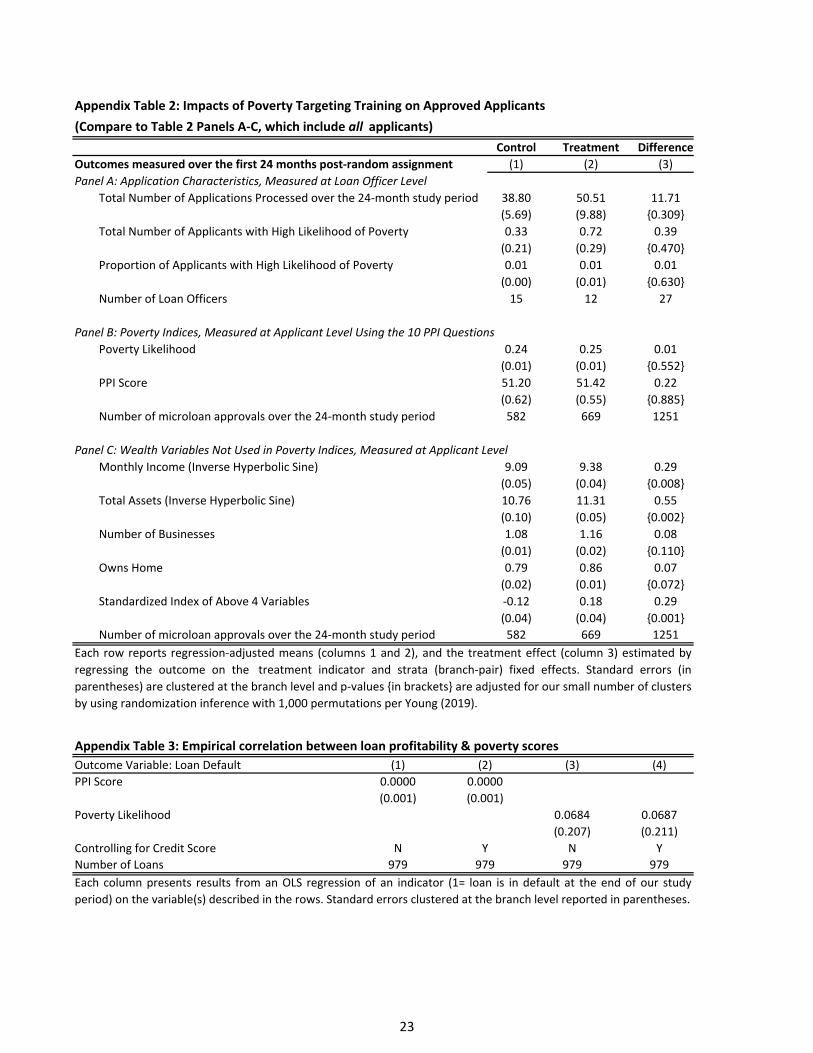
Turning to the traditional side of the bottom line, we note that while treated loan officers bring in weakly more applicants (Panel A) and approved loans (Appendix Table 2 Panel A), an increase in loan volume will increase profitability only if there are fixed costs (which is a fair assumption), loan terms do not become less favorable to the bank, and loan performance does not deteriorate. Table 2 Panel D examines the latter two assumptions and finds no evidence that loan terms change: the estimated treatment effect on loan amount is 619 pesos on a base of 17,400. (Other loan terms are essentially fixed per bank policy; e.g., loan officers have little if any discretion over interest rates, repayment frequency, maturity, collateral requirements, etc.) But the key result in Table 2 Panel D suggests that loan performance does deteriorate: the most important measure of portfolio-at-risk (based on the actual performance incentives of loan officers), loan default, increases by 3.4pp (CI: [0.001, 0.089], control group proportion=0.122) on loans originated by treated loan officers. A reduction in loan performance of this magnitude would almost certainly prevent a loan officer from earning a performance bonus, as bonuses are forfeited if portfolio-at-risk is above 5%.
18 Appendix Table 1 reports treatment effects on each of the 10 components of the PPI. 19 Appendix Table 2 shows a similar pattern of results if we consider only approved applications in Panels A-C instead of all applications. 20 We generate the national distribution using data from the 2008 Annual Poverty Indicator Survey.
10
The increase in default may be (partially) explained by the 9pp increase in loan take-up conditional on application approval (Panel D). This is an additional indication that the treatment induced loan officers to change their screening and targeting activities in unintended ways. We explore how and why in the next section.
All told, the results in Table 2 suggest that the poverty targeting treatment caused loan officers to miss both social impact and profitability targets.
V. Exploring Mechanisms through an Ex-Post Loan Officer Survey
Bank management and we were surprised by the results in Table 2. To explore how loan officer attitudes and beliefs might moderate and/or drive the results, we fielded a survey approximately two years after the conclusion of our study period (i.e., approximately four years after starting the experiment). Neither bank had made changes to its loan application or scoring system in the interim, with new loan officers using the PPI questions as “additional household information” with no additional training, a la our Control Group. Research team staff interviewed the 17 of the 27 loan officers who were part of our experiment and still with their original bank, as well as 51 other loan officers from other parts of the banks. Below we report results for all 68 loan officers, and do not focus primarily on the subsample of loan officers remaining from our experiment, given the high attrition rate and small remaining sample size for that sub-sample. We view this analysis as suggestive of how loan officers view their jobs. The timing of the survey (after implementation of the experiment) requires caution in interpreting the results. Specifically, the treatment may have changed employee perspectives. While we do compare responses between treatment and control employees and find no statistically significant differences, we also note this is a low-powered test.
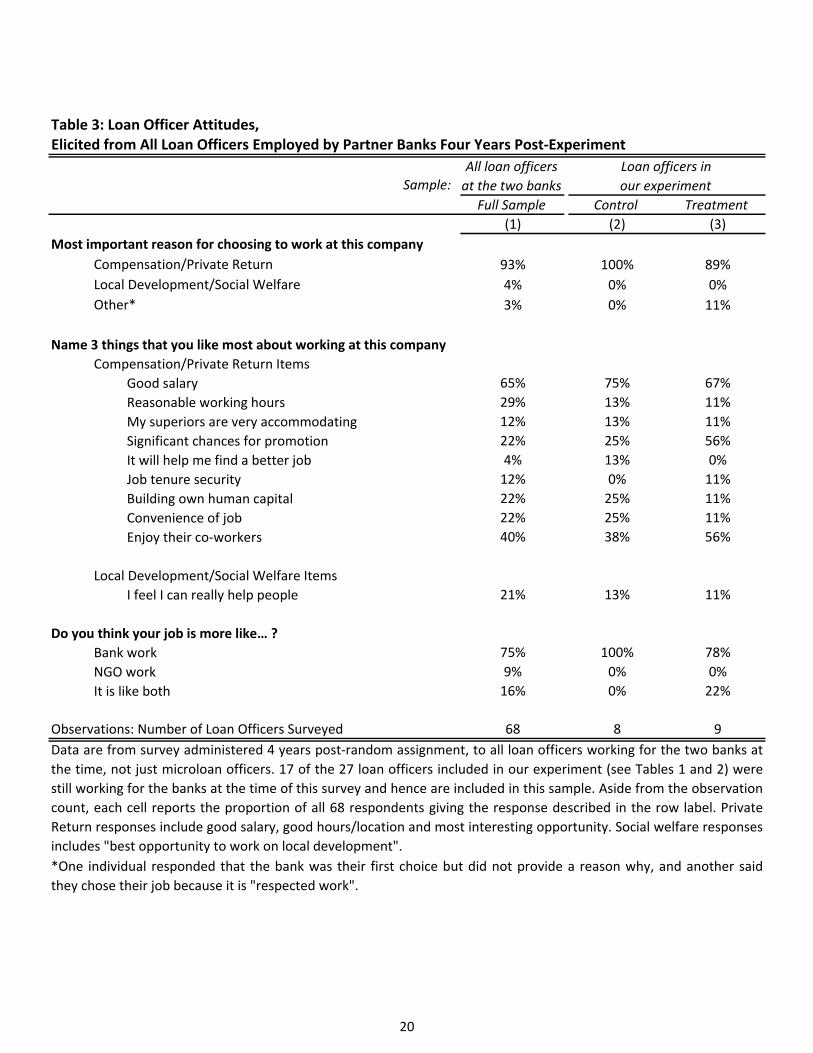
Table 3 explores how loan officers view their jobs (Column 1), with an eye on the relative importance of the two bottom lines. Tellingly, when asked for their “Most important reason for choosing to work at this company,” only 3 of the 68 select “Best Opportunity to Work on Local Development/Welfare,” while 93% select a reason related to their private returns- either “Best Paid” or “Most Interesting.” Similarly, when asked to “Name 3 things that you like most about working at this company,” 65% choose “Salary” and 100% named at least one reason related to private returns, while only 21% choose “I feel I can really help people.” In the same vein, when asked “Do you think your job is more like…?”, 75% choose “Bank work,” while only 9% choose “NGO work” and 16% choose “Both.” The response patterns in this table suggest that loan officers see themselves as bankers first and foremost. Among the 17 loan officers remaining from our experiment, the slant towards the traditional bottom line seems, if anything, more pronounced (compare Columns 2 and 3 to Column 1).
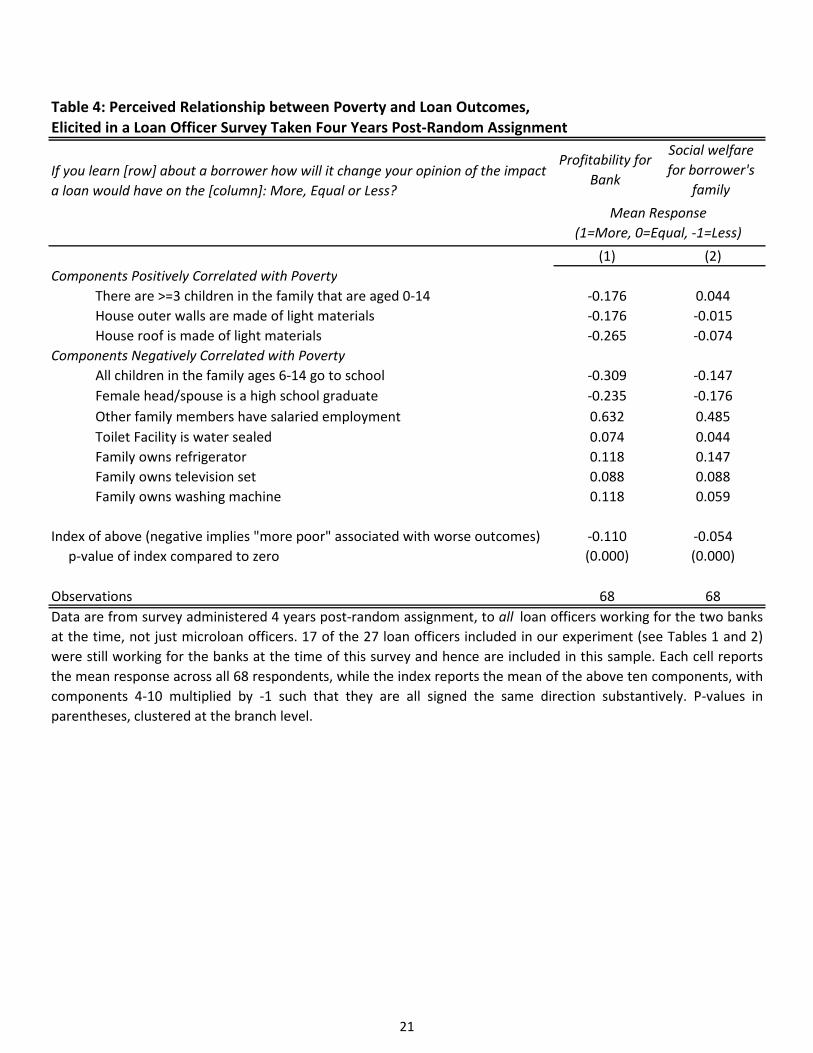
Table 4 sheds some light on how loan officers map an applicant’s poverty status onto each side of the double bottom line. The survey asks, for each of the ten PPI component questions, “If you learn the following about a borrower how will it change your opinion of the impact a loan would have on…?” (1) “Profitability for the bank” and (2) “Social welfare for the borrower’s family”. We code “More” responses as 1, “Equal” as zero, and, and “Less” as -1.
11
Column (1) suggests that loan officers perceive the three poverty indicators (many children, light wall and roof materials) as being negatively correlated with profitability. Conversely, most of the seven wealth indicators are thought to be positively correlated with profitability. Averaging the ten responses per loan officer into a single index, after multiplying wealth indicator responses by -1 so that lower values indicate more poverty in each of the ten variables, we infer that on the whole loan officers perceive a negative relationship between profitability and poverty: -0.110. Appendix Table 3 takes this hypothesis to data on loan performance and borrower characteristics and finds no evidence to support it, either unconditionally or conditional on credit score. It seems that loan officers have incorrect perceptions.
Table 4 Column (2) suggests that loan officers perceive poorer borrowers as benefiting no more from loans than richer borrowers, and perhaps relatively less. The three poverty indicators are thought by the loan officers to be weakly related with social welfare (with mean responses indicating basically no relationship), while the seven wealth indicators have a small and positive perceived relationship with social welfare on average. Aggregating the ten responses into a single index as above, the perceived relationship between poverty and impacts on the borrower is -0.054.
In sum, Table 4 suggests that the banks’ loan officers tend to think that bringing in more poor borrowers hurts profitability and does not improve social welfare. This suggests an explanation for the failure of our targeting intervention: 1) treated loan officers shared these perceptions during our study despite management reassurances and exhortations to the contrary; 2) treated loan officers tried to use the PPI as a credit risk screening tool instead of a poverty targeting tool; 3) this (mis)use of the PPI backfired, because it led loan officers to bring in applicants that actually had greater ex-ante risk (a screening failure), and/or because it led loan officers to take on larger portfolios that proved unexpectedly difficult to manage (a monitoring failure). Note this interpretation requires some speculation, since the data, and the timing in which we collected the data, do not allow for a decisive inference about the specific mechanism behind the broader pattern.
VI. Conclusion & Lessons for Future Experiments with Firms
We worked with two for-profit microfinance institutions in the Philippines to implement and test a widely used poverty targeting tool (the Poverty Probability Index), with the objective of providing more loans to poor households. The PPI consists of ten simple questions and was integrated into the standard loan application at each institution. Loan officer training at control group branches (N=10) simply referred to the tool as “additional household information.” Training at treatment group branches (N=10) featured explanation of the questions; exhortation to use them to meet the banks’ social missions by bringing in more poor borrowers; and reassurance from management that poverty status and loan performance are uncorrelated, conditional on other applicant characteristics.21
21 This reassurance is empirically validated (Appendix Table 3), but the training did not provide any quantitative evidence.
12
The treatment group training backfired: it produced no improvement on the social side of the bottom line (bringing in no more poor applicants or borrowers), while possibly harming the traditional side of the bottom line (our point estimate suggests that loan performance deteriorated substantially). Descriptive evidence suggests that the additional training exacerbated loan officer misperceptions and multitasking problems, with loan officers trying and failing to use the poverty measurement tool in pursuit of profit rather than social objectives.
Some important caveats are worth emphasizing. From an internal validity perspective, our results are underpowered22, and the mechanisms we identify are merely suggestive. The point estimates are surprising given the intent of the changed policy, and therefore replication is especially important. From an external validity perspective, our results do not imply that PPI is an ineffective targeting tool in general. The PPI may well be effective in the context of a program whose main purpose is reaching and helping the poor. And our results do not imply that double-bottom line efforts will always backfire; it is important to keep in mind that our partner banks, despite their stated social impact goals and training of staff to reach the poor, provided financial incentives (and perhaps selected personnel) for the traditional bottom line.
Nonetheless our findings suggest that caution is warranted when entrusting employees to balance two bottom lines. Our results also provide an explanation for why many firms take the balancing act out of front-line employees’ hands, by segregating corporate social responsibility (CSR) functions from core activities. But separating CSR from core functions may not be optimal in many companies—and perhaps in social enterprises especially.
These results open up several avenues of future research regarding how managers and front-line employees can properly juggle both sides of a double-bottom line (or, more broadly, multiple margins of a multi-tasking problem). Future experiments might consider different types of financial and non-financial incentives to better reach the aims set out by the organization. Complementary approaches include testing different training content, employee recruitment strategies, and/or feedback and workflow management tools; better-timed surveys on employee attitudes and perceptions; and more granular measurement of employee activities. There is much more to learn about the challenges and opportunities of implementing and successfully managing a double-bottom line.
This study makes poignant a key lesson for conducting experiments within firms or organizations: gathering data, either qualitative or quantitative, on competing internal organizational and personnel incentives could be critical for a thorough and accurate understanding of how and why policy changes unfold. Incentives may be hidden or complex, and thus their effects also unanticipated. While unexpected outcomes are often a good chance to learn something new, to understand them properly requires having the right data, otherwise researchers are left to
22 To assess power we can calculate the minimum detectable effect size (MDE) by multiplying our standard errors by 2.8. In many cases the MDEs are relatively large. For instance, the MDE for income is 0.15 log points, whereas the MDE for default is 0.042.
13
speculate. In our case, for example, we ideally would have had surveys of loan officer to measure their motivations and perceptions of risks prior to the intervention rather than afterwards.
Closely related, a second key lesson pertains to interpretation and external validity of results. If organizational dynamics, both across and within institutions, drive differences in policy effectiveness, such dynamics must be understood and incorporated into the theory of change in order to establish external validity of the core experimental results (e.g., see Ashraf et al. 2020; Deserranno 2019). While questions about external validity often focus on potential heterogeneity with respect to policy design, policy targets, and/or broader contextual factors such as economic conditions, the results here point to heterogeneity in employee incentives and motivations as potentially important as well when collaborating with pro-social organizations.
14
References Alatas, Vivi, Abhijit Banerjee, Rema Hanna, Benjamin A. Olken, Ririn Purnamasari, and Matthew Wai‐Poi.
2016. “Self‐Targeting: Evidence from a Field Experiment in Indonesia.” Journal of Political Economy 124 (2): 371–427. https://doi.org/10.1086/685299.
Alatas, Vivi, Abhijit Banerjee, Rema Hanna, Benjamin A Olken, and Julia Tobias. 2012. “Targeting the Poor: Evidence from a Field Experiment in Indonesia.” American Economic Review 102 (4): 1206–40. https://doi.org/10.1257/aer.102.4.1206.
Ashraf, Nava, and Oriana Bandiera. 2018. “Social Incentives in Organizations.” Annual Review of Economics, May. https://doi.org/10.1146/annurev‐economics‐063016‐104324.
Ashraf, Nava, Oriana Bandiera, Edward Davenport, and Scott S. Lee. 2020. “Losing Prosociality in the Quest for Talent? Sorting, Selection, and Productivity in the Delivery of Public Services.” American Economic Review 110 (5): 1355–94. https://doi.org/10.1257/aer.20180326.
Ashraf, Nava, Oriana Bandiera, and Scott S Lee. 2016. “Do‐Gooders and Go‐Getters: Career Incentives, Selection, and Performance in Public Service Delivery.” Working Paper.
Bandiera, Oriana, Iwan Barankay, and Imran Rasul. 2009. “Social Connections and Incentives in the Workplace: Evidence From Personnel Data.” Econometrica 77 (4): 1047–94. https://doi.org/10.3982/ECTA6496.
Banerjee, Abhijit, Esther Duflo, Nathanael Goldberg, Dean Karlan, Robert Osei, William Parienté, Jeremy Shapiro, Bram Thuysbaert, and Christopher Udry. 2015. “A Multifaceted Program Causes Lasting Progress for the Very Poor: Evidence from Six Countries.” Science 348 (6236): 1260799. https://doi.org/10.1126/science.1260799.
Battilana, Julie, and Silvia Dorado. 2010. “Building Sustainable Hybrid Organizations: The Case of Commercial Microfinance Organizations.” The Academy of Management Journal 53 (6): 1419–40.
Battilana, Julie, and Matthew Lee. 2014. “Advancing Research on Hybrid Organizing – Insights from the Study of Social Enterprises.” The Academy of Management Annals 8 (1): 397–441. https://doi.org/10.1080/19416520.2014.893615.
Besley, Timothy, and Maitreesh Ghatak. 2017. “Profit with Purpose? A Theory of Social Enterprise.” American Economic Journal: Economic Policy 9 (3): 19–58. https://doi.org/10.1257/pol.20150495.
Blanchflower, D., P. Levine, and D. Zimmerman. 2003. “Discrimination in the Small Business Credit Market.” Review of Economics and Statistics 85 (4): 930–43.
Bordalo, Pedro, Nicola Gennaioli, and Andrei Shleifer. 2019. “Memory, Attention, and Choice.” Burbano, Vanessa. 2016. “Social Responsibility Messages and Worker Wage Requirements: Field
Experimental Evidence from Online Labor Marketplaces.” Organization Science 27 (4): 1010–28. https://doi.org/10.1287/orsc.2016.1066.
Burbano, Vanessa C. 2019. “Getting Gig Workers to Do More by Doing Good: Field Experimental Evidence From Online Platform Labor Marketplaces.” Organization & Environment, May, 1086026619846455. https://doi.org/10.1177/1086026619846455.
Chaisemartin, Clément de, and Jaime Ramirez‐Cuellar. 2020. “At What Level Should One Cluster Standard Errors in Paired Experiments, and in Stratified Experiments with Small Strata?” w27609. National Bureau of Economic Research. https://doi.org/10.3386/w27609.
Conning, Jonathan, and Jonathan Morduch. 2011. “Microfinance and Social Investment.” Annual Review of Financial Economics 3: 407–34.
Cull, Robert, and Jonathan Morduch. 2017. “Microfinance and Economic Development.” Handbook of Finance and Development.
Dees, J. Gregory. 2001. “The Meaning of ‘Social Entrepreneurship.’” Case Studies in Social Entrepreneurship and Sustainability.
15
DellaVigna, Stefano, and Devin Pope. 2018. “What Motivates Effort? Evidence and Expert Forecasts.” The Review of Economic Studies 85 (2): 1029–69. https://doi.org/10.1093/restud/rdx033.
Deserranno, Erika. 2019. “Financial Incentives as Signals: Experimental Evidence from the Recruitment of Village Promoters in Uganda.” American Economic Journal: Applied Economics 11 (1): 277–317. https://doi.org/10.1257/app.20170670.
Doane, Deborah. 2005. “The Myth of CSR.” Stanford Social Innovation Review. https://ssir.org/articles/entry/the_myth_of_csr.
Flammer, Caroline. 2015. “Does Corporate Social Responsibility Lead to Superior Financial Performance? A Regression Discontinuity Approach.” Management Science 61 (11): 2549–68. https://doi.org/10.1287/mnsc.2014.2038.
Giné, Xavier, Ghazala Mansuri, and Slesh Shrestha. 2018. “Mission and the Bottom Line: Performance Incentives in a Multigoal Organization.” World Bank Policy Research Paper, June.
Grant, Adam M. 2008. “The Significance of Task Significance: Job Performance Effects, Relational Mechanisms, and Boundary Conditions.” The Journal of Applied Psychology 93 (1): 108–24. https://doi.org/10.1037/0021‐9010.93.1.108.
Hanna, R., and D. Karlan. 2017. “Chapter 7 ‐ Designing Social Protection Programs: Using Theory and Experimentation to Understand How to Help Combat Poverty.” In Handbook of Economic Field Experiments, edited by Abhijit Vinayak Banerjee and Esther Duflo, 2:515–53. Handbook of Economic Field Experiments. North‐Holland. https://doi.org/10.1016/bs.hefe.2016.07.002.
Hanson, Andrew, Zackary Hawley, Hal Martin, and Bo Liu. 2016. “Discrimination in Mortgage Lending: Evidence from a Correspondence Experiment.” Journal of Urban Economics 92 (March): 48–65. https://doi.org/10.1016/j.jue.2015.12.004.
Hart, Oliver, and Luigi Zingales. 2017. “Companies Should Maximize Shareholder Welfare Not Market Value.” SSRN Scholarly Paper ID 3004794. Rochester, NY: Social Science Research Network. https://papers.ssrn.com/abstract=3004794.
Hedblom, Daniel, Brent Hickman, and John List. 2019. “Toward an Understanding of Corporate Social Responsibility: Theory and Field Experimental Evidence.”
Heß, Simon. 2017. “Randomization Inference with Stata: A Guide and Software.” The Stata Journal 17 (3): 630–51.
Holmstrom, Bengt, and Paul Milgrom. 1991. “Multitask Principal‐Agent Analyses: Incentive Contracts, Asset Ownership, and Job Design.” Journal of Law, Economics, & Organization 7: 24–52.
———. 1994. “The Firm as an Incentive System.” The American Economic Review 84 (4): 972–91. Karlan, Dean, Adam Osman, and Jonathan Zinman. 2016. “Follow the Money Not the Cash: Comparing
Methods for Identifying Consumption and Investment Responses to a Liquidity Shock.” Journal of Development Economics 121 (July): 11–23. https://doi.org/10.1016/j.jdeveco.2015.10.009.
Karlan, Dean, and Bram Thuysbaert. 2016. “Targeting Ultra‐Poor Households in Honduras and Peru.” The World Bank Economic Review, August. https://doi.org/10.1093/wber/lhw036.
Karlan, Dean, and Jonathan Zinman. 2018. “Long‐Run Price Elasticities of Demand for Credit: Evidence from a Countrywide Field Experiment in Mexico.” The Review of Economic Studies, September. https://doi.org/10.1093/restud/rdy046.
Kitzmueller, Markus, and Jay Shimshack. 2012. “Economic Perspectives on Corporate Social Responsibility.” Journal of Economic Literature 50 (1): 51–84. https://doi.org/10.1257/jel.50.1.51.
List, John A., and Fatemeh Momeni. 2017. “When Corporate Social Responsibility Backfires: Theory and Evidence from a Natural Field Experiment.” Working Paper 24169. National Bureau of Economic Research. https://doi.org/10.3386/w24169.
16
Luca, Michael, Jon Kleinberg, and Sendhil Mullainathan. 2016. “Algorithms Need Managers, Too.” Harvard Business Review, January 1, 2016. https://hbr.org/2016/01/algorithms‐need‐managers‐too.
Pache, Anne‐Claire, Julie Battilana, and Channing Spencer. 2018. “Keeping an Eye on Two Goals: Governance and Organizational Attention in Hybrid Organizations.” Academy of Management Proceedings 2018 (1): 18007. https://doi.org/10.5465/AMBPP.2018.18007abstract.
Pache, Anne‐Claire, and Filipe Santos. 2012. “Inside the Hybrid Organization: Selective Coupling as a Response to Competing Institutional Logics.” Academy of Management Journal 56 (4): 972–1001. https://doi.org/10.5465/amj.2011.0405.
———. 2013. “Embedded in Hybrid Contexts: How Individuals in Organizations Respond to Competing Institutional Logics.” Book‐part. January 1, 2013. https://doi.org/10.1108/S0733‐558X(2013)0039AB014.
Palacios, Maria. 2018. “Price Setting and Multitasking by Sales Agents: Evidence from a Contract Change.”
Servaes, Henri, and Ane Tamayo. 2013. “The Impact of Corporate Social Responsibility on Firm Value: The Role of Customer Awareness.” Management Science 59 (5): 1045–61. https://doi.org/10.1287/mnsc.1120.1630.
Soll, Jack B., Katherine L. Milkman, and John W. Payne. 2015. “A User’s Guide to Debiasing.” In The Wiley Blackwell Handbook of Judgment and Decision Making, edited by Gideon Keren and George Wu, 924–51. John Wiley & Sons, Ltd. https://doi.org/10.1002/9781118468333.ch33.
Young, Alwyn. 2019. “Channeling Fisher: Randomization Tests and the Statistical Insignificance of Seemingly Significant Experimental Results.” The Quarterly Journal of Economics 134 (2): 557–98. https://doi.org/10.1093/qje/qjy029.
Yunus, Muhammad. 2008. “Creating a World without Poverty: Social Business and the Future of Capitalism.” Global Urban Development 4 (2): 1–19.
17
Figure 1: PPI Score Distributions
0
.005
.01
.015
.02
.025
Den
sity
0
.2
.4
.6
.8
Pove
rty L
ikel
ihoo
d
0 20 40 60 80 100PPI Score
Control PPI Score Treatment PPI ScorePoverty Likelihood National PPI Score
18
Table 1: Orthogonality of Branch Characterstics and Account Officer Attrition
Control Treatment Difference
Panel A: Branch Baseline Characteristics (1) (2) (3)
Average Poverty Headcount Ratio 0.195 0.229 0.035
N=8 N=8 {0.553}
Year Opened 2003.4 2002.5 ‐0.900
N=10 N=10 {0.645}
Total # of Loan Officers 2.20 2.10 ‐0.100
N=10 N=10 {0.612}
Panel B: Microloan Officer Attrition
Average # Months with outcome data (Max=24) 15.73 17.26 1.53
N=15 N=12 {0.729}
We use pairwise randomization due to the small number of branches (12 at FICO Bank, 8 at First Macro Bank),
matching each branch with another branch from the same bank based on the poverty headcount ratio, and then
randomizing within each branch pair. P‐values in brackets are adjusted for our small number of clusters by using
randomization inference with 1,000 permutations per Young (2019). Poverty ratio is the proportion of households
in the branch's catchement area below the 30th percentile of per capita household income, measured using the
Annual Poverty Indicators Survey (2004) from the Philippines' National Statistics Office. That survey did not cover
the areas served by four FMB branches, and so we matched those four into two pairs based on geographic
proximity.
19
Control Treatment Difference
Outcomes measured over the first 24 months post‐random assignment (1) (2) (3)
Panel A: Application Characteristics, Measured at Loan Officer Level
Total Number of Applications Processed over the 24‐month study period 45.27 56.78 11.52
(6.88) (10.30) {0.392}
Total Number of Applicants with High Likelihood of Poverty 0.33 0.88 0.55
(0.47) (0.30) {0.295}
Proportion of Applicants with High Likelihood of Poverty 0.01 0.02 0.01
(0.01) (0.01) {0.328}
Number of Loan Officers 15 12 27
Panel B: Poverty Indices, Measured at Applicant Level Using the 10 PPI Questions
(Appendix Table 1 has question‐by‐question breakdown)
Poverty Likelihood 0.041 0.042 0.001
(0.003) (0.003) {0.917}
PPI Score 73.47 74.47 1.00
(0.54) (0.54) {0.508}
Number of microloan applicants over the 24‐month study period 679 754 1433
Panel C: Wealth Variables Not Used in Poverty Indices, Measured at Applicant Level
Monthly Income (Inverse Hyperbolic Sine) 8.97 9.32 0.36
(0.05) (0.04) {0.004}
Total Assets (Inverse Hyperbolic Sine) 10.74 11.28 0.54
(0.09) (0.05) {0.001}
Number of Businesses 1.09 1.17 0.08
(0.01) (0.02) {0.059}
Owns Home 0.79 0.84 0.05
(0.02) (0.01) {0.280}
Standardized Index of Above 4 Variables ‐0.16 0.19 0.35
(0.04) (0.04) {0.001}
Number of microloan applicants over the 24‐month study period 679 754 1433
Panel D: Microloan Characteristics, Measured at Loan Level
Took out loan, conditional on approval 0.72 0.81 0.09
(0.02) (0.02) {0.001}
Number of approved microloans over the 24‐month study period 582 669 1251
Loan Amount 17400 18019 619
(550) (536) {0.610}
Loan in Default at end of our study period 0.122 0.156 0.034
(0.015) (0.016) {0.041}
Number of microloans originated over the 24‐month study period 452 527 979
Table 2: Impacts of Poverty Targeting Training
Each row reports regression‐adjusted means (columns 1 and 2), and the treatment effect (column 3) estimated by
regressing the outcome on the treatment indicator and strata (branch‐pair) fixed effects. Standard errors (in
parentheses) are clustered at the branch level and p‐values {in brackets} are adjusted for our small number of clusters
by using randomization inference with 1,000 permutations per Young (2019). Panel C variables are collected routinely
on loan applications, just like the PPI variables used to construct the poverty indices in Panel B. We characterize
individuals as high likelihood of poverty if their PPI score is 39 or lower (see the Appendix for details on index and its
construction). Sample size drops from Panels B and C to Panel D because some approved applicants do not take out a
loan. Besides loan amount, we do not report other loan terms (e.g., interest rate, maturity) because bank policies allow
for little to no variation in those terms. Exchange rate during study period was 45 pesos ≈ 1 USD, PPP Conversion Rate
was ≈ 18 .
20
Table 3: Loan Officer Attitudes, Elicited from All Loan Officers Employed by Partner Banks Four Years Post‐Experiment
All loan officers
at the two banks
Full Sample Control Treatment
(1) (2) (3)
Most important reason for choosing to work at this company
Compensation/Private Return 93% 100% 89%
Local Development/Social Welfare 4% 0% 0%
Other* 3% 0% 11%
Name 3 things that you like most about working at this company
Compensation/Private Return Items
Good salary 65% 75% 67%
Reasonable working hours 29% 13% 11%
My superiors are very accommodating 12% 13% 11%
Significant chances for promotion 22% 25% 56%
It will help me find a better job 4% 13% 0%
Job tenure security 12% 0% 11%
Building own human capital 22% 25% 11%
Convenience of job 22% 25% 11%
Enjoy their co‐workers 40% 38% 56%
Local Development/Social Welfare Items
I feel I can really help people 21% 13% 11%
Do you think your job is more like… ?
Bank work 75% 100% 78%
NGO work 9% 0% 0%
It is like both 16% 0% 22%
Observations: Number of Loan Officers Surveyed 68 8 9
Sample:Loan officers in
our experiment
Data are from survey administered 4 years post‐random assignment, to all loan officers working for the two banks at
the time, not just microloan officers. 17 of the 27 loan officers included in our experiment (see Tables 1 and 2) were
still working for the banks at the time of this survey and hence are included in this sample. Aside from the observation
count, each cell reports the proportion of all 68 respondents giving the response described in the row label. Private
Return responses include good salary, good hours/location and most interesting opportunity. Social welfare responses
includes "best opportunity to work on local development".
*One individual responded that the bank was their first choice but did not provide a reason why, and another said
they chose their job because it is "respected work".
21
Table 4: Perceived Relationship between Poverty and Loan Outcomes, Elicited in a Loan Officer Survey Taken Four Years Post‐Random Assignment
Profitability for
Bank
Social welfare
for borrower's
family
(1) (2)
Components Positively Correlated with Poverty
There are >=3 children in the family that are aged 0‐14 ‐0.176 0.044
House outer walls are made of light materials ‐0.176 ‐0.015
House roof is made of light materials ‐0.265 ‐0.074
Components Negatively Correlated with Poverty
All children in the family ages 6‐14 go to school ‐0.309 ‐0.147
Female head/spouse is a high school graduate ‐0.235 ‐0.176
Other family members have salaried employment 0.632 0.485
Toilet Facility is water sealed 0.074 0.044
Family owns refrigerator 0.118 0.147
Family owns television set 0.088 0.088
Family owns washing machine 0.118 0.059
Index of above (negative implies "more poor" associated with worse outcomes) ‐0.110 ‐0.054
p‐value of index compared to zero (0.000) (0.000)
Observations 68 68
Mean Response
(1=More, 0=Equal, ‐1=Less)
Data are from survey administered 4 years post‐random assignment, to all loan officers working for the two banks
at the time, not just microloan officers. 17 of the 27 loan officers included in our experiment (see Tables 1 and 2)
were still working for the banks at the time of this survey and hence are included in this sample. Each cell reports
the mean response across all 68 respondents, while the index reports the mean of the above ten components, with
components 4‐10 multiplied by ‐1 such that they are all signed the same direction substantively. P‐values in
parentheses, clustered at the branch level.
If you learn [row] about a borrower how will it change your opinion of the impact
a loan would have on the [column]: More, Equal or Less?
22
Control Treatment Difference
(1) (2) (3)
months post‐random assignment
How many in the family are aged 0‐14? 1.29 1.27 ‐0.02
(0.05) (0.04) {0.820}
Do all children in the family of ages 6‐14 go to school? 0.43 0.43 0.00
(0.02) (0.02) {0.893}
What is the education level of the female head/spouse? 3.51 3.45 ‐0.06
(0.03) (0.03) {0.432}
Do any family members have salaried employment? 0.48 0.57 0.08
(0.02) (0.02) {0.046}
Are the house's outer walls made of strong materials? 0.96 0.96 0.00
(0.01) (0.01) {0.911}
Are the houses roof made of strong materials? 0.97 0.98 0.01
(0.01) (0.00) {0.711}
Does the family own a closed toilet? 0.97 1.00 0.03
(0.01) ‐(0.01) {0.432}
Does the family own a refrigerator? 0.91 0.87 ‐0.04
(0.01) (0.01) {0.014}
How many television sets does the family own? 2.37 2.38 0.02
(0.02) (0.02) {0.788}
Does the family own a washing machine? 0.82 0.84 0.02
(0.02) (0.01) {0.492}
Number of clients 679 754 1433
Appendix Table 1: Impacts of Poverty Targeting Training on Poverty Index Components of Applicants
Brought in by Loan Officers (see Table 2 Panel B for analogous result on poverty indices)
Each row reports regression‐adjusted means (columns 1 and 2) and the treatment effect (column 3) estimated by
regressing the outcome on the treatment indicator and strata (branch‐pair) fixed effects. Standard errors (in
parentheses) are clustered at the branch level and p‐values {in brackets} are adjusted for our small number of
clusters by using randomization inference with 1,000 permutations per Young (2019). Variables here are used to
construct the poverty indices in Table 2 Panel B (see the Appendix for details on index construction).
Characteristics of microloan applicants during the first 24
23
Control Treatment Difference
Outcomes measured over the first 24 months post‐random assignment (1) (2) (3)
Panel A: Application Characteristics, Measured at Loan Officer Level
Total Number of Applications Processed over the 24‐month study period 38.80 50.51 11.71
(5.69) (9.88) {0.309}
Total Number of Applicants with High Likelihood of Poverty 0.33 0.72 0.39
(0.21) (0.29) {0.470}
Proportion of Applicants with High Likelihood of Poverty 0.01 0.01 0.01
(0.00) (0.01) {0.630}
Number of Loan Officers 15 12 27
Panel B: Poverty Indices, Measured at Applicant Level Using the 10 PPI Questions
Poverty Likelihood 0.24 0.25 0.01
(0.01) (0.01) {0.552}
PPI Score 51.20 51.42 0.22
(0.62) (0.55) {0.885}
Number of microloan approvals over the 24‐month study period 582 669 1251
Panel C: Wealth Variables Not Used in Poverty Indices, Measured at Applicant Level
Monthly Income (Inverse Hyperbolic Sine) 9.09 9.38 0.29
(0.05) (0.04) {0.008}
Total Assets (Inverse Hyperbolic Sine) 10.76 11.31 0.55
(0.10) (0.05) {0.002}
Number of Businesses 1.08 1.16 0.08
(0.01) (0.02) {0.110}
Owns Home 0.79 0.86 0.07
(0.02) (0.01) {0.072}
Standardized Index of Above 4 Variables ‐0.12 0.18 0.29
(0.04) (0.04) {0.001}
Number of microloan approvals over the 24‐month study period 582 669 1251
Each row reports regression‐adjusted means (columns 1 and 2), and the treatment effect (column 3) estimated by
regressing the outcome on the treatment indicator and strata (branch‐pair) fixed effects. Standard errors (in
parentheses) are clustered at the branch level and p‐values {in brackets} are adjusted for our small number of clusters
by using randomization inference with 1,000 permutations per Young (2019).
(Compare to Table 2 Panels A‐C, which include all applicants)
Appendix Table 2: Impacts of Poverty Targeting Training on Approved Applicants
Outcome Variable: Loan Default (1) (2) (3) (4)
PPI Score 0.0000 0.0000
(0.001) (0.001)
Poverty Likelihood 0.0684 0.0687
(0.207) (0.211)
Controlling for Credit Score N Y N Y
Number of Loans 979 979 979 979
Appendix Table 3: Empirical correlation between loan profitability & poverty scores
Each column presents results from an OLS regression of an indicator (1= loan is in default at the end of our study
period) on the variable(s) described in the rows. Standard errors clustered at the branch level reported in parentheses.
24
Appendix: Poverty Probability Index Construction
(1) How many in the family are aged 0-14?
a. 5+ (0 Points) b. 4 (4 Points) c. 3 (9 Points) d. 2 (15 Points) e. 1 (20 Points) f. 0 (26 Points)
(2) Do all children in the family of ages 6 to 14 go to school?
a. No (0 Points) b. Yes (2 Points) c. No one aged 6 to 14 (4 Points)
(3) What is the education level of the female head/spouse?
a. Elementary or less (0 Points) b. First to fourth year secondary (3 Points) c. Graduate Secondary (6 Points) d. First year college or higher (11 Points) e. No female head (11 Points)
(4) Do any family members have salaried employment?
a. No (0 Points) b. Yes (5 Points)
(5) What are the house’s outer walls made of?;
a. Light Materials (0 Points) b. Strong Materials (4 Points)
(6) What is the house’s roof made of?;
a. Light Materials (0 Points) b. Strong Materials (2 Points)
(7) What kind of toilet facility does the family own?;
a. None, pit, other (0 Points) b. Water Sealed (7 Points)
25
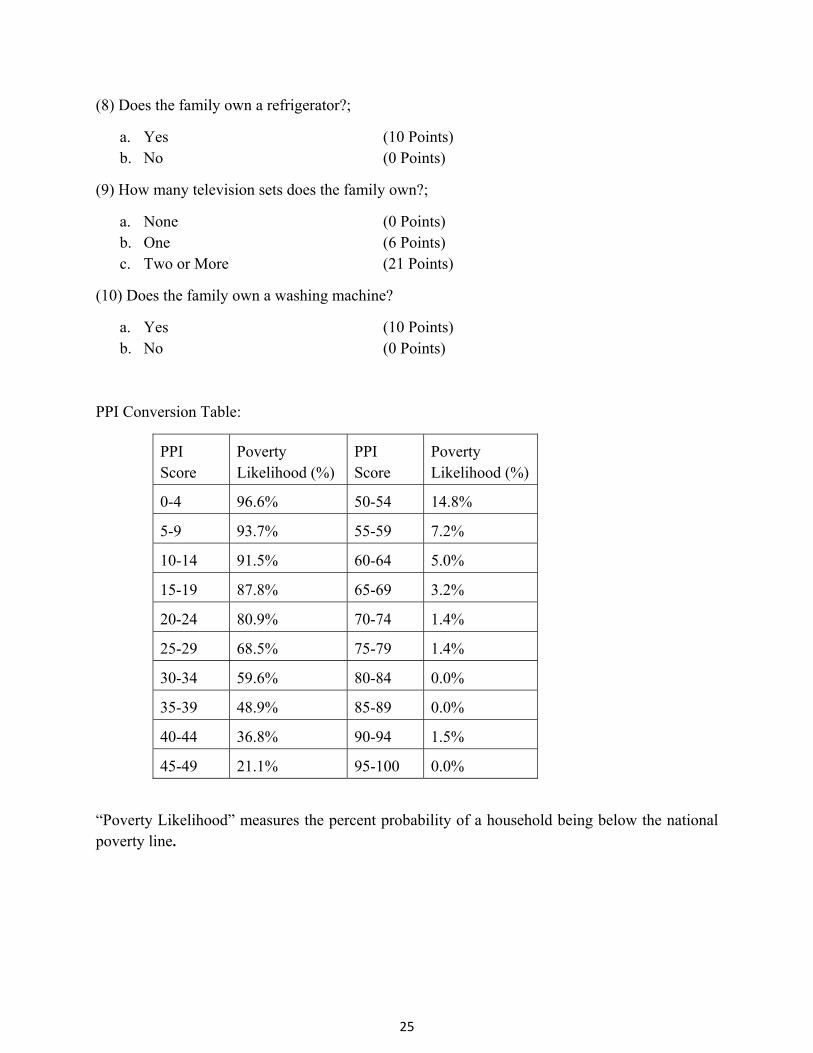
(8) Does the family own a refrigerator?;
a. Yes (10 Points) b. No (0 Points)
(9) How many television sets does the family own?;
a. None (0 Points) b. One (6 Points) c. Two or More (21 Points)
(10) Does the family own a washing machine?
a. Yes (10 Points) b. No (0 Points)
PPI Conversion Table:
PPI Score
Poverty Likelihood (%)
PPI Score
Poverty Likelihood (%)
0-4 96.6% 50-54 14.8%
5-9 93.7% 55-59 7.2%
10-14 91.5% 60-64 5.0%
15-19 87.8% 65-69 3.2%
20-24 80.9% 70-74 1.4%
25-29 68.5% 75-79 1.4%
30-34 59.6% 80-84 0.0%
35-39 48.9% 85-89 0.0%
40-44 36.8% 90-94 1.5%
45-49 21.1% 95-100 0.0%
“Poverty Likelihood” measures the percent probability of a household being below the national poverty line.


![DANGERS TO THE SOUL. 2 EMOTIONAL DANGERS [CONCERNS/ATTITUDES]](https://img.pdfslide.net/doc/110x75/5a4d1ad17f8b9ab0599717e6/dangers-to-the-soul-2-emotional-dangers-concernsattitudes.jpg)