Embed Size (px)
Citation preview
Draft — 2017 February 16Preprint typeset using LATEX style AASTeX6 v. 1.0
THE COMPLETE CALIBRATION OF THE COLOR-REDSHIFT RELATION (C3R2) SURVEY:SURVEY OVERVIEW AND DATA RELEASE 1
DANIEL C. MASTERS1 , DANIEL K. STERN2 , JUDITH G. COHEN3 , PETER L. CAPAK4 ,JASON D. RHODES2,7 , FRANCISCO J. CASTANDER5 , STEPHANE PALTANI6
1Infrared Processing and Analysis Center, Pasadena, CA 91125, USA2Jet Propulsion Laboratory, California Institute of Technology, Pasadena, CA 91109, USA3California Institute of Technology, Pasadena, CA 91125, USA4Spitzer Science Center, Pasadena, CA 91125, USA5Institut de Ciencies de lEspai (ICE, IEEC/CSIC), E-08193 Bellaterra (Barcelona), Spain6Department of Astronomy, University of Geneva, Ch. dEcogia 16, 1290 Versoix, Switzerland7Kavli Institute for the Physics and Mathematics of the Universe, University of Tokyo, Chiba 277-8582, Japan
ABSTRACTA key goal of the Stage IV dark energy experiments Euclid, LSST and WFIRST is to measure the growth ofstructure with cosmic time from weak lensing analysis over large regions of the sky. Weak lensing cosmologywill be challenging: in addition to highly accurate galaxy shape measurements, statistically robust and accuratephotometric redshift (photo-z) estimates for billions of faint galaxies will be needed in order to reconstructthe three-dimensional matter distribution. Here we present an overview of and initial results from the Com-plete Calibration of the Color-Redshift Relation (C3R2) survey, designed specifically to calibrate the empiricalgalaxy color-redshift relation to the Euclid depth. These redshifts will also be important for the calibrations ofLSST and WFIRST. The C3R2 survey is obtaining multiplexed observations with Keck (DEIMOS, LRIS, andMOSFIRE), the Gran Telescopio Canarias (GTC; OSIRIS), and the Very Large Telescope (VLT; FORS2 andKMOS) of a targeted sample of galaxies most important for the redshift calibration. We focus spectroscopicefforts on under-sampled regions of galaxy color space identified in previous work in order to minimize thenumber of spectroscopic redshifts needed to map the color-redshift relation to the required accuracy. Here wepresent the C3R2 survey strategy and initial results, including the 1283 high confidence redshifts obtained inthe 2016A semester and released as Data Release 1.Keywords: galaxies — surveys: spectroscopic
1. INTRODUCTION
The upcoming large-scale cosmology experiments Euclid(Laureijs et al. 2011), LSST (Ivezic et al. 2008) and WFIRST(Spergel et al. 2015) will depend on robust photometric red-shift (photo-z) estimates for billions of faint galaxies in orderto obtain a three-dimensional picture of the growth of cos-mic structure. Small (&0.2%) redshift biases can easily dom-inate the overall error budget in the cosmological parametersmeasured by these surveys (e.g., Huterer et al. 2006). Spec-troscopic calibration efforts for these missions must there-fore measure the color-redshift relation of galaxies with suffi-cient fidelity to reconstruct the redshift distributions of shearsamples with negligible systematic bias. While photomet-ric redshift estimation techniques have grown in sophistica-tion and precision over the past few decades (e.g., Benıtez2000; Brammer et al. 2008; Ilbert et al. 2009; Carrasco Kind& Brunner 2013; Speagle et al. 2016), existing methods havenot met the photo-z accuracy requirements set by weak lens-ing cosmology.
The relation of seven or eight galaxy broadband colors(referred to henceforth by the vector C) to redshift is ulti-mately an empirical question. In Masters et al. (2015) (here-
after M15) we demonstrated a method, based on the self-organizing map (SOM; Kohonen 1990) algorithm, to con-strain the empirical multidimensional color distribution ofgalaxies present in a survey. This technique allowed us toproject the multicolor distribution of galaxies in a topolog-ically ordered way onto a two-dimensional grid. By ap-plying this technique to a well-studied deep field with uni-form ugrizYJH photometry, we were able to demonstratethat spectroscopic surveys to date do not sample the fullcolor-space of galaxies in a Euclid-like survey, and thusthe color-redshift relation is not fully constrained with ex-isting spectroscopy. This issue is of particular concern formachine learning-based photo-z estimation, which requirescolor-complete training samples, but also affects the calibra-tion of template-based techniques.
The analysis in M15 motivated a survey designed to sys-tematically map the color-redshift relation over the currentlyundersampled regions of galaxy color space relevant to Eu-clid. M15 estimated that ∼5000 new redshifts, carefully dis-tributed in color space, would be sufficient to meet the strin-gent requirements for weak lensing cosmology. This “di-rect” approach to photo-z calibration is complementary toapproaches based on spatial cross-correlation of photomet-
arX
iv:1
704.
0666
5v1
[as
tro-
ph.C
O]
21
Apr
201
7
2
ric samples with spectroscopic samples (e.g., Newman 2008;Rahman et al. 2015. At least two independent methods tomeasure N(z) for the tomographic shear samples will be re-quired to ensure no systematic photo-z biases exist; thesemethods can therefore serve as useful checks on each other.
Here we describe the initial stage of what we are calling theComplete Calibration of the Color-Redshift Relation (C3R2)survey, designed to fill out the color space of galaxies with se-cure redshifts to the Euclid weak lensing depth. By doing so,the empirical P(z |C) relation obeyed by galaxies can be con-strained with sufficient accuracy to meet the cosmological re-quirements of Euclid. The spectra will also be of significantvalue for the LSST and WFIRST calibrations, which will bemore difficult than for Euclid due to the greater photometricdepth of those surveys (Hemmati et al, 2017, in prep). Weestimate that ∼40 Keck nights in total (or their equivalent)could achieve the fidelity required to meet the cosmologicalrequirements for Euclid, when combined with extensive ex-isting spectroscopy.
This paper gives an overview of the C3R2 survey andpresents results from the 2016A semester, which constitutedthe first five nights of observing. All 2016A observationswere done with Keck. The structure of this paper is as fol-lows. In §2 we give an overview of C3R2 survey strategy. In§3 we discuss the observations and data reduction for the firstfive nights of observing. In §4 we describe redshift determi-nation and the identification of serendipitous sources. In §5we present initial results from the survey. In §6 we concludewith a discussion. High confidence redshifts from DR1 areprovided in a machine readable table.
2. C3R2 SURVEY OVERVIEW
The Keck portion of the C3R2 survey is a joint effort be-tween Caltech (PI: J. Cohen), NASA (PI: D. Stern), the Uni-versity of California (PI: B. Mobasher), the University ofHawaii (PI: D. Sanders). European participation in C3R2with the GTC (PI: C. Gutierrez) and VLT (PI: F. Castander),as well as Harvard participation with MMT (PI: D. Eisen-stein), will commence in 2017. The first five nights of ob-serving with Keck were allocated by Caltech in the 2016Asemester. Here we provide a brief overview of the C3R2strategy for these observations.
2.1. The Self-Organized Map of Galaxy Colors
In M15 we used COSMOS (Capak et al. 2007; Scov-ille et al. 2007; Laigle et al. 2016) ugrizYJH photometry of∼130k galaxies, closely resembling what will be obtained bythe Euclid survey, to map the color distribution of galaxies tothe Euclid depth (i∼24.5 AB). We used the SOM algorithm(a manifold learning technique for nonlinear dimensionalityreduction) to generate a topologically ordered 2D represen-tation of the high-dimensional color distribution1. Galaxies
1 The SOM algorithm was used mainly for its relative simplicity and visu-alization power; however, any technique that manages to quantify the densityof galaxies in multicolor space would be equally appropriate. A number ofother techniques for nonlinear dimensionality reduction (e.g., the generativetopographic map, growing neural gas, and local linear embedding) may, inprinciple, offer some advantages over the SOM.
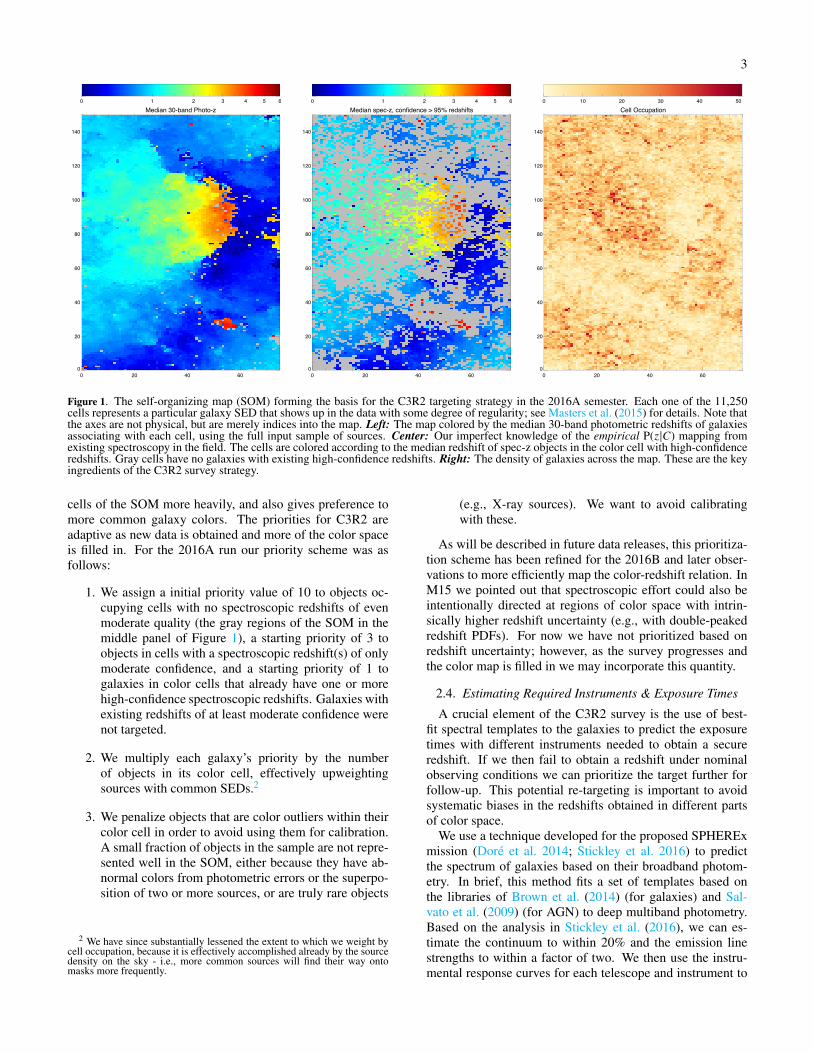
from COSMOS were then matched back to the self-organizedmap according to their best-matching color cell in the SOM.This sorting of galaxies enables a variety of analyses, includ-ing the density of galaxies in different parts of color space,the median 30-band photometric redshifts from COSMOS asa function of position in color space, and the distribution ofspectroscopic redshifts on the map (Figure 1). Importantly,by placing all existing spectroscopy from the COSMOS fieldon the map, we reveal regions of color space for which nogalaxies have existing high-confidence redshifts. Of greatestimportance for the C3R2 survey are: (1) the current spectro-scopic sampling across color space, and (2) the source den-sity as a function of position in color space, as more commongalaxies will contribute more to the cosmic shear signal.
2.2. Existing Spectroscopy Across Galaxy Color Space
For C3R2 we need to identify the regions of galaxy colorspace for which spectroscopic redshifts already exist andwhere they are systematically missing. We collected existingspectroscopy in COSMOS to do this, as described in M15.These redshifts include (but are not limited to) those fromVLT-VIMOS (Lilly et al. 2007; Le Fevre et al. 2015), Keck-MOSFIRE (Kriek et al. 2014), Keck-DEIMOS (Kartaltepeet al. 2010), and Magellan-IMACS (Trump et al. 2007). Forthe 2016A run we used only the spectroscopy taken in theCOSMOS survey to identify undersampled regions of colorspace. The reason we could not incorporate spectroscopyfrom other fields for these observations is that the photom-etry between fields has to be highly consistent in multiplebands to reliably place galaxies on the same color map; atthe time this problem had not been solved. Significant subse-quent work has been done to solve this problem for upcom-ing runs, to be described in a forthcoming paper. The fieldsthat have subsequently been put on a highly consistent colorframe in ugrizYJH to the Euclid depth are VVDS, SXDS, andEGS (in addition to COSMOS).
2.3. Target Prioritization
For the 2016A observations we used the SOM derived inM15 to prioritize regions of galaxy multicolor space that arecurrently undersampled by existing spectroscopic surveys.For observed fields in 2016A other than COSMOS (SXDSand EGS), we attempted to bring the photometry on to theCOSMOS color system in order to select the targets in a con-sistent way. We used the CANDELS (Grogin et al. 2011)photometry in a subset of the COSMOS field together withthe CANDELS photometry in SXDS and EGS to derive arough color conversion between the fields.
Target prioritization for C3R2 is based on two main fac-tors: (1) the usefulness of a galaxy for calibrating the P(z |C)relation, and (2) the likelihood of obtaining a secure redshiftgiven the instrument, exposure time, and expected galaxyproperties. The usefulness of a particular galaxy to the red-shift calibration effort depends both on how common its col-ors are in the data and whether high-confidence redshifts forgalaxies with similar colors already exist.
Based on these considerations, we developed a prioritiza-tion scheme for galaxies that weights sources in unsampled
3
Median 30-band Photo-z
0 20 40 600
20
40
60
80
100
120
140
0 1 2 3 4 5 6Median spec-z, confidence > 95% redshifts
0 20 40 600
20
40
60
80
100
120
140
0 1 2 3 4 5 6Cell Occupation
0 20 40 600
20
40
60
80
100
120
140
0 10 20 30 40 50
Figure 1. The self-organizing map (SOM) forming the basis for the C3R2 targeting strategy in the 2016A semester. Each one of the 11,250cells represents a particular galaxy SED that shows up in the data with some degree of regularity; see Masters et al. (2015) for details. Note thatthe axes are not physical, but are merely indices into the map. Left: The map colored by the median 30-band photometric redshifts of galaxiesassociating with each cell, using the full input sample of sources. Center: Our imperfect knowledge of the empirical P(z |C) mapping fromexisting spectroscopy in the field. The cells are colored according to the median redshift of spec-z objects in the color cell with high-confidenceredshifts. Gray cells have no galaxies with existing high-confidence redshifts. Right: The density of galaxies across the map. These are the keyingredients of the C3R2 survey strategy.
cells of the SOM more heavily, and also gives preference tomore common galaxy colors. The priorities for C3R2 areadaptive as new data is obtained and more of the color spaceis filled in. For the 2016A run our priority scheme was asfollows:
1. We assign a initial priority value of 10 to objects oc-cupying cells with no spectroscopic redshifts of evenmoderate quality (the gray regions of the SOM in themiddle panel of Figure 1), a starting priority of 3 toobjects in cells with a spectroscopic redshift(s) of onlymoderate confidence, and a starting priority of 1 togalaxies in color cells that already have one or morehigh-confidence spectroscopic redshifts. Galaxies withexisting redshifts of at least moderate confidence werenot targeted.
2. We multiply each galaxy’s priority by the numberof objects in its color cell, effectively upweightingsources with common SEDs.2
3. We penalize objects that are color outliers within theircolor cell in order to avoid using them for calibration.A small fraction of objects in the sample are not repre-sented well in the SOM, either because they have ab-normal colors from photometric errors or the superpo-sition of two or more sources, or are truly rare objects
2 We have since substantially lessened the extent to which we weight bycell occupation, because it is effectively accomplished already by the sourcedensity on the sky - i.e., more common sources will find their way ontomasks more frequently.
(e.g., X-ray sources). We want to avoid calibratingwith these.
As will be described in future data releases, this prioritiza-tion scheme has been refined for the 2016B and later obser-vations to more efficiently map the color-redshift relation. InM15 we pointed out that spectroscopic effort could also beintentionally directed at regions of color space with intrin-sically higher redshift uncertainty (e.g., with double-peakedredshift PDFs). For now we have not prioritized based onredshift uncertainty; however, as the survey progresses andthe color map is filled in we may incorporate this quantity.
2.4. Estimating Required Instruments & Exposure Times
A crucial element of the C3R2 survey is the use of best-fit spectral templates to the galaxies to predict the exposuretimes with different instruments needed to obtain a secureredshift. If we then fail to obtain a redshift under nominalobserving conditions we can prioritize the target further forfollow-up. This potential re-targeting is important to avoidsystematic biases in the redshifts obtained in different partsof color space.
We use a technique developed for the proposed SPHERExmission (Dore et al. 2014; Stickley et al. 2016) to predictthe spectrum of galaxies based on their broadband photom-etry. In brief, this method fits a set of templates based onthe libraries of Brown et al. (2014) (for galaxies) and Sal-vato et al. (2009) (for AGN) to deep multiband photometry.Based on the analysis in Stickley et al. (2016), we can es-timate the continuum to within 20% and the emission linestrengths to within a factor of two. We then use the instru-mental response curves for each telescope and instrument to
4
estimate the required integration time to obtain a redshift tothat galaxy, given its estimated photometric redshift. Pri-mary objects for a mask are those expected to yield a red-shift within a factor of two of the intended mask integration
time. The time estimates were compared with previous ob-servations to verify their accuracy. As described in §4.2, weuse a flagging scheme to keep track of objects for which aredshift was expected but not obtained. These sources canthen be prioritized for additional observations.
Table 1. List of observing nights.
UT Date Code Instrument # Masks Observing conditions
2015 Dec 15 N01-D DEIMOS 4 clear, 0.′′65 seeing2016 Feb 28 N02-M MOSFIRE 6 clear, 0.′′5-0.′′65 seeing2016 Feb 29 N03-D DEIMOS 4 clear, 0.′′65 seeing; moon2016 Mar 01 N04-D DEIMOS 7 clear, 1.′′0 seeing; moon2016 Apr 09 N05-L LRIS 4 thin cirrus, 0.′′97 seeing
3. OBSERVATIONS AND DATA REDUCTIONS
Five nights were allocated by Caltech in the 2016Asemester: three nights on DEIMOS (Faber et al. 2003), andone night each with LRIS (Oke et al. 1995) and MOSFIRE(McLean et al. 2012). Tables 1 and 2 summarize the nightsand observed slitmasks. All five nights had excellent observ-ing conditions. Here we describe the observations and datareduction.
3.1. DEIMOS
DEIMOS observations were conducted using the600 groove mm−1 grating blazed at 7200 A and theGG400 blocking filter, with dithering performed to improvesky subtraction. In the initial observing run, we experi-mented with minimum slit lengths of both 6′′ and 10′′, withno significant difference in redshift success rate. In thesubsequent DEIMOS observations we settled on a minimumslit width of 8′′ as a balance between getting the most targetspossible on the mask and getting good sky measurements.Data were reduced using a modified version of the DEEP2pipeline designed to deal with dithered data.
3.2. LRIS
We used the 400 groove mm−1 blue grism blazed at 3400 Aand the 400 groove mm−1 red grating blazed at 8500 A, withthe D560 dichroic. Our choice of blue grism gives high sen-sitivity at bluer wavelengths where identifying features arelikely to be found for objects with photometric redshifts ofz ∼ 1.5 − 3, while the red coverage allows for the detectionof [O II] for some sources out to z ∼ 1.6. The LRIS spectrawere reduced using the IRAF-based BOGUS software devel-oped by D. Stern, S. A. Stanford, and A. Bunker, and flux cal-ibrated using observations of standard stars from Massey &Gronwall (1990) observed on the same night using the sameinstrument configuration.
3.3. MOSFIRE
MOSFIRE was used in its default configuration. For in-strumental details we refer the reader to Steidel et al. (2014).We observed four masks in Y band and two in K band, usingintegration times of 180s with ABAB dithering to improvesky subtraction. Reductions were performed with the MOS-FIRE Data Reduction Pipeline (DRP) made available by theinstrument team3.
4. REDSHIFT DETERMINATION
Each observed source was assessed independently by twoco-authors to determine the redshift and associated qualityflag. These results were then compared for conflicts in eitherredshift or quality flag. Conflicts were reconciled througha joint review of the spectra, usually with the help of athird, independent reviewer. As a final step in the process,we investigated all Q=4 (highest quality, see §4.1) sourcesfor which the spectroscopic redshift (zs) was highly dis-crepant from the expected photometric redshift (zp , definedas the median photometric redshift of sources in the relevantSOM cell). Specifically, we investigated all sources with|zp − zs |/(1 + zs) ≥ 0.15. For most of these outliers, thespectroscopic redshift was deemed solid and we discuss thenature of the discrepancy in more detail in § 5.2. However,for two cases, this step caused us to modify the final redshiftassessment. One of these final modifications was due to con-fusing a target and very close (∼ 1′′ separation) serendipitoussource, while the other modification was due to a genuine er-ror in line identification aggravated by incomplete sky-linesubtraction mimicking a corroborating emission line.
4.1. Quality Flags
The redshift flagging scheme we use is similar to thatadopted by the zCOSMOS (Lilly et al. 2007), DEEP2 (New-man et al. 2013), and VUDS surveys (Le Fevre et al. 2015).The quality flags range from 0-4 with 4 indicating the highestconfidence redshift and 0 indicating that no redshift could befound. The interpretation of the flags is roughly as follows:
5
0.70 0.75 0.80 0.85 0.90
0.0
0.5
1.0
1.5
2.0COSMOS−626946
z = 1.2199, Qflag = 3DEIMOS
0.650.700.750.800.850.900.95
i [OII]λ3727
0.60 0.65 0.70 0.75 0.80 0.85 0.90
0.0
0.5
1.0
1.5COSMOS−611377
z = 0.9265, Qflag = 3)
DEIMOS
0.60.70.80.9
[OII]λ3727
i
2.10 2.15 2.20 2.25 2.30 2.35
0.0
0.5
1.0
1.5COSMOS−1034277
z = 2.4201, Qflag = 3.5 mag = 23.4 (AB)
MOSFIRE
2.102.152.202.252.302.352.40
KHα
1.93 1.94 1.95 1.96 1.97−0.2
0.0
0.2
0.4
0.6
0.8COSMOS−215105
z = 1.9440, Qflag = 3.5 mag = 23.6 (AB)
MOSFIRE
1.921.931.941.951.961.971.98
K
Hα
0.65 0.70 0.75 0.80 0.85 0.90 0.95
0.0
0.5
1.0
1.5
2.0
2.5
3.0COSMOS−625639
z = 0.8238, Qflag = 4DEIMOS
0.60.70.80.91.0
i
[OII]λ3727[OIII]λλ4959,5007
0.86 0.87 0.88 0.89 0.90 0.91−0.5
0.0
0.5
1.0
1.5
2.0
2.5COSMOS−637088
z = 1.3605, Qflag = 4DEIMOS
0.840.860.880.900.92
[OII]λλ3726,3729
i
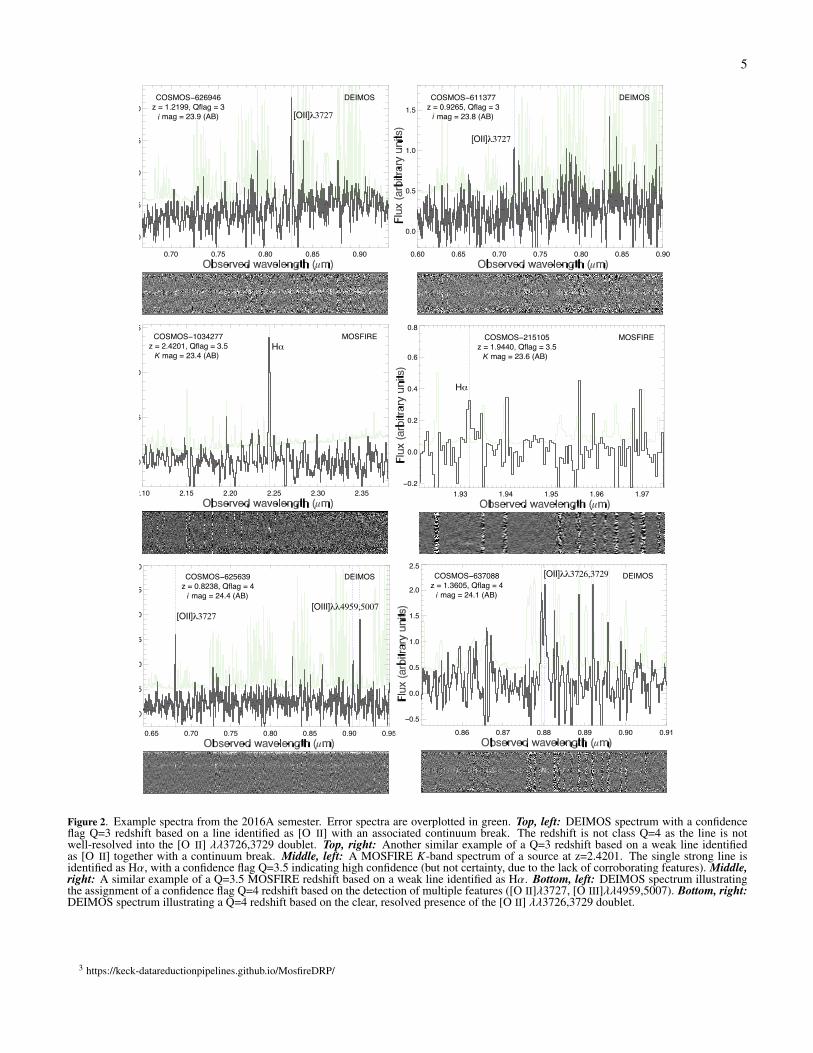
Figure 2. Example spectra from the 2016A semester. Error spectra are overplotted in green. Top, left: DEIMOS spectrum with a confidenceflag Q=3 redshift based on a line identified as [O II] with an associated continuum break. The redshift is not class Q=4 as the line is notwell-resolved into the [O II] λλ3726,3729 doublet. Top, right: Another similar example of a Q=3 redshift based on a weak line identifiedas [O II] together with a continuum break. Middle, left: A MOSFIRE K-band spectrum of a source at z=2.4201. The single strong line isidentified as Hα, with a confidence flag Q=3.5 indicating high confidence (but not certainty, due to the lack of corroborating features). Middle,right: A similar example of a Q=3.5 MOSFIRE redshift based on a weak line identified as Hα. Bottom, left: DEIMOS spectrum illustratingthe assignment of a confidence flag Q=4 redshift based on the detection of multiple features ([O II]λ3727, [O III]λλ4959,5007). Bottom, right:DEIMOS spectrum illustrating a Q=4 redshift based on the clear, resolved presence of the [O II] λλ3726,3729 doublet.
3 https://keck-datareductionpipelines.github.io/MosfireDRP/

6
Table 2. List of observed slitmasks.
R.A. Dec. PA Exposure # TargetsMask ID / Name Night (J2000) (J2000) (o) (s) (total / Q=4 / ser)
16A-D01 / UDS-m1n1 N01-D 2:17:27.0 −5:15:07 90.0 2×1800 86 / 51 / 516A-D02 / UDS-m3n1 N01-D 2:17:27.0 −5:14:07 90.0 2×1800 100 / 66 / 516A-D03 / COSMOS-m3n1 N01-D 10:00:22.0 +2:20:00 90.0 4×1800 104 / 72 / 716A-D04 / COSMOS-m4n1 N01-D 10:00:22.0 +2:35:00 90.0 4×1800 70 / 60 / 1916A-M05 / COSMOS-m1-Y N02-M 10:00:57.2 +1:48:40 85.0 20×180 24 / 8 / 116A-M06 / COSMOS-m2-Y N02-M 10:00:54.4 +2:01:47 55.0 20×180 29 / 3 / 016A-M07 / COSMOS-m3-Y N02-M 10:00:57.7 +2:14:38 40.0 20×180 24 / 5 / 116A-M08 / COSMOS-m1-K N02-M 10:00:10.5 +2:14:20 30.0 20×180 12 / 5 / 016A-M09 / COSMOS-m4-Y N02-M 10:00:14.2 +2:03:34 30.0 16×180 25 / 6 / 116A-M10 / EGS-m1-K N02-M 14:17:57.4 +52:35:51 25.0 22×180 23 / 3 / 016A-D11 / COSMOS-m1n2 N03-D 9:58:43.2 +1:42:00 90.0 3×1200 93 / 62 / 216A-D12 / COSMOS-m8n2 N03-D 9:58:43.3 +2:12:47 90.0 6×1200 92 / 56 / 1716A-D13 / COSMOS-m2n2 N03-D 9:58:43.2 +1:46:15 90.0 3×1200 91 / 77 / 716A-D14 / COSMOS-m9n2 N03-D 9:58:43.2 +2:17:00 90.0 6×1200 99 / 64 / 316A-D16 / COSMOS-m3n2 N04-D 9:58:43.2 +1:50:24 90.0 3×1200 89 / 43 / 416A-D17 / COSMOS-m4n2 N04-D 9:58:43.2 +1:54:36 90.0 3×1200 95 / 70 / 416A-D18 / COSMOS-m7n2 N04-D 9:58:43.2 +2:08:15 90.0 6×1200 91 / 52 / 1316A-D19 / COSMOS-m6n2 N04-D 9:58:43.2 +2:04:16 90.0 4×1200 94 / 72 / 916A-D20 / COSMOS-m5n2 N04-D 9:58:43.2 +1:58:48 90.0 3×1200 98 / 80 / 316A-D21 / EGS-m1n2 N04-D 14:18:00.0 +52:33:00 90.0 3×1200 100 / 62 / 1016A-D22 / EGS-m2n2 N04-D 14:18:00.0 +52:41:24 90.0 3×1200 104 / 72 / 316A-L23 / COSMOS-m1n5 N05-L 9:59:44.1 +2:36:12 −60.0 4×1200 25 / 3 / 116A-L24 / COSMOS-m3n5 N05-L 9:58:58.7 +2:45:56 −110.0 2×1200 18 / 8 / 016A-L25 / EGS-m1n5 N05-L 14:19:08.6 +52:28:48 0.0 5×1200 28 / 11 / 016A-L26 / EGS-m2n5 N05-L 14:18:04.8 +52:42:01 0.0 5×1200 26 / 4 / 1
NOTE—‘Night’ column refers to observing code in second column of Table 1: night number, followed by letterindicating instrument used (D – DEIMOS, L – LRIS, M – MOSFIRE). R.A. and Dec. refer to the mask center.Final column gives total number of slitlets in mask (ignoring those with failure code −93/−94 as described in§4.2), total number of high-quality (Q=4) redshifts measured, and the number of serendipitous sources with high-quality redshifts (quality flag Q = 4).
• Q=4: A quality flag of 4 indicates an unambiguous red-shift identified with multiple features or the presenceof the split [O II] λλ3726,3729 doublet.
• Q=3.5: A quality flag of 3.5 indicates a high-confidence redshift based on a single line, with a veryremote possibility of an incorrect identification. Anexample might be a strong, isolated emission line iden-tified as Hα, where other identifications of the line arehighly improbable due to the lack of associated lines orcontinuum breaks. This flag is typically only adoptedfor LRIS and MOSFIRE spectra.
• Q=3: A quality flag of 3 indicates a high-confidenceredshift with a low probability of an incorrect identifi-cation. An example might be the low signal-to-noise
ratio detection of an emission line, possibly corruptedby telluric emission or absorption, identified as [O II]λλ3726,3729, but where the data quality is insufficientto clearly resolve the doublet.
• Q=2/1: A quality flag of 2 indicates a reasonable guess,while a quality flag of 1 indicates a highly uncertainguess. Sources with these low confidence redshifts arenot included in the data release.
• Q=0: A quality flag of 0 indicates that no redshift couldbe identified. As described next, a code indicating thecause of the redshift failure is assigned in place of theredshift.
Figure 2 shows C3R2 spectra from 2016A as examples ofQ=3, Q=3.5, and Q=4 redshift assignments.

7
19 20 21 22 23 24 25i-band magnitude (AB)
0
100
200
300
400N
umbe
r of s
ourc
es
0 1 2 3 4Redshift
0
50
100
150
200
Num
ber o
f sou
rces
Figure 3. Left: The i-band magnitude distribution of C3R2-targeted sources yielding Q=4 redshifts (blue) and Q=3/3.5 redshifts (yellow) in the2016A semester (1,283 sources total). The majority are fainter than i = 23 (AB). Right: The redshift distribution of the same samples.
4.2. Failure Codes
It is important for C3R2 to track redshift failures, as wellas the reasons for the failures, in order to avoid systematicbiases in the sources selected for calibration. Failed targetsthat were expected to yield a redshift given the instrumentand exposure time can be prioritized for additional follow-up.On the other hand, if no spectroscopic redshift was obtainedbecause of a problem with the observing conditions or data(i.e., bad rows, or the target ended up in a region between twodetector arrays), no additional prioritization of that sourcemay be needed.
With these considerations in mind, we developed a systemto flag different “failure modes” for objects not yielding aredshift. Four categories of failures are used, with the corre-sponding code assigned in place of a redshift in our catalog.The failure modes we identify are:
1. Code = −91: Object too faint to identify the redshift.Indicates that a deeper exposure and/or different in-strument and/or different wavelength coverage is re-quired to obtain a secure redshift. An example of sucha source might be a galaxy expected to have a strong[O II] emission line at 9800 A, but where the slit place-ment caused the wavelength coverage to end at 9500A, yielding a continuum detection without any strongspectroscopic features. These sources will be furtherprioritized in future observations.
2. Code = −92: Object well-detected, but no redshiftcould be determined. May require a different instru-ment for secure redshift determination due to an incor-rect photometric redshift or the wavelength coverageobtained for a given observation. We emphasize thatthe dividing line between −91 and −92 failure codes isimprecise, and no strong effort was made to homoge-nize the classification. Fundamentally, both codes canbe considered as two aspects of the same issue. Again,
these sources will increase in priority going forward.
3. Code = −93: Corrupted slit, typically due to badrows/columns in the data or the source falling on ornear detector chip gaps. Does not affect object priorityin future observations.
4. Code = −94: Missing slit, as an extreme case of code−93. Does not affect object priority in future observa-tions.
Failure codes −91 and −92 essentially correspond to spectralquality issues (i.e., signal-to-noise ratio, wavelength range),while codes −93 and −94 correspond to data quality issues(i.e., slitmask design issues, detector issues). While in DR1we distinguished between these four failure modes, for manyanalysis purposes, considering just the two general categorieswill be sufficient.
Failure code −91, the most common failure code, gener-ally indicates that the signal-to-noise ratio of the data wasinsufficient for redshift determination. Indeed, consideringthe 131 DEIMOS-observed sources in COSMOS with thisfailure code, 122 (93%) were anticipated to fail based on ourestimated exposure time needed to get a redshift. As withlow-confidence redshifts, sources for which we failed to finda redshift are not included in this data release.
4.3. Serendipitous Sources
We measured the redshifts of 134 serendipitously detectedsources that happened to fall in slits with primary C3R2 tar-gets. The coordinates of these sources were identified andthey were matched back to the survey catalogs. The redshiftsfor these sources are included in our published catalog.
4.4. Literature sources
Some (unintentional) overlap with literature redshifts al-lows a check on our results. In COSMOS and EGS we ob-served 38 sources that have previously existing high-quality

8
Figure 4. Top: Comparison of the photometric redshift predicted bythe SOM with the measured Q=4 C3R2 redshifts. We define theSOM photo-z of an object to be the median of the photo-z’s for allobjects that best associate with its particular SOM color cell. Ascan be seen, the SOM photo-z estimates are mostly unbiased, witha small outlier fraction (∼3.8%, where outliers are defined as red-shift errors ≥15%, indicated by the thin dashed lines). Bottom: Thedistribution of (zp − zs)/(1 + zs) for the Q=4 sample. Overplottedis a Gaussian with σ = 0.027, equal to the measured σNMAD.
redshifts. Most (24) were serendipitous detections. We findan RMS discrepancy between our redshifts and the literaturevalues of 4× 10⁻⁴. C3R2 redshifts are often higher precisionthan the literature values, which likely explains this small dif-ference. There is no systematic difference between the C3R2and literature redshifts.
5. REDSHIFT RESULTS AND CALIBRATIONPROGRESS
A total of 1825 sources were targeted in the 2016A ob-servations. We identified 1131 Q=4 redshifts, 27 Q=3.5 red-shifts, and 125 Q=3 redshifts. In principle, only the highestconfidence redshifts would be used for calibration for cos-mology; whether this restricts usable sources to those withQ=4 is worth investigating. Another 99 spectra yielded red-
shifts of low confidence (Q=1/2), while there were 443 fail-ures. Of these, 409 were failure code −91 or −92, indicatingthat the source was too faint or lacking in identifying fea-tures, while 34 were code −93 or −94, indicating a corruptedor missing slit.
In terms of the SOM presented in M15, and using only theC3R2 sources observed in COSMOS with Q ≥ 3 for this anal-ysis (911 redshifts), we have increased color space coverageby 5.4%. Figure 3 shows the i-band magnitude distributionand redshift distribution of the 2016A “gold” sample of Q=4sources as well as the Q=3/3.5 sources. The distributions arevery similar to the overall distribution of the unsampled cellsof galaxy color space identified in M15, indicating that weare targeting the correct sources.
5.1. SOM-based photo-z performance
The self-organizing map colored by the median photo-zof sources per cell (the left panel of Figure 1) effectively de-fines a photometric redshift estimate for each galaxy based onits position in the ugrizYJH color space of Euclid/WFIRST.Figure 4 compares our Q=4 spectroscopic redshifts with theredshift that would be inferred based on the SOM, with en-couraging results. The normalized median absolute deviation(a dispersion measure which is not sensitive to catastrophicoutliers (Ilbert et al. 2009; Dahlen et al. 2013)) defined as
σNMAD = 1.48 ×median( |zp − zs |
1 + zs
)(1)
is 0.027 (2.7%) for the sample, which is quite low.Using the standard definition of catastrophic photo-z out-
liers as those with |zp − zs |/(1 + zs) ≥ 0.15, we measure alow outlier fraction of 3.8%. The measured bias, defined as
mean( zp − zs
1 + zs
)(2)
is .0.1% after removing the catastrophic outliers. Furtherimprovements to these results will result from folding in allspectroscopic information from C3R2 and other surveys tothe P(z |C) relation encoded by the SOM. Notably, these re-sults are already competitive with or better than the photo-zresults of codes tested in Dahlen et al. (2013), where the pho-tometry used comprised 14 bands including full depth CAN-DELS and Spitzer data.
While the performance we find is quite good, and may berepresentative of what can be achieved with a survey such asEuclid or WFIRST, the results depend on the depth and stabil-ity of the photometry. The photometry used to place objectson the SOM in order to estimate a photo-z in the above anal-ysis is quite deep (i-band depth ∼25.4 AB). The results willdegrade as the photometry gets shallower or bands are lost ina manner that can be directly characterized via the SOM. Adetailed study of the expected performance from the SOM-based photo-z approach will be the subject of a future paper.
5.2. Outliers
Out of 1079 sources with Q=4 redshifts and reliable SOM-based photo-z estimates, only 41 (3.8%) are outliers accord-ing to the standard definition, |zp− zs |/(1+ zs) ≥ 0.15. If, in-stead of the SOM-based photo-z, we use the photo-z for each

9
Median spec-z, high-confidence redshifts
0 20 40 600
20
40
60
80
100
120
140
0 1 2 3 4 5 6Median spec-z, C3R2 2016A COSMOS spectra
0 20 40 600
20
40
60
80
100
120
140
0 1 2 3 4 5 6Median spec-z, high-confidence redshifts including C3R2
0 20 40 600
20
40
60
80
100
120
140
0 1 2 3 4 5 6
Figure 5. The SOM used as the basis for the C3R2 targeting strategy in the 2016A semester, illustrating the inclusion of the new C3R2 redshifts.Left: The SOM colored by the median spec-z in each color cell from preexisting spectroscopy from COSMOS. Gray cells have no preexistinghigh-quality redshifts. Middle: Distribution in color space of the 911 high-quality redshifts obtained by C3R2 in the 2016A semester inCOSMOS. Right: The map including the high-quality redshifts added in the COSMOS field by the 2016A C3R2 nights. An additional 5.4%of the map is measured, as well as additional constraints placed on other regions of color space. The increased density of coverage (fewer graycells) is apparent on the right compared with the left panel. Note that this map of the relation of color to redshift is not a model, but is entirelyempirical.
object based on deep multiband data (e.g., the 30-band COS-MOS data), we find an outlier fraction for the same sourcesof ∼3.1%. Thus the SOM photo-z (effectively based only onthe seven color Euclid-like SEDs) performs nearly as well interms of outlier fraction.
We have analyzed all of the outliers on a case-by-case ba-sis. The majority (24/41; 59%) have individual (rather thanSOM-based) photo-z estimates more in line with the mea-sured redshift, indicating that the color cells they belong tohave real redshift scatter. For nearly all of these sources, themeasured dispersion in the 30-band photo-z’s within the rele-vant color cell is significantly larger than the median redshiftdispersion per cell; in other words, these are sources that fallin more degenerate regions of the color space. The SOM canbe used to identify these regions in a consistent way in orderto either reject them in weak lensing analysis or direct extraspectroscopy at them to characterize the redshift distributionin those cells.
In addition, there are several other examples easily under-stood as Galactic stars (3) or obvious quasars/active galax-ies (2), which are known not to have typical galaxy colors(total = 5/41; 12%). This process caught one mistaken lineidentification where our initial assessment of a MOSFIREspectrum identified an isolated, narrow, strong line as [O III]λ5007 with corroborating [O III] λ4959 emission. Subse-quent analysis reveals the latter emission line to be due topoorly subtracted telluric emission, and we now identify thestrong emission line as Hα (Q=3.5). The remaining cases
seem to be genuine mismatches between the spectroscopicredshift and the photometric redshifts, both the individualphotometric redshift of the galaxy and the SOM-based photo-metric redshift. Consideration of Hubble imaging reveals atleast some of these likely due to two close-separation galax-ies, where the ground-based imaging used for the photometrywas unable to separate the sources.
5.3. Increased color space coverage
The five nights of observing in 2016A filled in ∼6% ofthe map, in addition to existing spectroscopy which alreadyfilled ∼50% (see Figure 5). Thus we completed &10% of therequired calibration. However, some of the remaining ob-servations may prove more challenging. Given the recentprogress on bringing multiple deep fields (and their spec-troscopy) onto a consistent color system, the requirementsmay also change to some extent, in the sense that somewhatfewer spectra are required due to the inclusion of other spec-troscopic surveys.
It should also be noted that a certain fraction of the remain-ing cells represent faint, red sources for which spectroscopicredshifts are prohibitively difficult to obtain with current in-struments. These constitute a small (∼3%) fraction of theunsampled cells. If needed, the SOM provides a consistentmethod of identifying such objects and removing them fromthe weak lensing sample.
10
Table 3. Spectroscopic results.
ID R.A. Dec. Mask Slit # I (AB) z Qual.
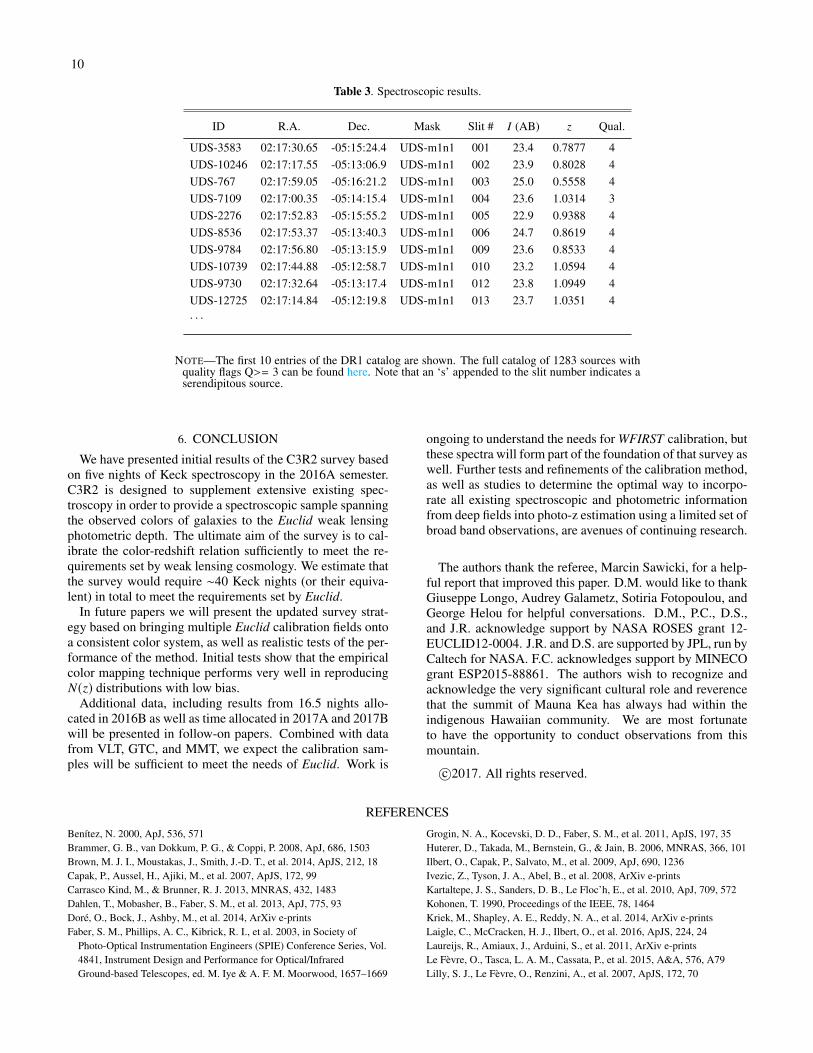
UDS-3583 02:17:30.65 -05:15:24.4 UDS-m1n1 001 23.4 0.7877 4UDS-10246 02:17:17.55 -05:13:06.9 UDS-m1n1 002 23.9 0.8028 4UDS-767 02:17:59.05 -05:16:21.2 UDS-m1n1 003 25.0 0.5558 4UDS-7109 02:17:00.35 -05:14:15.4 UDS-m1n1 004 23.6 1.0314 3UDS-2276 02:17:52.83 -05:15:55.2 UDS-m1n1 005 22.9 0.9388 4UDS-8536 02:17:53.37 -05:13:40.3 UDS-m1n1 006 24.7 0.8619 4UDS-9784 02:17:56.80 -05:13:15.9 UDS-m1n1 009 23.6 0.8533 4UDS-10739 02:17:44.88 -05:12:58.7 UDS-m1n1 010 23.2 1.0594 4UDS-9730 02:17:32.64 -05:13:17.4 UDS-m1n1 012 23.8 1.0949 4UDS-12725 02:17:14.84 -05:12:19.8 UDS-m1n1 013 23.7 1.0351 4· · ·
NOTE—The first 10 entries of the DR1 catalog are shown. The full catalog of 1283 sources withquality flags Q>= 3 can be found here. Note that an ‘s’ appended to the slit number indicates aserendipitous source.
6. CONCLUSION
We have presented initial results of the C3R2 survey basedon five nights of Keck spectroscopy in the 2016A semester.C3R2 is designed to supplement extensive existing spec-troscopy in order to provide a spectroscopic sample spanningthe observed colors of galaxies to the Euclid weak lensingphotometric depth. The ultimate aim of the survey is to cal-ibrate the color-redshift relation sufficiently to meet the re-quirements set by weak lensing cosmology. We estimate thatthe survey would require ∼40 Keck nights (or their equiva-lent) in total to meet the requirements set by Euclid.
In future papers we will present the updated survey strat-egy based on bringing multiple Euclid calibration fields ontoa consistent color system, as well as realistic tests of the per-formance of the method. Initial tests show that the empiricalcolor mapping technique performs very well in reproducingN(z) distributions with low bias.
Additional data, including results from 16.5 nights allo-cated in 2016B as well as time allocated in 2017A and 2017Bwill be presented in follow-on papers. Combined with datafrom VLT, GTC, and MMT, we expect the calibration sam-ples will be sufficient to meet the needs of Euclid. Work is
ongoing to understand the needs for WFIRST calibration, butthese spectra will form part of the foundation of that survey aswell. Further tests and refinements of the calibration method,as well as studies to determine the optimal way to incorpo-rate all existing spectroscopic and photometric informationfrom deep fields into photo-z estimation using a limited set ofbroad band observations, are avenues of continuing research.
The authors thank the referee, Marcin Sawicki, for a help-ful report that improved this paper. D.M. would like to thankGiuseppe Longo, Audrey Galametz, Sotiria Fotopoulou, andGeorge Helou for helpful conversations. D.M., P.C., D.S.,and J.R. acknowledge support by NASA ROSES grant 12-EUCLID12-0004. J.R. and D.S. are supported by JPL, run byCaltech for NASA. F.C. acknowledges support by MINECOgrant ESP2015-88861. The authors wish to recognize andacknowledge the very significant cultural role and reverencethat the summit of Mauna Kea has always had within theindigenous Hawaiian community. We are most fortunateto have the opportunity to conduct observations from thismountain.
c©2017. All rights reserved.
REFERENCES
Benıtez, N. 2000, ApJ, 536, 571Brammer, G. B., van Dokkum, P. G., & Coppi, P. 2008, ApJ, 686, 1503Brown, M. J. I., Moustakas, J., Smith, J.-D. T., et al. 2014, ApJS, 212, 18Capak, P., Aussel, H., Ajiki, M., et al. 2007, ApJS, 172, 99Carrasco Kind, M., & Brunner, R. J. 2013, MNRAS, 432, 1483Dahlen, T., Mobasher, B., Faber, S. M., et al. 2013, ApJ, 775, 93Dore, O., Bock, J., Ashby, M., et al. 2014, ArXiv e-printsFaber, S. M., Phillips, A. C., Kibrick, R. I., et al. 2003, in Society of
Photo-Optical Instrumentation Engineers (SPIE) Conference Series, Vol.4841, Instrument Design and Performance for Optical/InfraredGround-based Telescopes, ed. M. Iye & A. F. M. Moorwood, 1657–1669
Grogin, N. A., Kocevski, D. D., Faber, S. M., et al. 2011, ApJS, 197, 35Huterer, D., Takada, M., Bernstein, G., & Jain, B. 2006, MNRAS, 366, 101Ilbert, O., Capak, P., Salvato, M., et al. 2009, ApJ, 690, 1236Ivezic, Z., Tyson, J. A., Abel, B., et al. 2008, ArXiv e-printsKartaltepe, J. S., Sanders, D. B., Le Floc’h, E., et al. 2010, ApJ, 709, 572Kohonen, T. 1990, Proceedings of the IEEE, 78, 1464Kriek, M., Shapley, A. E., Reddy, N. A., et al. 2014, ArXiv e-printsLaigle, C., McCracken, H. J., Ilbert, O., et al. 2016, ApJS, 224, 24Laureijs, R., Amiaux, J., Arduini, S., et al. 2011, ArXiv e-printsLe Fevre, O., Tasca, L. A. M., Cassata, P., et al. 2015, A&A, 576, A79Lilly, S. J., Le Fevre, O., Renzini, A., et al. 2007, ApJS, 172, 70

11
Massey, P., & Gronwall, C. 1990, ApJ, 358, 344Masters, D., Capak, P., Stern, D., et al. 2015, ApJ, 813, 53McLean, I. S., Steidel, C. C., Epps, H. W., et al. 2012, in Society of
Photo-Optical Instrumentation Engineers (SPIE) Conference Series, Vol.8446, Society of Photo-Optical Instrumentation Engineers (SPIE)Conference Series, 0
Newman, J. A. 2008, ApJ, 684, 88Newman, J. A., Cooper, M. C., Davis, M., et al. 2013, ApJS, 208, 5Oke, J. B., Cohen, J. G., Carr, M., et al. 1995, PASP, 107, 375Rahman, M., Menard, B., Scranton, R., Schmidt, S. J., & Morrison, C. B.
2015, MNRAS, 447, 3500
Salvato, M., Hasinger, G., Ilbert, O., et al. 2009, ApJ, 690, 1250Scoville, N., Aussel, H., Brusa, M., et al. 2007, ApJS, 172, 1Speagle, J. S., Capak, P. L., Eisenstein, D. J., Masters, D. C., & Steinhardt,
C. L. 2016, MNRAS, 461, 3432Spergel, D., Gehrels, N., Baltay, C., et al. 2015, ArXiv e-printsSteidel, C. C., Rudie, G. C., Strom, A. L., et al. 2014, ApJ, 795, 165Stickley, N. R., Capak, P., Masters, D., et al. 2016, ArXiv e-printsTrump, J. R., Impey, C. D., McCarthy, P. J., et al. 2007, ApJS, 172, 383