Embed Size (px)
Citation preview

Danish Video AssociationThe Future for Home Video
May 2010
Presented by: Alison Casey, Head of Global Content

© 2010 Futuresource Consulting Ltd
Agenda
DVD Update
Blu-ray performance and major driversHardware uptakeTV trends
Opportunities for 3D
Future prospects for Digital Distribution
2

© 2010 Futuresource Consulting Ltd
0
100
200
300
400
500
600
2007 2008 2009 2010 2011 2012 2013 2014
Packaged Film & Video
Broadband Services
Mobile Content
Online Content
Packaged Music
Box Office
Subscription TV
(Basic & Pay,
Inc VoD & PPV)
Packaged Games
Global Entertainment Media Consumer Expenditure
3
$Bn
Digital Revenues $40.2BPackaged Revenues $72.8B
497.6
376.7
413.3 420.3
450.9473.7
487.7
Total Consumer Spend* 3.6% CAGR2010-2014
432.6

© 2010 Futuresource Consulting Ltd
Packaged Media Will Continue to Dominate Video Revenues: Western Europe
4
DVD-Video
Blu-ray
Mobile Video
Online Video
Retail Value (€ Euro Billions)
TV VoD
© 2010 Futuresource Consulting Ltd
DVD Sell-Through Market Performance: 2009
5
USA UK France Germany Italy Spain Nordics Benelux

© 2010 Futuresource Consulting Ltd
DVD Sell-Through Market Performance: 2010
6
USA UK France Germany Italy Spain Nordics Benelux

© 2010 Futuresource Consulting Ltd
DVD Sell-Through Market Performance: 2009
7

© 2010 Futuresource Consulting Ltd
DVD Sell-Through Market Performance: 2010
8

© 2010 Futuresource Consulting Ltd
DVD Rental Retail Value 2009 & 2010 Forecast
9
2%
-15%
-12%
-7%
-15%-17%
-12%
-9%
0%
-17%
-14%
-9%
-17%-19%
-15%
-3%
-30%
-25%
-20%
-15%
-10%
-5%
0%
5%
10%USA UK France Germany Italy Spain Benelux Nordics
2009 vs 2008
2010 vs 2009
2009
2010
Value: 2009 vs. 2008 & 2010 vs. 2009

© 2010 Futuresource Consulting Ltd
Retail Sales Market Development (M Units)
10
0
50
100
150
200
250
300
0
20
40
60
80
100
120
0
50
100
150
0
20
40
60
80
100
UK France
Germany Nordics
243 235 222 213 206
257
195
DVD BD
113 119 124 128 125104
119
95 95 96 96 9483
88
74 74 73 73 707265
2008 2009 2010 2011 2012 2013 2014Total Retail Value (€ Bn)
3.36 2.64 2.42 2.21 2.09 2.00 1.87
Growth Rate %
-13% -22% -8% -9% -6% -4% -7%
2008 2009 2010 2011 2012 2013 2014
Total Retail Value (€ Bn)
1.55 1.64 1.68 1.70 1.69 1.60 1.47
Growth Rate %
-3% 5% 3% 1% 0% -6% -8%
2008 2009 2010 2011 2012 2013 2014Total Retail Value (€ Bn)
1.52 1.51 1.47 1.43 1.41 1.36 1.24
Growth Rate %
-8% -1% -3% -3% -1% -4% -8%
2008 2009 2010 2011 2012 2013 2014
Total Retail Value (€ Bn)
1.00 0.94 0.95 0.93 0.91 0.87 0.79
Growth Rate %
-2% -6% 2% -3% -2% -5% -9%

BD Market Performance

© 2010 Futuresource Consulting Ltd
High Definition TV Market Development:Western Europe
12
% Homes with at least 1 HDTV
Hi Def ‘Content Gap’
‘HD Ready’ Screens
Homes receiving HD Broadcasts
172m Sets in use
97m homes

© 2010 Futuresource Consulting Ltd
High Definition TV Market Development:Nordics
13
% Homes with at least 1 HDTV
Hi Def ‘Content Gap’
‘HD Ready’ Screens
Homes receiving HD Broadcasts
10m Sets in use
8m homes
2009 – HDTV HHs
Norway
85%Denmark
79%Sweden
65%Finland
54%

© 2010 Futuresource Consulting Ltd
24.0
3.7 1.7 1.7 0.3 0.3 0.6 0.6
45.0
8.44.5 6.2
0.8 0.8 1.4 1.8
95.0
17.0
9.514.0
1.6 1.6 2.9 4.0
0
20
40
60
80
100
120
USA UK France Germany Italy Spain Benelux Nordics
2008 2009 2010
Blu-ray Retail Sales Performance: 2008 - 2010
14
Retail Sales (Million Units)
NB: 2009 refers to a 53 week calendar year

© 2010 Futuresource Consulting Ltd
Blu-ray Retail Sales Performance: 2008 - 2010
15
Retail Sales (Million Units)
© 2010 Futuresource Consulting Ltd
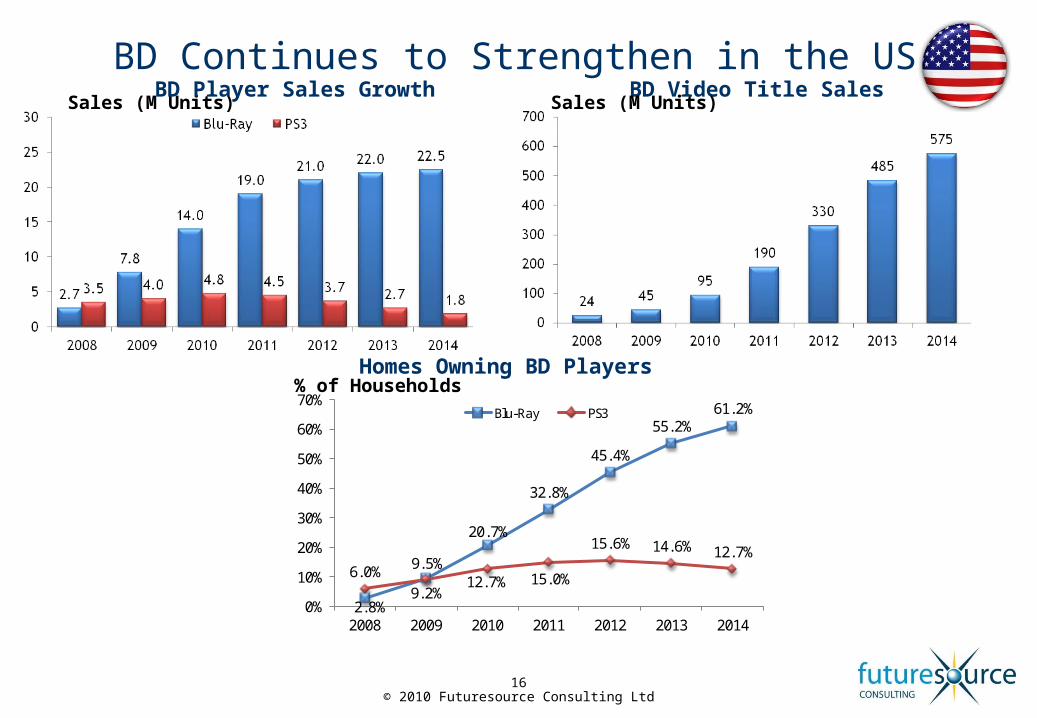
Sales (M Units)
16
BD Video Title SalesBD Player Sales GrowthBD Continues to Strengthen in the USA
2.8%
9.5%
20.7%
32.8%
45.4%
55.2%61.2%
6.0%9.2%
12.7% 15.0%
15.6% 14.6% 12.7%
0%
10%
20%
30%
40%
50%
60%
70%
2008 2009 2010 2011 2012 2013 2014
Blu-Ray PS3
% of HouseholdsHomes Owning BD Players
Sales (M Units)
© 2010 Futuresource Consulting Ltd
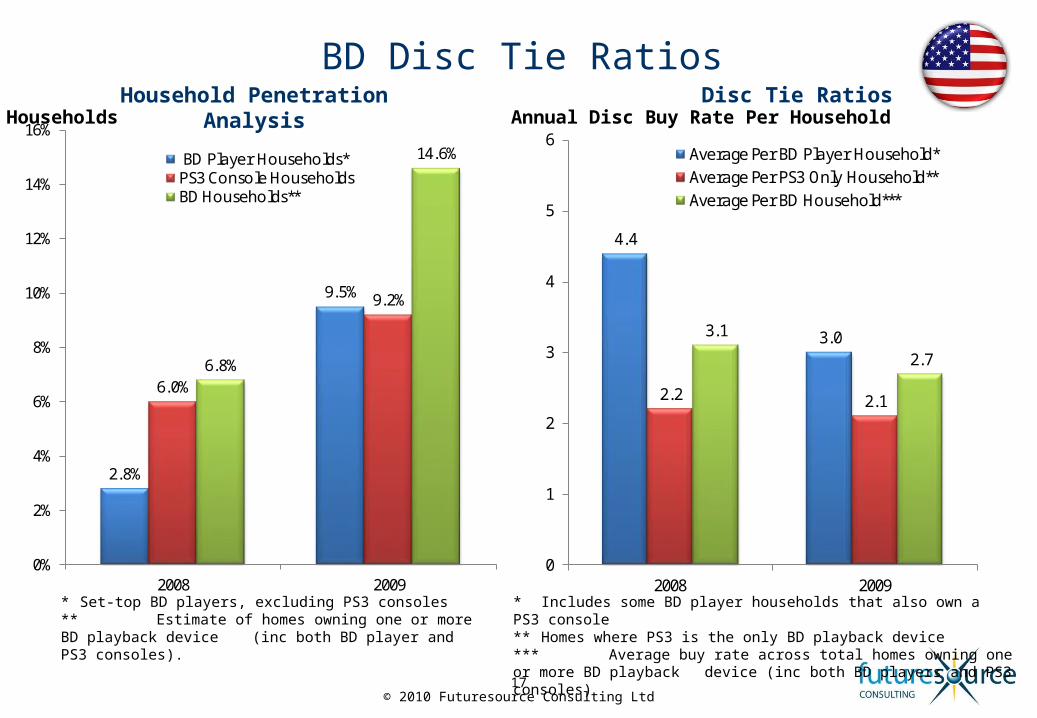
2.8%
9.5%
6.0%
9.2%
6.8%
14.6%
0%
2%
4%
6%
8%
10%
12%
14%
16%
2008 2009
BD Player Households*PS3 Console HouseholdsBD Households**
17
% Households
* Set-top BD players, excluding PS3 consoles** Estimate of homes owning one or more BD playback device (inc both BD player and PS3 consoles).
4.4
3.0
2.2 2.1
3.1
2.7
0
1
2
3
4
5
6
2008 2009
Average Per BD Player Household*Average Per PS3 Only Household**Average Per BD Household***
Annual Disc Buy Rate Per Household
* Includes some BD player households that also own a PS3 console** Homes where PS3 is the only BD playback device*** Average buy rate across total homes owning one or more BD playback device (inc both BD players and PS3 consoles)
Disc Tie RatiosHousehold Penetration Analysis
BD Disc Tie Ratios

The Market Impact of 3D

© 2010 Futuresource Consulting Ltd
Global Digital Cinema Installed Base Forecast
19
0
10
20
30
40
50
60
70
80
90
2008 2009 2010 2011 2012 2013 2014 2015
3D Based D-Cinema Non 3 Based D-Cinema
16.2
25.6
38.1
54.2
65.4
84.1
Thousands
Installed Base of Digital Cinema Screens (Includes IMAX)*
Total WW Screens 2010 150,000 (approx) Americas 50,000 (USA 39,000) EMEA 40,000 (EU 27 29,000) Asia Pac 60,000 (China 37k, India 14k)
75.5
8.7 63%71%
76%
78%
79%
81%
47%

© 2010 Futuresource Consulting Ltd
Consumer Awareness and Interest in 3D
20
“Have you ever watched a 3D Movie at the movie theater/cinema?”
Do Consumers Want 3D at Home?
“Soon you will able to watch a new type of 3D in the home. You will need glasses, but not the red/green ones used of the past. The quality will be much better than in the past. How interested are you in watching 3D at home?”
Source: Living With Digital Internet survey – Futuresource February 2010 (2,470 Adults)
* Aggregate of UK, Germany and France.** Reasonably, very or extremely interested
Will Consumers Be Willing To Get a New TV For 3D?“How likely is it that you would be willing to
buy a new TV to watch 3D (assuming the TV is slightly more expensive than a regular High Definition TV)?”
Yes No
USA 61% 39%
Europe* 48% 52%
Interested** Not interested
USA 71% 29%
Europe* 70% 30%
Interested** Not interested
USA 38% 62%
Europe* 45% 55%
Who Has Seen 3D on TV at Home?
“Have you ever watched anything in 3D on TV at Home?
Yes No
USA 26% 74%
Europe* 15% 85%
Who Has Seen 3D at the Cinema?

© 2010 Futuresource Consulting Ltd
Hollywood 3D Boom
16 major Hollywood 3D features in 2009, will release 20 in 2010Avatar ran for 16 weeks, 70% of US Box Office from 3D screens
Animation currently 70% of titles: new and re-releasesAll major new animations have a 3D version
Live action Science Fiction, Horror, Musicals, Action all good in 3DClassic re-releases possible e.g. The Matrix, Star Wars, Jurassic Park
21
© 2010 Futuresource Consulting Ltd
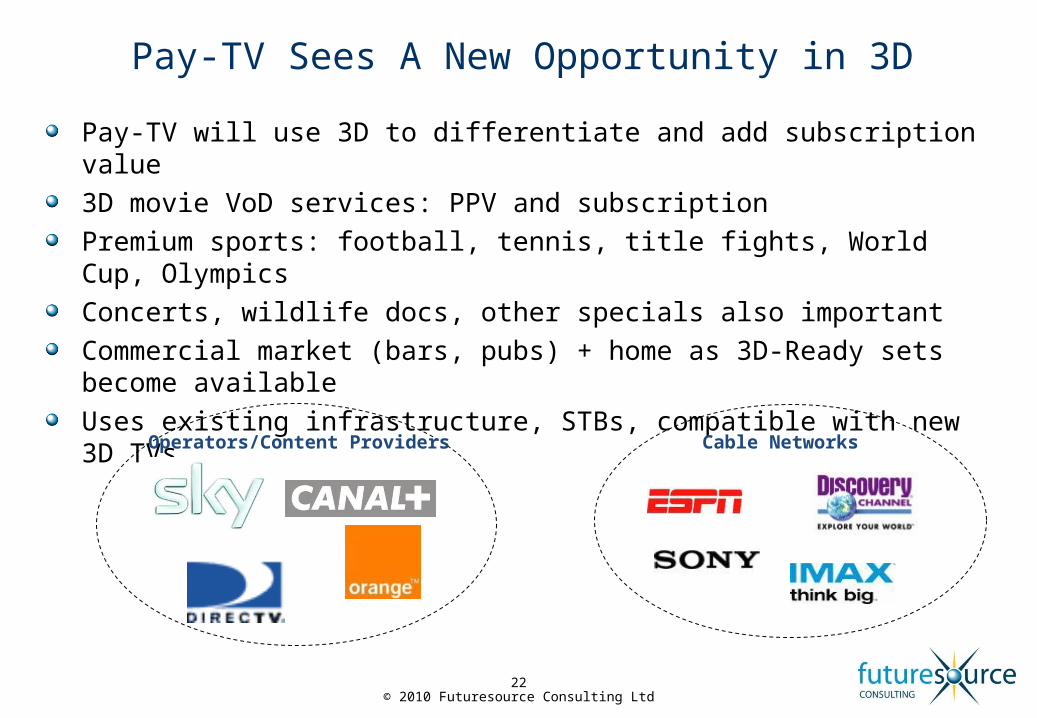
Pay-TV Sees A New Opportunity in 3D
Pay-TV will use 3D to differentiate and add subscription value3D movie VoD services: PPV and subscription Premium sports: football, tennis, title fights, World Cup, OlympicsConcerts, wildlife docs, other specials also importantCommercial market (bars, pubs) + home as 3D-Ready sets become availableUses existing infrastructure, STBs, compatible with new 3D TVs
22
Cable NetworksOperators/Content Providers

© 2010 Futuresource Consulting Ltd
3D-Ready TV Display Forecast: W Europe
23
0%
10%
20%
30%
40%
50%
2008 2009 2010 2011 2012 2013 2014 2015
Annual W European TV Display Shipments 3D-Ready TV Penetration of W European Homes**
40.5
47.051.9
54.357.6 58.7 59.5 59.6
2D only
3D-Ready*
*Glasses and transmitter may be optional extras
30m in use
** Excluding non-Full HD 3D sets sold prior to 2010
60m in use
Millions %
© 2010 Futuresource Consulting Ltd
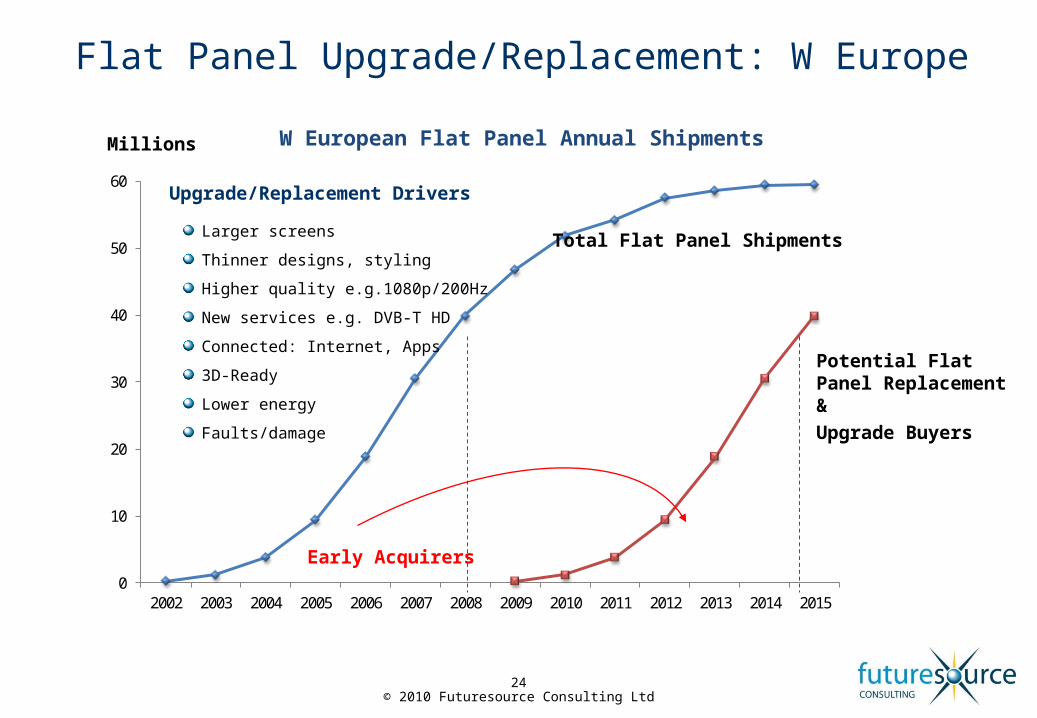
0
10
20
30
40
50
60
2002 2003 2004 2005 2006 2007 2008 2009 2010 2011 2012 2013 2014 2015
Flat Panel Upgrade/Replacement: W Europe
W European Flat Panel Annual ShipmentsMillions
Total Flat Panel Shipments
Potential Flat Panel Replacement &Upgrade Buyers
Early Acquirers
Larger screens
Thinner designs, styling
Higher quality e.g.1080p/200Hz
New services e.g. DVB-T HD
Connected: Internet, Apps
3D-Ready
Lower energy
Faults/damage
Upgrade/Replacement Drivers
24

© 2010 Futuresource Consulting Ltd
3D Blu-Ray Player Forecast: Western Europe
25
2D only
3D-Ready (embedded or firmware upgradeable)*
* Players, HTiB and Recorders
0.5 3
9
19
2630
0
5
10
15
20
25
30
35
2008 2009 2010 2011 2012 2013 2014 20150%
10%
20%
30%
40%
50%
60%
2010 2011 2012 2013 2014 2015
Annual European Blu-ray Hardware* Shipments 3D-Ready BDP Penetration of Homes
0.82.2
5.2
10.2
17.3
24.6
28.330
31m 3D in use3D* BDPs
2D BDPs
57m 3D in use
Millions %

© 2010 Futuresource Consulting Ltd
3D Blu-ray Media Forecast: W Europe
26
2552
93143
190215
240
1
3
10
20
40
60
0
50
100
150
200
250
300
350
2009 2010 2011 2012 2013 2014 2015
Millions
Annual BD Sell-Through Shipments
25
53
96
153
210
255
300
0.81.5
2.33.2
3.9 4.1 4.1
0
0.1
0.3
0.50.9
1.3
0
1
2
3
4
5
6
2009 2010 2011 2012 2013 2014 2015
$bn
Annual BD Sell-Through Retail Value
0.8
1.5
2.4
3.5
4.4
5.05.4
3D Blu-ray discs
2D Blu-ray discs
20%24%

The Digital and Online Challenge
© 2010 Futuresource Consulting Ltd
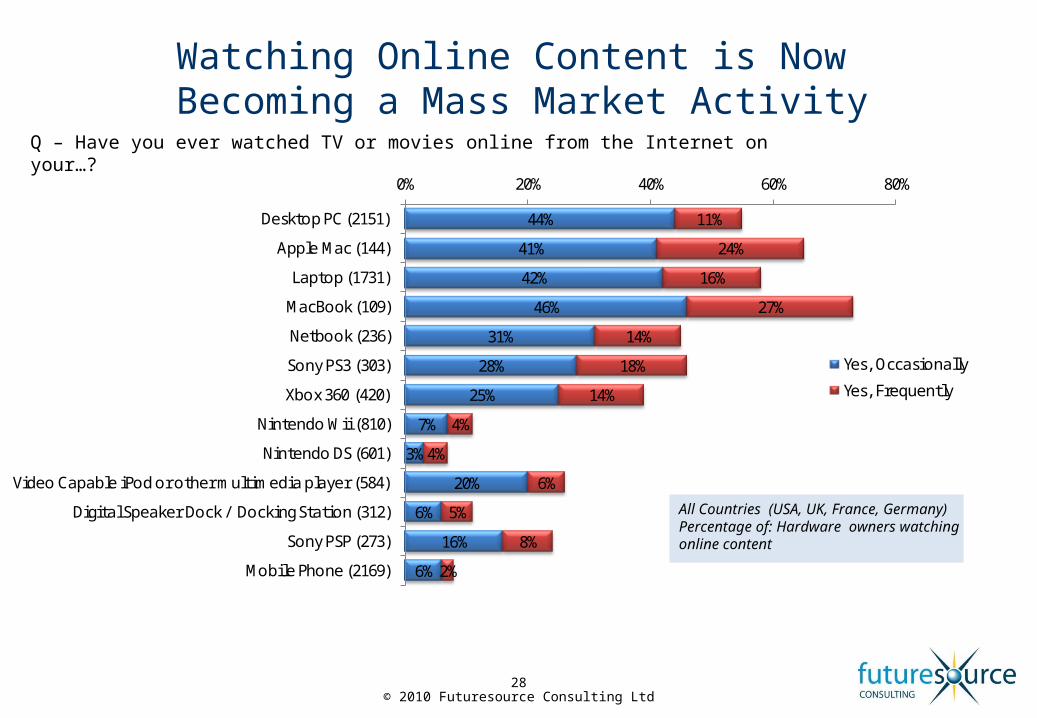
Watching Online Content is Now Becoming a Mass Market Activity
28
44%
41%
42%
46%
31%
28%
25%
7%
3%
20%
6%
16%
6%
11%
24%
16%
27%
14%
18%
14%
4%
4%
6%
5%
8%
2%
0% 20% 40% 60% 80%
Desktop PC (2151)
Apple Mac (144)
Laptop (1731)
MacBook (109)
Netbook (236)
Sony PS3 (303)
Xbox 360 (420)
Nintendo Wii (810)
Nintendo DS (601)
Video Capable iPod or other multimedia player (584)
Digital Speaker Dock / Docking Station (312)
Sony PSP (273)
Mobile Phone (2169)
Yes, Occasionally
Yes, Frequently
All Countries (USA, UK, France, Germany)Percentage of: Hardware owners watchingonline content
Q – Have you ever watched TV or movies online from the Internet on your…?

© 2010 Futuresource Consulting Ltd
Online Video Viewings Significant,But Majority is Free
29
Other Short Form & Professional Online Video 44% (29bn)
Paid-for Content 0.01% (9m)
54% (35bn)
Online TV 2% (1bn)
2009: ~65 Billion Video Views

© 2010 Futuresource Consulting Ltd
Broadband Speeds Increasing, Downloading & Streaming Video Now Possible For All
30
35 35
169 8.5 10 7 4.5 4.5
48 45
28
21 19 18 2015 15
0
10
20
30
40
50
60
70
80
90
J apan South Korea Sweden France Norway Finland Denmark UK USA
Ach
ieve
d A
ve. Bro
adban
d S
peed (m
bps)
2013 Speed 2009 Speed
Broadband
Household Penetratio
n
2009: 66% 85% 72% 74% 81% 73% 83% 70% 69%
2013: 72% 86% 77% 78% 84% 76% 85% 74% 74%

© 2010 Futuresource Consulting Ltd
Packaged Media Will Continue to Dominate Video Revenues: Western Europe
0
2
4
6
8
10
12
14
2007 2008 2009 2010 2011 2012 2013 2014
31
DVD-Video
Blu-ray
Mobile Video
Online Video
Retail Value (€ Euro Billions)
TV VoD
© 2010 Futuresource Consulting Ltd
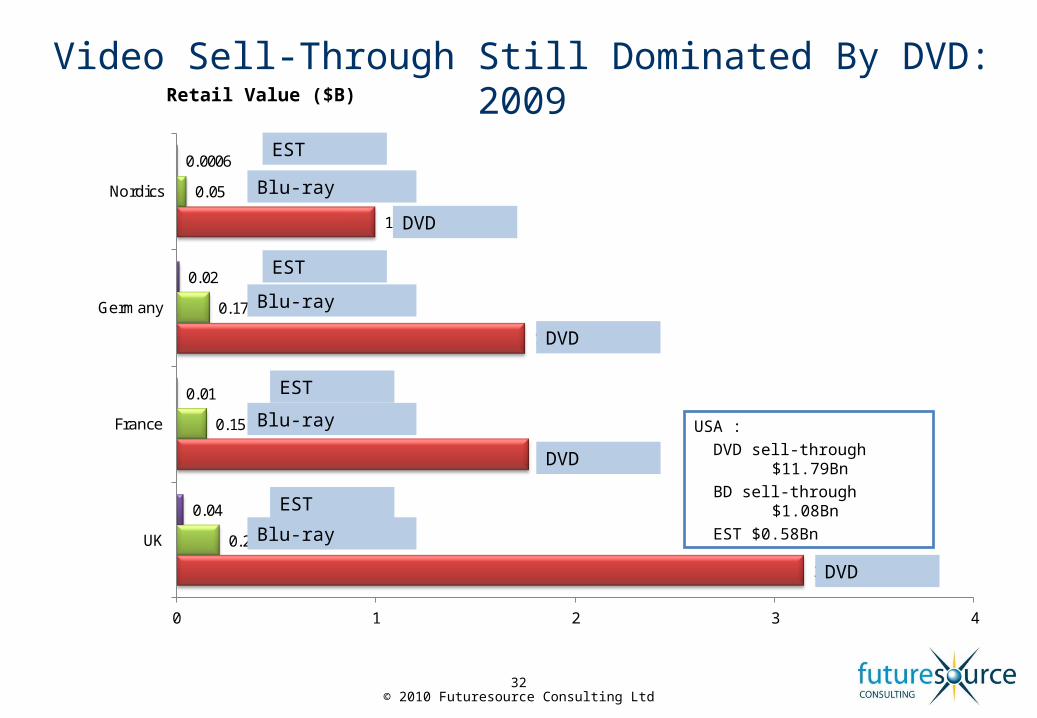
Video Sell-Through Still Dominated By DVD: 2009
32
3.15
1.77
1.75
1.00
0.22
0.15
0.17
0.05
0.04
0.01
0.02
0.0006
0 1 2 3 4
UK
France
Germany
Nordics
USA :DVD sell-through
$11.79BnBD sell-through $1.08BnEST $0.58Bn
Retail Value ($B)
EST
Blu-ray
DVD
EST
Blu-ray
DVD
EST
Blu-ray
DVD
DVD
EST
Blu-ray

© 2010 Futuresource Consulting Ltd
Importance of Video Rental/VOD: 2009
33
289.9
176.9
335.7
249.0
9.4
5.6
20.9
5.6
12.0
3.1
4.5
3.1
231.3
225.0
51.4
115.0
0 50 100 150 200 250 300 350 400
UK
France
Germany
Nordics
Retail Value ($M)
USA :DVD rental $6BnBD rental
$0.43BnOnline VoD
$0.12BnTV VoD $1.3Bn
TV VoD
Online VoDBlu-
Ray DV
DTV VoD
Online VoDBlu-
Ray DV
D
DVD
Online VoDBlu-
Ray
TV VoD
TV VoD
Online VoDBlu-
Ray DV
D
© 2010 Futuresource Consulting Ltd
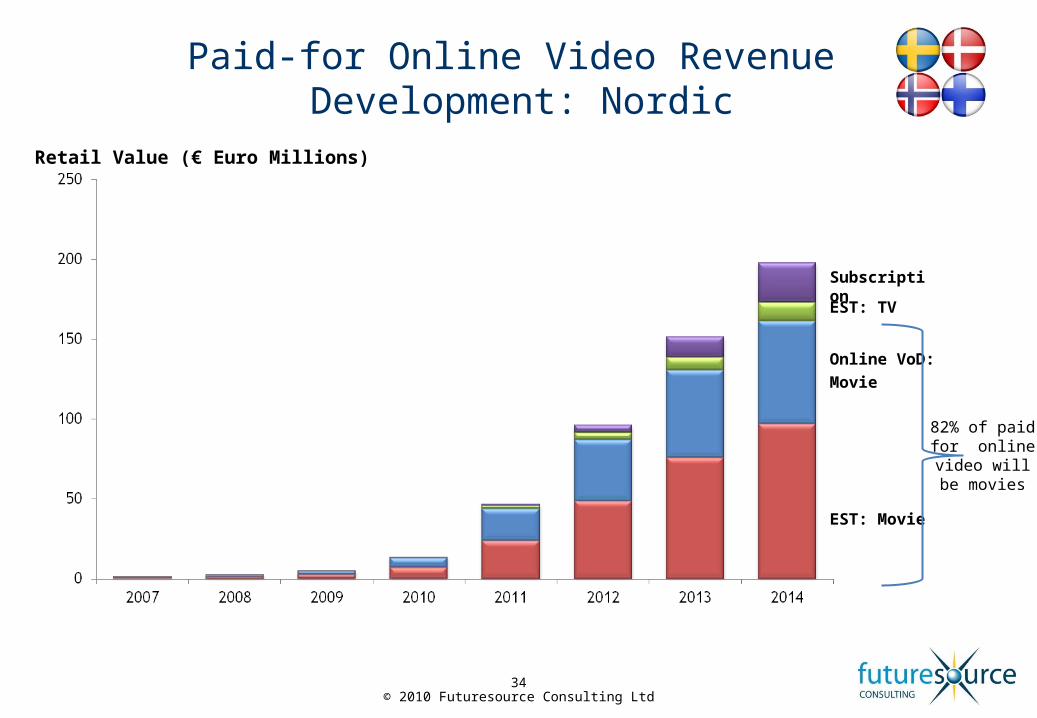
Paid-for Online Video Revenue Development: Nordic
34
EST: Movie
SubscriptionEST: TV
Online VoD: Movie
82% of paid for online
video will be movies
Retail Value (€ Euro Millions)

© 2010 Futuresource Consulting Ltd
UK
ITALY
GERMANY
NORDICS
SPAIN
FRANCE
NB: Some services will offer a mix of paid-for, free and ad-supported online video content
35
Online Video Services Struggling to Generate Revenues: Western Europe

© 2010 Futuresource Consulting Ltd
Contracting Movie Release Windows Boost Online VOD: Western Europe
36
Theatrical*
DVD Sell-Through & Rental & Electronic Sell-Through
TVoD & Online VoD
NVoD/PPV
1st Pay-TV
Typical Release Window (Months)
TVoD & Online VoD Library
Free to Air & Subscription VoD
Window
2nd Pay-TV / Holdback
period
Blackout
4 6 9 12 24Launch
*Theatrical windows on Disney’s Alice in Wonderland 10 weeks
Warner 100% D&D. Sony most titles, other majors experimenting on title by title basis
Rental service subscribers must wait 2-3 years to see titles online on a subscription basis

© 2010 Futuresource Consulting Ltd
Devices Are All Becoming IP Enabled, Significantly Increasing Online Content Opportunities:
Western Europe
0%
10%
20%
30%
40%
50%
2006 2007 2008 2009 2010 2011 2012 2013
Hou
seho
ld P
enet
rati
on (%
)
Games Consoles Pay-TV STB/ PVR*Digital Media Adaptors TV DisplaysBlu-ray Live Players
2013 Household Penetration
2013 Household Penetration
Digital Media Adaptors
Digital Media Adaptors
Pay-TV STB/DVRPay-TV
STB/DVR
Blu-Ray PlayersBlu-Ray Players
*Pay-TV STB/PVR includes all boxes with Ethernet input across IPTV/Cable/Satellite.
Game Consoles
Game Consoles
TV DisplaysTV Displays
37
45%
43%
36%
25%
7%

© 2010 Futuresource Consulting Ltd
Leading Connected TV Services & Online Video Partners
38
TV Brand Service Name Key Online Video Partners USA Launch
Europe Launch
USA H1 ‘09 Share
W Europe H1 ‘09 Share
Bravia Internet Video (Currently Applicast in
Europe, to be renamed in Q1 2010)
YouTube, DailyMotion, Channel 5 (UK), Mediaset (Italy). Amazon,
Yahoo! (Both USA)
Feb 2009 Feb 2009 (Applicast)
12% 11%
Viera Cast YouTube, Amazon (USA), Eurosport, ZDF (Ger), RTVE (Spain),
Bild (Ger)
May 2008
May 2009 9% 8%
Internet@TV YouTube, Yahoo!, BBC iPlayer expected in UK, Blockbuster,
Amazon (both USA)
May 2009
May 2009 21% 22%
NetCast YouTube, Netflix, Yahoo! , Vudu, Maxdome (Ger)
May 2009
Set for early 2010
10% 14%
Net TV (Europe Only) YouTube, Dailymotion, NRJ - April 2009 3% 15%
Market Share based on total TV Shipments, including both connected TVs and standard TVs
© 2010 Futuresource Consulting Ltd
0
200
400
600
800
1000
1200
1400
1600
2006 2007 2008 2009 2010 2011 2012 2013 2014
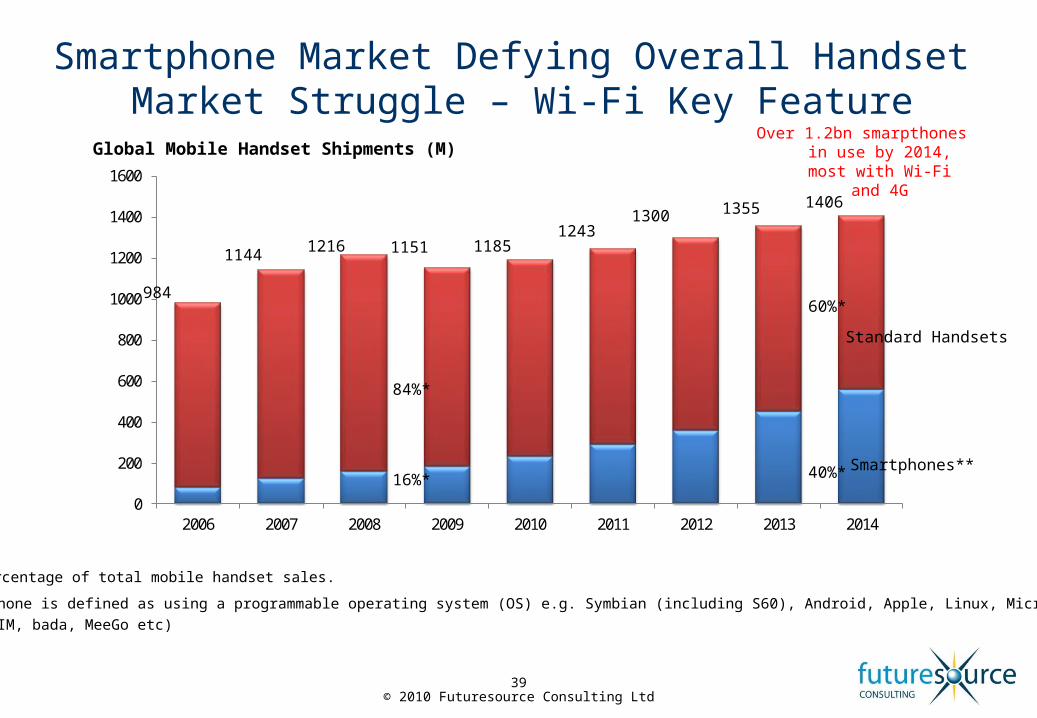
984
1144 1216 1151 11851243
1300 1355
84%*
16%*
60%*
40%*
1406
Smartphone Market Defying Overall Handset Market Struggle – Wi-Fi Key Feature
Global Mobile Handset Shipments (M)
Smartphones**
Standard Handsets
**A smartphone is defined as using a programmable operating system (OS) e.g. Symbian (including S60), Android, Apple, Linux, Microsoft, Palm, RIM, bada, MeeGo etc)
*Percentage of total mobile handset sales.
Over 1.2bn smarpthones in use by 2014, most
with Wi-Fi and 4G
39

© 2010 Futuresource Consulting Ltd
Apple’s Market Share Grew From 9 to 14% in 200950 Million iPhones In Use Globally
40
Nokia 38% (38%)
Blackberry 19% (15%)
Others 18% (26%)
Samsung 3% (3%)
Total Smartphone Shipments 2009: 180 m
HTC 6% (7%)
Palm 2% (2%)
Apple 14% (9%)
2008 figures in brackets
Apple hardware owners significantly more likely to pay for content online.

© 2010 Futuresource Consulting Ltd
Leading Application Stores Overview
41
Apple App Store
Android Market BB App World
Nokia Ovi Store
Palm App Catalogue
Windows Marketplace
Launch Date
July 2008 October 2008 April 2009 May 2009 June 2009 October 2009
Number of Apps Available to Date
>185,000 >50,000 >6,500 >9,500 >2000 >1500
Total Downloaded Apps to Date
>4 billion >500 million Undisclosed >100 million >35 million Undisclosed
Supported Platforms
iPhone OS X Android OSBlackBerry
OS
Flash Lite, Java, Symbian
OSPalm webOS
Windows Mobile OS
Revenue Split
Developers receive 70%
Developers receive 70%
Developers receive 80%
Developers receive 70%
Developers receive 70%
Developers receive 70%
Updated April 2010

© 2010 Futuresource Consulting Ltd
2007 2008 2009 2010 2011 2012 2013
Other Paid-For Apps 0.0 0.0 1.0 2.4 4.4 7.3 9.9Mobile Apps Games 1.3 2.6 4.3 6.0 7.4Mobile Games* 3.6 4.2 4.3 4.5 4.7 4.9 5.0Mobile Video 2.7 3.4 3.9 4.6 5.5 6.8 8.0Mobile Music and Ringtones 5.8 6.1 6.1 6.1 6.5 7.0 7.6
0
5
10
15
20
25
30
35
40
12.113.7
16.6
20.3
25.3
32.0
37.9
Mobile Content Market Re-Invigorated by Apps
42
Global Consumer Spend ($ Billions)

© 2010 Futuresource Consulting Ltd
In Conclusion…
DVD now in single digit decline in most marketsUptake of Blu-ray slower than anticipated
Relationship with hardware different to DVDMarketing initiatives key to driving disc uptake
Massive consumer interest in 3D3D TVs, 3D BD players and PS3 consoles will drive 3D in the home2011 and beyond 3D will boost Blu-ray disc sales
Watching video online is now a mass market activity but mostly no one is paying
Major challenge is to develop models for digital that generate revenue
Next 5 years a major transition period from physical to digitalBroadcasters will be key in online deliveryPackaged media will remain strong if pricing and retail distribution strategies are carefully managed
43

© 2010 Futuresource Consulting Ltd44
Thank you!
Futuresource Consulting+44 (0)1582 500 [email protected]
While every effort is made by Futuresource Consulting Ltd to provide accurately researched information and carefully supported conclusions and recommendations to its client, in no event will the company or its professionals be liable for information, analysis, advice or recommendations provided to the client at any stage of the project, or be liable for actions and decisions taken as a result of this report.