Embed Size (px)
Citation preview

Dansk Supermarked A/S
Brabrand
Annual report
2014
CVR no. 35 95 47 16
The Annual report has been presented
and approved on the company's annual
general meeting at / 2015
Chair

Table of contents
Page
Management's review
Financial highlights for the Group 1
Management's review 2
Statements
Management's statement 4
Independent auditors' reports 5
Financial statements
Accounting policies 7
Consolidated income statement 12
Consolidated balance sheet 13
Consolidated statement of changes in equity 15
Consolidated cash flow statement 16
Notes to the financial statements for the Group 17
Parent company income statement 24
Parent company balance sheet 25
Statement of changes in equity for the parent company 27
Notes to the financial statements for the parent company 28

Financial highlights for the Group
DKK million 2014 2013 2012 2011 2010
Net revenue 55,905 55,707 54,440 54,106 58,095
Result before financial items 2,308 2,309 1,660 5,850 2,596
Net financial items -56 23 149 64 129
Result for the year 1,745 1,771 1,317 5,262 2,026
Total assets 27,674 33,358 31,481 31,079 27,433
Equity 6,407 22,570 21,247 20,709 15,781
Investment in property, plant
and equipment 1,087 1,666 1,898 2,705 2,225
Profit margin 4.1 4.1 3.0 10.8 4.5
Return on equity 12.0% 8.1% 6.3% 28.8% 13.7%
Profit margin is result before financial items divided by net revenue.
Return on equity is the result for the year divided by the average equity (average of
equity at the beginning of the year and at the end of the year).
1

Management's review
Primary business area
The Dansk Supermarked Group operates retailing in Denmark (Bilka, føtex and Netto) and in
Germany, Poland and Sweden (Netto). In 2014 the Netto concept was reintroduced in the United
Kingdom through the establishment of a 50/50 joint venture with J Sainsbury PLC.
The parent company's activities include retailing in Denmark (Bilka, føtex and Netto).
Development during the financial year
Market development
The Danish grocery market continued to grow at a slow rate in 2014. The market was character-
ized by deflation in food prices and a continued shift in volumes from supermarkets to the dis-
counters. The discount segment now accounts for more than 40 % of the market for fast moving
consumer goods in Denmark with several discount banners opening and refurbishing stores dur-
ing the year. The discount segment is expected to continue its growth in the coming years, but at
a slower pace than earlier. New store openings will continue, but will be countered by other dis-
counters closing stores. During the first few months of 2015 some banners have already indicat-
ed that they will be closing down unprofitable discount stores.
The market for nonfood and textile was also characterized by limited growth. Volumes are shift-
ing towards online trade, and this trend is expected to continue and strengthen in the coming
years.
Dansk Supermarked overall maintained its market share despite fierce competition, many new
discount competitors and increased online trade in Nonfood and Clothing.
Result for the year The annual report for Dansk Supermarked A/S is presented in accordance with the provisions of
the Danish Financial Statements Act.
The net revenue for 2014 amounts to DKK 55,905 million, an increase of DKK 198 million
compared to 2013. The expansion continued with the opening of 41 new stores, 5 of these were
opened in the UK joint venture. During the year Dansk Supermarked closed 4 stores.
The result before financial items (EBIT) is DKK 2,308 million. In 2013 the result before finan-
cial items (EBIT) amounted to DKK 2,309 million.
Cash flows from operating activities amount to DKK 3,142 million (DKK 3,426 million in
2013). Cash flows from investment activities were DKK 1,206 million (DKK 1,972 million in
2013).
2
Management's review
Employees
In 2014 the Dansk Supermarked Group employed 46,981 employees against (46,044 in 2013).
Converted into the average number of full time employees this equals 25,611 (24,510 in 2013).
Social responsibility
Dansk Supermarked considers social responsibility to be important for the Group. Regarding the
efforts in 2014 we refer to our report on social responsibility. The report is available on:
http://dansksupermarked.dk/en/about-us/the-company/dansk-supermarked-in-numbers/csr-reporting.
Particular risks
The Group’s financial risks include interest and exchange rate risks. The interest rate risk is re-
lated to the Group’s mortgage loans where the risk is hedged by interest rate swaps. The ex-
change rate risk primarily concerns purchase of goods in USD where the major part hereof is
covered by short-term forward contracts.
Expected development
The expectation for the result before financial items (EBIT) in 2015 is in line with 2014. The re-
sult before tax is expected to decline in 2015 compared to 2014 due to increased financial ex-
penses. These additional costs relate to loans taken to finance the dividend connected to the sale
of 49% of the ownership in Dansk Supermarked A/S to F. Salling Holding A/S and F. Salling
Invest A/S.
Subsequent events
No subsequent events have occurred that would affect the annual report for 2014.
3

Management's statement
The Board of Directors and the Executive Board have today discussed and approved the annual
report of Dansk Supermarked A/S for the financial year 1 January – 31 December 2014.
The annual report has been prepared in accordance with the Danish Financial Statements Act.
It is our opinion that the consolidated financial statements and the parent company financial
statements gives a true and fair view of the Group's and the Company's assets, liabilities and fi-
nancial position at 31 December 2014 and of the results of the Group's and the Company's opera-
tions and of the Group's cash flows for the financial year 1 January – 31 December 2014.
Further, in our opinion, the Management's review gives a fair review of the development in the
Group's and the Company's operations and financial matters, the results of the Group's and the
Company's operations and financial position.
We recommend that the annual report be approved at the annual general meeting.
Brabrand, 4 March 2015
Executive Board
Per Bank
CEO
Board of Directors
Nils S. Andersen
Chairman
Bjørn Gulden
Kenneth Wedel
Employee representative
Jens Bjerg Sørensen
Freddy Mikael Sobin
Marianne Kirkegaard Knudsen
Margit Alexandra Sandersen
Employee representative
4

Independent auditors' reports
To the Shareholders of Dansk Supermarked A/S
Independent auditors' report on the consolidated financial statements and the parent com-
pany financial statements
We have audited the consolidated financial statements and the parent company financial state-
ments of Dansk Supermarked A/S for the financial year 1 January - 31 December 2014. The fi-
nancial statements comprise accounting policies, income statement, balance sheet, statement of
changes in equity and notes for the Group as well as for the parent company and cash flow
statement for the Group. The consolidated financial statements and the parent company financial
statements are prepared in accordance with the Danish Financial Statements Act.
Management''''s responsibility for the consolidated financial statements and the parent com-
pany financial statements
Management is responsible for the preparation of consolidated financial statements and parent
company financial statements that give a true and fair view in accordance with the Danish Finan-
cial Statements Act and for such internal control that Management determines is necessary to en-
able the preparation of consolidated financial statements and parent company financial state-
ments that are free from material misstatement, whether due to fraud or error.
Auditors' responsibility
Our responsibility is to express an opinion on the consolidated financial statements and the par-
ent company financial statements based on our audit. We conducted our audit in accordance with
International Standards on Auditing and additional requirements under Danish audit regulation.
This requires that we comply with ethical requirements and plan and perform the audit to obtain
reasonable assurance whether the consolidated financial statements and the parent company fi-
nancial statements are free from material misstatement.
An audit involves performing procedures to obtain audit evidence about the amounts and disclo-
sures in the consolidated financial statements and the parent company financial statements. The
procedures selected depend on the auditor's judgement, including the assessment of the risks of
material misstatement of the consolidated financial statements and the parent company financial
statements, whether due to fraud or error. In making those risk assessments, the auditors consider
internal control relevant to the Company's preparation of consolidated financial statements and
parent company financial statements that give a true and fair view in order to design audit proce-
dures that are appropriate in the circumstances, but not for the purpose of expressing an opinion
on the effectiveness of the Company's internal control. An audit also includes evaluating the ap-
propriateness of accounting policies used and the reasonableness of accounting estimates made
by Management, as well as evaluating the overall presentation of the consolidated financial
statements and the parent company financial statements.
We believe that the audit evidence we have obtained is sufficient and appropriate to provide a
basis for our opinion.
Our audit has not resulted in any qualification.
5

Independent auditors' reports
Opinion
In our opinion, the consolidated financial statements and the parent company financial state-
ments give a true and fair view of the Group's and the parent company's assets, liabilities and fi-
nancial position at 31 December 2014 and of the results of the Group's and the parent company's
operations and the Group's cash flows for the financial year 1 January to 31 December 2014 in
accordance with the Danish Financial Statements Act.
Statement on the Management's review
Pursuant to the Danish Financial Statements Act, we have read the Management's review. We
have not performed any further procedures in addition to the audit of the consolidated financial
statements and the parent company financial statements. On this basis, it is our opinion that the
information provided in the Management's review is consistent with the consolidated financial
statements and the parent company financial statements.
Brabrand, 4 March 2015
Ernst & Young
Godkendt Revisionspartnerselskab
Henrik Kronborg Iversen Morten Friis
State Authorised Public Accountant State Authorised Public Accountant
6

Accounting policies
The annual report for Dansk Supermarked A/S for 2014 has been prepared in accordance with
the provisions of the Danish Financial Statements Act applying to large enterprises of reporting
class C.
Accounting policies are unchanged compared to last year. Some reclassifications have been car-
ried out compared to last year. The reclassifications have no impact on the annual results or the
equity.
Consolidated financial statements
The consolidated financial statements comprise the parent company Dansk Supermarked A/S
and the subsidiaries in which Dansk Supermarked A/S directly or indirectly holds controlling in-
terest.
The consolidated financial statements are prepared based on the accounts for the parent company
and the subsidiaries and are a pooling of the accounting items of similar nature. On consolidation
intra-group transactions are eliminated.
Acquisitions of enterprises are accounted for using the acquisition method, according to which
the identifiable assets and liabilities acquired are measured at their fair values at the date of ac-
quisition. Provision is made for costs related to adopted and announced plans to restructure the
acquired enterprise in connection with the acquisition. Enterprises disposed of are recognised un-
til the date of disposal. Expense/income associated with currency hedges with regards to sales
prices for enterprises disposed of are posted under equity.
Goodwill on acquisitions is recognised as an intangible asset and is amortised based on an indi-
vidual assessment of the useful life.
Foreign currencies
Transactions in foreign currencies are translated into DKK at the exchange rates prevailing at the
date of the transaction. Monetary items in foreign currencies, which are not settled at the balance
sheet date, are translated into DKK at the exchanges rate at the balance sheet date.
Foreign exchange differences arising between the exchange rates at the transaction date and the
exchange rates at the date of payment / the balance sheet date are recognised in financial items in
the income statement.
Financial statements of foreign entities are translated into DKK at the exchange rates prevailing
at the date of the transaction for items of the income statement, and at the exchanges rate at the
balance sheet date for items of the balance sheet. Foreign exchange differences arising on trans-
lation of the opening equity of foreign entities at the exchange rates at the balance sheet date and
on translation of the income statements from average exchange rates to the exchange rates at the
balance sheet date are recognised directly in equity.
7

Accounting policies
Derivative financial instruments
Derivative financial instruments are initially recognised in the balance sheet at cost and are sub-
sequently measured at fair value. Changes in the fair value of derivative financial instruments
designated as and qualifying for recognition as a cash flow hedge are recognised in the equity,
and are reclassified to the income statement in the periods when the hedged item affects the in-
come statement. Changes in the fair value of other derivative financial instruments are recog-
nised in the income statement. The positive and negative fair values of derivative financial in-
struments are included in other receivables or other payables, respectively.
Income statement
Net revenue
Net revenue from sale of goods for resale is recognised in the income statement provided that de-
livery and transfer of risks and rewards to the buyer have taken place. Net revenue is measured
exclusive of VAT and taxes charged on behalf on third parties, and net of discounts relating to
sales.
Financial items
Financial income and expenses comprise interest income and expenses, capital gains and losses
on securities and gain on sale of company shares. Furthermore, realised and unrealised gains and
losses regarding derivative financial instruments are included.
Tax on the result for the year
Tax on the result for the year comprises current tax for the year and adjustment in deferred tax.
Until the 10 April 2014 the company was jointly taxed with A. P. Møller – Mærsk A/S. As of the
11 April 2014 the company is jointly taxed with the Danish companies in the Købmand Herman
Sallings Fond Group. The tax effect of the joint taxation is allocated to Danish enterprises show-
ing profits or losses in proportion to their taxable incomes (full allocation).
Balance sheet
Intangible assets
Goodwill is measured at cost and is amortised on a straight-line basis based on an individual as-
sessment over the estimated useful life, which in general is 3 – 10 years.
Software is measured at cost and is amortised on a straight-line basis based on an individual as-
sessment over the estimated useful life, which in general is 3 – 10 years
8

Accounting policies
Property, plant and equipment
Property, plant and equipment are measured at cost less accumulated depreciation and impair-
ment losses. Cost comprises the purchase price and any costs directly attributable to the acquisi-
tion until the date, when the asset is available for use.
Assets are depreciated on a straight-line basis over their estimated useful lives to residual value
as follows:
Buildings 40 years
Fixtures and fittings, tools and equipment 3 - 10 years
Minor new acquisition of operating equipment and furniture for new
stores and improvements
3 years
Leasehold improvements 12 years
Impairment of non-current assets
The carrying amount of intangible assets and property, plant and equipment is evaluated annual-
ly for indications of impairment.
If indications of impairment exist, tests are performed to determine whether recognition of im-
pairment losses is necessary for individual assets as well as groups of assets. If the recoverable
amount is lower than an asset's carrying amount, an impairment loss is recognised so that the car-
rying amount is reduced to the recoverable amount.
The recoverable amount is the higher value of an assets net sales price and its value in use. The
value in use is assessed as the present value of the expected net cash flow from utilization of the
asset or the group of assets and expected net cash flow from disposal of the asset or the group of
assets after the end of the useful life.
Investments in affiliated companies
Investments in affiliated companies are measured in the parent company's balance sheet using
the equity method. The proportionate share of the results after tax of the affiliated companies is
recognised in the income statement.
Investments in joint ventures
Investments in joint ventures are measured in the balance sheet using the equity method. The
proportionate share of the results after tax of the affiliated companies is recognised in the income
statement.
Inventories
Inventories are measured at calculated cost (weighted averages) less write-down for obsolete-
ness.
9

Accounting policies
Receivables
Receivables are measured at amortised cost price less write-down for expected loss.
Securities (current assets)
Listed securities are measured at fair value at the balance sheet date. Other securities are meas-
ured at estimate fair value.
Equity – Dividend
Proposed dividends are recognised as a liability at the date when they are adopted at the annual
general meeting. The expected dividend payment for the year is presented in a separate line item
within equity.
Corporation tax and deferred tax
Corporation tax payable is recognised in the balance sheet as tax computed on the taxable in-
come for the year, adjusted for tax on the taxable income of prior years and for tax paid on ac-
count.
Provision for deferred tax is made on differences between the accounting and tax values of assets
and liabilities. Deferred tax assets are recognised at the value at which they are expected to be
realised.
Other provisions
Other provisions comprise among others pension obligations and onerous lease and rental con-
tracts. Pension obligations are recognised on the basis of an actuarial calculated obligation with
all value adjustments included in the income statement as staff expenses. Other provisions are
recognised based on specific calculations.
Outstanding claims
Outstanding claims provisions comprise the estimated expenditure based on actuarial calcula-
tions that the Group expects to incur. The outstanding claims provisions are based on insured
events that have taken place before year end. The estimate includes the direct and indirect
amounts that the Group expects to pay to settle the outstanding claims. The provisions are dis-
counted based on estimates of the payment period.
Liabilities other than provisions
Liabilities other than provisions are recognised as the net proceeds from the loan at the time of
the raising of the loan. In the subsequent periods the debt is measured using amortisation of the
cost price.
Other liabilities are measured at net realisable value.
10

Accounting policies
Cash flow statement
The cash flow statement shows the Group's cash flows for operating, investment and financing
activities for the year divided.
Cash and cash equivalents include cash at bank and in hand, current liabilities with credit institu-
tions and current receivables from and current payables to affiliated companies.
In accordance with section 86, paragraph 4 of the Danish Financial Statements Act no cash flow
statement has been prepared for the parent company.
Segment information
The Group's main activity is retailing. The Group has no other significant activities.
11

Consolidated income statementDKK million
Notes 2014 2013
1 Net revenue 55,905 55,707
Other operating income 394 296
56,299 56,003
Consumption of goods -41,324 -41,082
2 Other external expenses -5,213 -5,514
Gross profit 9,762 9,407
3 Staff expenses -6,569 -6,336
10 Share of result in joint ventures -29 0
Result before depreciations 3,164 3,071
4 Depreciation, amortisation and impairment losses -856 -762
Result before financial items 2,308 2,309
5 Financial income 112 147
6 Financial expenses -168 -124
Result before tax 2,252 2,332
7 Tax on the result for the year -507 -561
Result for the year 1,745 1,771
12

Consolidated balance sheetDKK million
Assets
Notes 31/12 2014 31/12 2013
Software 1,089 511
Development of software 28 560
Goodwill 13 58
Other rights 8 10
8 Intangible assets 1,138 1,139
Land and buildings 16,088 15,812
Fixtures and fittings, tools and equipment 1,351 1,332
Leasehold improvements 306 302
Assets under construction 146 277
9 Property, plant and equipment 17,891 17,723
10 Investments in joint ventures 44 0
Investments 44 0
Total non-current assets 19,073 18,862
Inventories 4,766 4,436
Receivables from affiliated companies 0 7,941
Other receivables 422 187
Corporation tax 90 38
11 Deferred tax asset 293 286
Prepayments 80 91
Receivables 885 8,543
Securities 1,229 5160
Cash at bank and in hand 1,721 1,001
Total current assets 8,601 14,496
Total assets 27,674 33,358
13

Consolidated balance sheetDKK million
Equity and liabilities
Notes 31/12 2014 31/12 2013
Share capital 500 500
Retained earnings 5,907 4,455
Proposed dividends 0 17,615
Total equity 6,407 22,570
11 Deferred tax 199 76
12 Outstanding claims 127 113
12 Other provisions 347 387
Total provisions 673 576
Mortgage credit institutions 10,127 2,832
Loans from affiliated companies 247 0
Other non-current liabilities 176 0
13 Non-current liabilities other than provisions 10,550 2,832
13 Short-term part of non-current liabilities 68 0
Credit institutions and loans 872 135
Trade payables 6,050 4,853
Payables to affiliated companies 948 0
Corporation tax 16 338
Other payables 2,079 2,045
Deferred income 11 9
Current liabilities other than provisions 10,044 7,380
Total liabilities other than provisions 20,594 10,212
Total equity and liabilities 27,674 33,358
14 Contractual obligations and contingencies, etc.
15 Related party disclosures
14

Consolidated statement of changes in equityDKK million
Share capital
Retained
earnings
Proposed
dividends Total
Equity at 1 January 2014 500 4,455 17,615 22,570
Dividends paid -17,615 -17,615
Result for the year 1,745 0 1,745
Foreign currency translation
adjustments, affiliated
companies -127 -127
Cash flow hedges (Interest
rate swaps) -220 -220
Tax on cash flow hedges
(Interest rate swaps) 54 54
Equity at 31 December 2014 500 5,907 0 6,407
15

Consolidated cash flow statementDKK million
Notes 2014 2013
Result before financial items 2,308 2,309
16 Adjustments 788 794
17 Change in working capital 879 428
Cash flows from operating activities before financial items 3,975 3,531
Financial income etc. 43 232
Financial expenses etc. -163 -120
Corporation tax paid -713 -217
Cash flows from operating activities 3,142 3,426
Purchase of intangible assets -163 -351
Purchase of property, plant and equipment -1,087 -1,666
Sale of property, plant and equipment 33 13
Purchase of securities -383 -451
Sale/drawing of securities 468 483
Investment in joint venture -74 0
Cash flows from investment activities -1,206 -1,972
Raising of long-term debt 7,565 0
Repayment of loans from affiliated companies 6,516 125
Dividends distributed to shareholders in the parent company -17,615 -500
Raising of other loans 1 0
Cash flows from financing activities -3,533 -375
Change in cash and cash equivalents for the year -1,597 1,079
Cash and cash equivalents at 1 January 2,279 1,203
Foreign currency translation adjustments etc. -5 -3
Cash and cash equivalents at 31 December 677 2,279
Specified as follows:
Securities 776 0
Cash at bank and in hand 1,721 1,001
Receivables from affiliated companies 0 1,413
Current liabilities - credit institutions and loans -872 -135
Current liabilities - payables to affiliated companies -948 0
677 2,279
16
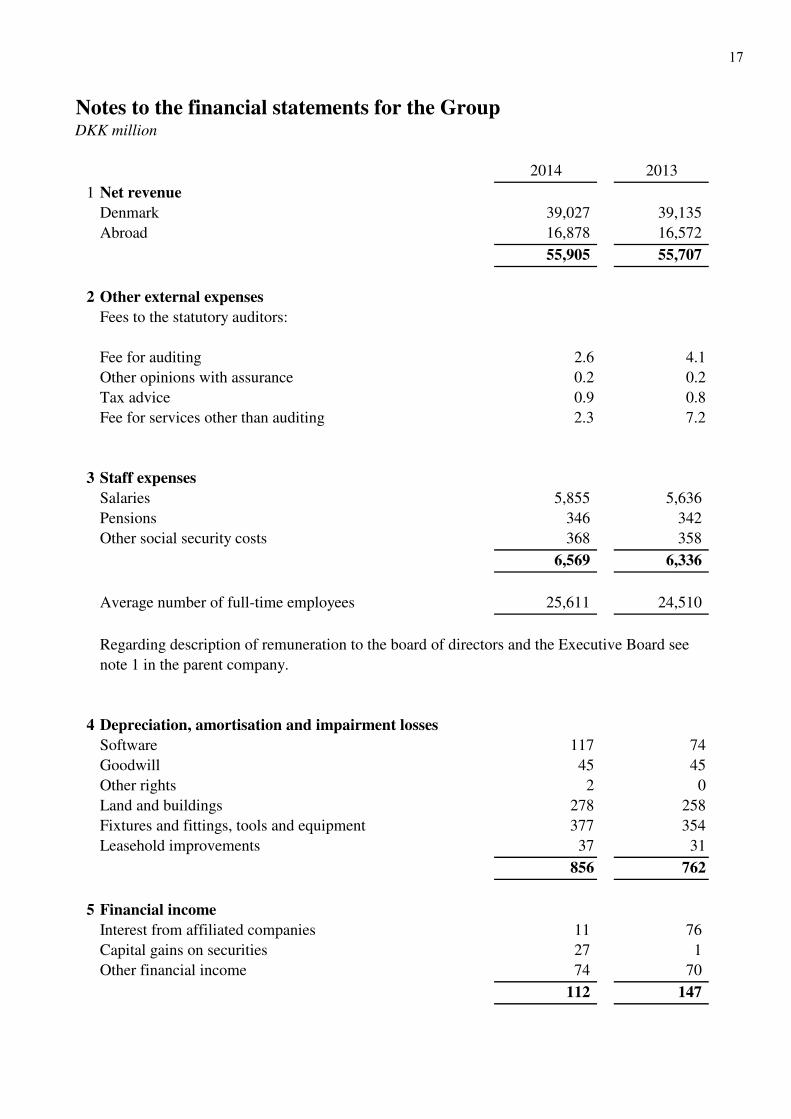
Notes to the financial statements for the GroupDKK million
2014 2013
1 Net revenue
Denmark 39,027 39,135
Abroad 16,878 16,572
55,905 55,707
2 Other external expenses
Fees to the statutory auditors:
Fee for auditing 2.6 4.1
Other opinions with assurance 0.2 0.2
Tax advice 0.9 0.8
Fee for services other than auditing 2.3 7.2
3 Staff expenses
Salaries 5,855 5,636
Pensions 346 342
Other social security costs 368 358
6,569 6,336
Average number of full-time employees 25,611 24,510
4 Depreciation, amortisation and impairment losses
Software 117 74
Goodwill 45 45
Other rights 2 0
Land and buildings 278 258
Fixtures and fittings, tools and equipment 377 354
Leasehold improvements 37 31
856 762
5 Financial income
Interest from affiliated companies 11 76
Capital gains on securities 27 1
Other financial income 74 70
112 147
Regarding description of remuneration to the board of directors and the Executive Board see
note 1 in the parent company.
17

Notes to the financial statements for the GroupDKK million
2014 2013
6 Financial expenses
Interest expense on mortgage loans 88 21
Interest to affiliated companies 1 0
Other financial expenses 79 103
168 124
7 Tax on the result for the year
Current tax for the year 340 401
Adjustment to tax regarding previous years 2 -20
Adjustment of deferred tax for the year 117 59
-5 -18
Adjustment of deferred tax regarding previous years -1 27
Total tax 453 449
Income tax recognised in the income statement 507 561
Income tax recognised in equity -54 -112
453 449
8 Intangible assets
Software
Development
of software Goodwill Other rights
Cost:
1 January 2014 751 560 469 10
Additions during the year 0 163 0 0
Transfers 695 -695 0 0
31 December 2014 1,446 28 469 10
Amortisation and impairment losses:
1 January 2014 -240 0 -411 0
-117 0 -45 -2
31 December 2014 -357 0 -456 -2
Carrying amount at
31 December 2014 1,089 28 13 8
Amortisation for the year
Adjustment of deferred tax at the beginning of the year
due to a change in the corporation tax rate from 25% to
22% (during 2014 - 2016)
18

Notes to the financial statements for the GroupDKK million
9 Property, plant and equipment
Land and
buildings
Fixtures and
fittings, tools
and
equipment
Leasehold
improvements
Assets under
construction
Cost:
1 January 2014 23,264 4,388 1,103 277
Foreign currency
translation adjustments -204 -30 -14 -2
Additions during the year 151 391 47 498
Disposals during the year -97 -143 -13 0
Transfers 628 0 -1 -627
31 December 2014 23,742 4,606 1,122 146
Depreciation and impairment losses:
1 January 2014 -7,452 -3,056 -801 0
Foreign currency
translation adjustments 30 22 7 0
Disposals during the year 48 156 13 0
-294 -377 -31 0
-5 0 -6 0
21 0 0 0
Transfers -2 0 2 0
31 December 2014 -7,654 -3,255 -816 0
16,088 1,351 306 146
Depreciation for the year
Impairment losses for the
year
Reversal of impairment
losses for the year
Carrying amount at 31
December 2014
19
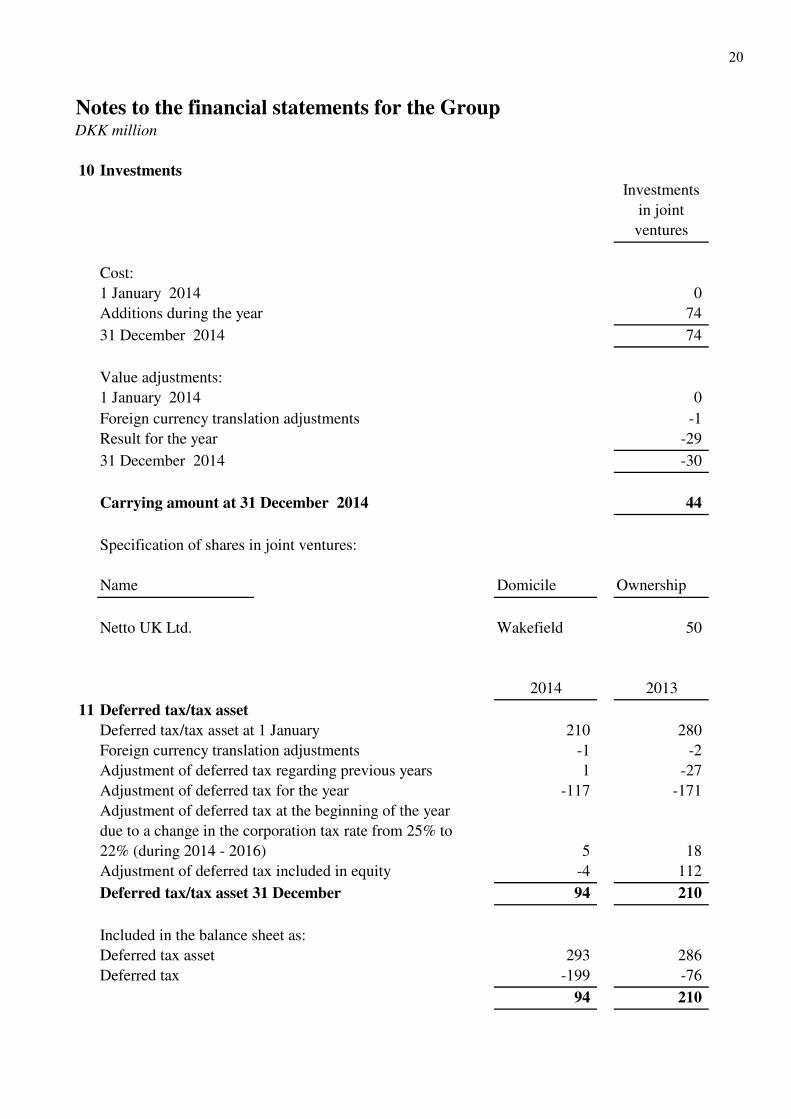
Notes to the financial statements for the GroupDKK million
10 Investments
Investments
in joint
ventures
Cost:
1 January 2014 0
Additions during the year 74
31 December 2014 74
Value adjustments:
1 January 2014 0
Foreign currency translation adjustments -1
Result for the year -29
31 December 2014 -30
Carrying amount at 31 December 2014 44
Specification of shares in joint ventures:
Name Domicile Ownership
Netto UK Ltd. Wakefield 50
2014 2013
11 Deferred tax/tax asset
Deferred tax/tax asset at 1 January 210 280
Foreign currency translation adjustments -1 -2
Adjustment of deferred tax regarding previous years 1 -27
Adjustment of deferred tax for the year -117 -171
5 18
Adjustment of deferred tax included in equity -4 112
Deferred tax/tax asset 31 December 94 210
Included in the balance sheet as:
Deferred tax asset 293 286
Deferred tax -199 -76
94 210
Adjustment of deferred tax at the beginning of the year
due to a change in the corporation tax rate from 25% to
22% (during 2014 - 2016)
20

Notes to the financial statements for the GroupDKK million
2014 2013
11 Deferred tax/tax asset (continued)
Deferred tax/tax asset relates to:
Intangible assets -129 -114
Property, plant and equipment 22 147
Provisions 130 132
Tax loss carryforward 70 43
Others 1 2
94 210
12 Outstanding claims and other provisions
The outstanding claims and other provisions are expected to be payable in:
0-1 years 73 130
> 1 years 401 370
474 500
13 Non-current liabilities other than provisions
Mortgage credit institutions 10,150 2,832
Loans from affiliated companies 247 0
Other non-current liabilities 221 0
10,618 2,832
Short-term part of long-term debt 68 0
Total non-current liabilities other than provisions 10,550 2,832
Due as follows:
Between 1 and 5 years 477 0
After 5 years 10,073 2,832
10,550 2,832
The Group has a deferred tax asset of DKK 71 million at 31 December 2014 that is not
recognised in the balance sheet (31 December 2013: DKK 113 million).
21

Notes to the financial statements for the GroupDKK million
14 Contractual obligations and contingencies, etc.
As of the 11 April 2014 the Danish companies in the Købmand Herman Sallings Fond Group
are jointly taxed. As jointly taxed companies, which are not wholly owned, the companies in
the Dansk Supermarked A/S subgroup have limited and subsidiary liability for Danish
corporation taxes and withholding taxes on dividends, interest and royalties within the joint
taxation group. However, the companies have joint and several unlimited liability for Danish
corporation taxes and withholding taxes on dividends, interest and royalties within the Dansk
Supermarked A/S subgroup. The total net taxes payable to the Danish Central Tax
Administration by the companies included in the joint taxation is disclosed in the annual report
of the administration company (F. Salling Holding A/S, CVR no. 41 94 01 15). Any
subsequent corrections of the taxable income subject to joint taxation or withholding taxes on
dividends etc. may entail that the Companies’ liability will increase.
Until 10 April 2014 the Danish companies in the Group were jointly taxed with A. P. Møller –
Mærsk A/S, and had limited and subsidiary liability for Danish corporation taxes and
withholding taxes on dividends, interest and royalties.
In connection with the REPO-transactions entered into, bonds at the amount of DKK 776
million have been provided as collateral for credit institutions as at 31 December 2014 (31
December 2013: DKK 0 million).
The Group has entered contractual agreements about leasing of properties. The total income
from leaseholds during the contractual lease period is DKK 589 million as of 31 December
2014 (31 December 2013: DKK 563 million).
The Group has entered contractual commitments regarding acquisition and construction of
properties etc. of a total of DKK 914 million (31 December 2013: DKK 748 million).
Leasing commitments (operational leasing) fall due for payment within 5 years with a total of
DKK 74 million (31 December 2013: DKK 118 million).
As security for mortgage loans land and buildings with a carrying amount of DKK 7,928
million have been provided as collateral (31 December 2013: DKK 1,200 million).
Companies in the Group are part of the joint registration with F. Salling A/S and F. Salling
Invest A/S regarding payment of VAT, PAYE taxes etc. and are thus jointly liable for the total
liability of DKK 405 million at 31 December 2014 (31 December 2013: DKK 363 million).
Danish leaseholds normally run for maximum 10 years. Foreign subsidiaries have entered
leaseholds with longer term of notice in accordance with common practice in the individual
countries. Leasing obligations at 31 December 2014 amount to DKK 1,435 million (31
December 2013: DKK 1,296 million).
22

Notes to the financial statements for the GroupDKK million
15 Related party disclosures
2014 2013
16 Cash flow statement - adjustments
Amortisation and impairment losses on intangible assets 164 119
692 643
Gain/loss on disposal of non-current assets -97 -1
Other adjustments 29 33
788 794
17 Cash flow statement - change in working capital
Change in inventories -362 -449
Change in receivables -129 41
Change in prepayments and trade and other payables 1,370 836
879 428
Transactions with related parties take place at arm's length terms.
Depreciation and impairment losses on property, plant and
equipment
23

Parent company
Income statementDKK million
Notes 2014 2013
Net revenue 39,027 39,135
Other operating income 122 122
39,149 39,257
Consumption of goods -27,884 -27,807
Other external expenses -4,744 -5,152
Gross profit 6,521 6,298
1 Staff expenses -5,137 -4,973
8 Share of result in affiliated companies 1,001 958
8 Share of result in joint ventures -29 0
Result before depreciations 2,356 2,283
2 Depreciation, amortisation and impairment losses -397 -333
Result before financial items 1,959 1,950
3 Financial income 176 127
4 Financial expenses -137 -48
Result before tax 1,998 2,029
5 Tax on the result for the year -253 -258
Result for the year 1,745 1,771
Proposal for distribution of the result:
Proposed dividends 0 17,615
Reserve for net revaluation under the equity method 972 958
Retained earnings 773 -16,802
1,745 1,771
24

Parent company
Balance sheetDKK million
Assets
Notes 31/12 2014 31/12 2013
Software 1,089 511
Development of software 28 560
Goodwill 13 18
Other rights 8 10
6 Intangible assets 1,138 1,099
Fixtures and fittings, tools and equipment 948 932
Leasehold improvements 125 125
Assets under construction 16 0
7 Property, plant and equipment 1,089 1,057
Investments in affiliated companies 11,640 14,130
Investments in joint ventures 44 0
8 Investments 11,684 14,130
Total non-current assets 13,911 16,286
Inventories 3,551 3,229
Receivables from affiliated companies 1,702 8,370
Other receivables 214 157
Corporation tax 30 0
Prepayments 16 36
Receivables 1,962 8,563
Securities 4 69
Cash at bank and in hand 1,290 681666
Total current assets 6,807 12,542
Total assets 20,718 28,828
25

Parent company
Balance sheetDKK million
Equity and liabilities
Notes 31/12 2014 31/12 2013
Share capital 500 500
Reserve for net revaluation under the equity method 1,724 4,245
Retained earnings 4,183 210
Proposed dividends 0 17,615
Total equity 6,407 22,570
9 Deferred tax 100 32
10 Other provisions 439 501
Total provisions 539 533
Loans from affiliated companies 247 0
11 Non-current liabilities other than provisions 247 0
Credit institutions and loans 0 1
Trade payables 4,615 3,651
Payables to affiliated companies 7,218 250
Corporation tax 0 179
Other payables 1,680 1,633
Deferred income 12 11
Current liabilities other than provisions 13,525 5,725
Total liabilities other than provisions 13,772 5,725
Total equity and liabilities 20,718 28,828
12 Contractual obligations and contingencies, etc.
13 Related party disclosures
26

Statement of changes in equity for the parent companyDKK million
Share
capital
Reserve for
net
revaluation
under the
equity
method
Retained
earnings
Proposed
dividends Total
Equity at 1 January 2014 500 4,245 210 17,615 22,570
Dividends paid -17,615 -17,615
Result for the year 972 773 0 1,745
Dividend from Group
enterprises -3,200 3,200 0
Changes in equity in
affiliated companies -166 -166
Foreign currency
translation adjustments,
affiliated companies -127 -127
Equity at 31 December
2014 500 1,724 4,183 0 6,407
2 shares of TDKK 1 0
4 shares of TDKK 1 0
2 shares of TDKK 2 0
40 shares of TDKK 5 0
59 shares of TDKK 10 1
2 shares of TDKK 25 0
4 shares of TDKK 50 0
12 shares of TDKK 100 1
9 shares of TDKK 250 2
191 shares of TDKK 500 96
8 shares of TDKK 50000 400
500
The share capital is composed as follows:
There has been no changes in the share capital during the previous 4 years.
27

Notes to the financial statements for the parent companyDKK million
2014 2013
1 Staff expenses
Salaries 4,684 4,528
Pensions 331 325
Other social security costs 122 120
5,137 4,973
Average number of full-time employees 16,784 16,353
The board of directors received no fees.
2 Depreciation, amortisation and impairment losses
Software 117 74
Goodwill 5 5
Other rights 2 0
Fixtures and fittings, tools and equipment 258 241
Leasehold improvements 15 13
397 333
3 Financial income
Interest from affiliated companies 52 112
Capital gains on securities 29 0
Interest rate swaps 22 0
Other financial income 73 15
176 127
4 Financial expenses
Interest to affiliated companies 73 0
Capital losses on securities 0 20
Interest rate swaps 22 0
Other financial expenses 42 28
137 48
Remuneration of the Executive Board is not disclosed in accordance with section 98b(3) of
the Danish Financial Statements Act.
Members of the Executive Committee have been granted an incentive scheme under which a
cash bonus may be paid based upon performance of the Business over the period 2014 –
2018. The cash amount is variable with performance and is expected at approximately one
year’s salary. The estimated amount related to past services is accrued in the financial
statements.
28

Notes to the financial statements for the parent companyDKK million
2014 2013
5 Tax on the result for the year
Current tax for the year 186 178
Adjustment to tax regarding previous years 1 -9
Adjustment of deferred tax for the year 70 89
Adjustment of deferred tax regarding previous years 0 9
-4 -9
253 258
6 Intangible assets
Software
Development
of software Goodwill Other rights
Cost:
1 January 2014 751 560 48 10
Additions during the year 0 163 0 0
Transfers 695 -695 0 0
31 December 2014 1,446 28 48 10
Amortisation and impairment losses:
1 January 2014 -240 0 -30 0
-117 0 -5 -2
31 December 2014 -357 0 -35 -2
Carrying amount at
31 December 2014 1,089 28 13 8
Adjustment of deferred tax at the beginning of the year
due to a change in the corporation tax rate from 25% to
22% (during 2014 - 2016)
Amortisation for the year
29

Notes to the financial statements for the parent companyDKK million
7 Property, plant and equipment
Fixtures and
fittings, tools
and
equipment
Leasehold
improvements
Assets under
construction
Cost:
1 January 2014 3,108 668 0
Additions during the year 275 15 16
Disposals during the year -127 -1 0
Transfers 0 0 0
31 December 2014 3,256 682 16
Depreciation and impairment losses:
1 January 2014 -2,176 -543 0
Disposals during the year 126 1 0
-258 -15 0
31 December 2014 -2,308 -557 0
948 125 16Carrying amount at 31 December 2014
Depreciation for the year
30

Notes to the financial statements for the parent companyDKK million
8 Investments
Investments
in joint
ventures
Investments in
affiliated
companies
Cost:
1 January 2014 0 9,885
Additions during the year 74 1
31 December 2014 74 9,886
Value adjustments:
1 January 2014 0 4,245
Foreign currency translation adjustments -1 -126
Deferred tax related to the purchase of minority interests 0 -166
Dividends distributed 0 -3,200
Result for the year -29 1,001
31 December 2014 -30 1,754
Carrying amount at 31 December 2014 44 11,640
Specification of shares in affiliated companies and joint ventures:
Name Domicile Ownership
Netto Supermarkt GmbH Stavenhagen 100
Netto Sp. Z o.o Szczecin 100
Netto Marknad AB Halmstad 100
Netto Fastigheter AB Halmstad 100
NETTO Ukraine LLC Lviv 99
Orbita Property LLC. Lviv 100
FutureExpress Ltd. Leeds 100
Dansk Supermarked Ejendomme A/S Højbjerg 100
D. S. Forsikring A/S Højbjerg 100
Dansk Netto Deutschland ApS Højbjerg 100
Netto UK Ltd. Wakefield 50
31

Notes to the financial statements for the parent companyDKK million
2014 2013
9 Deferred tax/tax asset
Deferred tax/tax asset at 1 January 32 -57
Adjustment of deferred tax/tax asset for the year 70 89
-4 -9
2 9
Deferred tax/tax asset at 31 December 100 32
Deferred tax/tax asset relates to:
Intangible assets 246 213
Property, plant and equipment -50 -74
Provisions -96 -107
100 32
10 Outstanding claims and other provisions
The outstanding claims and other provisions are expected to be payable in:
0-1 years 21 120
> 1 years 418 381
439 501
11 Non-current liabilities other than provisions
12 Contractual obligations and contingencies, etc.
Guarantees of DKK 5 million have been provided for foreign subsidiaries' credit institutions
(31 December 2013: DKK 5 million).
Adjustment of deferred tax at the beginning of the year
due to a change in the corporation tax rate from 25% to
22% (during 2014 - 2016)
Guarantees of DKK 97 million have been provided for Group enterprises' leasing obligations
(31 December 2013: DKK 42 million).
Leaseholds with affiliated companies usually run for 20 years, and amounts to DKK 6,276
million as at 31 December 2014 (31 December 2013: DKK 5,340 million).
Leaseholds with external parties usually run for maximum 10 years, and amounts to DKK
404 million as at 31 December 2014 (31 December 2013: DKK 366 million).
The loans from affiliated companies falls due between 1 and 5 years. (31 December 2013:
DKK 0 million).
Adjustment of deferred tax/tax asset regarding previous
years
32
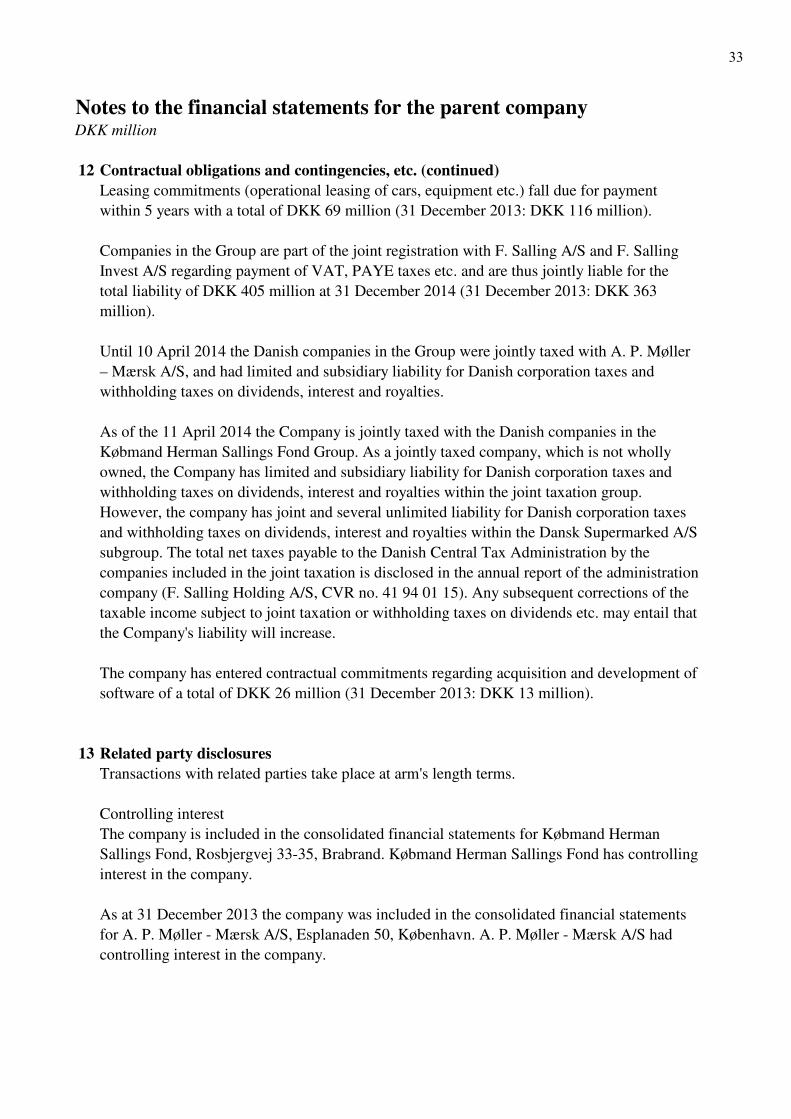
Notes to the financial statements for the parent companyDKK million
12 Contractual obligations and contingencies, etc. (continued)
13 Related party disclosures
Controlling interest
Transactions with related parties take place at arm's length terms.
Until 10 April 2014 the Danish companies in the Group were jointly taxed with A. P. Møller
– Mærsk A/S, and had limited and subsidiary liability for Danish corporation taxes and
withholding taxes on dividends, interest and royalties.
The company has entered contractual commitments regarding acquisition and development of
software of a total of DKK 26 million (31 December 2013: DKK 13 million).
Leasing commitments (operational leasing of cars, equipment etc.) fall due for payment
within 5 years with a total of DKK 69 million (31 December 2013: DKK 116 million).
As of the 11 April 2014 the Company is jointly taxed with the Danish companies in the
Købmand Herman Sallings Fond Group. As a jointly taxed company, which is not wholly
owned, the Company has limited and subsidiary liability for Danish corporation taxes and
withholding taxes on dividends, interest and royalties within the joint taxation group.
However, the company has joint and several unlimited liability for Danish corporation taxes
and withholding taxes on dividends, interest and royalties within the Dansk Supermarked A/S
subgroup. The total net taxes payable to the Danish Central Tax Administration by the
companies included in the joint taxation is disclosed in the annual report of the administration
company (F. Salling Holding A/S, CVR no. 41 94 01 15). Any subsequent corrections of the
taxable income subject to joint taxation or withholding taxes on dividends etc. may entail that
the Company's liability will increase.
The company is included in the consolidated financial statements for Købmand Herman
Sallings Fond, Rosbjergvej 33-35, Brabrand. Købmand Herman Sallings Fond has controlling
interest in the company.
As at 31 December 2013 the company was included in the consolidated financial statements
for A. P. Møller - Mærsk A/S, Esplanaden 50, København. A. P. Møller - Mærsk A/S had
controlling interest in the company.
Companies in the Group are part of the joint registration with F. Salling A/S and F. Salling
Invest A/S regarding payment of VAT, PAYE taxes etc. and are thus jointly liable for the
total liability of DKK 405 million at 31 December 2014 (31 December 2013: DKK 363
million).
33

Notes to the financial statements for the parent companyDKK million
13 Related party disclosures (continued)
The following shareholders own more than 5% of the share capital:
F. Salling Holding A/S, Rosbjergvej 33-35, Brabrand
F. Salling Invest A/S, Rosbjergvej 33-35, Brabrand
A.P. Møller - Mærsk A/S, Esplanaden 50, København
Ownership
34


![C LAUS B RABRAND © C ONCURRENCY (Q3,’06) J AN 19, 2006 C ONCURRENCY Claus Brabrand brabrand@daimi.au.dk [ brabrand/ ]brabrand](https://img.pdfslide.net/doc/110x75/56649d245503460f949fb1be/c-laus-b-rabrand-c-oncurrency-q306-j-an-19-2006-c-oncurrency-claus.jpg)

![Claus Brabrand, ITU, Denmark Feb 09, 2010BLACK-BOX TESTING Førsteårsprojekt (F2010) Claus Brabrand [ brabrand@itu.dk ] IT University of Copenhagen](https://img.pdfslide.net/doc/110x75/56649d565503460f94a3412f/claus-brabrand-itu-denmark-feb-09-2010black-box-testing-forstearsprojekt.jpg)
![Claus Brabrand, ITU, Denmark Mar 17, 2009Graphs & Graph Algorithms Claus Brabrand [ brabrand@itu.dk ] ( “FÅP”: First-year Project Course, ITU, Denmark](https://img.pdfslide.net/doc/110x75/56649d635503460f94a46587/claus-brabrand-itu-denmark-mar-17-2009graphs-graph-algorithms-claus-brabrand.jpg)
![C LAUS B RABRAND © C ONCURRENCY (Q3,’07) F EB 05, 2007 C ONCURRENCY Claus Brabrand brabrand@daimi.au.dk [ brabrand/ ]](https://img.pdfslide.net/doc/110x75/56649d235503460f949f97df/c-laus-b-rabrand-c-oncurrency-q307-f-eb-05-2007-c-oncurrency-claus.jpg)

![Claus Brabrand, ITU, Denmark Feb 02, 2010TESTING Førsteårsprojekt (F2010) Claus Brabrand [ brabrand@itu.dk ] IT University of Copenhagen](https://img.pdfslide.net/doc/110x75/56649c785503460f9492d6d3/claus-brabrand-itu-denmark-feb-02-2010testing-forstearsprojekt-f2010.jpg)