Embed Size (px)
DESCRIPTION
This seminar is a complete "how-to" instructional guide for planning, designing, implementing, using, and maintaining performance Dashboards.
Citation preview
TECHNOLOGY TRANSFER PRESENTS
DASHBOARDIs it the new face of
Business Intelligence?
SHAKUATRE
APRIL 13-14, 2011RESIDENZA DI RIPETTA - VIA DI RIPETTA, 231
ROME (ITALY)
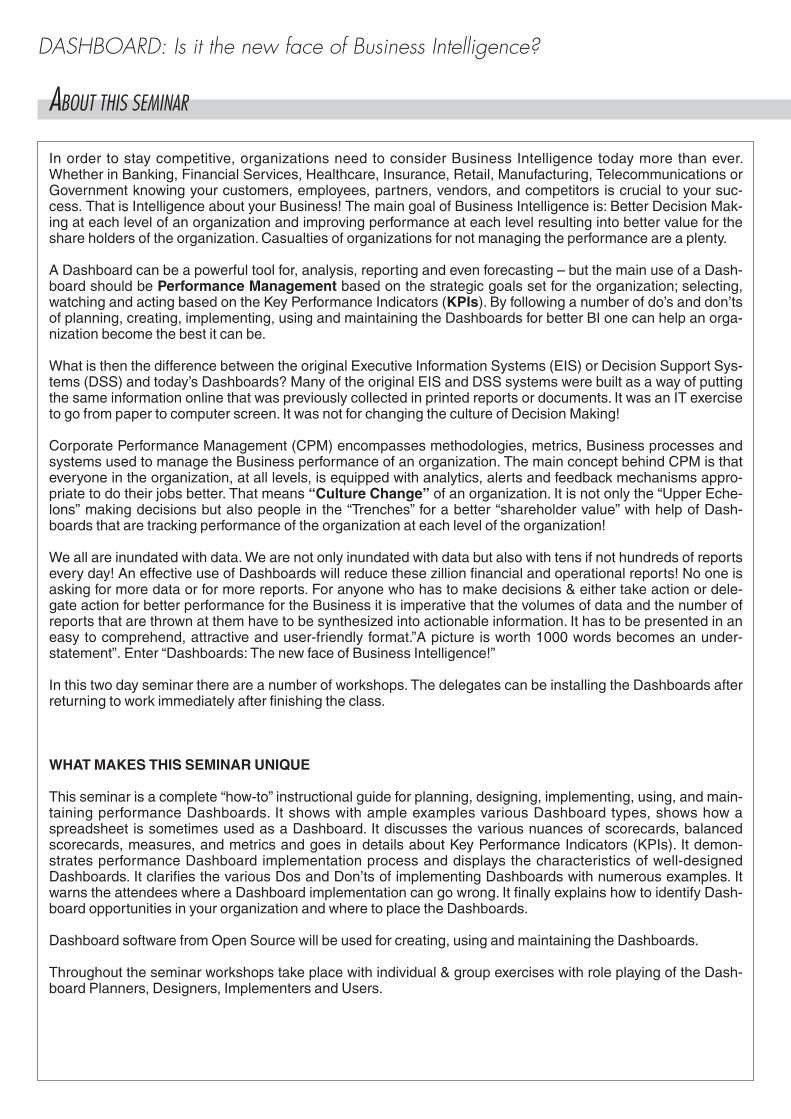
DASHBOARD: Is it the new face of Business Intelligence?
ABOUT THIS SEMINAR
In order to stay competitive, organizations need to consider Business Intelligence today more than ever.Whether in Banking, Financial Services, Healthcare, Insurance, Retail, Manufacturing, Telecommunications orGovernment knowing your customers, employees, partners, vendors, and competitors is crucial to your suc-cess. That is Intelligence about your Business! The main goal of Business Intelligence is: Better Decision Mak-ing at each level of an organization and improving performance at each level resulting into better value for theshare holders of the organization.Casualties of organizations for not managing the performance are a plenty.
A Dashboard can be a powerful tool for, analysis, reporting and even forecasting – but the main use of a Dash-board should be Performance Management based on the strategic goals set for the organization; selecting,watching and acting based on the Key Performance Indicators (KPIs). By following a number of do’s and don’tsof planning, creating, implementing, using and maintaining the Dashboards for better BI one can help an orga-nization become the best it can be.
What is then the difference between the original Executive Information Systems (EIS) or Decision Support Sys-tems (DSS) and today’s Dashboards? Many of the original EIS and DSS systems were built as a way of puttingthe same information online that was previously collected in printed reports or documents. It was an IT exerciseto go from paper to computer screen. It was not for changing the culture of Decision Making!
Corporate Performance Management (CPM) encompasses methodologies, metrics, Business processes andsystems used to manage the Business performance of an organization. The main concept behind CPM is thateveryone in the organization, at all levels, is equipped with analytics, alerts and feedback mechanisms appro-priate to do their jobs better. That means “Culture Change” of an organization. It is not only the “Upper Eche-lons” making decisions but also people in the “Trenches” for a better “shareholder value” with help of Dash-boards that are tracking performance of the organization at each level of the organization!
We all are inundated with data.We are not only inundated with data but also with tens if not hundreds of reportsevery day! An effective use of Dashboards will reduce these zillion financial and operational reports! No one isasking for more data or for more reports. For anyone who has to make decisions & either take action or dele-gate action for better performance for the Business it is imperative that the volumes of data and the number ofreports that are thrown at them have to be synthesized into actionable information. It has to be presented in aneasy to comprehend, attractive and user-friendly format.”A picture is worth 1000 words becomes an under-statement”. Enter “Dashboards: The new face of Business Intelligence!”
In this two day seminar there are a number of workshops. The delegates can be installing the Dashboards afterreturning to work immediately after finishing the class.
WHATMAKES THIS SEMINAR UNIQUE
This seminar is a complete “how-to” instructional guide for planning, designing, implementing, using, and main-taining performance Dashboards. It shows with ample examples various Dashboard types, shows how aspreadsheet is sometimes used as a Dashboard. It discusses the various nuances of scorecards, balancedscorecards, measures, and metrics and goes in details about Key Performance Indicators (KPIs). It demon-strates performance Dashboard implementation process and displays the characteristics of well-designedDashboards. It clarifies the various Dos and Don’ts of implementing Dashboards with numerous examples. Itwarns the attendees where a Dashboard implementation can go wrong. It finally explains how to identify Dash-board opportunities in your organization and where to place the Dashboards.
Dashboard software from Open Source will be used for creating, using and maintaining the Dashboards.
Throughout the seminar workshops take place with individual & group exercises with role playing of the Dash-board Planners, Designers, Implementers and Users.
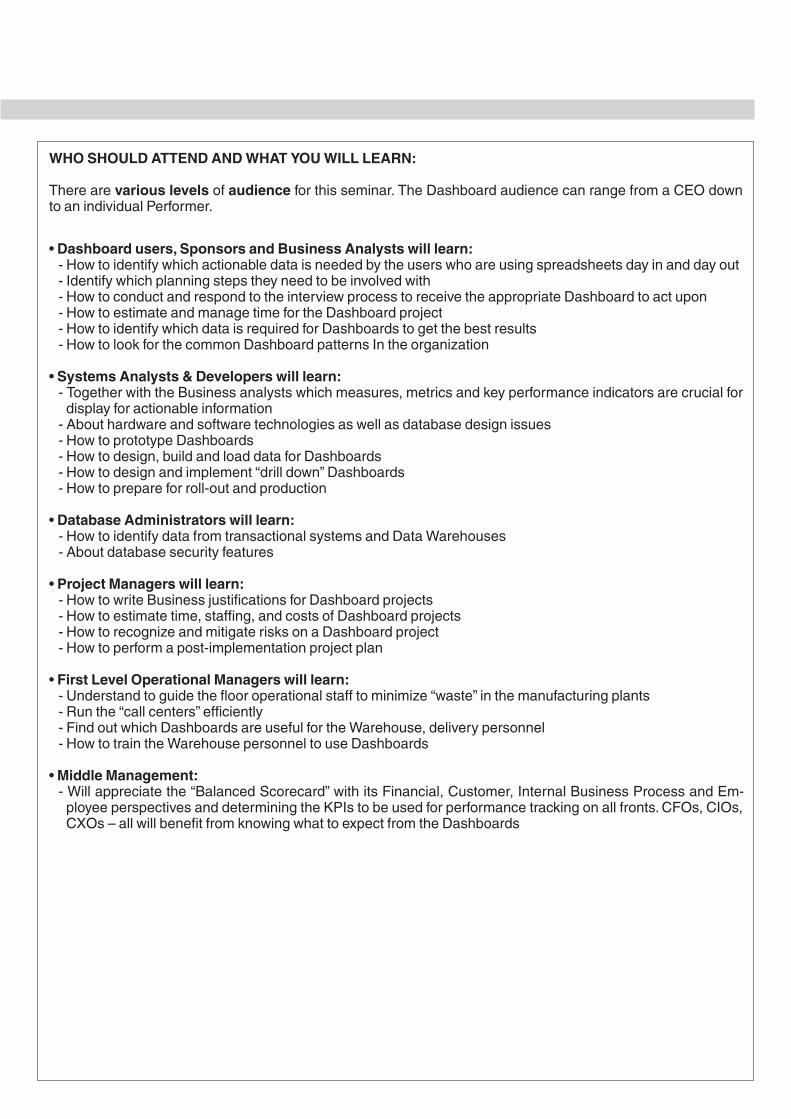
WHO SHOULD ATTEND ANDWHAT YOUWILL LEARN:
There are various levels of audience for this seminar. The Dashboard audience can range from a CEO downto an individual Performer.
• Dashboard users, Sponsors and Business Analysts will learn:- How to identify which actionable data is needed by the users who are using spreadsheets day in and day out- Identify which planning steps they need to be involved with- How to conduct and respond to the interview process to receive the appropriate Dashboard to act upon- How to estimate and manage time for the Dashboard project- How to identify which data is required for Dashboards to get the best results- How to look for the common Dashboard patterns In the organization
• Systems Analysts & Developers will learn:- Together with the Business analysts which measures, metrics and key performance indicators are crucial fordisplay for actionable information- About hardware and software technologies as well as database design issues- How to prototype Dashboards- How to design, build and load data for Dashboards- How to design and implement “drill down” Dashboards- How to prepare for roll-out and production
• Database Administrators will learn:- How to identify data from transactional systems and Data Warehouses- About database security features
• Project Managers will learn:- How to write Business justifications for Dashboard projects- How to estimate time, staffing, and costs of Dashboard projects- How to recognize and mitigate risks on a Dashboard project- How to perform a post-implementation project plan
• First Level Operational Managers will learn:- Understand to guide the floor operational staff to minimize “waste” in the manufacturing plants- Run the “call centers” efficiently- Find out which Dashboards are useful for the Warehouse, delivery personnel- How to train the Warehouse personnel to use Dashboards
•Middle Management:- Will appreciate the “Balanced Scorecard” with its Financial, Customer, Internal Business Process and Em-ployee perspectives and determining the KPIs to be used for performance tracking on all fronts. CFOs, CIOs,CXOs – all will benefit from knowing what to expect from the Dashboards
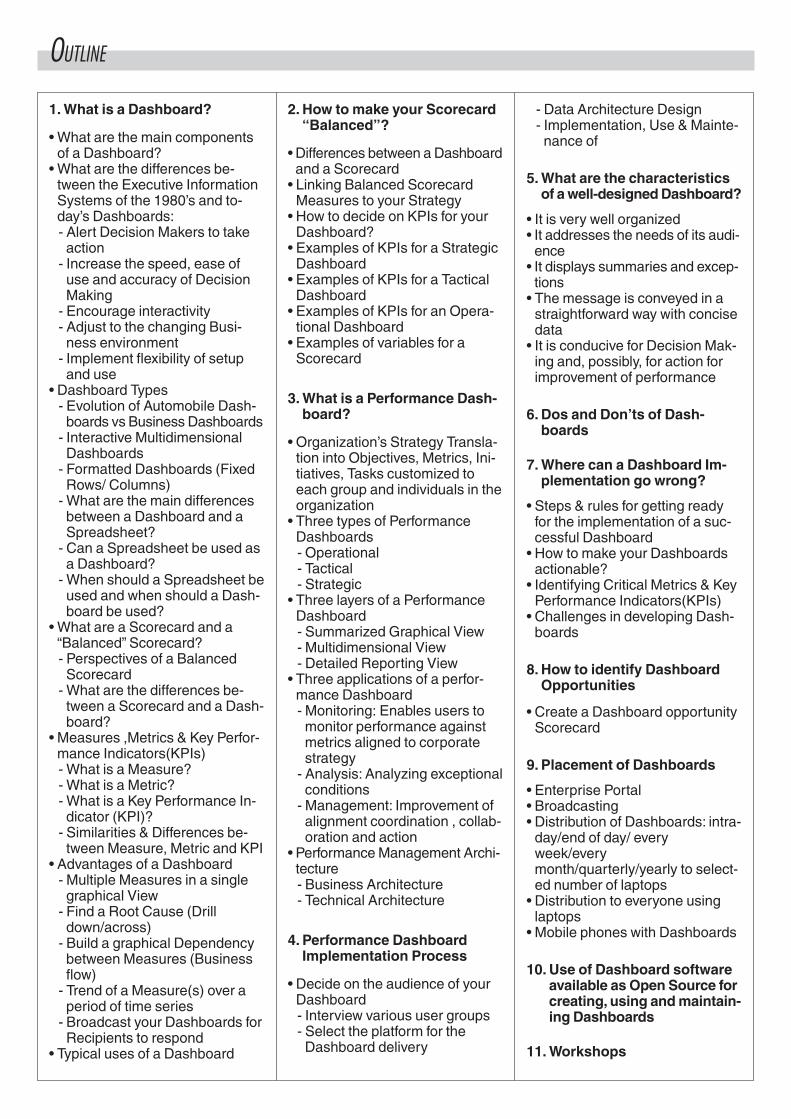
OUTLINE
1.What is a Dashboard?
• What are the main componentsof a Dashboard?• What are the differences be-tween the Executive InformationSystems of the 1980’s and to-day’s Dashboards:- Alert Decision Makers to takeaction- Increase the speed, ease ofuse and accuracy of DecisionMaking- Encourage interactivity- Adjust to the changing Busi-ness environment- Implement flexibility of setupand use
• Dashboard Types- Evolution of Automobile Dash-boards vs Business Dashboards- Interactive MultidimensionalDashboards- Formatted Dashboards (FixedRows/ Columns)- What are the main differencesbetween a Dashboard and aSpreadsheet?- Can a Spreadsheet be used asa Dashboard?- When should a Spreadsheet beused and when should a Dash-board be used?
• What are a Scorecard and a“Balanced” Scorecard?- Perspectives of a BalancedScorecard- What are the differences be-tween a Scorecard and a Dash-board?
• Measures ,Metrics & Key Perfor-mance Indicators(KPIs)- What is a Measure?- What is a Metric?- What is a Key Performance In-dicator (KPI)?- Similarities & Differences be-tween Measure, Metric and KPI
• Advantages of a Dashboard- Multiple Measures in a singlegraphical View- Find a Root Cause (Drilldown/across)- Build a graphical Dependencybetween Measures (Businessflow)- Trend of a Measure(s) over aperiod of time series- Broadcast your Dashboards forRecipients to respond
• Typical uses of a Dashboard
2. How to make your Scorecard“Balanced”?
• Differences between aDashboardand a Scorecard• Linking Balanced ScorecardMeasures to your Strategy• How to decide on KPIs for yourDashboard?• Examples of KPIs for a StrategicDashboard• Examples of KPIs for a TacticalDashboard• Examples of KPIs for an Opera-tional Dashboard• Examples of variables for aScorecard
3.What is a Performance Dash-board?
• Organization’s Strategy Transla-tion into Objectives, Metrics, Ini-tiatives, Tasks customized toeach group and individuals in theorganization• Three types of PerformanceDashboards- Operational- Tactical- Strategic• Three layers of a PerformanceDashboard- Summarized Graphical View- Multidimensional View- Detailed Reporting View• Three applications of a perfor-mance Dashboard- Monitoring: Enables users tomonitor performance againstmetrics aligned to corporatestrategy- Analysis: Analyzing exceptionalconditions- Management: Improvement ofalignment coordination , collab-oration and action
• PerformanceManagement Archi-tecture- Business Architecture- Technical Architecture
4. Performance DashboardImplementation Process
• Decide on the audience of yourDashboard- Interview various user groups- Select the platform for theDashboard delivery
- Data Architecture Design- Implementation, Use & Mainte-nance of
5.What are the characteristicsof awell-designedDashboard?
• It is very well organized• It addresses the needs of its audi-ence• It displays summaries and excep-tions• The message is conveyed in astraightforward way with concisedata• It is conducive for Decision Mak-ing and, possibly, for action forimprovement of performance
6. Dos and Don’ts of Dash-boards
7.Where can a Dashboard Im-plementation go wrong?
• Steps & rules for getting readyfor the implementation of a suc-cessful Dashboard• How to make your Dashboardsactionable?• Identifying Critical Metrics & KeyPerformance Indicators(KPIs)• Challenges in developing Dash-boards
8. How to identify DashboardOpportunities
• Create a Dashboard opportunityScorecard
9. Placement of Dashboards
• Enterprise Portal• Broadcasting• Distribution of Dashboards: intra-day/end of day/ everyweek/everymonth/quarterly/yearly to select-ed number of laptops• Distribution to everyone usinglaptops• Mobile phones with Dashboards
10. Use of Dashboard softwareavailable as Open Source forcreating, using andmaintain-ing Dashboards
11.Workshops

SHAKU ATREDASHBOARDIS IT THE NEW FACE OF BUSINESSINTELLIGENCE?
April 13-14, 2011Residenza di RipettaVia di Ripetta, 231Rome (Italy)
Registration fee:€ 1200
If registered participants are unable to attend,or in case of cancellation of the seminar, thegeneral conditions mentioned before areapplicable.
first name ...............................................................
surname .................................................................
job title ...................................................................
organisation ...........................................................
address ..................................................................
postcode ................................................................
city .........................................................................
country ...................................................................
telephone ...............................................................
fax ..........................................................................
e-mail .....................................................................
�
Send your registration formwith the receipt of the payment to:Technology Transfer S.r.l.Piazza Cavour, 3 - 00193 Rome (Italy)Tel. +39-06-6832227 - Fax +39-06-6871102info@technologytransfer.itwww.technologytransfer.it
Stamp and signature
INFORMATION
PARTICIPATION FEE
€ 1200
The fee includes all seminardocumentation, luncheon and coffeebreaks.
VENUE
Residenza di RipettaVia di Ripetta, 231Rome (Italy)
SEMINAR TIMETABLE
9.30 am - 1.00 pm2.00 pm - 5.00 pm
HOW TO REGISTER
You must send the registration form withthe receipt of the payment to:TECHNOLOGY TRANSFER S.r.l.Piazza Cavour, 3 - 00193 Rome (Italy)Fax +39-06-6871102
withinMarch 29, 2011
PAYMENT
Wire transfer to:Technology Transfer S.r.l.Banca Intesa Sanpaolo S.p.A.Agenzia 6787 di RomaIban Code:IT 34 Y 03069 05039 048890270110
GENERAL CONDITIONS
GROUP DISCOUNT
If a company registers 5 participants tothe same seminar, it will pay only for 4.Those who benefit of this discount are notentitled to other discounts for the sameseminar.
EARLY REGISTRATION
The participants who will register 30 daysbefore the seminar are entitled to a 5%discount.
CANCELLATION POLICY
A full refund is given for any cancellationreceived more than 15 days before theseminar starts. Cancellations less than15 days prior the event are liable for 50%of the fee. Cancellations less than oneweek prior to the event date will be liablefor the full fee.
CANCELLATION LIABILITY
In the case of cancellation of an event forany reason, Technology Transfer’sliability is limited to the return of theregistration fee only.

Shaku Atre is an Exceptional Speaker, has the reputation of capturing the attention of audiences and main-taining their interest while guiding her listeners painlessly through sophisticated material. Ms. Atre is Presidentof Atre Group Inc. and of a leading consulting, training and publishing company, specializing in Business Intelli-gence. Before heading her present company, Ms. Atre was a Partner with Price Waterhouse Coopers. She alsohas fourteen years of experience in various fields with IBM. Ms. Atre is an acknowledged expert in the DataWarehousing and database field. She has extensive practical experience in database projects, has helped anumber of clients in establishing successful Data Warehouses, Client/Server installations, and has taught atIBM’s prestigious Systems Research Institute. She has lectured on the subject to professional organizations inthe USA, Canada as well as in Europe, Asia and South America. Ms. Atre is frequently quoted in Computer-world, Information Week, Information Management, Tech Web, and other influential computer trade publica-tions. She has written an award- winning outstanding book on database Management systems that has be-come a classic on the subject: “Database: Structured Techniques for Design, Performance and Manage-ment”, published by John Wiley and Sons, New York. The book has sold over 250,000 copies (not including itsSpanish and Russian translations) and has been selected by several book clubs and leading universities in-cluding Harvard, Columbia, Cornell, MIT, New York University, Stanford and U.C. Berkeley. Her book, “Infor-mation Center: Strategies and Case Studies”, published by Atre International Consultants Inc., is also verywell received by the industry. “Database Management Systems” is another successful book authored byShaku Atre. Her fourth book, Distributed Databases, Cooperative Processing & Networking, was pub-lished by McGraw-Hill. She has also authored a very well received book: “Atre’s Roadmap for Data Ware-house/Data mart Implementations” published by Gartner Group. She is co-author of her latest BI book on“Business Intelligence Roadmap: The Complete Project Lifecycle for Decision-Support Applications“published by Addison Wesley.
SPEAKER