Embed Size (px)
Citation preview

Dassault Systèmes Reports Solid Q3 and Upgrades Q4 and Full Year 2012 Financial Objectives
Paris, France - October 25, 2012 — Dassault Systèmes (Euronext Paris: #13065, DSY.PA), the 3DEXPERIENCE Company, world leader in 3D design software, 3D Digital Mock Up and Product Lifecycle Management (PLM) solutions, today reports IFRS unaudited financial results for the third quarter and nine months ended September 30, 2012. These results were reviewed by the Company’s Board of Directors on October 24, 2012.
Summary Highlights
(unaudited)
Q3 non-IFRS software revenue up 10% in constant currencies and non-IFRS EPS up 16%
Year-to-date, software and total revenue up 10% in constant currencies, EPS up 15%
Year-to-date, net operating cash flow up 23% to €469 million
Upgrades FY 2012 Revenue objective: €2.02 - €2.03 billion, +9-10% at constant currencies vs. FY 2011 and EPS objective: €3.30 - €3.35, +13-15% vs. FY 2011
2012 Third Quarter Financial Summary
(unaudited)
*In constant currencies.
“2012 represents the beginning of a new horizon for Dassault Systèmes as we look to our next decade of growth with our 3DEXPERIENCE platform,” commented Bernard Charlès, Dassault Systèmes President and Chief Executive Officer.
Change Change in cc* Change Change in cc*
Q3 Total Revenue 499.5 15% 8% 505.0 17% 10%
Q3 Software Revenue 454.7 15% 8% 460.2 17% 10%
Q3 EPS 0.66 6% 0.89 16%
Q3 Operating Margin 22.3% 32.6%
In millions of Euros, except per share dataIFRS Non-IFRS

2
“Responding to the demand of our customers, we are developing new industry-specific solutions, based on our V6 architecture. Well attuned with our clients’ critical processes, these solutions bring customers the significant values of simplification and integration at both the enterprise and end-user level. Moreover, they will benefit rapidly from all the potential of our Industry Solutions Experience, which are providing them with measurable advantages and a quick return on investment. “Finally, as our results to date in 2012 demonstrate, we have made important investments to support our industry solutions, while also delivering a good financial performance, thanks to our 10,000 high-talented employees working closely with our large and fast-growing network of partners.”
2012 Third Quarter Financial Summary (unaudited)
*In constant currencies.
IFRS total revenue increased 8% and non-IFRS total revenue increased 10% in constant currencies. The 2012 third quarter includes the acquisition of Gemcom. Excluding the Gemcom acquisition (under the new brand name, GEOVIA) and the sale of Transcat PLM GmbH, Dassault Systèmes non-IFRS software revenue growth would have been about 8% in constant currencies.
By region and in constant currencies, non-IFRS revenue growth was strongest in Asia, increasing 18%, reflecting growth across a number of countries including China and Japan, among others. In the Americas, non-IFRS revenue increased 13% with an improving performance in both North America and Latin America in the quarter. Non-IFRS software revenue growth in Europe was 3%, on a strong year-ago comparison, as well as some softness, particularly in South Europe. Higher growth countries revenue increased by 20%.
Services and other revenue increased 9% in constant currencies.
New licenses revenue in the third quarter increased 10% in constant currencies led by CATIA and SIMULIA and included the contribution of Gemcom.
Q3 2012 Q3 2011 Change in cc* Q3 2012 Q3 2011 Change in cc*
Total Revenue 499.5 432.8 8% 505.0 432.9 10%
Software Revenue 454.7 394.2 8% 460.2 394.3 10%
Services and other Revenue 44.8 38.6 9% 44.8 38.6 9%
PLM software Revenue 354.8 309.8 8% 360.3 309.9 10%
SOLIDWORKS software Revenue 99.9 84.4 9% 99.9 84.4 9%
Americas 146.1 116.0 12% 147.7 116.0 13%
Europe 210.8 200.6 2% 211.9 200.7 3%
Asia 142.6 116.2 16% 145.4 116.2 18%
In millions of EurosIFRS Non-IFRS

3
The business dynamic was also strong in rental licensing, with a 14% revenue increase in constant currencies, principally driven by strong growth for SIMULIA and regionally led by rental demand in Europe.
Recurring software revenue increased 8% (IFRS) and 10% (non-IFRS) in constant currencies, reflecting growth in maintenance and rental licensing activity.
IFRS PLM software revenue increased 8%. Non-IFRS PLM software revenue increased 10% led by Other PLM, with SIMULIA up double-digits and including the addition of Gemcom; CATIA was higher by 5% with double-digits new licenses revenue growth and ENOVIA software revenue growth by 3% (all growth comparisons in constant currencies).
SOLIDWORKS software revenue increased 9% in constant currencies on strong growth in recurring software revenue. New SOLIDWORKS commercial seats licensed in the quarter increased 2% to 11,984.
IFRS operating income increased 3.0% to €111.4 million and IFRS earnings per diluted share increased 6% to €0.66. Non-IFRS earnings per diluted share increased 16% on revenue and operating income growth, as well as operating margin expansion, offset in part by an increase in the effective tax rate. Specifically, non-IFRS EPS increased to €0.89 from €0.77, with operating income growth of 19% to €164.6 million and operating margin growth of 60 basis points to 32.6%.
The Company’s non-IFRS effective tax rate increased to 32.8% from 30.5% in the year-
ago quarter, notably on a higher corporate income tax rate in France.
2012 Nine-Month Financial Summary
(unaudited)
*In constant currencies.
Change Change in cc* Change Change in cc*
2012 YTD Total Revenue 1,464.8 15% 10% 1,470.3 16% 10%
2012 YTD Software Revenue 1,332.4 15% 10% 1,337.9 16% 10%
2012 YTD EPS 1.90 15% 2.36 15%
2012 YTD Operating Margin 23.5% 30.4%
In millions of Euros, except per share dataIFRS Non-IFRS

4
*In constant currencies.
Both total revenue and software revenue increased 10% (IFRS and non-IFRS) in constant currencies reflecting broad-based strength. Services and other revenue increased 9% in constant currencies, principally reflecting growth in V6 services activities. The services gross margin is improving at 4.2%.
IFRS operating income increased 17.7% to €344.0 million and the operating margin improved 50 basis points to 23.5%. On a non-IFRS basis, operating income increased 19.3% to €446.9 million. The non-IFRS operating margin improved 90 basis points to 30.4%, with approximately two-thirds of the improvement from operating leverage.
IFRS net income per diluted share increased 15.2% to €1.90 and non-IFRS net income per diluted share increased 15.1% to €2.36 per share.
New licenses revenue increased 12% in constant currencies for the first nine months of
2012 on broad support by the Company’s brands.
Recurring software revenue increased 9% (IFRS and non-IFRS) in constant currencies on strong growth in both maintenance and rental revenue. Recurring software revenue represented 72% of total software revenue.
IFRS and non-IFRS PLM software revenue increased 9%. CATIA software revenue increased 6% with double-digit growth in new licenses revenue. ENOVIA software revenue was higher by 9% on strong growth in V6 software sales and industry diversification. Other PLM, led by strong growth at SIMULIA, and including the acquisition of Gemcom, increased 15% (IFRS) and 18% (non-IFRS). (All growth comparisons in constant currencies.)
SOLIDWORKS software revenue increased 12% in constant currencies. New commercial seats licensed increased 10% to over 39,000 seats.
2012 YTD 2011 YTD Change in cc* 2012 YTD 2011 YTD Change in cc*
Total Revenue 1,464.8 1,270.9 10% 1,470.3 1,271.4 10%
Software Revenue 1,332.4 1,154.8 10% 1,337.9 1,155.3 10%
Services and other Revenue 132.4 116.1 9% 132.4 116.1 9%
PLM software Revenue 1,032.6 904.9 9% 1,038.1 905.4 9%
SOLIDWORKS software Revenue 299.8 249.9 12% 299.8 249.9 12%
Americas 411.7 353.1 6% 413.3 353.2 7%
Europe 643.1 575.8 10% 644.2 575.9 10%
Asia 410.0 342.0 13% 412.8 342.3 14%
In millions of EurosIFRS Non-IFRS

5
Cash Flow and Other Financial Highlights Net operating cash flow increased 14.1% to €115.4 million in the 2012 third quarter, compared to €101.1 million in the year-ago third quarter, reflecting principally growth in net income and working capital change. For the 2012 nine-month period, net operating cash flow was €469.2 million, increasing 22.7% in comparison to €382.4 million for the 2011 nine-month period. During the 2012 third quarter, the Company made cash payments totaling €280.2 million in connection with the completion of the acquisition of Gemcom Software International, a global leader in mining software solutions. The Company’s net financial position was €1.20 billion at September 30, 2012, compared to €1.15 billion at December 31, 2011, and was comprised of cash, cash equivalents and short-term investments less long-term debt and less the €200 million debt which became short term as of December 31, 2011. At September 30, 2012 compared to December 31, 2011, the Company’s cash, cash equivalents and short-term investments totaled €1.46 billion compared to €1.42 billion and total debt was €286.7 million compared to €301.3 million. Summary Business, Technology and Corporate Highlights Aerospace & Defense:
The Boeing Company has signed a five year contract to extend the use of Dassault Systèmes’ industry-leading applications at both Boeing Commercial Airplanes and Boeing Defense, Space & Security.
Transportation & Mobility:
Dana Holding Corporation, a global automotive supplier, will adopt the SIMULIA Simulation Lifecycle Management (SLM) application. This will expand its collaborative engineering strategy by sharing simulation processes and data across seven global technical centers. The SIMULIA SLM application provides a centrally-managed and searchable source for all of Dana’s simulation data, which can be traced and tracked to improve product designs.
Architecture, Engineering & Construction:
Dassault Systèmes and Shanghai Municipal Engineering Design Institute (Group) Co. Ltd (SMEDI), one of the most well-known Chinese public engineering companies, opened a Joint R&D Center for Civil Engineering. Together they will develop industry solution experiences for civil engineering and infrastructure construction professionals, based on Dassault Systèmes’ 3DEXPERIENCE platform. The joint venture is dedicated to bridge projects, water supply and wastewater treatment installations, roads, rail systems, as well as open and underground buildings.
Consumer Packaged Goods - Retail:
Dassault Systèmes introduced “Perfect Shelf”, a game changing Industry Solution Experience for consumer packaged goods and retail companies. “Perfect Shelf” transforms the way brands and retailers deliver better shopping experiences to consumers, faster and in every retail location.

6
Energy, Process & Utilities:
Dassault Systèmes and HYDROCHINA CHENGDU establish a partnership to provide Hydropower Engineering Industry Solution Experiences. The joint R&D center is committed to providing hydropower industry solution experiences based on Dassault Systèmes’ 3DEXPERIENCE platform, to streamline construction processes, enhance hydropower engineering industry design capabilities, and help harmonize dams with nature and life, minimizing the impact on both of them.
Dassault Systèmes unveiled new SOLIDWORKS Electrical Applications with real-time integration of 2D schematics and 3D models to enable mechanical and electrical teams to better collaborate and deliver more accurate designs.
Dassault Systèmes simplifies 3D Design with SOLIDWORKS 2013. The latest Release of
SOLIDWORKS, a leading 3D Design Solution, enables faster model creation, optimized
performance and enhanced collaboration.
NIAEP, the leading Russian nuclear power plant engineering procurement and construction company, selected DELMIA, CATIA & ENOVIA V6 to reduce nuclear power plants construction time and costs and improve quality and safety. This deployment enables NIAEP to simulate business processes, and implement detailed modeling of construction and installation.
Natural Resources:
Dassault Systèmes announces new capabilities for five key GEOVIA mining applications at MINExpo 2012. The latest updates to the GEOVIA product portfolio underline Dassault Systèmes’ commitment to delivering innovations that will help customers achieve sustainable mining productivity. The advanced geological modeling and simulation capabilities that the Surpac, GEMS, InSite, Whittle and MineSched applications bring to the Company’s 3DEXPERIENCE platform will help fulfill the Company’s purpose of harmonizing products with nature and life.

7
Business Outlook Thibault de Tersant, Senior Executive Vice President and CFO, commented, “Our financial results have been gratifying, with non-IFRS software revenue growth of 10% in constant currencies, and non-IFRS earnings per share growth of 16% in the third quarter, with a similar performance year to date. “Regionally, we had strong revenue results in Asia and an improved performance in the Americas. In Europe, year-over-year growth moderated, in part reflecting a strong year-ago comparison as well as some regional softening. More globally, we did see the effects of the weakening macro-economic backdrop as forecasted, and this was visible in SOLIDWORKS new licenses revenue, and in the sales cycle lengthening of ENOVIA infrastructure decisions. “However, we continue to see a good level of high-quality customer wins, illustrating the relevance of the 3DEXPERIENCE platform, together with specialized applications, driving a quick return on investment for customers. As a result, we are revising upward our previous fourth quarter forecast, and, in turn, we are upgrading our full year 2012 financial objectives taking into account the third quarter over-performance, currency evolution and improved view of our fourth quarter. “In total, we anticipate that 2012 will be a year where we pass the two billion euro revenue threshold, deliver strong earnings growth accompanied by operating margin expansion and broaden our market footprint.” The Company’s updated 2012 financial objectives are as follows:
Fourth quarter 2012 non-IFRS total revenue objective of about €550 to €560 million, growing 6% to 8% excluding currency effects, non-IFRS operating margin of about 34% non-IFRS EPS of about €0.95 to €1.00;
2012 non-IFRS revenue growth objective range of about 9% to 10% in constant currencies; (€2.02 to €2.03 billion based upon the 2012 currency exchange rate assumptions below);
2012 non-IFRS operating margin of about 31.4%, representing an increase of about 100 basis points;
2012 non-IFRS EPS range of about €3.30 to €3.35, representing growth of about 13% to 15%;
Objectives are based upon exchange rate assumptions for the 2012 fourth quarter of US$1.30 per €1.00 and JPY110 per €1.00 and full year of US$1.29 per €1.00 and JPY104 per €1.00.
The Company’s objectives are prepared and communicated only on a non-IFRS basis and are subject to the cautionary statement set forth below. The 2012 non-IFRS objectives set forth above do not take into account the following accounting elements and are estimated based upon the 2012 currency exchange rates above: 2012

8
deferred revenue write-downs estimated at €10 million, share-based compensation expense including related social charges estimated at approximately €39 million and amortization of acquired intangibles estimated at approximately €93 million. The above objectives do not include any impact from other operating income and expense, net, principally comprised of acquisition, integration and restructuring expenses of €0.2 million for the 2012 nine-month period ending September 30, 2012. Further, these estimates do not include any new stock option or performance share grants, or any new acquisitions or restructurings completed after October 25, 2012.
Today’s Webcast and Conference Call Information Today, Thursday, October 25, 2012, Dassault Systèmes will first host a meeting in London, which will be simultaneously webcasted at 8:30 AM London time/9:30 AM Paris time and will then host a conference call at 9:00 AM New York time/ 2:00 PM London time/3:00 PM Paris time. The webcasted meeting and conference call will be available via the Internet by accessing http://www.3ds.com/company/finance/. Please go to the website at least 15 minutes prior to the webcast or conference call to register, download and install any necessary audio software. The webcast and conference call will be archived for 30 days. Additional investor information can be accessed at http://www.3ds.com/company/finance/ or by calling Dassault Systèmes’ Investor Relations at 33.1.61.62.69.24. Key Investor Relations Events Fourth Quarter and Full Year 2012 Earnings, February 7, 2013 Forward-looking Information Statements herein that are not historical facts but express expectations or objectives for the future, including but not limited to statements regarding the Company’s non-IFRS financial performance objectives, are forward-looking statements. Such forward-looking statements are based on Dassault Systèmes management's current views and assumptions and involve known and unknown risks and uncertainties. Actual results or performances may differ materially from those in such statements due to a range of factors. If global economic and business conditions continue to be volatile or deteriorate, the Company’s business results may not develop as currently anticipated and may decline below their earlier levels for an extended period of time. Furthermore, due to factors affecting sales of the Company’s products and services, there may be a substantial time lag between any change in global economic and business conditions and its impact on the Company’s business results. In preparing such forward-looking statements, the Company has in particular assumed an average U.S. dollar to euro exchange rate of US$1.30 per €1.00 and an average Japanese yen to euro exchange rate of JPY110 to €1.00 for the 2012 fourth quarter; for 2012, the Company has assumed an average U.S. dollar to euro exchange rate of US$1.29 per €1.00 and an average Japanese yen to euro exchange rate of JPY104 to €1.00; however, currency values fluctuate, and the Company’s results of operations may be significantly affected by changes in exchange rates. The Company’s actual results or performance may also be materially

9
negatively affected by changes in the current global economic context, difficulties or adverse changes affecting its partners or its relationships with its partners, changes in exchange rates, new product developments, and technological changes; errors or defects in its products; growth in market share by its competitors; and the realization of any risks related to the integration of any newly acquired company, in particular related to the integration of Gemcom software International and internal reorganizations. Unfavorable changes in any of the above or other factors described in the Company’s regulatory reports, including the 2011 Document de référence, and 2012 Half Year Financial Report, which were filed with the French Autorité des marchés financiers (AMF) on March 29, 2012, and July 27, 2012, respectively, could materially affect the Company’s financial position or results of operations. Non-IFRS Financial Information Readers are cautioned that the supplemental non-IFRS information presented in this press release is subject to inherent limitations. It is not based on any comprehensive set of accounting rules or principles and should not be considered as a substitute for IFRS measurements. Also, the Company’s supplemental non-IFRS financial information may not be comparable to similarly titled non-IFRS measures used by other companies. Further specific limitations for individual non-IFRS measures, and the reasons for presenting non-IFRS financial information, are set forth in the Company’s annual report for the year ended December 31, 2011 included in the Company’s 2011 Document de référence and the 2012 Half Year Financial Report filed with the AMF on March 29, 2012, and July 27, 2012, respectively. In the tables accompanying this press release the Company sets forth its supplemental non-IFRS figures for revenue, operating income, operating margin, net income and diluted earnings per share, which exclude the effect of adjusting the carrying value of acquired companies’ deferred revenue, stock-based compensation expense and related social charges, the expenses for the amortization of acquired intangible assets, other income and expense, net, certain one-time items included in financial revenue and other, net, and the income tax effect of the non-IFRS adjustments. The tables also set forth the most comparable IFRS financial measure and reconciliations of this information with non-IFRS information. Information in Constant Currencies When the Company believes it would be helpful for understanding trends in its business, the Company provides percentage increases or decreases in its revenue (in both IFRS as well as non-IFRS) to eliminate the effect of changes in currency values, particularly the U.S. dollar and the Japanese yen, relative to the euro. When trend information is expressed herein "in constant currencies", the results of the "prior" period have first been recalculated using the average exchange rates of the comparable period in the current year, and then compared with the results of the comparable period in the current year. This press release constitutes the quarterly financial information required by article L.451-1-2 IV of the French Monetary and Financial Code (Code Monétaire et Financier).

10
About Dassault Systèmes Dassault Systèmes, the 3DEXPERIENCE Company, provides business and people with virtual universes to imagine sustainable innovations. Its world-leading solutions transform the way products are designed, produced, and supported. Dassault Systèmes’ collaborative solutions foster social innovation, expanding possibilities for the virtual world to improve the real world. The group brings value to over 150,000 customers of all sizes, in all industries, in more than 80 countries. For more information, visit www.3ds.com. CATIA, SOLIDWORKS, SIMULIA, DELMIA, ENOVIA, GEOVIA, EXALEAD, NETVIBES, 3DSWYM and 3DVIA are registered trademarks of Dassault Systèmes or its subsidiaries in the US and/or other countries. (Tables to follow) CONTACTS : Dassault Systèmes : FTI Consulting : François-José Bordonado/Beatrix Martinez Jon Snowball 33.1.61.62.69.24 44.20.7831.3113 United States and Canada: Clément Bénétreau/Catherine
Guilhaume/Yannick Duvergé [email protected] 33.1.47.03.68.10/33.1.47.03.68.10

11
TABLE OF CONTENTS
Non-IFRS key figures
Condensed consolidated statements of income
Condensed consolidated balance sheets
Condensed consolidated cash flow statements
IFRS – non-IFRS reconciliation

12
DASSAULT SYSTEMES
NON-IFRS KEY FIGURES (unaudited; in millions of Euros, except per share data, headcount and exchange rates)
Non-IFRS key figures exclude the effects of adjusting the carrying value of acquired companies’ deferred revenue,
stock-based compensation expense and related social charges, amortization of acquired intangible assets, other
operating income and expense, net and certain one-time financial revenue items and the income tax effects of these
non-IFRS adjustments.
Comparable IFRS financial information and a reconciliation of the IFRS and non-IFRS measures are set forth in the
separate tables within this Attachment.
*In constant currencies
Nine months ended
September 30,
2012
September 30,
2011Change
Change
in cc*
September 30,
2012
September 30,
2011Change
Change
in cc*
Non-IFRS Revenue € 505.0 € 432.9 17% 10% € 1,470.3 € 1,271.4 16% 10%
Non-IFRS Revenue breakdown by activity
Software revenue 460.2 394.3 17% 10% 1,337.9 1,155.3 16% 10%
of which new licenses revenue 119.5 100.2 19% 10% 367.7 309.6 19% 12%
of which periodic licenses, maintenance and
product development revenue340.7 294.1 16% 10% 970.2 845.7 15% 9%
Services and other revenue 44.8 38.6 16% 9% 132.4 116.1 14% 9%
Recurring software revenue 339.3 292.1 16% 10% 965.0 842.6 15% 9%
Non-IFRS software revenue breakdown by
product line
PLM software revenue 360.3 309.9 16% 10% 1,038.1 905.4 15% 9%
of which CATIA software revenue 199.6 182.6 9% 5% 598.0 542.7 10% 6%
of which ENOVIA software revenue 61.7 55.3 12% 3% 185.6 159.2 17% 9%
SOLIDWORKS software revenue 99.9 84.4 18% 9% 299.8 249.9 20% 12%
Non-IFRS Revenue breakdown by geography
Americas 147.7 116.0 27% 13% 413.3 353.2 17% 7%
Europe 211.9 200.7 6% 3% 644.2 575.9 12% 10%
Asia 145.4 116.2 25% 18% 412.8 342.3 21% 14%
Non-IFRS operating income € 164.6 € 138.4 19% € 446.9 € 374.7 19%
Non-IFRS operating margin 32.6% 32.0% 30.4% 29.5%
Non-IFRS net income 111.7 95.3 17% 296.1 253.7 17%
Non-IFRS diluted net income per share € 0.89 € 0.77 16% € 2.36 € 2.05 15%
Closing headcount 10,067 9,481 6% 10,067 9,481 6%
Average Rate USD per Euro 1.25 1.41 (11%) 1.28 1.41 (9%)
Average Rate JPY per Euro 98.3 109.8 (10%) 101.6 113.2 (10%)
Three months ended

13
DASSAULT SYSTEMES
CONDENSED CONSOLIDATED STATEMENTS OF INCOME (IFRS) (unaudited; in millions of Euros, except per share data)
IFRS revenue variation as reported and in constant currencies
* Variation compared to the same period in the prior year. ** In constant currencies.
Nine months ended
September 30, September 30, September 30, September 30,
2012 2011 2012 2011
New licenses revenue 119.5 100.2 367.7 309.6
Periodic licenses, maintenance and product
development revenue335.2 294.0 964.7 845.2
Software revenue 454.7 394.2 1,332.4 1,154.8
Services and other revenue 44.8 38.6 132.4 116.1
Total Revenue € 499.5 € 432.8 € 1,464.8 € 1,270.9
Cost of software revenue (excluding amortization
of acquired intangibles) (21.8) (18.7) (66.2) (56.5)
Cost of services and other revenue (41.5) (40.6) (127.5) (126.5)
Research and development (97.6) (80.7) (276.9) (240.7)
Marketing and sales (152.3) (127.6) (462.8) (387.1)
General and administrative (45.2) (33.8) (118.5) (100.6)
Amortization of acquired intangibles (25.4) (20.7) (68.7) (62.5)
Other operating income and expense, net (4.3) (2.5) (0.2) (4.8)
Total Operating Expenses (€ 388.1) (€ 324.6) (€ 1,120.8) (€ 978.7)
Operating Income € 111.4 € 108.2 € 344.0 € 292.2
Financial revenue and other, net 6.8 1.8 11.9 6.2
Income before income taxes 118.2 110.0 355.9 298.4
Income tax expense (35.5) (33.1) (114.7) (93.3)
Net Income 82.7 76.9 241.2 205.1
Non-controlling interest (0.1) (0.5) (2.2) (0.6)
Net Income attributable to equity holders of
the parent€ 82.6 € 76.4 € 239.0 € 204.5
Basic net income per share 0.67 0.63 1.94 1.69
Diluted net income per share € 0.66 € 0.62 € 1.90 € 1.65
Basic weighted average shares outstanding (in
millions) 123.4 121.4 123.1 121.3
Diluted weighted average shares outstanding (in
millions) 126.0 123.7 125.7 123.9
Three months ended
Nine months ended September 30, 2012
Change* Change in cc** Change* Change in cc**
IFRS Revenue 15% 8% 15% 10%
IFRS Revenue by activity
Software Revenue 15% 8% 15% 10%
Services and other Revenue 16% 9% 14% 9%
IFRS Software Revenue by product line
PLM software revenue 15% 8% 14% 9%
of which CATIA software revenue 9% 5% 10% 6%
of which ENOVIA software revenue 12% 3% 17% 9%
SOLIDWORKS 18% 9% 20% 12%
IFRS Revenue by geography
Americas 26% 12% 17% 6%
Europe 5% 2% 12% 10%
Asia 23% 16% 20% 13%
Three months ended September 30, 2012

14
DASSAULT SYSTEMES
CONDENSED CONSOLIDATED BALANCE SHEETS (IFRS) (unaudited; in millions of Euros)
September 30, December 31,
2012 2011
ASSETS
Cash and cash equivalents 1,280.2 1,154.3
Short-term investments 182.4 268.7
Accounts receivable, net 358.7 494.3
Other current assets 156.5 139.4
Total current assets 1,977.8 2,056.7
Property and equipment, net 112.2 106.6
Goodwill and Intangible assets, net 1,508.5 1,241.9
Other non current assets 137.5 111.6
Total Assets € 3,736.0 € 3,516.8
LIABILITIES AND SHAREHOLDERS' EQUITY
Accounts payable 78.8 99.9
Unearned revenues 502.3 492.0
Short-term debt 228.9 228.9
Other current liabilities 322.5 317.3
Total current liabilities 1,132.5 1,138.1
Long-term debt 57.8 72.4
Other non current obligations 272.6 222.6
Total long-term liabilities 330.4 295.0
Non-controlling interests 15.8 17.5
Parent shareholders' equity 2,257.3 2,066.2
Total Liabilities and Shareholders' equity € 3,736.0 € 3,516.8
15
DASSAULT SYSTEMES
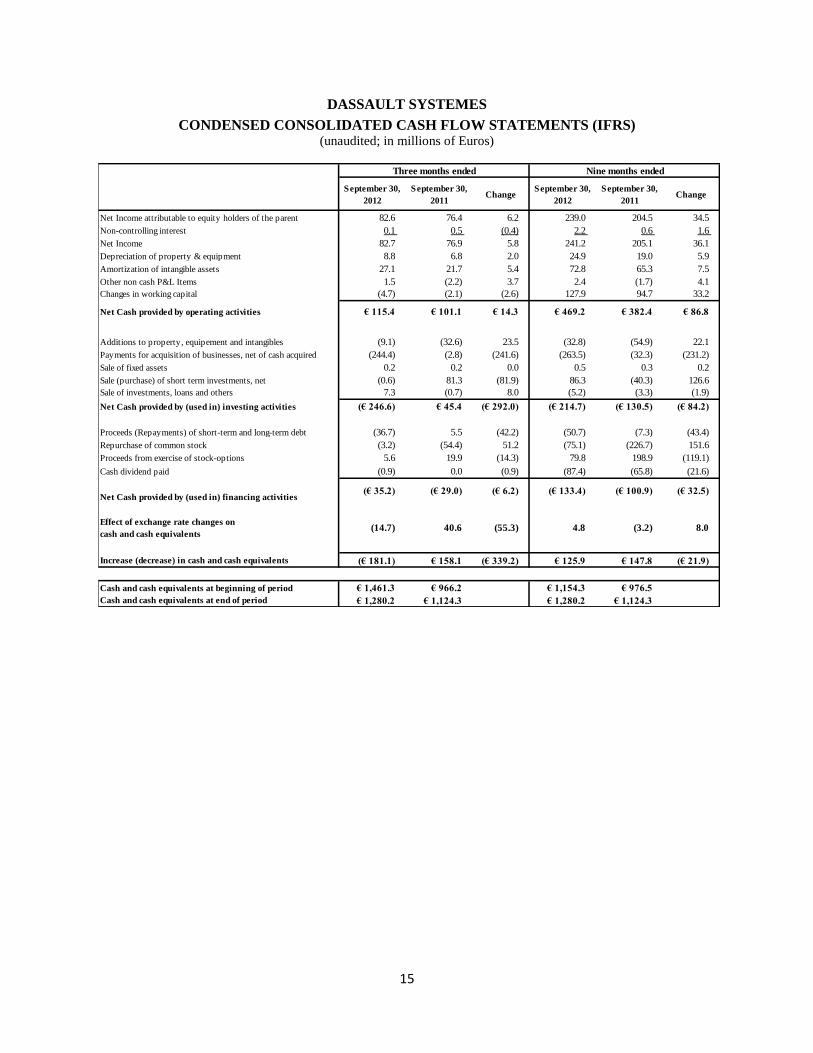
CONDENSED CONSOLIDATED CASH FLOW STATEMENTS (IFRS) (unaudited; in millions of Euros)
Nine months ended
September 30,
2012
September 30,
2011Change
September 30,
2012
September 30,
2011Change
Net Income attributable to equity holders of the parent 82.6 76.4 6.2 239.0 204.5 34.5
Non-controlling interest 0.1 0.5 (0.4) 2.2 0.6 1.6
Net Income 82.7 76.9 5.8 241.2 205.1 36.1
Depreciation of property & equipment 8.8 6.8 2.0 24.9 19.0 5.9
Amortization of intangible assets 27.1 21.7 5.4 72.8 65.3 7.5
Other non cash P&L Items 1.5 (2.2) 3.7 2.4 (1.7) 4.1
Changes in working capital (4.7) (2.1) (2.6) 127.9 94.7 33.2
Net Cash provided by operating activities € 115.4 € 101.1 € 14.3 € 469.2 € 382.4 € 86.8
Additions to property, equipement and intangibles (9.1) (32.6) 23.5 (32.8) (54.9) 22.1
Payments for acquisition of businesses, net of cash acquired (244.4) (2.8) (241.6) (263.5) (32.3) (231.2)
Sale of fixed assets 0.2 0.2 0.0 0.5 0.3 0.2
Sale (purchase) of short term investments, net (0.6) 81.3 (81.9) 86.3 (40.3) 126.6
Sale of investments, loans and others 7.3 (0.7) 8.0 (5.2) (3.3) (1.9)
Net Cash provided by (used in) investing activities (€ 246.6) € 45.4 (€ 292.0) (€ 214.7) (€ 130.5) (€ 84.2)
Proceeds (Repayments) of short-term and long-term debt (36.7) 5.5 (42.2) (50.7) (7.3) (43.4)
Repurchase of common stock (3.2) (54.4) 51.2 (75.1) (226.7) 151.6
Proceeds from exercise of stock-options 5.6 19.9 (14.3) 79.8 198.9 (119.1)
Cash dividend paid (0.9) 0.0 (0.9) (87.4) (65.8) (21.6)
Net Cash provided by (used in) financing activities(€ 35.2) (€ 29.0) (€ 6.2) (€ 133.4) (€ 100.9) (€ 32.5)
Effect of exchange rate changes on
cash and cash equivalents(14.7) 40.6 (55.3) 4.8 (3.2) 8.0
Increase (decrease) in cash and cash equivalents (€ 181.1) € 158.1 (€ 339.2) € 125.9 € 147.8 (€ 21.9)
Cash and cash equivalents at beginning of period € 1,461.3 € 966.2 € 1,154.3 € 976.5
Cash and cash equivalents at end of period € 1,280.2 € 1,124.3 € 1,280.2 € 1,124.3
Three months ended

16
DASSAULT SYSTEMES
SUPPLEMENTAL NON-IFRS FINANCIAL INFORMATION
IFRS – NON-IFRS RECONCILIATION (unaudited; in millions of Euros, except per share data)
Readers are cautioned that the supplemental non-IFRS information presented in this press release is subject to inherent limitations. It is not based
on any comprehensive set of accounting rules or principles and should not be considered as a substitute for IFRS measurements. Also, the Company’s supplemental non-IFRS financial information may not be comparable to similarly titled non-IFRS measures used by other companies.
Further specific limitations for individual non-IFRS measures, and the reasons for presenting non-IFRS financial information, are set forth in the
Company’s Document de référence for the year ended December 31, 2011 filed with the AMF on March 29, 2012. To compensate for these limitations, the supplemental non-IFRS financial information should be read not in isolation, but only in conjunction with the Company’s
consolidated financial statements prepared in accordance with IFRS.
(1) In the reconciliation schedule above, (i) all adjustments to IFRS revenue data reflect the exclusion of the deferred revenue adjustment of
acquired companies; (ii) adjustments to IFRS operating expense data reflect the exclusion of the amortization of acquired intangibles, share-based compensation expense and related social charges, and other operating income and expense, (iii) adjustments to IFRS financial revenue and other,
net reflect the exclusion of certain one-time items included in financial revenue and other, net, and (iv) all adjustments to IFRS income data
reflect the combined effect of these adjustments, plus with respect to net income and diluted net income per share, the income tax effect of the
non-IFRS adjustments.
(2) The non-IFRS percentage increase (decrease) compares non-IFRS measures for the two different periods. In the event there is non-IFRS
adjustment to the relevant measure for only one of the periods under comparison, the non-IFRS increase (decrease) compares the non-IFRS measure to the relevant IFRS measure.
(3) Based on a weighted average 126.0 million diluted shares for Q3 2012 and 123.7 million diluted shares for Q3 2011.
2012 2012 2011 2011
IFRS non-IFRS IFRS non-IFRS
Total Revenue € 499.5 5.5 € 505.0 € 432.8 0.1 € 432.9 15% 17%
Total Revenue breakdown by activity
Software revenue 454.7 5.5 460.2 394.2 0.1 394.3 15% 17%
New Licenses 119.5 100.2 19%
Product Development 1.4 2.0
Periodic Licenses and Maintenance 333.8 5.5 339.3 292.0 0.1 292.1 14% 16%
Recurring portion of Software revenue 73% 74% 74% 74%
Services and other revenue 44.8 38.6 16%
Total Software Revenue breakdown by product
line
PLM software revenue 354.8 5.5 360.3 309.8 0.1 309.9 15% 16%
of which CATIA software revenue 199.6 182.5 0.1 182.6 9% 9%
of which ENOVIA software revenue 61.7 55.3 12%
SOLIDWORKS software revenue 99.9 84.4 18%
Total Revenue breakdown by geography
Americas 146.1 1.6 147.7 116.0 26% 27%
Europe 210.8 1.1 211.9 200.6 0.1 200.7 5% 6%
Asia 142.6 2.8 145.4 116.2 23% 25%
Total Operating Expenses (€ 388.1) 47.7 (€ 340.4) (€ 324.6) 30.1 (€ 294.5) 20% 16%
Stock-based compensation expense (18.0) 18.0 - (6.9) 6.9 - - -
Amortization of acquired intangibles (25.4) 25.4 - (20.7) 20.7 - - -
Other operating income and expense, net (4.3) 4.3 - (2.5) 2.5 - - -
Operating Income € 111.4 53.2 € 164.6 € 108.2 30.2 € 138.4 3% 19%
Operating Margin 22.3% 32.6% 25.0% 32.0%
Financial revenue & other, net 6.8 (5.1) 1.7 1.8 (1.7) 0.1 278% 1600%
Income tax expense (35.5) (19.0) (54.5) (33.1) (9.2) (42.3) 7% 29%
Non-controlling interest (0.1) 0.0 (0.1) (0.5) (0.4) (0.9) (80%) (89%)
Net Income attributable to shareholders € 82.6 29.1 € 111.7 € 76.4 18.9 € 95.3 8% 17%
Diluted Net Income Per Share (3) € 0.66 0.23 € 0.89 € 0.62 0.15 € 0.77 6% 16%
Change
Adjustment
(1)
Adjustment
(1)IFRS
Non-IFRS
(2)
Three months ended September 30,In millions of Euros, except per share data and
percentages
2012 2011
non-IFRS non-IFRS
Cost of revenue (63.3) 0.6 (62.7) (59.3) 0.1 (59.2)
Research and development (97.6) 7.7 (89.9) (80.7) 3.5 (77.2)
Marketing and sales (152.3) 5.8 (146.5) (127.6) 2.0 (125.6)
General and administrative (45.2) 3.9 (41.3) (33.8) 1.3 (32.5)
Total stock-based compensation expense 18.0 6.9
Three months ended September 30,
In millions of Euros 2012 IFRS 2011 IFRSAdjustment Adjustment

17
DASSAULT SYSTEMES
SUPPLEMENTAL NON-IFRS FINANCIAL INFORMATION
IFRS – NON-IFRS RECONCILIATION (unaudited; in millions of Euros, except per share data)
Readers are cautioned that the supplemental non-IFRS information presented in this press release is subject to inherent limitations. It is not based
on any comprehensive set of accounting rules or principles and should not be considered as a substitute for IFRS measurements. Also, the Company’s supplemental non-IFRS financial information may not be comparable to similarly titled non-IFRS measures used by other companies.
Further specific limitations for individual non-IFRS measures, and the reasons for presenting non-IFRS financial information, are set forth in the
Company’s Document de référence for the year ended December 31, 2011 filed with the AMF on March 29, 2012. To compensate for these limitations, the supplemental non-IFRS financial information should be read not in isolation, but only in conjunction with the Company’s
consolidated financial statements prepared in accordance with IFRS.
(1) In the reconciliation schedule above, (i) all adjustments to IFRS revenue data reflect the exclusion of the deferred revenue adjustment of
acquired companies; (ii) adjustments to IFRS operating expense data reflect the exclusion of the amortization of acquired intangibles, share-based compensation expense and related social charges, and other operating income and expense, (iii) adjustments to IFRS financial revenue and other,
net reflect the exclusion of certain one-time items included in financial revenue and other, net, and (iv) all adjustments to IFRS income data
reflect the combined effect of these adjustments, plus with respect to net income and diluted net income per share, the income tax effect of the non-IFRS adjustments.
(2) The non-IFRS percentage increase (decrease) compares non-IFRS measures for the two different periods. In the event there is non-IFRS
adjustment to the relevant measure for only one of the periods under comparison, the non-IFRS increase (decrease) compares the non-IFRS measure to the relevant IFRS measure.
(3) Based on a weighted average 125.7 million diluted shares for YTD 2012 and 123.9 million diluted shares for YTD 2011.
2012 2012 2011 2011
IFRS non-IFRS IFRS non-IFRS
Total Revenue € 1,464.8 5.5 € 1,470.3 € 1,270.9 0.5 € 1,271.4 15% 16%
Total Revenue breakdown by activity
Software revenue 1,332.4 5.5 1,337.9 1,154.8 0.5 1,155.3 15% 16%
New Licenses 367.7 309.6 19%
Product Development 5.2 3.1
Periodic Licenses and Maintenance 959.5 5.5 965.0 842.1 0.5 842.6 14% 15%
Recurring portion of Software revenue 72% 72% 73% 73%
Services and other revenue 132.4 116.1 14%
Total Software Revenue breakdown by product
line
PLM software revenue 1,032.6 5.5 1,038.1 904.9 0.5 905.4 14% 15%
of which CATIA software revenue 598.0 542.2 0.5 542.7 10% 10%
of which ENOVIA software revenue 185.6 159.2 17%
SOLIDWORKS software revenue 299.8 249.9 20%
Total Revenue breakdown by geography
Americas 411.7 1.6 413.3 353.1 0.1 353.2 17% 17%
Europe 643.1 1.1 644.2 575.8 0.1 575.9 12% 12%
Asia 410.0 2.8 412.8 342.0 0.3 342.3 20% 21%
Total Operating Expenses (€ 1,120.8) 97.4 (€ 1,023.4) (€ 978.7) 82.0 (€ 896.7) 15% 14%
Stock-based compensation expense (28.5) 28.5 - (14.7) 14.7 - - -
Amortization of acquired intangibles (68.7) 68.7 - (62.5) 62.5 - - -
Other operating income and expense, net (0.2) 0.2 - (4.8) 4.8 - - -
Operating Income € 344.0 102.9 € 446.9 € 292.2 82.5 € 374.7 18% 19%
Operating Margin 23.5% 30.4% 23.0% 29.5%
Financial revenue & other, net 11.9 (7.5) 4.4 6.2 (6.7) (0.5) 92% (980%)
Income tax expense (114.7) (38.3) (153.0) (93.3) (26.2) (119.5) 23% 28%
Non-controlling interest (2.2) 0.0 (2.2) (0.6) (0.4) (1.0) 267% 120%
Net Income attributable to shareholders € 239.0 57.1 € 296.1 € 204.5 49.2 € 253.7 17% 17%
Diluted Net Income Per Share (3) € 1.90 0.46 € 2.36 € 1.65 0.40 € 2.05 15% 15%
In millions of Euros, except per share data and
percentages
Nine months ended September 30, Change
Adjustment
(1)
Adjustment
(1)IFRS
Non-IFRS
(2)
2012 2011
non-IFRS non-IFRS
Cost of revenue (193.7) 0.9 (192.8) (183.0) 0.4 (182.6)
Research and development (276.9) 12.7 (264.2) (240.7) 7.2 (233.5)
Marketing and sales (462.8) 8.5 (454.3) (387.1) 4.0 (383.1)
General and administrative (118.5) 6.4 (112.1) (100.6) 3.1 (97.5)
Total stock-based compensation expense 28.5 14.7
Nine months ended September 30,
In millions of Euros 2012 IFRS 2011 IFRSAdjustment Adjustment