Embed Size (px)
Citation preview

Data 1 Statistics
1 Overview · · · · · · · · · · · · · · · · · · · · · · · · · · · · · · · · · · · · · · · · · · · · · · · · · · · · · · 84 (1) Commitments · · · · · · · · · · · · · · · · · · · · · · · · · · · · · · · · · · · · · · · · · · · · · · · · · 84
A. Commitments by Purpose of Financing · · · · · · · · · · · · · · · · · · · · · 84
B. Commitments by Region (Loans, Equity Participations and Guarantees) · · · · · · · · · · · · · · 84
(2) Disbursements · · · · · · · · · · · · · · · · · · · · · · · · · · · · · · · · · · · · · · · · · · · · · · · · 85
(3) Repayments · · · · · · · · · · · · · · · · · · · · · · · · · · · · · · · · · · · · · · · · · · · · · · · · · · · 85
(4) Outstandings · · · · · · · · · · · · · · · · · · · · · · · · · · · · · · · · · · · · · · · · · · · · · · · · · · 85
2 Commitments · · · · · · · · · · · · · · · · · · · · · · · · · · · · · · · · · · · · · · · · · · · · · · · · · · · 86 (1) Export Loans by Industry · · · · · · · · · · · · · · · · · · · · · · · · · · · · · · · · · · · · · · 86
(2) Natural Resource Loans by Item · · · · · · · · · · · · · · · · · · · · · · · · · · · · · · · 86
(3) Overseas Investment Loans by Industry (Excluding Natural Resource Loans) · · · · · · · · · · · · · · · · · · · · · · · · · · · 87
(4) Commitments to Mid-tier Enterprises and SMEs to Support their Overseas Business Activities · · · · · · · · · · · · · · · · · · · · · 87
(5) Guarantee Commitments by Purpose · · · · · · · · · · · · · · · · · · · · · · · · · · 87
(6) Loan and Guarantee Commitments by Region · · · · · · · · · · · · · · · · 88
A. Export Loan Commitments by Region · · · · · · · · · · · · · · · · · · · · · · 88
B. Import Loan Commitments by Region · · · · · · · · · · · · · · · · · · · · · · 88
C. Overseas Investment Loan Commitments by Region · · · · · · · · 88
D. Untied Loan Commitments by Region · · · · · · · · · · · · · · · · · · · · · · 89
E. Guarantee Commitments by Region · · · · · · · · · · · · · · · · · · · · · · · · 89
F. Equity Participations by Region · · · · · · · · · · · · · · · · · · · · · · · · · · · · 89
(7) Geographical Distribution of Loan and Equity Participation Commitments · · · · · · · · · · · · · · · · · · · · · · · · · · · · 90
3 Outstandings · · · · · · · · · · · · · · · · · · · · · · · · · · · · · · · · · · · · · · · · · · · · · · · · · · · · 93 (1) Outstandings by Purpose of Financing · · · · · · · · · · · · · · · · · · · · · · · · 93
(2) Guarantee Outstandings by Purpose · · · · · · · · · · · · · · · · · · · · · · · · · · 93
(3) Geographical Distribution of Loan and Equity Participation Outstandings · · · · · · · · · · · · · · · · · · · · · · · · · · · · · 94
4 Others · · · · · · · · · · · · · · · · · · · · · · · · · · · · · · · · · · · · · · · · · · · · · · · · · · · · · · · · · · · · 96 (1) Major Buyer’s Credit and Bank-to-bank Loan Commitments · · · 96
(2) Untied Loan Commitments · · · · · · · · · · · · · · · · · · · · · · · · · · · · · · · · · · · · 96
(3) Special Operations · · · · · · · · · · · · · · · · · · · · · · · · · · · · · · · · · · · · · · · · · · · · 96
5 Standard Loan Conditions · · · · · · · · · · · · · · · · · · · · · · · · · · · · · · · · · · · · · 97
6 Breakdown of Countries and Regions · · · · · · · · · · · · · · · · · · · · · · · 98
83JBIC n Annual Report 2017

Statistics
Data
1
Overview
1
84 JBIC ■ Annual Report 2017
(1) Commitments
A. Commitments by Purpose of Financing(Unit: billions of yen, %)
FY2012 FY2013 FY2014 FY2015 FY2016
Number Total Share Number Total Share Number Total Share Number Total Share Number Total Share
Loans
Export Loans 40 126.6 3 33 126.2 6 49 406.4 13 22 141.0 6 20 175.0 8
Shipping 15 23.0 1 15 34.7 2 24 24.3 1 9 33.6 1 3 10.5 0
Plant 25 103.6 2 18 91.5 4 24 381.8 12 13 107.3 4 17 164.5 7
Technical Services — — — — — — 1 0.2 0 — — — — — —
Import Loans 4 304.3 7 5 56.2 3 — — — 1 252.3 11 — — —
Natural Resources 4 304.3 7 5 56.2 3 — — — 1 252.3 11 — — —
OverseasInvestment Loans 157 3,138.5 74 167 1,671.0 76 197 2,451.0 75 260 1,858.1 78 222 1,721.0 77
Natural Resources 39 1,784.2 42 18 594.7 27 20 1,059.1 33 11 236.9 10 4 250.5 11
Others 118 1,354.3 32 149 1,076.2 49 177 1,391.9 43 249 1,621.1 68 218 1,470.5 66
Untied Loans 10 210.5 5 7 46.0 2 5 46.7 1 4 24.8 1 4 33.7 2
Bridge Loans 2 83.2 2 — — — — — — — — — — — —
Sub Total 213 3,863.3 91 212 1,899.6 86 251 2,904.2 89 287 2,276.3 95 246 1,929.9 86
Guarantees 21 303.2 7 20 209.1 9 15 312.3 10 7 106.6 4 8 293.5 13
Equity Participations 8 74.3 2 7 97.4 4 5 32.8 1 4 14.3 1 3 16.2 1
Total 242 4,240.9 100 239 2,206.1 100 271 3,249.3 100 298 2,397.4 100 257 2,239.7 100
B. Commitments by Region (Loans, Equity Participations and Guarantees)(Unit: billions of yen, %)
FY2012 FY2013 FY2014 FY2015 FY2016
Number Total Share Number Total Share Number Total Share Number Total Share Number Total Share
Asia 86 513.6 12 108 472.7 21 162 610.5 19 150 332.9 14 125 843.2 38
Oceania 17 1,005.7 24 12 292.9 13 6 173.8 5 2 6.9 0 4 11.1 1
Europe 33 660.6 16 21 350.3 16 17 228.8 7 57 598.3 25 56 525.7 23
The Middle East 12 305.9 7 9 104.8 5 14 493.6 15 9 427.6 18 8 134.2 6
Africa 7 84.3 2 5 81.1 4 7 195.6 6 2 14.9 1 — — —
North America 35 710.8 17 43 654.0 30 45 1,389.3 43 38 493.6 21 48 605.8 27
Latin America andthe Caribbean 43 805.5 19 36 209.1 9 18 136.1 4 37 507.3 21 11 89.0 4
InternationalOrganizations, etc. — — — — — — — — — — — — 3 14.9 1
Others 9 154.2 4 5 40.8 2 2 21.2 1 3 15.5 1 2 15.4 1
Total 242 4,240.9 100 239 2,206.1 100 271 3,249.3 100 298 2,397.4 100 257 2,239.7 100
Overview1

Statistics
Data
1
Overview
1
85JBIC ■ Annual Report 2017
(2) Disbursements (Unit: billions of yen, %)
FY2012 FY2013 FY2014 FY2015 FY2016
Total Share Total Share Total Share Total Share Total Share
Loans
Export Loans 143.1 5 112.5 4 112.0 4 148.8 7 227.2 10
Import Loans 162.7 6 234.5 9 21.8 1 27.6 1 230.9 10
OverseasInvestment Loans 2,144.6 75 1,928.0 73 2,049.4 79 1,840.3 82 1,691.5 72
Untied Loans 52.2 2 88.5 3 64.3 2 44.5 2 32.2 1
Bridge Loans 79.7 3 — — — — — — — —
Sub Total 2,582.5 90 2,363.6 90 2,247.6 87 2,061.3 92 2,181.9 93
Guarantees 270.6 9 178.7 7 303.2 12 134.3 6 152.6 6
Equity Participations 17.2 1 85.4 3 30.9 1 42.4 2 18.5 1
Total 2,870.4 100 2,627.8 100 2,581.8 100 2,238.2 100 2,353.1 100
(3) Repayments (Unit: billions of yen, %)
FY2012 FY2013 FY2014 FY2015 FY2016
Total Share Total Share Total Share Total Share Total Share
Loans
Export Loans 112.4 7 106.3 8 104.8 4 95.5 4 97.1 6
Import Loans 147.4 10 170.1 13 138.4 6 154.3 6 151.6 9
OverseasInvestment Loans 707.1 46 668.1 50 1,795.6 73 1,760.7 72 961.6 59
Untied Loans 161.6 11 173.5 13 158.2 6 151.7 6 186.3 11
Bridge Loans 79.7 5 — — — — — — — —
Governmental Loans 2.9 0 2.9 0 2.6 0 2.5 0 2.4 0
Sub Total 1,211.3 79 1,121.1 84 2,199.8 90 2,164.9 89 1,399.1 86
Guarantees 318.1 21 204.9 15 238.2 10 205.5 8 228.2 14
Equity Participations 3.0 0 5.0 0 12.4 1 64.5 3 4.5 0
Total 1,532.4 100 1,331.1 100 2,450.6 100 2,435.0 100 1,631.9 100
(Note) Prepayments in FY2015 and 2016 amounted to ¥385.1billion and ¥174.9billion, respectively.
(4) Outstandings (Unit: billions of yen, %)
FY2012 FY2013 FY2014 FY2015 FY2016
Total Share Total Share Total Share Total Share Total Share
Loans
Export Loans 710.3 5 740.6 5 812.4 5 844.7 5 976.7 6
Import Loans 630.2 5 731.6 5 661.6 4 525.7 3 609.7 4
OverseasInvestment Loans 8,165.9 62 10,183.9 67 11,970.5 69 11,342.0 70 12,080.8 71
Untied Loans 1,035.8 8 998.8 7 988.8 6 901.8 6 741.9 4
Governmental Loans 42.6 0 39.7 0 37.1 0 34.6 0 32.2 0
Sub Total 10,585.1 81 12,694.9 83 14,470.6 84 13,649.0 84 14,441.5 85
Guarantees 2,400.6 18 2,422.6 16 2,572.3 15 2,464.7 15 2,385.0 14
Equity Participations 100.1 1 187.0 1 222.3 1 194.9 1 215.8 1
Total 13,086.0 100 15,304.6 100 17,265.3 100 16,308.6 100 17,042.4 100

Statistics
Data
1
Comm
itments
2
86 JBIC ■ Annual Report 2017
(1) Export Loans by Industry
(Unit: billions of yen, %)
FY2015 FY2016
Number Total Share Number Total Share
Shipping 9 33.6 24 3 10.5 6
Electrical Machinery 6 45.7 32 9 71.7 41
Telecommunication Equipment 1 7.3 5 — — —
Other Industrial Machinery and Equipment, etc. 6 54.3 38 7 88.6 51
Precision Machinery — — — 1 0.0 0
Civil Engineering and Contractors 5 12.7 9 1 3.4 2
Chemical Facilities 1 41.5 29 — — —
Loading Machinery — — — 1 4.0 2
Oil and Natural Gas Facilities — — — 3 80.7 46
Iron and Non-ferrous Metals Manufacturing Facilities
— — — 1 0.4 0
Others — — — 1 4.2 2
Total 22 141.0 100 20 175.0 100
(2) Natural Resource Loans by Item
(Unit: billions of yen, %)
FY2015 FY2016
Number Total Share Number Total Share
Energy Resources 11 486.5 99 3 173.8 69
Petroleum 3 332.7 68 1 39.6 16
Natural Gas 8 153.7 31 1 131.4 52
Coal — — — 1 2.7 1
Other Resources — — — 1 76.6 31
Copper Ore and Concentrate — — — 1 76.6 31
Others 1 2.7 1 — — —
Total 12 489.2 100 4 250.5 100
Commitments2

Statistics
Data
1
Comm
itments
2
87JBIC ■ Annual Report 2017
(3) Overseas Investment Loans by Industry (Excluding Natural Resource Loans)
(Unit: billions of yen, %)
FY2015 FY2016
Number Total Share Number Total Share
Manufacturing Industry 124 60.8 4 92 33.7 2
Food 1 0.0 0 1 0.0 0
Textiles 6 3.7 0 4 0.9 0
Lumber and Pulp 2 0.2 0 1 0.1 0
Printing — — — 3 0.5 0
Chemicals 4 1.7 0 6 1.0 0
Petroleum and Coal Products — — — 1 0.2 0
Ceramics, Stone and Clay 1 0.2 0 2 5.5 0
Iron and Non-ferrous Metal Products
29 27.7 2 7 4.7 0
Machinery — — — 1 0.0 0
Electrical Machinery 3 1.0 0 8 12.5 1
Transport Equipment 47 21.3 1 35 4.4 0
Other Manufacturing Industries 31 4.6 0 23 3.3 0
Construction 1 0.1 0 — — —
Electric, Gas and Heat Supply and Water Service 2 182.5 11 4 438.9 30
Telecommunications 1 7.1 0 — — —
Transport and Postal Services 1 1.0 0 2 1.5 0
Commerce 2 0.5 0 2 0.6 0
Service Industry — — — 2 1.1 0
Others (Note) 118 1,368.8 84 116 994.5 68
Total 249 1,621.1 100 218 1,470.5 100
(Note) “Others” includes two-step loans to regional fi nancial institutions in Japan. JBIC supports the overseas operations of Japanese enterprises (especially SMEs) engaged in a diverse range of manufacturing and services, such as motor vehicles and parts, electrical and electronic equipment, machinery and metals, chemicals, and wholesale and retail businesses.
(4) Commitments to Mid-tier Enterprises and SMEs to Support their Overseas Business Activities
(Unit: billions of yen)
FY2015 FY2016
Number of Projects Amount Number of Projects Amount
Loans to SMEs and Mid-tier Enterprises 133 42.9 113 80.9
(Notes) 1. In making loans to mid-tier enterprises and SMEs, JBIC applies favorable loan terms, such as interest rates. 2. In this table, an SMEs is defi ned to be, in principle, an incorporated fi rm or individual with capital of ¥300 million or less, or having permanent employees of 300 or less.
A mid-tier enterprise is defi ned to be an incorporated fi rm with capital of less than ¥1 billion (and excludes an SMEs).
(5) Guarantee Commitments by Purpose
(Unit: billions of yen, %)
FY2015 FY2016
Number Total Share Number Total Share
Guarantee for Samurai Bonds 1 55.0 52 1 80.0 27
Guarantee for Import of Aircrafts 3 38.3 36 3 55.6 19
Guarantee for Others 3 13.3 13 4 157.8 54
Total 7 106.6 100 8 293.5 100

Statistics
Data
1
Comm
itments
2
88 JBIC ■ Annual Report 2017
(6) Loan and Guarantee Commitments by Region
A. Export Loan Commitments by Region(Unit: billions of yen, %)
FY2015 FY2016
Number Total Share Number Total Share
Asia 9 89.3 63 9 43.5 25
East Asia 1 0.2 0 1 0.0 0
Southeast Asia 6 29.0 21 7 43.0 25
South Asia 1 18.5 13 1 0.4 0
Central Asia and the Caucasus 1 41.5 29 — — —
Europe 5 15.6 11 3 34.7 20
Central and Eastern Europe and Russia
— — — 2 28.0 16
Western Europe 5 15.6 11 1 6.7 4
The Middle East 4 6.0 4 4 92.4 53
Africa 2 14.9 11 — — —
Sub-Saharan Africa 2 14.9 11 — — —
Latin America and the Caribbean 2 15.1 11 3 0.1 0
International Organizations, etc. — — — 1 4.2 2
Total 22 141.0 100 20 175.0 100
B. Import Loan Commitments by Region(Unit: billions of yen, %)
FY2015 FY2016
Number Total Share Number Total Share
The Middle East 1 252.3 100 — — —
Total 1 252.3 100 — — —
C. Overseas Investment Loan Commitments by Region(Unit: billions of yen, %)
FY2015 FY2016
Number Total Share Number Total Share
Asia 135 166.7 9 111 623.5 36
East Asia 15 11.0 1 5 2.6 0
Southeast Asia 114 153.2 8 102 619.4 36
South Asia 6 2.4 0 4 1.4 0
Oceania 2 6.9 0 4 11.1 1
Europe 52 582.7 31 53 490.9 29
Central and Eastern Europe and Russia
1 50.3 3 2 4.6 0
Western Europe 51 532.3 29 51 486.3 28
The Middle East 4 169.2 9 4 41.8 2
North America 35 455.3 25 45 550.2 32
Latin America and the Caribbean 31 469.9 25 5 3.3 0
Others 1 7.1 0 — — —
Total 260 1,858.1 100 222 1,721.0 100

Statistics
Data
1
Comm
itments
2
89JBIC ■ Annual Report 2017
D. Untied Loan Commitments by Region(Unit: billions of yen, %)
FY2015 FY2016
Number Total Share Number Total Share
Asia 2 13.1 53 2 25.3 75
Southeast Asia 2 13.1 53 2 25.3 75
Latin America and the Caribbean 2 11.7 47 1 2.8 8
International Organizations, etc. — — — 1 5.6 17
Total 4 24.8 100 4 33.7 100
E. Guarantee Commitments by Region(Unit: billions of yen, %)
FY2015 FY2016
Number Total Share Number Total Share
Asia 2 57.7 54 2 149.9 51
East Asia 1 2.7 3 — — —
Southeast Asia 1 55.0 52 2 149.9 51
North America 3 38.3 36 3 55.6 19
Latin America and the Caribbean 2 10.5 10 2 82.8 28
International Organizations, etc. — — — 1 5.0 2
Total 7 106.6 100 8 293.5 100
F. Equity Participations by Region(Unit: billions of yen, %)
FY2015 FY2016
Number Total Share Number Total Share
Asia 2 5.9 42 1 0.8 5
East Asia 1 5.9 41 — — —
Southeast Asia 1 0.0 0 — — —
South Asia — — — 1 0.8 5
Others 2 8.3 58 2 15.4 95
Total 4 14.3 100 3 16.2 100

Statistics
Data
1
Comm
itments
2
90 JBIC ■ Annual Report 2017
(7) Geographical Distribution of Loan and Equity Participation Commitments
(Unit: billions of yen)
Region / CountryFY2015 FY2016 Accumulated
Number Total Number Total Number Total
Asia East Asia China 12 4.0 3 0.9 1,553 3,902.0
Hong Kong 2 1.0 295 318.1
Republic of Korea 1 0.7 700 1,286.2
Mongolia 1 0.2 2 0.9 4 5.3
Others 2 11.9 1,029 516.4
Sub Total 17 17.2 6 2.6 3,581 6,028.2
Southeast Asia Brunei Darussalam 4 45.1
Cambodia 2 0.2 2 0.2
Indonesia 38 53.4 22 633.0 1,575 6,347.2
Laos 1 0.2 5 24.3
Malaysia 1 0.2 1 1.2 599 1,319.2
Myanmar 3 40.6 4 1.7 64 187.5
the Philippines 5 0.8 5 0.4 826 1,755.7
Singapore 10 76.9 5 10.5 486 867.2
Thailand 40 18.2 45 19.7 2,587 2,778.8
Vietnam 23 4.5 29 21.0 207 491.6
Others 36 213.9
Sub Total 123 195.4 111 687.8 6,391 14,031.2
South Asia Bangladesh 1 18.5 1 0.2 9 41.8
India 6 2.4 5 2.5 861 1,294.2
Pakistan 290 298.3
Sri Lanka 61 67.9
Others 17 3.6
Sub Total 7 21.0 6 2.7 1,238 1,705.9
Central Asia and the Caucasus
Kazakhstan 25 301.8
Turkmenistan 13 284.9
Uzbekistan 1 41.5 14 106.6
Others 8 195.0
Sub Total 1 41.5 60 888.4
Total 148 275.1 123 693.2 11,270 22,653.9
Oceania Australia 2 6.9 4 11.1 875 3,215.2
New Zealand 147 176.8
Papua New Guinea 56 267.2
Others 52 27.0
Total 2 6.9 4 11.1 1,130 3,686.3

Statistics
Data
1
Comm
itments
2
91JBIC ■ Annual Report 2017
(Unit: billions of yen)
Region / CountryFY2015 FY2016 Accumulated
Number Total Number Total Number Total
Europe Central and Eastern Europe and Russia
Bulgaria 117 134.4
Moldova 1 5.3
Russia 1 50.3 4 32.6 122 1,634.9
Others 1,035 2,277.2
Sub Total 1 50.3 4 32.6 1,275 4,051.9
Western Europe Belguim 1 0.2 29 159.9
Cyprus 18 17.4
Denmark 57 78.9
Finland 7 7.0 22 24.2
France 1 0.6 1 6.0 311 648.3
Germany 11 90.0 12 93.9 295 461.4
United Kingdom 16 283.1 23 64.7 566 2,083.3
Iceland 1 4.1 5 8.2
Ireland 1 0.3 47 338.6
Italy 3 8.1 4 77.7 52 252.1
Luxembourg 5 85.6 9 120.5
Malta 1 6.7 4 18.7
Netherlands 5 41.5 7 180.4 107 618.5
Norway 1 6.2 249 462.4
Spain 5 23.3 66 129.0
Sweden 58 144.8
Isle of Man 7 7.6
Switzerland 1 3.8 2 56.9 88 161.9
Others 625 535.4
Sub Total 56 547.9 52 493.1 2,615 6,272.2
Total 57 598.3 56 525.7 3,890 10,324.1
The Middle East Bahrain 6 110.4
Iran 199 1,026.8
Iraq 2 32.3 23 252.2
Jordan 29 89.1
Kuwait 1 56.6 24 260.6
Oman 28 296.4
Qatar 1 152.4 37 891.1
Saudi Arabia 1 2.7 81 1,001.8
Turkey 5 7.0 4 5.5 198 706.2
United Arab Emirates 2 265.4 1 39.6 69 1,766.4
Yemen 11 35.8
Others 106 212.0
Total 9 427.6 8 134.2 811 6,649.3

Statistics
Data
1
Comm
itments
2
92 JBIC ■ Annual Report 2017
(Unit: billions of yen)
Region / CountryFY2015 FY2016 Accumulated
Number Total Number Total Number Total
Africa Northern Africa Algeria 345 971.8
Egypt 183 240.5
Morocco 10 145.0
Others 22 108.1
Sub Total 560 1,465.5
Sub-Saharan Africa Angola 1 7.3 30 100.8
Equatorial Guinea 2 17.1
Gabon 20 33.5
Kenya 30 19.3
Madagascar 9 102.5
Niger 117 105.1
Nigeria 51 266.5
Seychelles 2 1.2
South Africa 115 328.5
Tanzania 21 32.2
Uganda 1 7.5 7 8.7
Others 1,402 1,662.8
Sub Total 2 14.9 1,806 2,678.8
Total 2 14.9 2,366 4,144.4
North America Canada 2 0.8 329 764.1
United States 35 455.3 43 549.3 2,706 8,811.3
Total 35 455.3 45 550.2 3,035 9,575.5
Latin America and the Caribbean Argentina 272 564.0
the Bahamas 1 15.0 22 67.7
Bolivia 32 65.9
Brazil 12 67.5 2 2.6 1,957 3,267.9
British Virgin Islands 1 333.6 4 345.0
Cayman Islands 5 97.3
Chile 1 0.3 160 1,334.6
Colombia 122 276.2
Ecuador 1 2.8 33 81.9
Panama 286 417.1
Paraguay 16 12.8
Peru 113 487.5
Trinidad and Tobago 1 57.7 8 83.9
Mexico 19 22.4 6 0.8 842 2,232.7
Venezuela 81 661.8
Others 218 230.5
Total 35 496.8 9 6.2 4,171 10,227.6
International Organizations, etc. Total 2 9.8 58 1,217.9
Others(Note) Total 3 15.5 2 15.4 113 1,967.3
Grand Total 291 2,290.7 249 1,946.2 26,844 70,446.7
(Note) Others: Two-step loans to regional fi nancial institutions in Japan and loans for crossborder projects, etc.

Statistics
Data
1
Outstandings
3
93JBIC ■ Annual Report 2017
(1) Outstandings by Purpose of Financing
(Unit: billions of yen, %)
FY2015 FY2016
Total Share Total Share
Loans
Export Loans 844.7 5 976.7 6
Shipping 157.9 1 184.2 1
Plant 686.5 4 792.2 5
Technical Service 0.2 0 0.2 0
Import Loans 525.7 3 609.7 4
Natural Resources 521.5 3 607.6 4
Manufactured Goods & Technologies 4.1 0 2.1 0
Overseas Investment Loans 11,342.0 70 12,080.8 71
Natural Resources 5,353.6 33 5,290.5 31
Others 5,988.4 37 6,790.3 40
Untied Loans 901.8 6 741.9 4
Governmental Loans 34.6 0 32.2 0
Sub Total 13,649.0 84 14,441.5 85
Guarantees 2,464.7 15 2,385.0 14
Equity Participations 194.9 1 215.8 1
Total 16,308.6 100 17,042.4 100
(2) Guarantee Outstandings by Purpose
(Unit: billions of yen, %)
FY2015 FY2016
Total Share Total Share
Guarantee for Samurai Bonds 1,423.9 58 1,438.9 60
Guarantee for Import of Aircrafts 428.2 17 426.0 18
Guarantee for Others 612.5 25 520.1 22
Total 2,464.7 100 2,385.0 100
Outstandings3
Statistics
Data
1
Outstandings
3
94 JBIC ■ Annual Report 2017
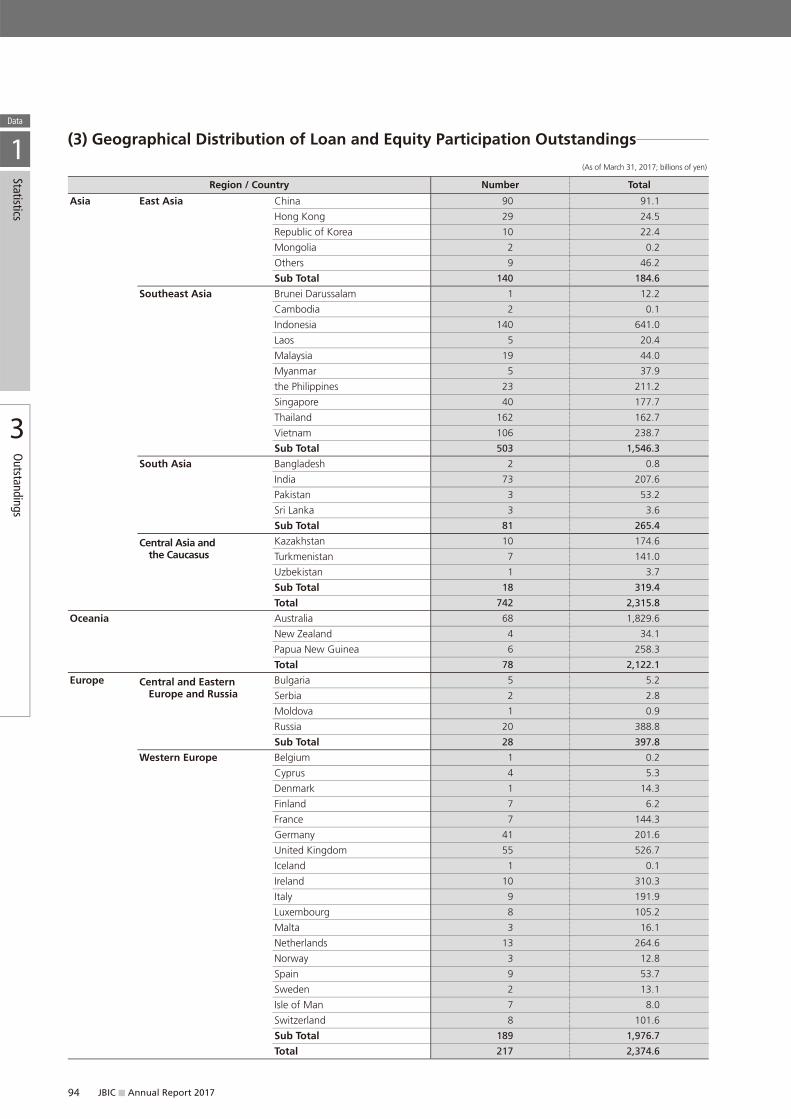
(3) Geographical Distribution of Loan and Equity Participation Outstandings
(As of March 31, 2017; billions of yen)
Region / Country Number Total
Asia East Asia China 90 91.1
Hong Kong 29 24.5
Republic of Korea 10 22.4
Mongolia 2 0.2
Others 9 46.2
Sub Total 140 184.6
Southeast Asia Brunei Darussalam 1 12.2
Cambodia 2 0.1
Indonesia 140 641.0
Laos 5 20.4
Malaysia 19 44.0
Myanmar 5 37.9
the Philippines 23 211.2
Singapore 40 177.7
Thailand 162 162.7
Vietnam 106 238.7
Sub Total 503 1,546.3
South Asia Bangladesh 2 0.8
India 73 207.6
Pakistan 3 53.2
Sri Lanka 3 3.6
Sub Total 81 265.4
Central Asia and the Caucasus
Kazakhstan 10 174.6
Turkmenistan 7 141.0
Uzbekistan 1 3.7
Sub Total 18 319.4
Total 742 2,315.8
Oceania Australia 68 1,829.6
New Zealand 4 34.1
Papua New Guinea 6 258.3
Total 78 2,122.1
Europe Central and Eastern Europe and Russia
Bulgaria 5 5.2
Serbia 2 2.8
Moldova 1 0.9
Russia 20 388.8
Sub Total 28 397.8
Western Europe Belgium 1 0.2
Cyprus 4 5.3
Denmark 1 14.3
Finland 7 6.2
France 7 144.3
Germany 41 201.6
United Kingdom 55 526.7
Iceland 1 0.1
Ireland 10 310.3
Italy 9 191.9
Luxembourg 8 105.2
Malta 3 16.1
Netherlands 13 264.6
Norway 3 12.8
Spain 9 53.7
Sweden 2 13.1
Isle of Man 7 8.0
Switzerland 8 101.6
Sub Total 189 1,976.7
Total 217 2,374.6

Statistics
Data
1
Outstandings
3
95JBIC ■ Annual Report 2017
(As of March 31, 2017; billions of yen)
Region / Country Number Total
The Middle East Bahrain 1 43.0
Iran 7 47.9
Iraq 1 12.2
Jordan 2 16.7
Kuwait 1 68.8
Oman 10 129.0
Qatar 5 431.8
Saudi Arabia 7 446.1
Turkey 26 86.2
United Arab Emirates 9 617.4
Yemen 2 14.5
Total 71 1,914.2
Africa Northern Africa Algeria 4 9.1
Egypt 2 57.6
Morocco 3 72.2
Sub Total 9 139.0
Sub-Saharan Africa Angola 5 58.8
Equatorial Guinea 2 4.0
Gabon 2 0.2
Kenya 2 0.1
Madagascar 2 86.7
Niger 4 0.7
Nigeria 2 16.4
Seychelles 3 0.5
South Africa 7 22.7
Tanzania 1 9.8
Sub Total 30 200.4
Total 39 339.4
North America Canada 13 239.7
United States 162 2,346.9
Total 175 2,586.6
Latin America and the Caribbean Argentina 2 109.9
the Bahamas 6 33.8
Bolivia 2 16.4
Brazil 47 552.3
British Virgin Islands 1 332.6
Cayman Islands 1 24.1
Chile 22 810.6
Colombia 2 47.1
Ecuador 6 0.2
Panama 10 61.6
Paraguay 1 2.2
Peru 5 60.8
Trinidad and Tobago 1 11.7
Mexico 69 222.3
Venezuela 6 218.8
Total 181 2,504.9
International Organizations, etc. Total 3 25.4
Others(Note) Total 34 474.0
Grand Total 1,540 14,657.4
(Note) Others: Two-step loans to regional fi nancial institutions in Japan and loans for crossborder projects, etc.

Statistics
Data
1
Others
4
96 JBIC ■ Annual Report 2017
(1) Major Buyer’s Credit and Bank-to-bank Loan Commitments (FY2016)
Regions/Country Project/Transaction Borrower Amount
Indonesia Export of facilities for gas-fi red combined cycle power plant PT PLN (Persero) ¥ 19.0 billion
Russia Export of facilities for liquefaction plant JOINT STOCK COMPANY YAMAL LNG € 200 million
Indonesia Export of facilities for gas-fi red combined cycle power plant PT PLN (Persero) ¥ 9.2 billion
Iraq Export of substation facilities Government of Iraq ¥ 10.3 billion
Iraq Export of substation facilities Government of Iraq US$ 193 million
Vietnam Export of facilities for coal-fi red power plant Vietnam Electricity US$ 50 million
Kuwait Export of equipment for upgrading oil refi neries KUWAIT NATIONAL PETROLEUM COMPANY K.S.C. US$ 500 million
(Note) A buyer’s credit and a bank loan are loan facilities directly extending to a foreign importer (buyer) or a fi nancial institution to fi nance imports of equipment and technologies from Japan. A buyer’s credit is extended to an importer, while a bank loan is extended to a fi nancial institution.
(2) Untied Loan Commitments (FY2016)
Regions/Country Project/Transaction Borrower Amount
International Organization, etc.
Renewable energy and energy effi ciency projects (GREEN)(*1) Corporación Andina de Fomento US$ 50 million (*2)
Ecuador Energy effi ciency projects (GREEN)(*1) Government of Ecuador US$ 25 million (*2)
Indonesia Partial acquisition of privately placed Samurai bonds (GATE)(*3) Government of Indonesia —
Indonesia Partial acquisition of privately placed Samurai bonds (GATE)(*3) Government of Indonesia —
(Notes) 1. GREEN refers to the “Global action for Reconciling Economic growth and ENvironmental preservation” facility launched in April 2010. JBIC seeks to contribute to achieving both environmental and economic sustainability through its operations.
2. The fi gures denote loan commitments made by JBIC. Apart from them, JBIC has provided guarantees to the portion co-fi nanced by private fi nancial institutions. 3. GATE refers to the “Guarantee and Acquisition toward Tokyo market Enhancement” facility launched in April 2010. It will enable JBIC to acquire Samurai bonds where
appropriate, in addition to providing partial guarantees for Samurai bond issues. The GATE facility will thereby support foreign governments and government agencies to raise funds in the Tokyo market.
(3) Special Operations (FY2016)
Regions/Country Purpose of Financing Project/Transaction Borrower Amount
Iraq Export Export of substation facilities Government of Iraq ¥ 10.3 billion
Iraq Export Export of substation facilities Government of Iraq US$ 193 million
(Note) The Act for Partial Amendment of the Japan Bank for International Cooperation Act was enacted on May 11, 2016, enhancing JBIC’s functions in order to provide further support toward Japanese companies’ overseas businesses, in accordance with the Japanese Government’s policy to promote investment in quality infrastructure, such as the “Partnership for Quality Infrastructure.” In October 2016, as part of the enhancement of functions, JBIC launched the Special Operations, which enables fi nancing for a wider range of countries and infrastructure projects.
Others4

Statistics
Data
1
Standard Loan Conditions
5
97JBIC ■ Annual Report 2017
Standard loan conditions are shown below. Loan Interest rates are linked to the funding cost of JBIC, including the rate on borrowings from the Fiscal Loan Fund Special Account, and thus they are subject to changes in conditions of the financial market. A loan applicant should make an inquiry at the relevant loan department for specific loan conditions.(1)
1— Standard Interest Rates(As of August 15, 2017)
Type of Loans Standard Interest Rate(2) Percentage of Loan Provided by JBIC
Export Loans
� Fixed at commitment (Yen CIRR) (3) • 0.92% (Repayment period 5yrs or less)• 0.95% (Repayment period over 5yrs to 8.5yrs)• 0.99% (Repayment period over 8.5yrs)
� Fixed at tenders (3) (8) • above rate + 0.2%
60% limit
Import Loans /Overseas Investment Loans /Untied Loans /(Natural Resources /International Competitiveness) (1)
� Japanese yen (4) • 0.385%(6) (7)
� Foreign Currency(5) •LIBOR+0.625%(6) (7)
60% limit (7)
(Notes) 1. SMEs are eligible for preferential interest rates and other favorable loan conditions. 2. Premium is added based on the type of fi nancing such as collateral/guarantee and loan schemes. 3. Synthetic rate based on interest rates charged by JBIC and cofi nancing institutions. 4. Interest rates on loans in Japanese yen are determined based on specifi c loan periods and the amortization schedule. The interest rate shown in the table is a reference rate for a 10-year loan with lump-sum repayment upon maturity. Please make an inquiry at the relevant department for
interest rate on specifi c conditions. 5. Interest rates on loans in foreign currencies are linked to 6-month LIBOR for US dollars. 6. Special interest rates will be applied based on policy implication such as contribution to “Promoting overseas development and acquisition of strategically important natural
resources to Japan” or “Maintaining and improving the International competitiveness of Japanese industries.” 7. Risk premium is added based on the OECD Arrangement. 8. 70% limit for resource-related (import and overseas investment) loans.
2— Loan MaturityThe loan maturity for each loan will be determined by taking account of cash flows generated by each project.
3— Collateral, GuaranteeCollaterals and guarantees are determined in consultation with the clients.
Standard Loan Conditions5

Statistics
Data
1
Breakdown of Countries and Regions
6
98 JBIC ■ Annual Report 2017
(As of July 1, 2017)
Regions Countries
Asia East Asia China, Hong Kong, Democratic People’s Republic of Korea, Republic of Korea, Macao, Mongolia, Taiwan
Southeast Asia Brunei Darussalam, Cambodia, East Timor, Indonesia, Laos, Malaysia, Myanmar, The Philippines, Singapore, Thailand, Vietnam
South Asia Afghanistan, Bangladesh, Bhutan, India, Maldives, Nepal, Pakistan, Sri Lanka
Central Asia and the Caucasus
Armenia, Azerbaijan, Georgia, Kazakhstan, Kyrgyz, Tajikistan, Turkmenistan, Uzbekistan
Oceania Australia, Cook Islands, Fiji, Kiribati, Marshall Islands, Micronesia, Nauru, New Caledonia,New Zealand, North Mariana Islands, Palau, Papua New Guinea, Samoa, Solomon Islands, Tonga, Tuvalu, Vanuatu, Niue
Europe Central and Eastern Europe and Russia
Albania, Belarus, Bosnia and Herzegovina, Bulgaria, Croatia, Czech Republic, Estonia, Hungary, Latvia, Lithuania, Macedonia, Serbia, Montenegro, Moldova, Poland, Romania, Russia, Slovakia, Slovenia, Ukraine, Kosovo
Western Europe Andorra, Austria, Belgium, Cyprus, Denmark, Finland, France, Germany, United Kingdom (U.K.), Greece, Iceland, Ireland, Italy, Liechtenstein, Luxembourg, Malta, Monaco, Netherlands, Norway, Portugal, San Marino, Spain, Sweden, Switzerland, Vatican, Guernsey, Jersey
The Middle East Bahrain, Iran, Iraq, Israel, Jordan, Kuwait, Lebanon, Oman, West Bank and Gaza Strip, Qatar,Saudi Arabia, Syria, Turkey, United Arab Emirates (UAE), Yemen
Africa Northern Africa Algeria, Egypt, Libya, Morocco, Tunisia
Sub-Saharan Africa Angola, Benin, Botswana, Burkina Faso, Burundi, Cameroon, Cape Verde, Central African Republic, Chad, Comoros, Democratic Republic of the Congo, Congo, Cote d’lvoire, Djibouti, Equatorial Guinea, Ethiopia, Gabon, Gambia, Ghana, Guinea, Guinea-Bissau, Kenya, Lesotho, Liberia, Madagascar, Malawi, Mali, Mauritania, Mauritius, Mozambique, Namibia, Niger, Nigeria, Rwanda, Sao Tome and Principe, Senegal, Seychelles, Sierra Leone, Somalia, South Africa, Sudan, Swaziland, Tanzania, Togo, Uganda, Zambia, Zimbabwe, Eritrea, South Sudan
North America Canada, United States (U.S.)
Latin America and the Caribbean Antigua and Barbuda, Argentina, The Bahamas, Barbados, Belize, Bermuda Islands, Bolivia, Brazil, British Virgin Islands, Cayman Islands, Chile, Colombia, Costa Rica, Cuba, Commonwealth of Dominica, Dominican Republic, Ecuador, El Salvador, Grenada, Guatemala, Guyana, Haiti, Honduras, Jamaica, Nicaragua, Panama, Paraguay, Peru, Puerto Rico, Saint Christopher and Nevis, Saint Lucia, St. Vincent and the Grenadines, Suriname, Trinidad and Tobago, Mexico, United States Virgin Islands, Uruguay, Venezuela, Curacao
International Organizations, etc. International Monetary Fund (IMF),International Bank for Reconstruction and Development (IBRD),International Finance Corporation (IFC), Asian Development Bank (ADB),Inter-American Development Bank (IDB), African Development Bank (AfDB),European Bank for Reconstruction and Development (EBRD),Banco Centroamericano de Integración Económica (BCIE),Corporación Andina de Fomento (CAF), East African Development Bank (EADB), Eastern and Southern African Trade and Development Bank (TDB), African Export-Import Bank (Afreximbank), Islamic Development Bank (IsDB), European Investment Bank (EIB), Caribbean Development Bank (CDB), etc.
Others Two-step loans to regional financial institutions in Japan and loans for crossborder projects, etc.
Breakdown of Countries and Regions6