Embed Size (px)
Citation preview
Data Acquisition and Processing Report NOAA Ship Thomas Jefferson
Project No. OPR-B363-TJ-09 2009/09/29
U.S. DEPARTMENT OF COMMERCE NATIONAL OCEANIC AND ATMOSPHERIC ADMINISTRATION
NATIONAL OCEAN SERVICE
Data Acquisition & Processing Report Type of Survey Multibeam and Side Scan Sonar Project No. OPR-B363-TJ-09 Time Frame:
LOCALITY
21 July, 2009 – 31Aug, 2009
State Rhode Island General Locality Block Island Sound
___________ 2009
____________
CHIEF OF PARTY
______________________________________________________________________________________________________________________________________
CDR Shepard M. Smith
National Oceanic and Atmospheric Administration
LIBRARY & ARCHIVES DATE
Data Acquisition and Processing Report NOAA Ship Thomas Jefferson
Project No. OPR-B363-TJ-09 2009/09/29
Table of Contents Page A. EQUIPMENT…………………………………………………………………….1 The Survey Vessels……………………………………………………….........................1 Data Acquisition Systems………………………..……………………………………….3 Data Acquisition and Processing Software……….………………………………….….17 B. QUALITY CONTROL…………………………………………………………19 Bathymetry……………………………………………………………………………….21 Error Modeling in CARIS Hips………………………………………………………….22 Bathymetry Analysis and Feature Classification………………………………………...22 Imagery…………………………………………………………………………………..23 Survey Deliverables and Ancillary Product Generation…………………………………24 C. CORRECTIONS TO ECHO SOUNDINGS………………………………….24 Sound Velocity…………………………………………………………………………..24 Water Level Correctors………………………………………………………………….25 TCARI…………………………………………………………………………………..25 Multibeam Calibration Procedures……………………………………………………...26 Vessel Offsets and Dynamic Draft Correctors.…………………………………………26 D. APPROVAL SHEET………………………………………………………….28 List of Tables Page Table A 1. Survey Vessel Characteristics……………………………………….……….2 List of Figures Page Figure A-1. The Thomas Jefferson……………………………………………………….1 Figure A-2. HSL 3101/3102…………………………………………………………...…2 Figure A-3. 7125 Housing on Thomas Jefferson………………………………………………4 Figure A-4. 7125 Housing on Launch 3102………………………………………………5 Figure A-5. 8125 Housing on Launch 3101………………………………………………6 Figure A-6. Side Scan Towfish Position Calculations……………………………………9 Figure A-7. MVP 100 on S-222………………………………………………………….14 Figure A-8. Khalisco Mud Snapper……………………………………………………...16 Figure A-9. Ponar Grab Sampler………………………………………………………...16
Data Acquisition and Processing Report NOAA Ship Thomas Jefferson
Project No. OPR-B363-TJ-09 1 9/18/2009
A. EQUIPMENT
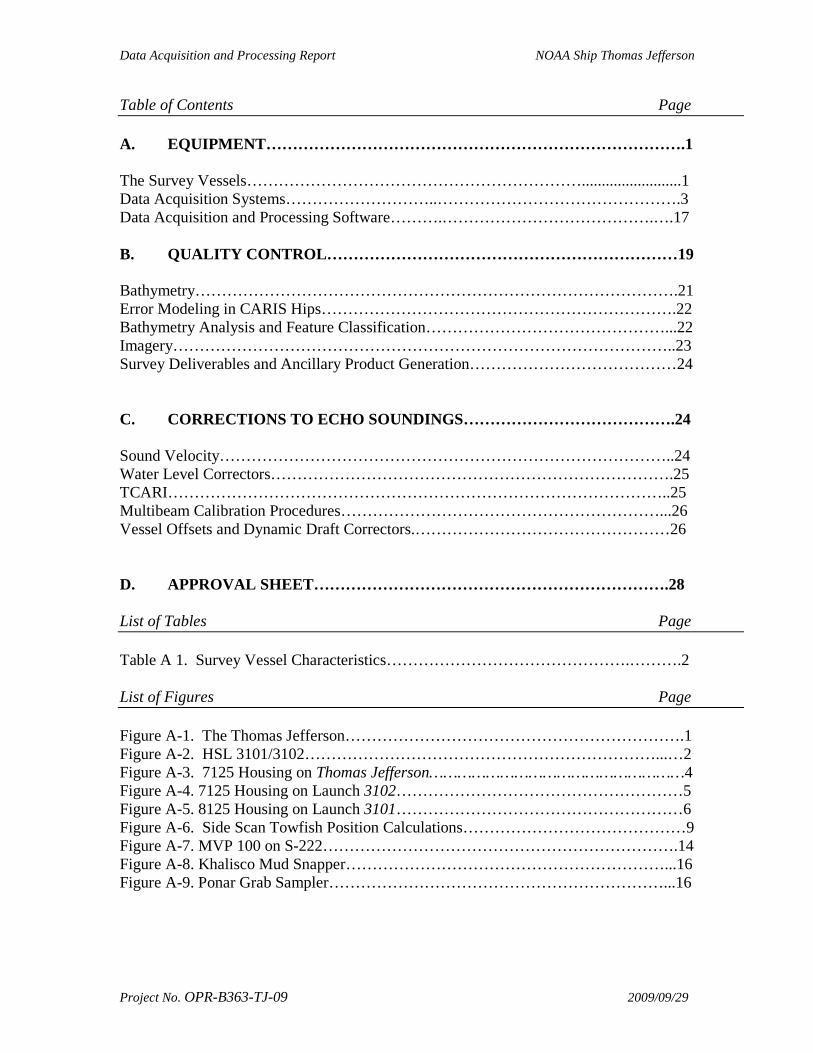
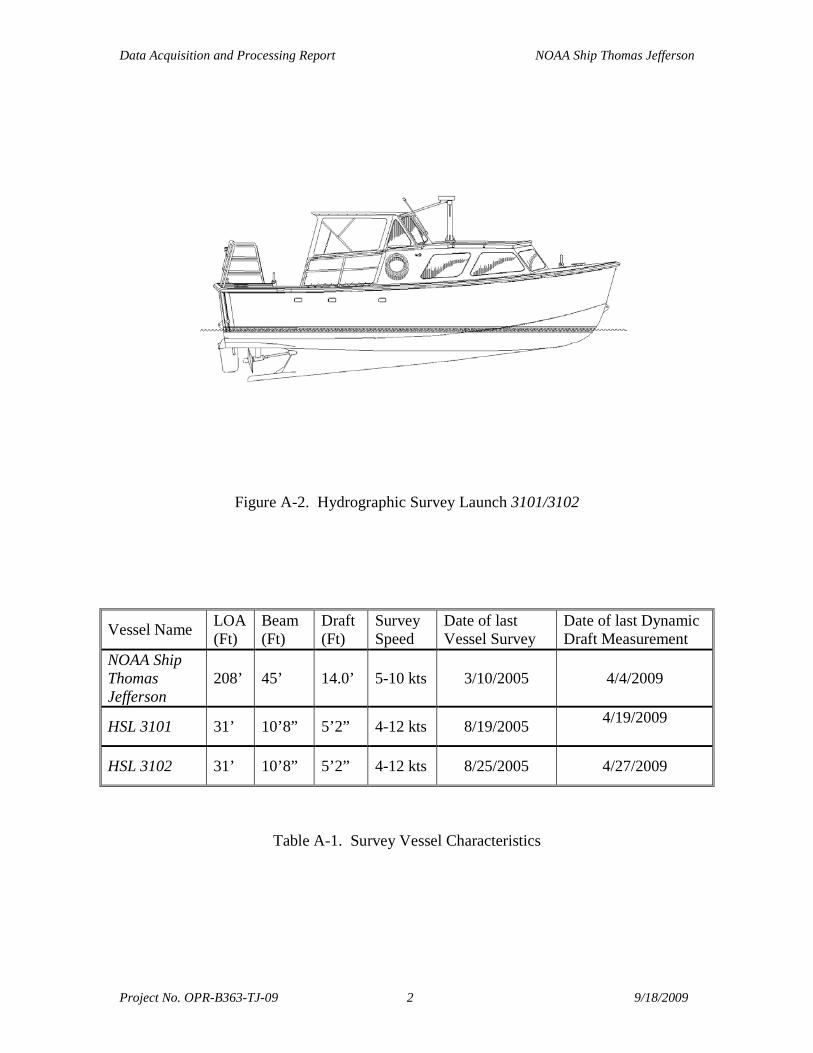
The methods and systems described in this report are used to meet Complete and Object detection coverage requirements and are in accordance with the National Ocean Service Standing Instructions for Hydrographic Surveys (May 2006), the Hydrographic Surveys Specifications and Deliverables Manual (April 2009), Hydrographic Survey Directives, and the Field Procedures Manual for Hydrographic Surveying (April 2009). The Survey Vessels The platforms used for data collection were the NOAA Ship Thomas Jefferson, (Figure A-1) and Hydrographic Survey Launches 3101 and 3102 (Figure A-1). THOMAS JEFFERSON acquired multibeam echosounder (MBES) data, Side Scan Sonar (SSS) imagery and sound velocity profile (SVP) data. The vessel is equipped with a DT Marine Products tow winch (Model 307EHLWR) for side scan deployment, and a DT Marine Oceanographic winch with approximately 1500m of galvanized steel cable for CTD and bottom sample deployment, and a Brooke Ocean Technology MVP 100 for Moving Vessel Profiler (MVP). Launches 3101 and 3102 acquire multibeam echosounder (MBES) data, vertical beam echosounder (VBES) data (3101), Side Scan Sonar (SSS) imagery and sound velocity profile (SVP) data. Table A-1 presents the vessel characteristics for all platforms.
Figure A-1. The NOAA Ship Thomas Jefferson
Data Acquisition and Processing Report NOAA Ship Thomas Jefferson
Project No. OPR-B363-TJ-09 2 9/18/2009
Figure A-2. Hydrographic Survey Launch 3101/3102
Vessel Name LOA (Ft)
Beam (Ft)
Draft (Ft)
Survey Speed
Date of last Vessel Survey
Date of last Dynamic Draft Measurement
NOAA Ship Thomas Jefferson
208’ 45’ 14.0’ 5-10 kts 3/10/2005 4/4/2009
HSL 3101 31’ 10’8” 5’2” 4-12 kts 8/19/2005 4/19/2009
HSL 3102 31’ 10’8” 5’2” 4-12 kts 8/25/2005 4/27/2009
Table A-1. Survey Vessel Characteristics
Data Acquisition and Processing Report NOAA Ship Thomas Jefferson
Project No. OPR-B363-TJ-09 3 9/18/2009
Data Acquisition Systems A complete listing of the data acquisition systems used for Project OPR-D304-TJ-09 are listed in Appendix A of this report.
A.1 ODOM Echotrac DF3200 MK II Vertical Beam Echosounder The Echotrac DF3200 MKII is a dual-frequency digital recording echosounder system with an analog paper recorder. The high frequency setting may range from 100-1000 kHz. The low frequency setting may range from 12-50 kHz. It is hull-mounted on the THOMAS JEFFERSON and can be installed on Launch 3101. The high frequency transducer on THOMAS JEFFERSON operates at 200 kHz. The high frequency pulse forms a circular beam with a main-lobe beam footprint of 7.5° at the -6dB point. The low-frequency transducer operates at 24 kHz with a rectangular main-lobe beam footprint of 27° (along-track direction) by 47° (across-track direction) at the -6 dB point. Soundings are acquired in meters on both frequencies, with the high frequency selected for all sounding data. On THOMAS JEFFERSON, the transducer is installed in an acoustically transparent fiberglass blister on the port side, adjacent to the KONGSBERG EM1002 multibeam transducer. On Launch 3101, the transducer is mounted on the port side on the same retractable arm that can accommodate the Reson 8125. The installation of the Odom on Launch 3101 allows simultaneous acquisition of Klein 5000 side scan with general survey-grade bathymetry when the ODOM is operated in high frequency only mode. For the purposes of calculating total propagated error (TPU), the ODOM Echotrac MK II is assumed to be a single-frequency multibeam transducer with one beam. The maximum across-track and along-track beam angles are assumed to be identical at a value of 7.5°. The sonar is assumed to have a pulse length of 0.1 ms at 100 kHz and a ping rate of 20 Hz. As the primary bathymetry source for THOMAS JEFFERSON is almost exclusively the Reson 7125, the vertical-beam echosounder data for THOMAS JEFFERSON is archived in raw format when acquired. The ODOM Echotrac is inappropriate for sole use in situations requiring full bottom or object detection bathymetry coverage. However, combined with side scan sonar acquisition, the ODOM Echotrac can be used to meet NOAA specifications for full bottom coverage and object detection. Owing to its wide beamwidth, vessel pitch and roll calculations are not applied to ODOM Echotrac data. During typical acquisition conditions, the high-frequency beamwidth is sufficiently wide to receive a primary-lobe hit at nadir regardless of vessel attitude. This breaks down, however, when the vessel pitches more than 3° or rolls more than 5°. Care is taken to avoid using the ODOM as the primary source of bathymetry in situations where the pitch or roll would cause attitude artifacts or side-lobe hits.
Data Acquisition and Processing Report NOAA Ship Thomas Jefferson
Project No. OPR-B363-TJ-09 4 9/18/2009
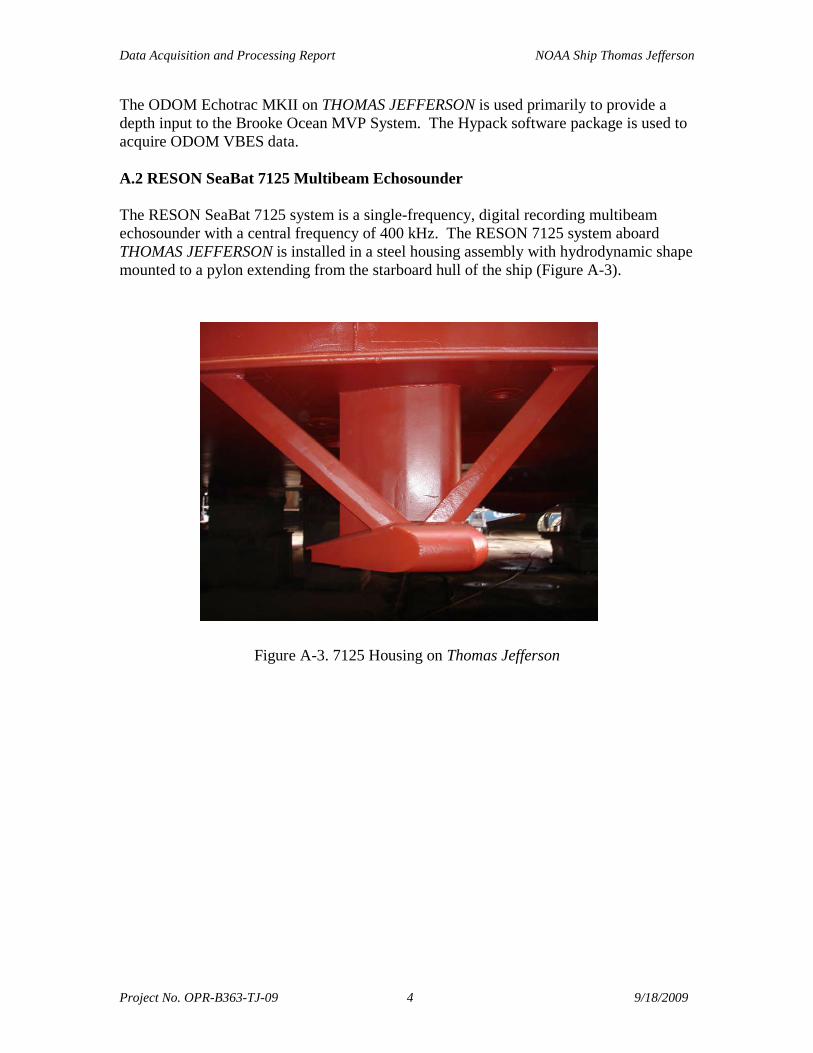
The ODOM Echotrac MKII on THOMAS JEFFERSON is used primarily to provide a depth input to the Brooke Ocean MVP System. The Hypack software package is used to acquire ODOM VBES data. A.2 RESON SeaBat 7125 Multibeam Echosounder The RESON SeaBat 7125 system is a single-frequency, digital recording multibeam echosounder with a central frequency of 400 kHz. The RESON 7125 system aboard THOMAS JEFFERSON is installed in a steel housing assembly with hydrodynamic shape mounted to a pylon extending from the starboard hull of the ship (Figure A-3).
Figure A-3. 7125 Housing on Thomas Jefferson

Data Acquisition and Processing Report NOAA Ship Thomas Jefferson
Project No. OPR-B363-TJ-09 5 9/18/2009
The RESON 7125 system aboard Launch 3102 is installed in a RESON Seabat 7125 mounting bracket deployed on a retractable arm from the hull. (Figure A-4).
Figure A-4. 7125 Housing on Launch 3102 The RESON 7125 forms 256 beams in the receive array, each of which has a 0.5° across-track resolution and 1° along-track resolution. The RESON 7125 has a maximum ping rate of 48 Hz and is capable of bottom detection in depths from 1-200 m. The best expected performance of the RESON 7125, as installed on THOMAS JEFFERSON and Launch 3102, is to the IHO Special Order standard. Actual performance will vary according to sea state, swell, tide zoning error, and sound velocity spatial and temporal distribution, and is typically to the IHO Order 1 standard. The RESON 7125 performs active beam steering to correct for sound velocity at the transducer head using an Applied Microsystems LTD Sound Velocity and Temperature Smart Sensor. This sensor will be discussed in more detail in the Sound Velocity Equipment Section. The user selectable range scale on the Reson 7125 was adjusted appropriately depending upon the survey depth. Notable Reson7125 equipment changes: DN153-S222: Problems with receiving transducer on ship, swapped with launch. Patch tested and values updated in hvf.
Data Acquisition and Processing Report NOAA Ship Thomas Jefferson
Project No. OPR-B363-TJ-09 6 9/18/2009
DN156-3102: Transducer broken sent back to Reson. Replaced with loaner transducer 7125 s/n: 2405277 from Reson S/N: 2208050, changed mounting bracket, patch tested, and updated hvf. DN203-3102: PPS time issue shows up in 7125 menu module problem on CPU S/N 61203-sent for repairs, returned DN205. DN209-3102 & S222: Swap out ship's Reson S/N 50357 CPU with the launch S/N 61203 (not working), then switch back on DN215.
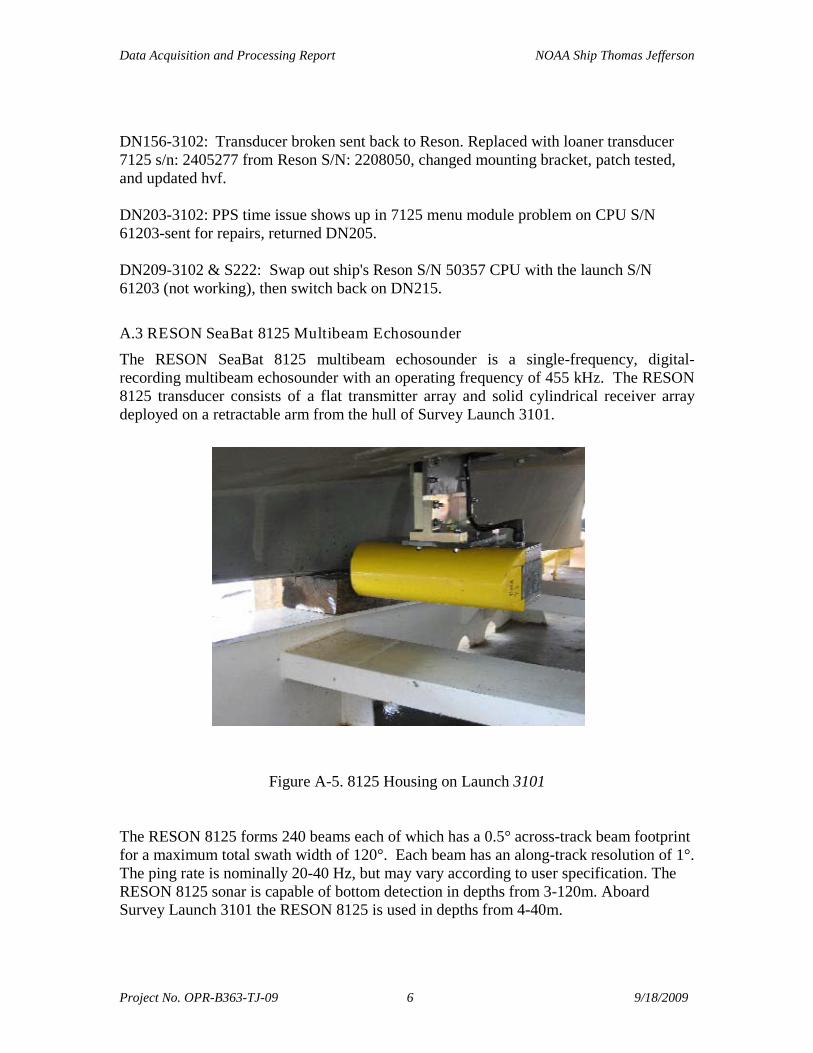
A.3 RESON SeaBat 8125 Multibeam Echosounder The RESON SeaBat 8125 multibeam echosounder is a single-frequency, digital-recording multibeam echosounder with an operating frequency of 455 kHz. The RESON 8125 transducer consists of a flat transmitter array and solid cylindrical receiver array deployed on a retractable arm from the hull of Survey Launch 3101.
Figure A-5. 8125 Housing on Launch 3101 The RESON 8125 forms 240 beams each of which has a 0.5° across-track beam footprint for a maximum total swath width of 120°. Each beam has an along-track resolution of 1°. The ping rate is nominally 20-40 Hz, but may vary according to user specification. The RESON 8125 sonar is capable of bottom detection in depths from 3-120m. Aboard Survey Launch 3101 the RESON 8125 is used in depths from 4-40m.
Data Acquisition and Processing Report NOAA Ship Thomas Jefferson
Project No. OPR-B363-TJ-09 7 9/18/2009
The RESON 8125 performs active beam steering to correct for sound velocity at the transducer head using an ODOM Hydrographic Systems Digibar Pro sea surface sound velocity sensor. This sensor will be discussed in more detail in the Sound Velocity Equipment section. For the purposes of calculating total propagated error, the RESON 8125 is assumed to have an operational frequency of 455 kHz, a pulse length of 0.15ms, and a typical ping rate of 40Hz. The RESON 8125 meets NOAA specifications for object detection in shallow water. The best expected performance of the RESON 8125, as installed on Survey Launch 3101, is to the IHO Special Order standard. Actual performance will vary according to sea state, swell, tide zoning error, and sound velocity spatial and temporal distribution, and is typically to the IHO Order 1 standard. The user selectable range scale on the Reson 8125 was adjusted appropriately depending upon the survey depth. A.4 Kongsberg EM 1002 Multibeam Echosounder The Kongsberg EM1002 system is a single-frequency, digital recording multibeam echosounder with an operating frequency of about 95 kHz. The EM1002 aboard THOMAS JEFFERSON was installed in August 2001 in Jacksonville, FL, while the ship was still under the purview of the U.S. Navy. The Kongsberg EM1002 transducer consists of a curved transmitter array and flat receiver array encased in an acoustically transparent fiberglass blister that is rigidly fixed to the hull of THOMAS JEFFERSON at the keel near frame 20. The KONGSBERG EM1002 forms 111 beams each of which has a 2° across-track beam footprint for a maximum total swath width of 150°. Each beam has an along-track beam resolution of 1.5°. The ping rate is nominally 10 Hz, but may vary depending on water depth, swath width, or user specification. For any given survey area optimal line spacing is determined for the system. A maximum width is set in the acquisition software (using the equidistant setting). The resulting swath is usually less than the maximum of 75 degrees. This compressed swath increases the ping frequency and therefore the data density. The KONGSBERG EM1002 is capable of bottom detection in depths from 5-1000m. Aboard the THOMAS JEFFERSON the KONGSBERG EM1002 is used in depths from 15m-1000m. The Windows-based Kongsberg Seafloor Information System (SIS) software package is used to acquire EM1002 data. Active beam steering is performed to correct for sound velocity at the transducer head using an Applied Microsystems Smart SV&T sea surface sound velocity sensor. This sensor will be discussed in more detail in the Sound Velocity Equipment section. In addition, the curved face of the transducer array is designed to mechanically steer acoustic energy. An outer beam roll calibration coefficient is determined before starting
Data Acquisition and Processing Report NOAA Ship Thomas Jefferson
Project No. OPR-B363-TJ-09 8 9/18/2009
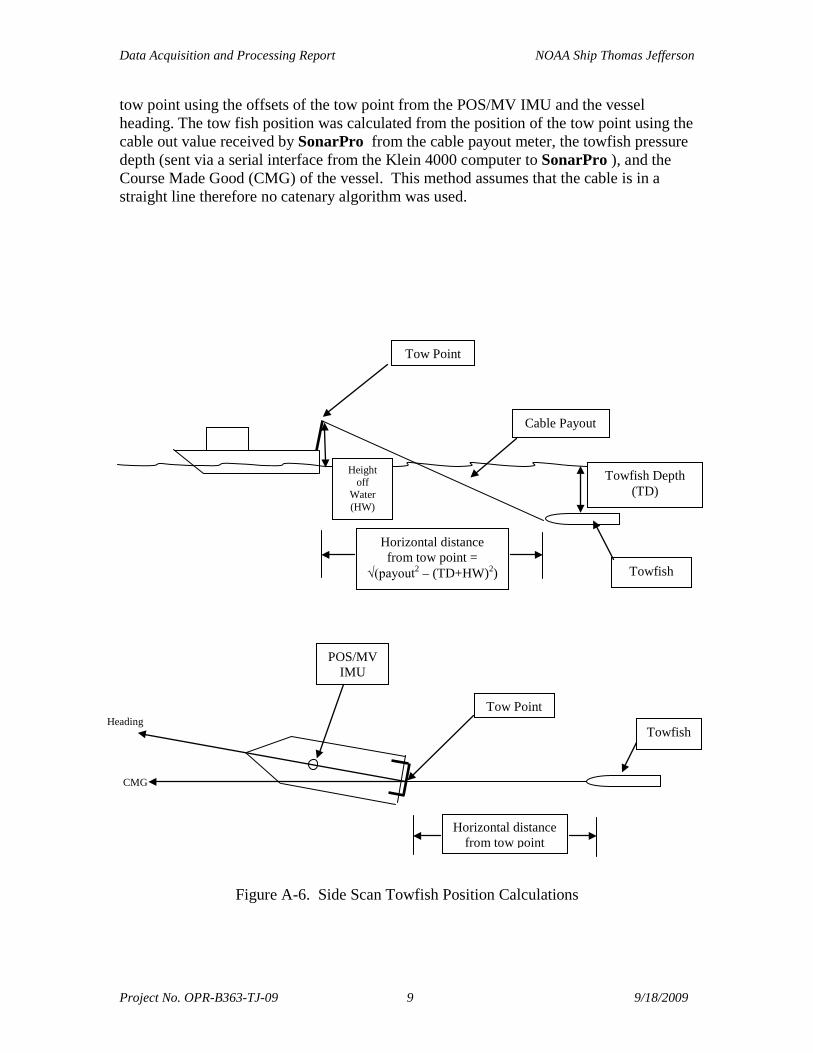
acquisition for a project. This value is entered into the acquisition software and cannot be post processed. The Kongsberg EM1002 does not meet NOAA specifications for object detection in shallow water (<20m). EM1002 data must be acquired with either side-scan sonar or high-resolution multibeam echosounder data (e.g. RESON 7125) to meet NOAA object detection specifications in shallow water. For the purposes of calculating total propagated error, the KONGSBERG EM1002 is assumed to have an operational frequency of 95 kHz, pulse length of 0.2ms and a typical ping rate of between 1-8 Hz. The best expected performance of the KONGSBERG EM1002, as installed on THOMAS JEFFERSON in 15m of water with an isopycnal water column and sound velocity of 1500 ms-1, is to the IHO Order 1 standard. Actual performance will vary according to sea state, water depth, swell, tide zoning error, and sound velocity spatial and temporal distribution. A.5 KLEIN 5000 High-speed Side Scan Sonar The KLEIN 5000 high-resolution side-scan sonar (SSS) system is a beam-forming acoustic imagery device with an operating frequency of 455 kHz and vertical beam angle of 40°. The KLEIN 5000 system consists of a KLEIN 5500 towfish, a Transceiver/Processing Unit (TPU), and a computer for user interface. Stern-towed units also include a tow cable telemetry assembly. There are two configurations for data acquisition using the KLEIN 5000 system: stern-towed and hull-mounted. S-222 uses exclusively towed SSS, HSL 3101 is hull mount configuration, HSL 3102 is typically hull mounted but can be converted to towed is required. The KLEIN 5000 system is distinct from other commercially-available side scan sonars in that it forms 5 simultaneous, dynamically-focused receiver beams per transducer face. This improves along-track resolution to approximately 30cm at the 100m range scale, even when acquiring data at up to 10 knots. Across-track resolution is typically 7.5cm at the 100m range scale. The achievable 30cm resolution meets the NOAA Hydrographic Surveys Specifications and Deliverables Manual (HSSDM) for object detection. Klein SONARPRO is used to acquire KLEIN 5000 side scan sonar data. Digital data from the Klein 5000 TPU were sent directly to the Klein 5000 computer for display and logging by Klein SonarPro software. Raw digital side scan data from the Klein 5000 were collected in (SDF) and maintained full resolution, with no conversion or down sampling techniques applied. These files were archived to the raw data storage drives at the end of each line for initial processing and quality control review Towfish positioning was provided by CARIS HIPS using cable out values recorded in the Sonar Pro SDF files. This program uses Payout and Towfish Depth, Figure A-6, to compute towfish positions. The Payout and Depth method computed the position of the
Data Acquisition and Processing Report NOAA Ship Thomas Jefferson
Project No. OPR-B363-TJ-09 9 9/18/2009
tow point using the offsets of the tow point from the POS/MV IMU and the vessel heading. The tow fish position was calculated from the position of the tow point using the cable out value received by SonarPro from the cable payout meter, the towfish pressure depth (sent via a serial interface from the Klein 4000 computer to SonarPro ), and the Course Made Good (CMG) of the vessel. This method assumes that the cable is in a straight line therefore no catenary algorithm was used.
Figure A-6. Side Scan Towfish Position Calculations
CMG
Heading
Cable Payout
Horizontal distance from tow point =
√(payout2 – (TD+HW)2)
Tow Point
Tow Point
POS/MV IMU
Towfish
Towfish
Horizontal distance from tow point
Towfish Depth (TD)
Height off
Water (HW)
Data Acquisition and Processing Report NOAA Ship Thomas Jefferson
Project No. OPR-B363-TJ-09 10 9/18/2009
The ship’s north and east velocity vectors are filtered to calculate the ship’s CMG. The CMG is used to determine the azimuth from the tow block to the side scan towfish. The position for the side scan towfish was computed based on the vessel’s heading, the reference position (POS/MV IMU), the measured offsets (X, Y, and Z) to the tow point, height of the tow point above the water, Course Made Good and the amount of cable out. This calculated towfish position was sent to the sonar data collection system in the form of a GGA (NMEA-183, National Marine Electronics Association, Global Positioning System Fix Data String) message where it was merged with the sonar data file. Cable adjustments were made using a remote winch controller in acquisition in order to maintain acceptable towfish altitudes and sonar record quality. Changes to the amount of cable out were automatically saved to the SonarPro SDF. Towfish altitude was maintained between 8% and 20% of the range (4m-10m), when conditions permit. For equipment and personnel safety as well as safe vessel maneuverability, data may have been collected at towfish altitudes outside the 8% to 20% of the range over shoal areas and in the vicinity of charted obstructions or wrecks. In some regions of the survey area, the presence of a significant density layer required that the altitude of the towfish be maintained outside the 8% to 20 % of the range to avoid refraction in the sonar data that would mask small targets in the outer sonar swath range. When the towfish altitude was either greater than 20% or less than 8%, periodic confidence checks on linear features (e.g. trawl scars) or geological features (e.g. sand waves or sediment boundaries) were made to verify the quality of the sonar data. Confidence checks ensured the ability to detect one-meter high objects across the full sonar record range. Another feature that affected the towfish altitude was the use of a K-wing depressor. The K-wing depressor was attached directly to the towfish and served to keep it below the vessel wake, even in shallower near shore waters at slower survey speeds. The use of the K-wing reduced the amount of cable payout, which in turn reduced the positioning error of the towfish. Another benefit to less cable out was the increased maneuverability of the ship in shallow water. Less cable out reduced the need to recover cable prior to turning for the next survey line, permitted tighter turns and increased survey efficiency. Side scan data file names were changed automatically every 15 minutes and manually at the completion of a survey line. Notable SSS equipment changes: DN166: Ship’s tpu #S/N 91182 and spare cable swapped and placed on launch 3101, bad tpu S/N# 119301 and cable -sent for repairs. DN176-3101: Returned ships's tpu, s/n 91182 to ship. EEB returned TPU S/N137 CD0000825292 placed on launch.
Data Acquisition and Processing Report NOAA Ship Thomas Jefferson
Project No. OPR-B363-TJ-09 11 9/18/2009
Hull-Mounted Configuration Aboard both survey launches, the towfish can be mounted to an aluminum sled using omega brackets. The hull-mounted configuration is normally used in depths of twenty meters or less, per the HSSDM. Aboard Launch 3101, sidescan may be collected concurrently with ODOM Echotrac MkII vertical beam bathymetry. Aboard Launch 3102, sidescan may be collected concurrently with Reson 8101 or 7125 MBES. A.6 Manual Sounding Equipment Diver Least Depth Gauge The diver least depth gauge is a hand-held device that uses pressure to determine depth of water over a discrete point (e.g. mast of a shipwreck). A raw sounding obtained during a dive is corrected with verified tides and a sound velocity profile acquired in the vicinity of the object. The sound velocity profile is acquired from THOMAS JEFFERSON or one of the launches. Calibration was accomplished on the diver least depth gauge during the 2007-2008 winter in port period. Lead Lines Lead lines are composed of brass or bronze wire that is encased in dark red cotton tiller rope and marked at predetermined intervals. Lead lines are used to perform confidence checks against acoustic echosounders. Leadlines aboard THOMAS JEFFERSON and Survey Launches 3101 and 3102 are marked in decimeters. An alternative method of determining manual depths is to use a steel engineering tape with a lead attached. A.7 Positioning and Orientation Equipment Applanix POS/MV A basic requirement of multibeam hydrography is accurate ship’s position and attitude data during data acquisition. THOMAS JEFFERSON uses inertial positioning and orientation sensors and U.S. Coast Guard Differential GPS (DGPS) for a highly accurate blended position and orientation solution. THOMAS JEFFERSON, Survey Launch 3101, and Survey Launch 3102 are each equipped with Trimble DSM212L DGPS receivers. The DSM212L includes a 12-channel GPS receiver capable of receiving external RTCM correctors from a shore-based reference station. The system outputs position information once each second. Best expected position accuracy with the DSM212L system is less than one meter with 5 or more space vehicle vectors in the solution. This system is very accurate in the long term (>5 min) but subject to short period noise. Inertial position calculations on THOMAS JEFFERSON, Survey Launch 3101, and Survey Launch 3102 are provided by an Applanix POS/MV Model 320 v.4. The
Data Acquisition and Processing Report NOAA Ship Thomas Jefferson
Project No. OPR-B363-TJ-09 12 9/18/2009
POS/MV 320 system includes dual GPS antennas, an inertial measurement unit (IMU), and data processor (PCS). The IMU measures linear and angular accelerations corresponding to the major motions of the vessel (heave, pitch, roll, yaw) and inputs this data to the PCS, where it is combined with a GPS position determined by carrier-phase differential measurements to give the final position solution. The POS/MV position solution is not sensitive to short period noise, but its accuracy may decay rapidly over time. The blended DGPS and inertial position/orientation solution has typical values of 0.02° true roll and pitch accuracy, 0.02° heading accuracy, 2m position accuracy, and 0.03 ms-1 velocity accuracy. These parameters are monitored in real time during acquisition using the POS/MV user interface software. These values meet the position accuracy standard for an IHO Order 1 survey. All acquisition platforms are equipped with Precise Timing, a multibeam sonar acquisition configuration which synchronizes all data to the same time. The timing message is generated by the POS/MV which is received by both the acquisition computer and the Reson TPU. At the time of data acquisition, the POS/MV-generated time stamp is applied to the data instead of the system clock. Precise Timing reduces the variable effects of time latency and creates a single, measurable latency. This is determined via a patch test. All platforms utilize True Heave (a long-period recording of vessel heave used to detect longer period sea swells that may not be detected during short-period heave calculations) for a post processed heave solution. Notable Positioning and Orientation Equipment changes: DN217-3101: L2 antenna went bad, replaced and re GAMs calibrated. A.8 Sound Velocity Profiles A Brooke Ocean Technology Moving Vessel Profiler (MVP) with an Applied Microsystems Smart Sound Velocity and Pressure (SV&P) sensors or a Seabird Electronics SBE-19 CTD were used to collect sound speed profile (SSP) data from Thomas Jefferson. Seabird Electronics SBE-19 CTD+ units were used to collect sound speed profile (SSP) data from Launches 3101 and 3102. SSP data were obtained at intervals frequent enough to reduce sound speed errors. The frequency of casts was based on observed sound speed changes from previously collected profiles and time elapsed since the last cast. Multiple casts were taken along a survey line to identify the rate and location of sound speed changes. Subsequent casts were made based on the observed trend of sound speed changes. As the sound speed profiles change, cast frequency and location are modified accordingly. Confidence checks of the sound speed profile casts were conducted weekly by comparing simultaneous casts taken with different Sound Velocity and Pressure sensors or with a Sound Velocity and Pressure sensor and a Seabird SBE-19 CTD.
Data Acquisition and Processing Report NOAA Ship Thomas Jefferson
Project No. OPR-B363-TJ-09 13 9/18/2009
Sound speed data and calibration records are included with the survey data in Section II of the Separates for each sheet’s Descriptive Report. Sea-Bird SBE19/19+ CTD Profilers THOMAS JEFFERSON and Survey Launches 3101 and 3102 acquire water column sound velocity data using Sea-Bird Electronics SeaCat SBE19 and SBE19+ Conductivity-Temperature-Depth (CTD) profilers. Temperature is measured directly. Salinity is calculated from measured electrical conductivity. Depth is calculated from strain gauge pressure. THOMAS JEFFERSON is equipped with a SeaCat SBE19 CTD profiler with strain gauge pressure sensor. The SBE19 is capable of CTD profiling at depths from 0-3400m. Post calibration drift is expected to be 0.02 °C yr-1, 0.012S m-1 yr-1, and 4.5 psia yr-1 for temperature, conductivity, and pressure, respectively. The SBE19 is deployed using the DT Marine Oceanographic winch for ship based acquisition. Survey Launch 3101 and Survey Launch 3102 are each equipped with a SeaCat SBE19+ CTD profiler with strain gauge pressure sensor. The SBE19+ has a specified post-calibration temperature accuracy of 0.0005S m-1, and strain-gauge pressure accuracy of 0.35 psia. Post calibration drift is expected to be 0.002 °C yr-1, 0.004S m-1 yr-1, and 0.168 psia yr-1 for temperature, conductivity, and pressure, respectively. The SBE19+ is capable of CTD profiling at depths from 0-350m. The SBE19+ is deployed by hand from Survey Launch 3101 and 3102. All CTD instruments were returned to the manufacturer for calibration during the 2008-2009 winter in port period. Calibration documents are contained in Separates II of the Descriptive Report accompanying this report. Sea Surface Sound Velocimeters Unlike CTD profilers, sea surface sound velocimeters (SSVS) calculate sound velocity in water using two-way travel time. The typical SSVS consists of a transducer and a reflector at a known distance from the transducer. A pulse of known frequency is emitted, reflects at the reflector surface, and returns to the transducer. The two-way travel time is measured, and sound velocity derived from the two-way travel time. SSVS are required for multibeam systems that perform active beam steering at the transducer head. The Reson 7125 and Reson 8125 systems both require SSVS data. The AML Smart SV&T Probe is a real-time time-of-flight sound velocimeter and thermistor sensor. The manufacturer specified sound velocity accuracy is 0.05 ms-1 and temperature accuracy is 0.05 °C. Empirical observations of drift show a sound velocity drift of approximately 0.5 ms-1 yr-1and temperature drift of approximately 0.05 °C yr-1. Aboard THOMAS JEFFERSON, the AML Smart SV&T probe is mounted in an insulated sea chest in the sonar void. Sea surface temperature and sound velocity values are output
Data Acquisition and Processing Report NOAA Ship Thomas Jefferson
Project No. OPR-B363-TJ-09 14 9/18/2009
in real time to the SIMRAD EM1002 and Reson 7125 systems at a rate of 10 Hz. Data are sent in real time to the Kongsberg EM1002 transducer. The AML Smart SV&T Probe was returned to the manufacturer and calibrated during the 2008-2009 winter in-port period. ODOM Hydrographic Systems Digibar Pro The Digibar Pro is a real-time time-of-flight sea surface sound velocimeter. The manufacturer specified sound velocity accuracy is 0.3 ms-1. Aboard Survey Launch 3101, the Digibar Pro is mounted to an aluminum sled aft of the RESON 8125 transducer. Sea surface temperature and sound velocity values are output to the RESON 8125 system at a rate of 10 Hz. Data are sent in real time to the RESON 8125 processor unit. Aboard Survey Launch 3102, the Digibar Pro is mounted in the RESON Seabat 7125 housing. Sea surface temperature and sound velocity values are output to the RESON 7125 system at a rate of 10 Hz. Data are sent in real time to the RESON 7125 processor unit. The units were returned to the manufacturer and calibrated during the 2008-2009 in port period. Notable digibar equipment changes: DN156-3102: Swapped internal guts of digibar with NRT4 #CD0000659517, added cal report to B363. DN201-3102: Returned from calibration and replaced on launch, added cal report to B363. Brooke Ocean Technology Moving Vessel Profiler 100 The Moving Vessel Profiler (MVP) (figure A-7) is a self-contained profiling system capable of sampling water column profiles to 100m depth. MVP-100 was mounted to the port stern quarter. Configuration parameters, offsets, and installation diagrams are included in Appendix A. The MVP consists of a computer-controlled high speed hydraulic winch, a cable metering, over-boarding and docking system, a conductor cable and a streamlined free fall fish (FFF) housing an Applied Microsystems “time of flight” SV&P Smart Sensor (see SV&P below) . The system as configured aboard the THOMAS JEFFERSON collects vertical profiles of sound velocity data while the ship is underway at survey speed. The unit is located on the fantail and controlled remotely from the ship’s acquisition room. The MVP is capable of importing its data directly into the Kongsberg SIMRAD EM 1002 multi-beam echosounder (MBES) at the time of acquisition. When using MVP casts in conjunction with the RESON 7125 MBES, sound velocity data is processed using Velocwin software, then applied in CARIS HIPS during post processing.
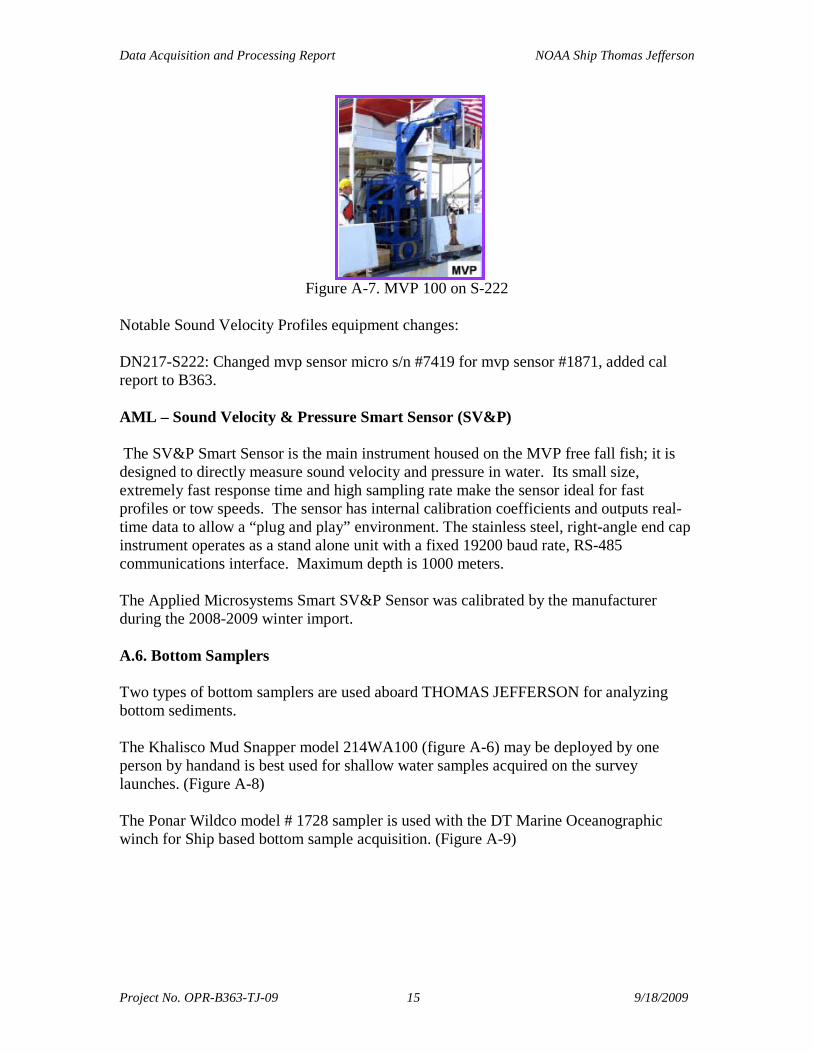
Data Acquisition and Processing Report NOAA Ship Thomas Jefferson
Project No. OPR-B363-TJ-09 15 9/18/2009
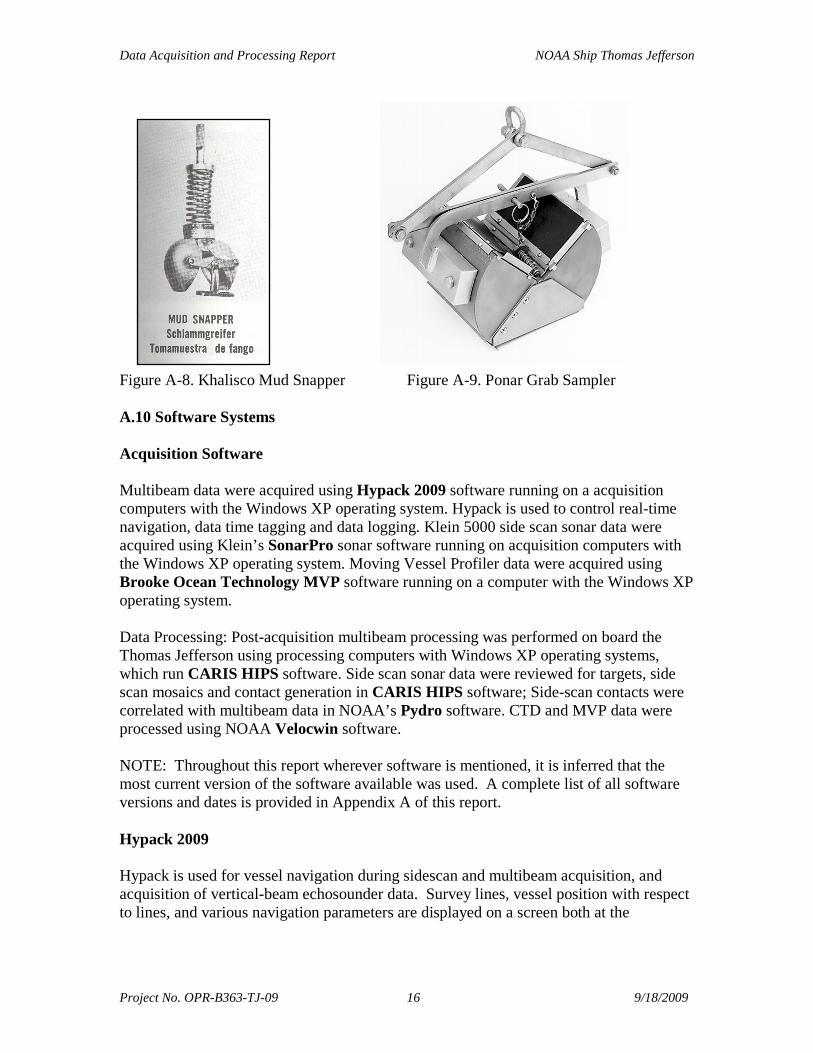
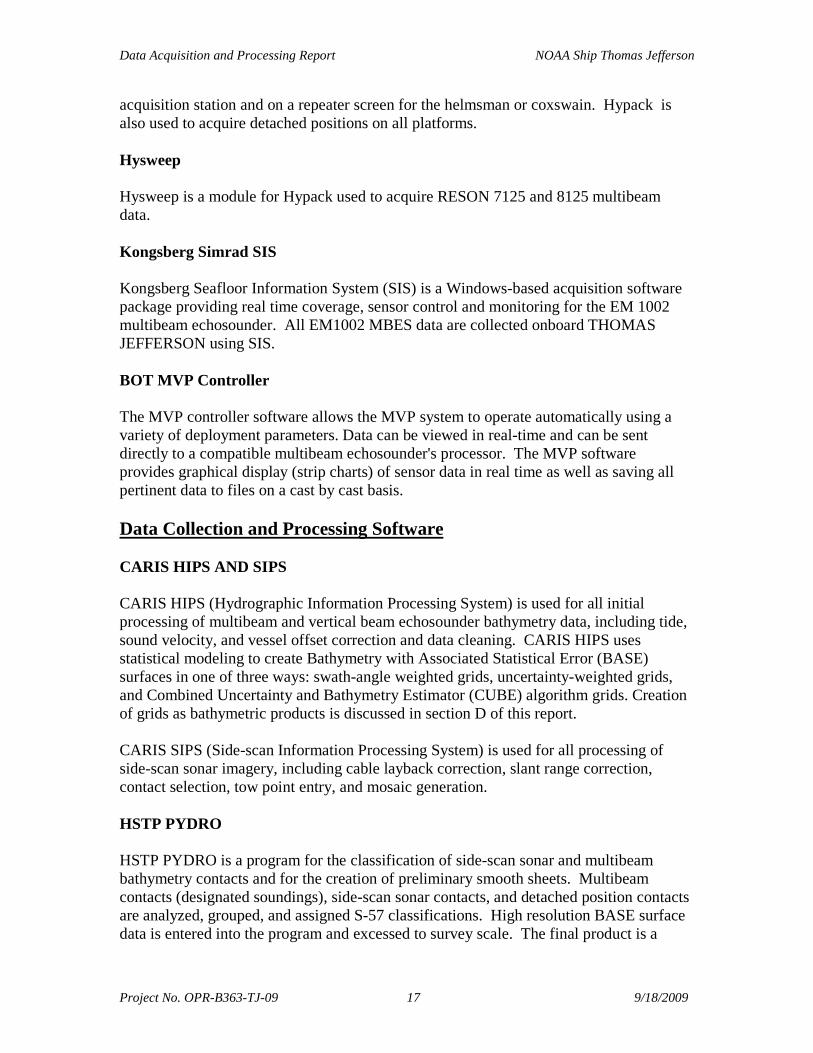
Figure A-7. MVP 100 on S-222 Notable Sound Velocity Profiles equipment changes: DN217-S222: Changed mvp sensor micro s/n #7419 for mvp sensor #1871, added cal report to B363. AML – Sound Velocity & Pressure Smart Sensor (SV&P) The SV&P Smart Sensor is the main instrument housed on the MVP free fall fish; it is designed to directly measure sound velocity and pressure in water. Its small size, extremely fast response time and high sampling rate make the sensor ideal for fast profiles or tow speeds. The sensor has internal calibration coefficients and outputs real-time data to allow a “plug and play” environment. The stainless steel, right-angle end cap instrument operates as a stand alone unit with a fixed 19200 baud rate, RS-485 communications interface. Maximum depth is 1000 meters. The Applied Microsystems Smart SV&P Sensor was calibrated by the manufacturer during the 2008-2009 winter import. A.6. Bottom Samplers Two types of bottom samplers are used aboard THOMAS JEFFERSON for analyzing bottom sediments. The Khalisco Mud Snapper model 214WA100 (figure A-6) may be deployed by one person by handand is best used for shallow water samples acquired on the survey launches. (Figure A-8) The Ponar Wildco model # 1728 sampler is used with the DT Marine Oceanographic winch for Ship based bottom sample acquisition. (Figure A-9)
Data Acquisition and Processing Report NOAA Ship Thomas Jefferson
Project No. OPR-B363-TJ-09 16 9/18/2009
Figure A-8. Khalisco Mud Snapper Figure A-9. Ponar Grab Sampler
A.10 Software Systems Acquisition Software Multibeam data were acquired using Hypack 2009 software running on a acquisition computers with the Windows XP operating system. Hypack is used to control real-time navigation, data time tagging and data logging. Klein 5000 side scan sonar data were acquired using Klein’s SonarPro sonar software running on acquisition computers with the Windows XP operating system. Moving Vessel Profiler data were acquired using Brooke Ocean Technology MVP software running on a computer with the Windows XP operating system. Data Processing: Post-acquisition multibeam processing was performed on board the Thomas Jefferson using processing computers with Windows XP operating systems, which run CARIS HIPS software. Side scan sonar data were reviewed for targets, side scan mosaics and contact generation in CARIS HIPS software; Side-scan contacts were correlated with multibeam data in NOAA’s Pydro software. CTD and MVP data were processed using NOAA Velocwin software. NOTE: Throughout this report wherever software is mentioned, it is inferred that the most current version of the software available was used. A complete list of all software versions and dates is provided in Appendix A of this report. Hypack 2009 Hypack is used for vessel navigation during sidescan and multibeam acquisition, and acquisition of vertical-beam echosounder data. Survey lines, vessel position with respect to lines, and various navigation parameters are displayed on a screen both at the
Data Acquisition and Processing Report NOAA Ship Thomas Jefferson
Project No. OPR-B363-TJ-09 17 9/18/2009
acquisition station and on a repeater screen for the helmsman or coxswain. Hypack is also used to acquire detached positions on all platforms. Hysweep Hysweep is a module for Hypack used to acquire RESON 7125 and 8125 multibeam data. Kongsberg Simrad SIS Kongsberg Seafloor Information System (SIS) is a Windows-based acquisition software package providing real time coverage, sensor control and monitoring for the EM 1002 multibeam echosounder. All EM1002 MBES data are collected onboard THOMAS JEFFERSON using SIS. BOT MVP Controller The MVP controller software allows the MVP system to operate automatically using a variety of deployment parameters. Data can be viewed in real-time and can be sent directly to a compatible multibeam echosounder's processor. The MVP software provides graphical display (strip charts) of sensor data in real time as well as saving all pertinent data to files on a cast by cast basis. Data Collection and Processing Software CARIS HIPS AND SIPS CARIS HIPS (Hydrographic Information Processing System) is used for all initial processing of multibeam and vertical beam echosounder bathymetry data, including tide, sound velocity, and vessel offset correction and data cleaning. CARIS HIPS uses statistical modeling to create Bathymetry with Associated Statistical Error (BASE) surfaces in one of three ways: swath-angle weighted grids, uncertainty-weighted grids, and Combined Uncertainty and Bathymetry Estimator (CUBE) algorithm grids. Creation of grids as bathymetric products is discussed in section D of this report. CARIS SIPS (Side-scan Information Processing System) is used for all processing of side-scan sonar imagery, including cable layback correction, slant range correction, contact selection, tow point entry, and mosaic generation. HSTP PYDRO HSTP PYDRO is a program for the classification of side-scan sonar and multibeam bathymetry contacts and for the creation of preliminary smooth sheets. Multibeam contacts (designated soundings), side-scan sonar contacts, and detached position contacts are analyzed, grouped, and assigned S-57 classifications. High resolution BASE surface data is entered into the program and excessed to survey scale. The final product is a
Data Acquisition and Processing Report NOAA Ship Thomas Jefferson
Project No. OPR-B363-TJ-09 18 9/18/2009
Preliminary Smooth Sheet file (PSS), which is delivered to the Atlantic Hydrographic Branch as part of the final submission package. Pydro Versions 7.3 and later have functionality for TCARI installed. TCARI is described in detail in section D.3. The TCARI file for the area is received from NOS and loaded into Pydro along with the predicted, observed, or verified tide files for the corresponding stations. The use of TCARI is specified in the Project Instructions. Pydro is also used for chart comparisons, generation of chartlets, generation of Danger to Navigation reports, generation of appendices to the Descriptive Report, compilation of survey statistics, and generation of standard NOAA forms such as the Descriptive Report cover sheet. HSTP VELOCWIN HSTP Velocwin is a program for the processing of sound velocity casts. This program uses Sea-Bird Electronics SeaSoft software to convert hexadecimal SeaCat data into ASCII conductivity-temperature-depth data, and then converts the ASCII data into a depth-binned sound velocity file. Velocwin software is also used to process Moving Vessel Profiler (MVP) sound velocity data into a CARIS compatible format. Velocwin allows for batch processing of the numerous .calc files generated by the MVP during multibeam echosounder acquisition. The resulting .svp files are applied in CARIS HIPS during post-processing to correct for sound velocity variation within the water column. These sound velocity files are applied to the data in CARIS HIPS. Velocwin is also used to check the accuracy of sound velocity casts and to archive sound velocity information for the National Oceanographic Data Center. Notable Sound Velocity Profiles software or configuration changes: DN203-S222, 3101, 3102: Velowin does not expend last cast point correctly, manually overridden and extended. MAPINFO Professional 9.0 MapInfo Professional is the Geographic Information System (GIS) software package used aboard THOMAS JEFFERSON. MapInfo is used for sheet management, line planning, final data analysis and creating end-user plots. A.8. Acquisition Procedures Acquisition Types All platforms acquire hydrographic data according to the Letter Instructions for each survey. The Letter Instructions for a given survey will specify the acquisition method desired. The Letter Instructions will occasionally state the desired coverage and give the field unit discretion as to the best method to achieve that coverage.
Data Acquisition and Processing Report NOAA Ship Thomas Jefferson
Project No. OPR-B363-TJ-09 19 9/18/2009
The following survey types are used during field operations by THOMAS JEFFERSON in the 2008 Field Season: • Set Line Spacing • Complete MBES Coverage • 100% SSS + Complete MBES • Object Detection SSS Coverage • Object Detection MBES Coverage These coverage types are described in detail in the Aril 2009 Hydrographic Survey Specifications and Deliverables. Line plans are designed by the field unit according to the coverage type specified in the Letter Instructions. Occasionally the Letter Instructions will give discretion regarding which coverage type to use to the field unit. Line planning and coverage type will be discussed in detail in the Descriptive Report for each survey. Crosslines are acquired as an additional confidence check to the performance of echosounder data. Crosslines are used to check sonar confidence and to provide a meaningful comparison between nadir beams and outer beams of a multibeam mainscheme acquisition line. Crosslines are compared to the product navigation surface in CARIS HIPS. The results of the crossline QC test are submitted in Separates V of the Descriptive Report for each survey. Acquisition speeds are monitored and limited to maintain density as required in Specs and Deliverables.
B. QUALITY CONTROL
A systematic approach to tracking data has been developed to maintain data quality and integrity. Several forms and checklists identify and track the flow of data as it is collected and processed. These forms are presented in the Separates section included with the data for each survey. During data collection, the watch standers continuously monitor the systems, checking for errors and alarms. Thresholds set in the Hypack/Hysweep, POSPAC and SonarPro alert the watch stander by displaying alarm messages when error thresholds or tolerances are exceeded. These alarms, displayed as they occur, are reviewed and acknowledged on a case-by-case basis. Alarm conditions that may compromise survey data quality are corrected and then noted in both the navigation log and the message files. Warning messages such as the temporary loss of differential GPS, excessive cross track error, or vessel speed approaching the maximum allowable survey speed are addressed by the watch stander and automatically recorded into a message file. Approximately every 1-2 hours the real-time watch standers complete checklists to ensure critical system settings and data collection are valid.
Data Acquisition and Processing Report NOAA Ship Thomas Jefferson
Project No. OPR-B363-TJ-09 20 9/18/2009
Following data collection, initial processing begins on Thomas Jefferson. This includes the first level of quality assurance:
• Initial swath editing of multibeam data flagging invalid pings and beams • Second review and editing of multibeam data. Open beam angles where
appropriate to identify obstructions outside the cut-off angle • Identify items for investigation with additional multibeam coverage • Turning unacceptable data “offline” • Turning additional data “online” • Identification and flagging of obstructions and wrecks • Track plots • Preliminary sounding grids • Cross line checks • Generation of preliminary side scan coverage mosaics
On a daily basis BASE surfaces are generated to ensure adequate data density, identify areas of high standard deviation and note any obvious problems with correctors. The following grids are created and used for crossline analysis, tide zone boundary comparisons, and day to day data comparisons.
• Main scheme, item, and holiday fill survey lines • Crosslines
Results of this analysis are reviewed to determine adequacy of data and sounding correctors. Additional processing in preparation of data deliverables includes the following steps:
• Generation of side scan Contact Files and Contact Plot • Subset editing and review of multibeam data • Calculation and application of verified tide correctors to multibeam data • Application of delayed heave • Coverage plots of multibeam data • Cross line analysis of multibeam data • Comparison with prior surveys • Generation of shoal biased selected soundings at the scale of the survey • Generation of contour plots of multibeam data • Comparison with existing charts • Quality control reviews of side scan data and contacts • Final Coverage mosaic plots of side scan sonar data • Correlation of side scan contacts with multibeam data • Final quality control of all delivered data products
Processing and quality control procedures for multibeam and side scan data acquisition are described in detail below.
Data Acquisition and Processing Report NOAA Ship Thomas Jefferson
Project No. OPR-B363-TJ-09 21 9/18/2009
B.1. Bathymetry Raw bathymetry data, (Sonar Pro .sdf, Simrad .all, Hypack .raw and .hsx) are converted into CARIS HDCS data format upon completion of daily acquisition. Conversion parameters vary for each data format, and are stored in the LogFile of each HDCS processed line folder. After data conversion, water level, sound velocity, attitude, and navigation data are applied as described in section C. Bathymetry lines are then merged. Following merge, Total Propagated Uncertainty (TPU) is calculated for each sounding. For a more detailed explanation of TPU calculation of multibeam and vertical beam echosounder data, refer to Section 4.2.3.6 of the 2009 NOAA Field Procedures Manual. Depending on acquisition type, MBES bathymetry may be processed using either an uncertainty-weighted navigation surface or a CUBE surface. Uncertainty-weighted BASE surfaces and CUBE surfaces are described in detail in the 2009 NOS Field Procedures Manual and the CARIS HIPS/SIPS Users Manual. When the primary source of bathymetry for a survey area is a combination of VBES and MBES, a collection of finalized uncertainty-weighted mean bathymetric surfaces is generated as the product of the survey. CUBE is not permitted for this type of survey. When the primary source of bathymetry for this type of survey is set line spacing MBES data (also known as “skunk striped”), CUBE shall be used. The use of CUBE in this situation is required to guarantee proper nodal propagation distances as described in section 5.1.1.3, Gridded Data Specifications, of the 2009 Hydrographic Survey Specifications and Deliverables. The data is examined and cleaned as necessary. Blunders are rejected and lines with major systematic errors are removed from the grid. Systematic errors are identified and documented by the office processor. The product surface is generated at standard resolution for Complete MBES even though bathymetry data may be sparse. When Complete or OD MBES is the primary source of bathymetry, data are processed using CUBE grids. The use of CUBE is mandatory to ensure compliance with the specification described in the paragraph above. After computation of TPU, multibeam lines are either used to create a new BASE Surface or are added to an existing BASE Surface. The resulting layers are analyzed by the data processor to identify blunders, systematic errors, and to identify significant bottom features. Blunders are rejected by the data processor in CARIS Subset Editor (multi-line spatial view) or CARIS Swath Editor (single-line time-series view). Systematic errors are identified and documented by the data processor. Least depths of navigationally significant features are flagged as “designated soundings,” which both identifies the object as a navigationally significant object for import in to Pydro and forces the depth of the grid to match the least depth of the feature. Hypothesis selection (available in CARIS) is not allowed per specifications and is not used aboard THOMAS JEFFERSON.
Data Acquisition and Processing Report NOAA Ship Thomas Jefferson
Project No. OPR-B363-TJ-09 22 9/18/2009
After data editing is complete, grids are finalized in CARIS Hips. The final resolution of the product surfaces depends on whether Complete or OD MBES is specified in the letter instructions. B.2. Error Modeling in CARIS Hips CARIS computes TPU based on both the static and dynamic measurements of the vessel. These values are based on the offsets tables found in Appendix B. As well, CARIS uses survey-specific information including a tidal zoning error estimate and speed of sound measurement errors. Offset values are entered into the CARIS *.hvf file. During processing, the tidal zoning and speed of sound measurement errors are applied. Tidal zoning values are provided with the Letter Instructions in a separate tidal information document. Instrument-specific values are obtained from either the CARIS TPU resource website or per HSD guidance (e.g. Hydrographic Surveys Technical Directive 2007-2). TPU Parameters for each survey are listed in the Descriptive Report. B.3. Bathymetry Analysis and Feature Classification Following data cleaning in CARIS HIPS and SIPS, uncertainty-weighted or CUBE bathymetry grids and CARIS contacts are inserted into a PYDRO Preliminary Smooth Sheet (PSS). Side Scan Sonar (SSS), Multi Beam Echo Sounding (MBES) and Vertical Beam Echo Sounding (VBES) data are imported into PYDRO using the “Insert CARIS Line Features” tool. DP and GP features are inserted using the “Generic Data Parser” tool. Images of contacts exported from CARIS are displayed in the Image Notebook Editor in PYDRO. Contacts are arranged by day and line and can be selected in the data “Tree” window. Information concerning a specific contact is reviewed in the Editor Notebook Window in PYDRO. This information includes contact position, AWOIS item positions, surrounding depths, contact cross references, and charting recommendations. Contacts are classified according to type of contact (e.g. MBES, SSS, DP, etc), confidence, and proximity to other contacts. Although this will vary from survey to survey, the following general rules apply for classification of contacts:
• MBES contacts will be classified as primary contacts over SSS, DP, and GP contacts;
• If there are two or more MBES contacts for the same feature, the MBES
contact of least depth is classified as the primary contact; • If there is no bathymetry contact for a feature, then the SSS position will be
classified as primary contact over DP and GP contacts; • If there are two or more SSS contacts for the same feature, then the SSS
contact that best represents the feature is classified as the primary contact; • If there are no bathymetry or imagery contacts, then the DP contact that best
represents the feature is classified as the primary contact.
Data Acquisition and Processing Report NOAA Ship Thomas Jefferson
Project No. OPR-B363-TJ-09 23 9/18/2009
Multiple representations of one distinct feature (e.g. contacts from two or more SSS lines on a known wreck) may be grouped. For a group of features, one representation is selected as the primary contact, and all others are selected as secondary contacts with respect to the primary contact. Significant features are defined by the Hydrographic Survey Specifications and Deliverables as an object rising more than 1m above the seafloor in water depth of 0-20m, and an object rising 10% of depth above the seafloor in water depths greater than 20m. Either echosounder least depth or side-scan sonar acoustic shadow height may be used to determine height of an object off the water bottom. The following types of features are always significant contacts: wrecks, obstructions, pipelines, and piers and wharves. Contacts appearing significant are further investigated with a MBES system capable of meeting NOAA object detection specifications. If there is no known least depth of good confidence on a significant feature, then the feature will be flagged as “Investigate.” Features with such a tag must be further developed, in order of preference, with multibeam echosounder, diver least depth gauge, or vertical beam echosounder. Any items that are to be addressed in the Item Investigation section of the Descriptive Report are flagged as “Chart”. Examples of Chart items include position of new or repositioned Aids to Navigation, permanent man-made features which do not pose a danger to surface navigation, or dynamic sedimentary bedforms which have not been previously noted on the chart. Items which have the “Chart” flag set could also be further designated for inclusion in the Danger to Navigation Report by choosing the “DTON” flag. Dangers to Navigation are submitted to the Commanding Officer for review prior to submission to the Marine Charting Division (MCD). After a feature is fully classified, primary features are flagged as “Resolved.” If a primary feature is flagged “Resolved,” then the secondary features correlated to that primary feature are automatically flagged “Resolved” and are given the same full classification as the primary feature. B.4. Imagery Side scan sonar data are converted from *.sdf (Sonarpro raw format) to CARIS HDCS. Processing side scan data includes examining and editing fish height, vessel heading (gyro), and vessel navigation records. When side scan sonar is towed, fish navigation is recalculated using CARIS SIPS. Tow point offsets (C-frame and cable out), fish depth, fish attitude, and water depth are used to calculate horizontal layback. After fish navigation is recalculated, side scan imagery data are slant-range corrected to 0.1m with beam pattern correction. The slant-range corrected side scan imagery data are closely examined for any targets. Targets-of-interest are evaluated as potential contacts based upon apparent shadow length and appearance, particularly targets which do not
Data Acquisition and Processing Report NOAA Ship Thomas Jefferson
Project No. OPR-B363-TJ-09 24 9/18/2009
appear to be natural in origin. Contacts are selected and saved to a contact file for each line of SSS data. Contact selection includes measuring apparent height, selecting contact position, and creating a contact snapshot (*.tif) image. Side scan sonar coverage is determined by using mosaics generated in CARIS SIPS and imported into MapInfo. If any deficiencies in the side scan sonar data are found, a holiday line file is created from the mosaics, and additional lines of SSS are acquired, in order to meet the requirements set forth in the Hydrographic Survey Letter Instructions. B.5. Survey Deliverables and Ancillary Product Generation The ship’s final bathymetric deliverables to the Atlantic Hydrographic Branch are a collection of BASE surfaces, the Pydro PSS (including S-57 feature classifications), the Descriptive Report, side scan sonar mosaics (when applicable), and two sun-illuminated digital terrain models of the multibeam bathymetry. The resolution of surfaces varies according to acquisition type specified in the Letter Instructions. Side scan sonar line files are reviewed in CARIS SIPS to identify contacts which may be significant enough for further investigation. Side scan sonar data are used to create high-resolution mosaics of the seafloor which are used to demonstrate coverage and analyze general bottom type. When permitted by Letter Instructions, these mosaics are used to determine where to acquire full multibeam coverage and developments. The Pydro Preliminary Smooth Sheet (PSS) contains a set of soundings, features, and other data which best represent the survey area at survey scale. Along with the Descriptive Report, the PSS is the ship’s record of the survey, from which the final survey product is created at the Atlantic Hydrographic Branch. A Microsoft Access database file (.mdb) containing all S-57 feature attributions is exported from Pydro. C. Corrections to Echo Soundings C.1. Sound Velocity Sound speed data acquired by the sea surface sound velocity sensors on THOMAS JEFFERSON and Survey Launch 3101/3102 are neither recorded nor used for post-processing of echosounder data. The sea surface sound velocity sensors will not be discussed further in this section. CTD Profiles Sound velocity profiles for the THOMAS JEFFERSON and for Launches 3101 and 3102 are processed using the program HSTP Velocwin which generates sound velocity profiles for CARIS HIPS. Sound velocity correctors are applied to MBES and VBES soundings in CARIS HIPS during post processing only
Data Acquisition and Processing Report NOAA Ship Thomas Jefferson
Project No. OPR-B363-TJ-09 25 9/18/2009
The speed of sound through water is determined by a minimum of one cast daily for VBES acquisition and one cast every three to four hours of MBES acquisition, in accordance with the Standing Letter Instructions and NOS Specifications and Deliverables for Hydrographic Surveys. Casts are conducted more frequently when changing survey areas, or when environmental conditions such as changes in weather, tide, or current would warrant additional sound velocity profiles. The sound velocity casts are extended in HSTP Velocwin and applied to all bathymetric data in CARIS HIPS during post processing. Brooke Ocean MVP The SV data acquired by the MVP is transmitted to a raw SV file folder, where the hydrographer conducts a basic check of the data for correct day number, sound velocity data, and file format/integrity. The SV cast may also be graphically viewed and compared with other casts using the associated feature in the MVP controller software. Like CTD casts, MVP casts are processed and/or extended for use in CARIS HIPS using HSTP Velocwin. C.2. Water Level Correctors Soundings are initially reduced to Mean Lower-Low Water (MLLW) using preliminary (observed) water level data. Data may be obtained from the primary tide gauge through the Center for Operational Oceanographic Products and Services (CO-OPS) web site or TideBot automated water level observation delivery program. Observed water level files are converted to CARIS tide files (.tid) and/or text files and applied to all sounding data using either discrete tide zoning in CARIS HIPS or the TCARI module in Pydro, as provided by CO-OPS. The type of water level correction used in a survey is specified in the Letter Instructions. When discrete tide zoning is the type of final water level correction specified in the Smooth Tide Note, THOMAS JEFFERSON personnel use verified water levels and final tide zoning provided by CO-OPS for hydrographic product generation. C.2.1 TCARI TCARI grid files may be submitted to THOMAS JEFFERSON as part of the Project Instruction package. A grid is computed using the shoreline, a limiting boundary, and the positions of two or more water level gages. Harmonic constants, residual water levels, and gage weights are interpolated for each grid point, using the data from the water level gages as control points. Water level corrections are applied in Pydro using the TCARI tools found in Pydro 7.xx and beyond. When using TCARI for datum reduction, water level corrections are not applied to echosounder data in CARIS. Following water level correction, data is merged and processed as described in Section B.
Data Acquisition and Processing Report NOAA Ship Thomas Jefferson
Project No. OPR-B363-TJ-09 26 9/18/2009
C.3. Multibeam Calibration Procedures Heave, pitch, roll, yaw, and navigation latency biases for each vessel are corrected during a multibeam bias calibration test (patch test). MBES vessel offsets, dynamic draft correctors, and system bias values are contained in HIPS Vessel Files (HVFs). These offsets and biases are applied to the sounding data during processing in CARIS HIPS. A Patch Test or verification of certain biases is also performed at the start of each project before acquiring MBES data in the new survey area. The HVFs and patch test data are included with the processed data accompanying this report. Results of the Patch Test for each vessel can be found in Appendix C of this report. C.4. Vessel Offsets and Dynamic Draft Correctors A partial re-survey of THOMAS JEFFERSON vessel offsets was conducted on 10 March 2005 by NGS personnel, and no changes in offsets have occurred since then. The procedure and results of the 2005 re-survey may be found in the 2009 Hydrographic Systems Readiness Report. Preliminary static draft measurements are made at the beginning of each leg. Static draft for THOMAS JEFFERSON is measured using a sight tube located in lower survey stores. Additional static draft measurements will be made as needed with changing conditions, such as short or long term shifts in ship ballast/loading. Vessel offset measurements were made on Launch 3101 on August 19, 2005 by NGS personnel. The offset measurement for the new ODOM Echotrac MkII VBES was derived by applying measured X, Y, and Z differences between the Reson 8125 mounted position and the Odom mounted position. Static draft measurements for Launch 3101 are determined using a sight tube and made from a reference point with respect to the IMU. These measurements are made at the beginning and end of each working day while the vessel is dead in the water. Vessel offset measurements were made on Launch 3102 on August 25, 2005 by NGS personnel and a slight modification to the POS M/V antennae vertical (Z) offset was applied in 2007 after upgrading to v.4 antennae. Static draft measurements for Launch 3102 are determined using a sight tube and made from a reference point with respect to the IMU. These measurements are made at the beginning and end of each working day while the vessel is dead in the water.
Dynamic Draft The Echosounder method was used to determine the dynamic draft for all platforms for the 2009 field season. The Echosounder method is described in the FPM section 1.4.2.1. and is adapted from an older practice where successive lines were run over a flat bottom at different speeds. A standard operating procedure (SOP) for the Echosounder method is found in Appendix I of the FPM.
Data Acquisition and Processing Report NOAA Ship Thomas Jefferson
Project No. OPR-B363-TJ-09 27 9/18/2009
All multibeam data were processed using standard procedures in CARIS HIPS. Dynamic draft was computed for each RPM level. The speed at each RPM was calculated by querying the speed of the lines run at that RPM. Three different regions on the line were sampled for depth soundings; the regions were at 1/4, 1/2, and 3/4 along the line. The sampled regions were queried by line for depth soundings. Depth soundings collected at similar RPMs were combined and the median depth sounding found. This sounding was used in the calculation of the vessel draft. To determine the change in vessel draft at each speed the difference between the median depth sounding at that speed and the median depth sounding at drift speed was found. See Appendix C for tabulated results. Results of the Dynamic Draft Test for each vessel can be found in Appendix C of this report.
Data Acquisition and Processing Report NOAA Ship Thomas Jefferson
Project No. OPR-B363-TJ-09 28 9/18/2009
D. APPROVAL SHEET
This Data Acquisition and Processing Report for project OPR-B363-TJ-09, Block Island, RI is respectfully submitted. As Chief of Party, I have ensured that standard field surveying and processing procedures were adhered to during these projects in accordance with the Hydrographic Surveys Specifications and Deliverables (4/2009), Hydrographic Survey Technical Directive HTD 2009-02, and the Field Procedures Manual for Hydrographic Surveying (4/2009,). I acknowledge that all of the information contained in this report is complete and accurate to the best of my knowledge. This DAPR applies to survey H12033, H12011, H12010, H12137, and H12139, which was completed in 2009 for Project D304. Approved and Forwarded: ________________________________ _________________________________ LT Jasper D. Schaer, NOAA CDR Shepard M. Smith, NOAA Field Operations Officer Commanding Officer