Embed Size (px)
Citation preview

16.07.2013 Seite 1 www.rsby.gov.in
Rashtriya Swasthya Bima Yojana (RSBY) Data Analysis and More….
Dr. Nishant Jain 11.07.2013

16.07.2013 Seite 2 www.rsby.gov.in Page 2
Current Status of RSBY Implementation in India Cards issued – App. 35.3 million People enrolled – Appr. 1222 million Number of People benefitted till now – Appr. 5.5 million Number of Hospitals Empanelled – Appr. 11,000 States and UT where Service delivery has started – Twenty Eight Number of Insurance Companies Involved – Fifteen
RSBY Coverage
Round 1 Round 2 Round 3 Round 4 Round 5
16.07.2013 Seite 3 www.rsby.gov.in Page 3
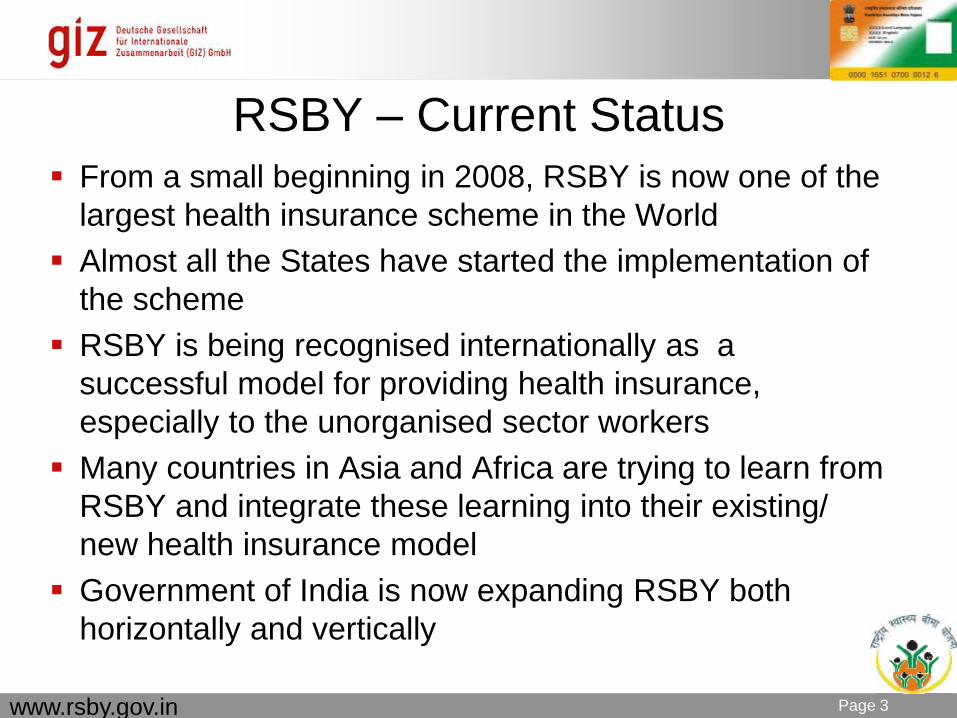
RSBY – Current Status From a small beginning in 2008, RSBY is now one of the
largest health insurance scheme in the World Almost all the States have started the implementation of
the scheme RSBY is being recognised internationally as a
successful model for providing health insurance, especially to the unorganised sector workers
Many countries in Asia and Africa are trying to learn from RSBY and integrate these learning into their existing/ new health insurance model
Government of India is now expanding RSBY both horizontally and vertically

16.07.2013 Seite 4 www.rsby.gov.in Page 4
RSBY – Availability of Data Often data is collected in schemes not knowing what to do with that
RSBY Collects data for specific purposes The biggest strength of RSBY is that data generated in RSBY is
electronic and available for analysis This data shall be analysed on a regular basis so as to understand the
performance and implementation of the scheme Automatic dashboard can be developed based on this data

16.07.2013 Seite 5 www.rsby.gov.in Page 5
PRIMARY DATA ANALYSES
Initial trends. Initial impact.

16.07.2013 Seite 6 www.rsby.gov.in Page 6
Premium Trends in RSBY
607 600 533 527
347
509 492 451 426 518
513
412
482 550 489
0
100
200
300
400
500
600
700
Average Premiumfor Fresh Districts in
2008
Average Premiumfor Fresh Districts in
2009
Average Premiumfor Fresh Districts in
2010
Average Premiumfor Fresh Districts in
2011
Average Premiumfor Fresh Districts in
2012 (incl freshlytendered)
In IN
R
Round 1 Round 2 Round 3 Round 4 Round 5

16.07.2013 Seite 7 www.rsby.gov.in Page 7
Conversion Ratio
40.67
57.44
67.59
53.02
14.05
63.04 60.37
80.98
45.08 47.44 43.83
48.00
55.86 55.08
37.30
82.20
56.09
38.39
86.08
53.03 57.19
67.25
51.61 50.82 63.48
46.24
61.01
48.00
79.98
59.28 61.70 49.01
68.62
48.89
63.25 73.99
44.46 46.82 38.70
53.65
67.36
68.28 16.15 42.38 78.47 77.78 77.02 46.24 31.19 57.00
39.80 38.38
0.00
10.00
20.00
30.00
40.00
50.00
60.00
70.00
80.00
90.00
100.00
Year 1Year 2Year 3Year 4

16.07.2013 Seite 8 www.rsby.gov.in Page 8
3.17
2.67
4.10
3.19 3.24 3.11 2.86
3.92 3.68
2.28 2.58 2.68
3.56
2.59
3.17 3.03 2.80
2.99 2.94
2.01
2.51
3.63
3.31 3.75
3.30 2.63
3.29 3.39 3.31 3.19 2.91 2.55
3.50 2.61 2.64
3.16 2.85 2.43
2.82 2.51
3.45
3.26 3.51
2.98 3.00 3.28 3.13
2.52
3.09 3.46
3.28 1.55 0.00
1.00
2.00
3.00
4.00
5.00
6.00
Aver
age
Fam
ily S
ize
Average Family Size
Year 1 Year 2 Year 3 Year 4

16.07.2013 Seite 9 www.rsby.gov.in Page 9
Hospitalisation Ratio
Access to hospitals have increased for RSBY beneficiaries
Districts which have finished two years have higher hospitalisation
There is huge variations across different States
1.90% 2.20%
5.04%
0.00%
1.00%
2.00%
3.00%
4.00%
5.00%
6.00%
Round 1completed (345
disticts)
Round 2completed (252
districts)
Round 3 (81districts)
Hospitalisation Ratio
16.07.2013 Seite 10 www.rsby.gov.in Page 10
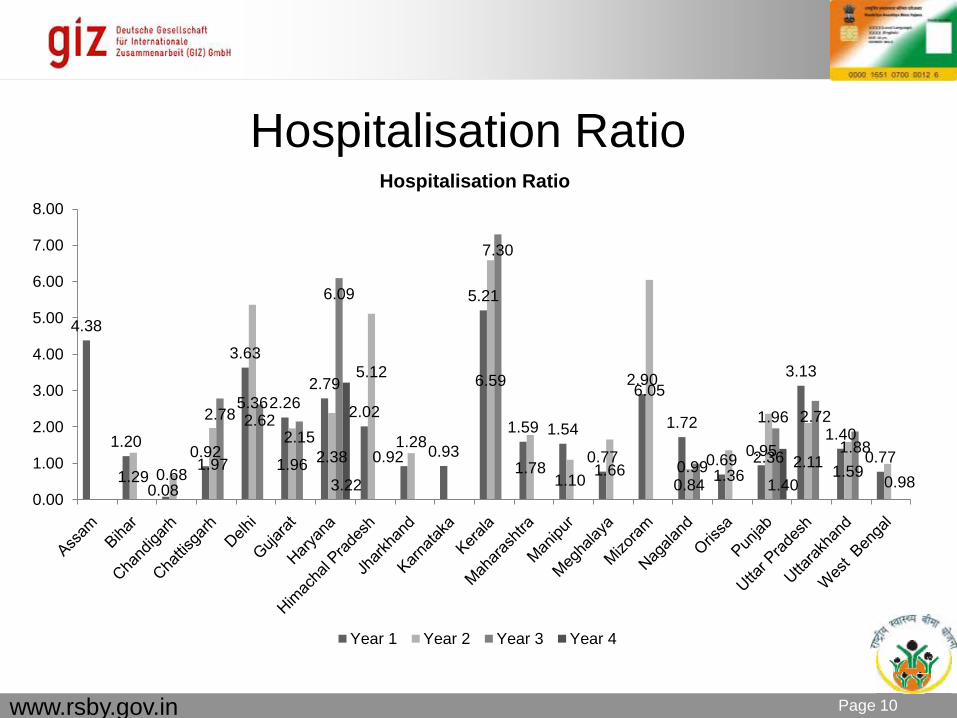
Hospitalisation Ratio
4.38
1.20
0.08
0.92
3.63
2.26 2.79
2.02
0.92 0.93
5.21
1.59 1.54
0.77
2.90
1.72
0.69 0.95
3.13
1.40 0.77
1.29 0.68 1.97
5.36
1.96 2.38
5.12
1.28
6.59
1.78 1.10 1.66
6.05
0.84 1.36 2.36 2.11 1.59 0.98
2.78 2.622.15
6.09
7.30
0.99
1.96 2.72
1.88
3.22 1.40 0.00
1.00
2.00
3.00
4.00
5.00
6.00
7.00
8.00Hospitalisation Ratio
Year 1 Year 2 Year 3 Year 4

16.07.2013 Seite 11 www.rsby.gov.in Page 11
Average Claim Size
2928
6599
8647
4310 4986 5040 4678
3704 4156 5271
2576
4573
10633
5560 5242
8296
3840
5960
2073
5205 4447
6176
6972 5814
4122 2041
5367 4950 3781 4436
3126
5440
12047
6185 6091
11818
4668 5202 5207 5901
6723
4411
3474 5196 4469 2639 9160
5785
6619 5816
4842
4567
0
2000
4000
6000
8000
10000
12000
14000
Year 1 Year 2 Year 3 Year 4

16.07.2013 Seite 12 www.rsby.gov.in Page 12
Average Claim Size
27.02%
34.60%
11.90% 11.90% 12.18%
2.11% 0.28%
0.00%
5.00%
10.00%
15.00%
20.00%
25.00%
30.00%
35.00%
40.00%
0-2500 2501-5000 5001-7500 7501-10000 10001-15000 15001-20000 20001 & above

16.07.2013 Seite 13 www.rsby.gov.in Page 13
Percentage of Claims with Average Length of Stay
38.54%
21.60%
16.42%
4.23%
12.42%
6.02%
0.00%
5.00%
10.00%
15.00%
20.00%
25.00%
30.00%
35.00%
40.00%
45.00%
1 2 3 4 5 6 & above
% of Claims with Average Length of Stay
16.07.2013 Seite 14 www.rsby.gov.in
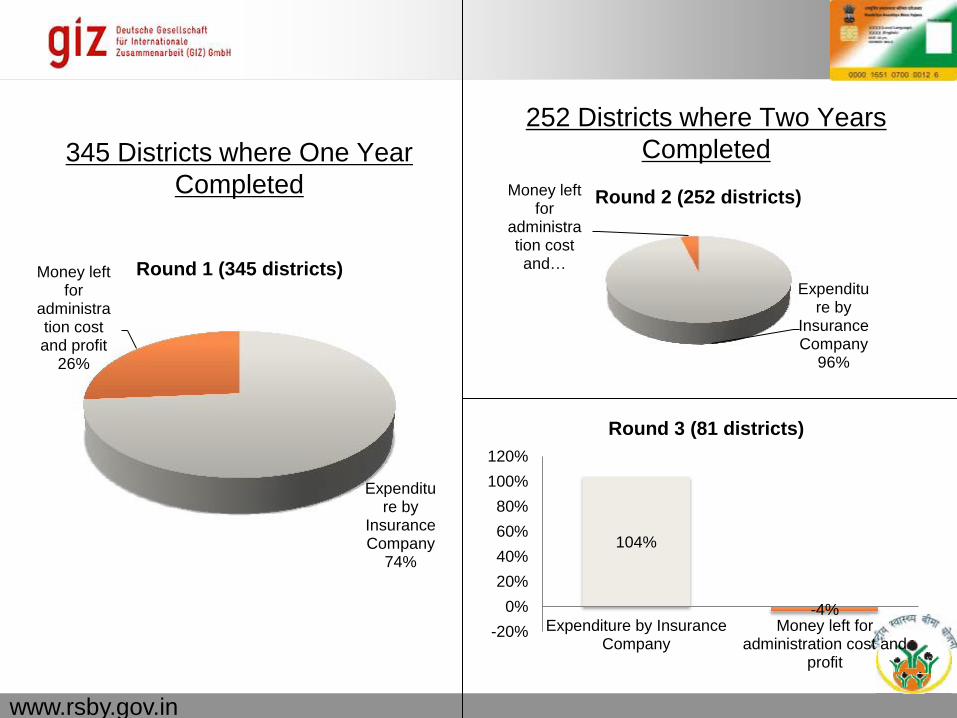
345 Districts where One Year Completed
252 Districts where Two Years Completed
Expenditure by
Insurance Company
74%
Money left for
administration cost and profit
26%
Round 1 (345 districts) Expenditu
re by Insurance Company
96%
Money left for
administration cost and …
Round 2 (252 districts)
104%
-4% -20%
0%20%40%60%80%
100%120%
Expenditure by InsuranceCompany
Money left foradministration cost and
profit
Round 3 (81 districts)

16.07.2013 Seite 15 www.rsby.gov.in Page 15
Burnout Ratio
90 72
33 48
116
83 82
102
61 56
100
62
118
48
119 98
37 56
168
80 74 64
96
56
95 82 83
117
234
74
161
87 97 75
195
72 83 94
81
97 78 126
88 80
288
99 67
91
128 119
122 62 0
50
100
150
200
250
300Burn Out Ratio
Year 1 Year 2 Year 3 Year 4

16.07.2013 Seite 16 www.rsby.gov.in Page 16
Male - Female Distribution
61% 55% 53%
39% 45% 47%
0%
10%
20%
30%
40%
50%
60%
70%
80%
90%
100%
Round 1 Round 2 Round 3
Male Enrollment Female Enrollment
58% 58% 46%
42% 42% 54%
0%
10%
20%
30%
40%
50%
60%
70%
80%
90%
100%
Round 1 Round 2 Round 3
Male Hospitalization Ratio Female Hospitalization Ratio
Gender Wise Enrolment Rate Gender Wise Hospitalization Ratio

16.07.2013 Seite 17 www.rsby.gov.in Page 17
Relationship Distribution
32%
18%
0% 1%
18%
12%
0% 0% 0% 0% 1% 1% 0% 0% 0% 0%
16%
0%
5%
10%
15%
20%
25%
30%
35%

16.07.2013 Seite 18 www.rsby.gov.in Page 18
Female Head of Household
14%
16%
21%
34%
0%
5%
10%
15%
20%
25%
30%
35%
40%
Round 1 Round 2 Round 3 Round 4
16.07.2013 Seite 19 www.rsby.gov.in Page 19
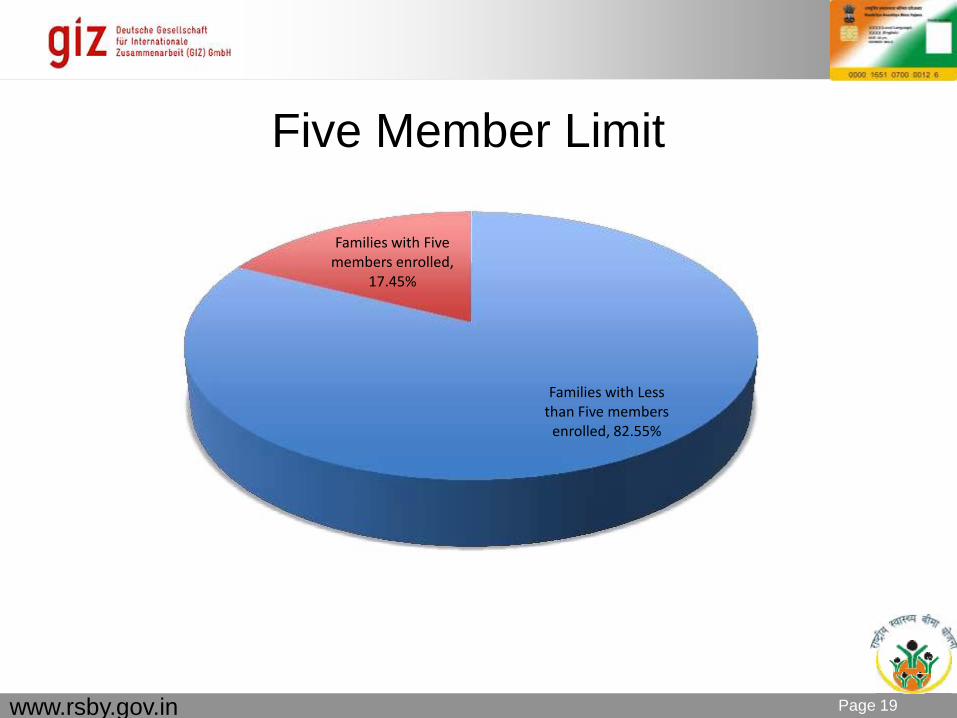
Five Member Limit
Families with Less than Five members
enrolled, 82.55%
Families with Five members enrolled,
17.45%

16.07.2013 Seite 20 www.rsby.gov.in Page 20
Age Distribution
22%
18% 17%
13%
8%
3%
20%
31%
21% 19%
14% 14%
0% 1%
7%
36%
19%
17%
21%
1% 0% 0%
5%
10%
15%
20%
25%
30%
35%
40%
0-17 18-30 31-40 41-50 51-80 81-120 120+
Pre EnrollmentPost EnrollmentTransaction
16.07.2013 Seite 21 www.rsby.gov.in Page 21
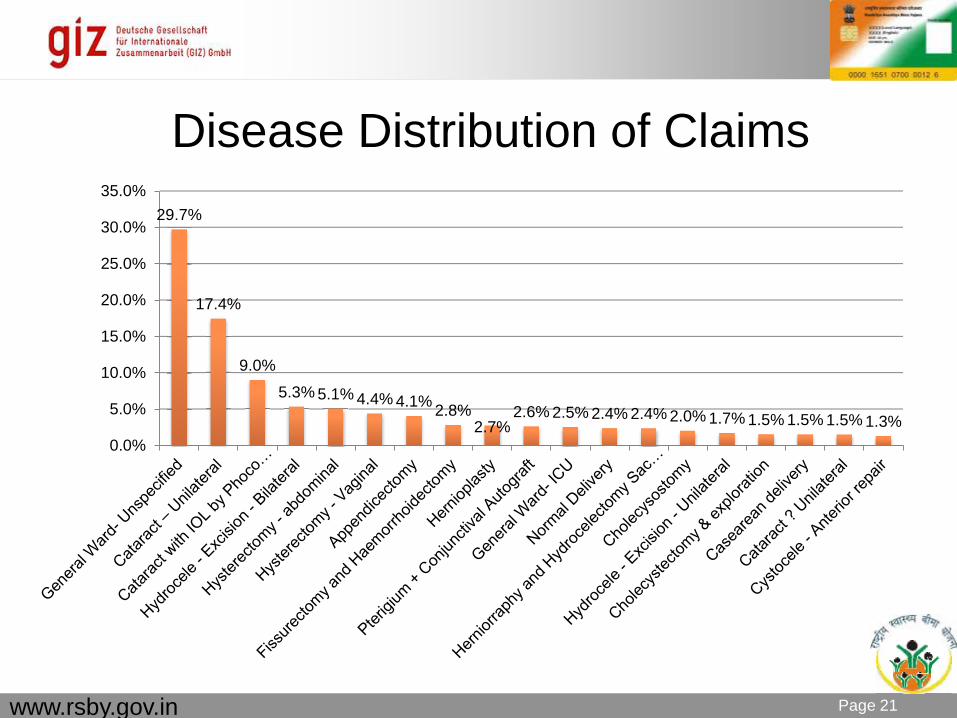
Disease Distribution of Claims 29.7%
17.4%
9.0% 5.3% 5.1% 4.4% 4.1% 2.8%
2.7% 2.6% 2.5% 2.4% 2.4% 2.0% 1.7% 1.5% 1.5% 1.5% 1.3%
0.0%
5.0%
10.0%
15.0%
20.0%
25.0%
30.0%
35.0%
16.07.2013 Seite 22 www.rsby.gov.in Page 22
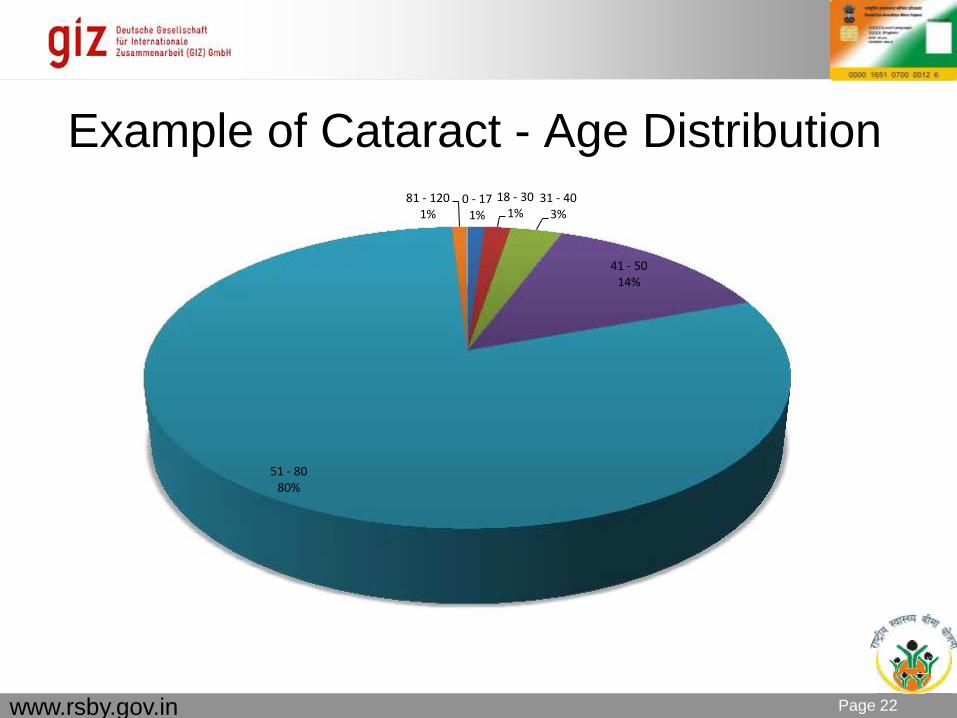
Example of Cataract - Age Distribution 0 - 17
1% 18 - 30
1% 31 - 40
3%
41 - 50 14%
51 - 80 80%
81 - 120 1%

16.07.2013 Seite 23 www.rsby.gov.in Page 23
Difference in Age in Card and Age Entered at Hospital
Age Difference % of Total 0 - 2 29.86%
3 - 5 25.79%
6 - 10 23.34%
11 - 15 10.37%
16 - 20 4.74%
21 - 25 2.04%
26 - 30 1.19%
31 - 35 0.68%
36+ 1.74%

16.07.2013 Seite 24 www.rsby.gov.in Page 24
Percentage of Inter-District Claims
% of Inter District Claims
20%
% same district claims 80%

16.07.2013 Seite 25 www.rsby.gov.in Page 25
Insurance Company Analysis

16.07.2013 Seite 26 www.rsby.gov.in Page 26
District Years Apollo Munich, 22, 3% Cholamandala
m MS, 48, 7%
ICICI Lombard, 177, 26%
IFFKO TOKIO, 8, 1%
National Insurance, 101, 15%
New India Assurance, 63, 9%
Oriental Insurance, 108, 16%
Royal Sundaram, 11,
2%
Star Health, 16, 2%
Tata AIG, 18, 3%
United India Insurance, 106, 16%

16.07.2013 Seite 27 www.rsby.gov.in Page 27
Average Premium
473
536 562
395
543 490
532 502
393
507 506
0
100
200
300
400
500
600

16.07.2013 Seite 28 www.rsby.gov.in Page 28
Conversion Ratio
54% 56% 51% 53%
57% 57%
49%
60%
50% 54% 56%
0%
10%
20%
30%
40%
50%
60%
70%

16.07.2013 Seite 29 www.rsby.gov.in Page 29
Average Family Size
2.38
3.40
2.23
2.57
3.35 3.14 3.11
3.29
2.83
3.37 3.10
0.00
0.50
1.00
1.50
2.00
2.50
3.00
3.50
4.00
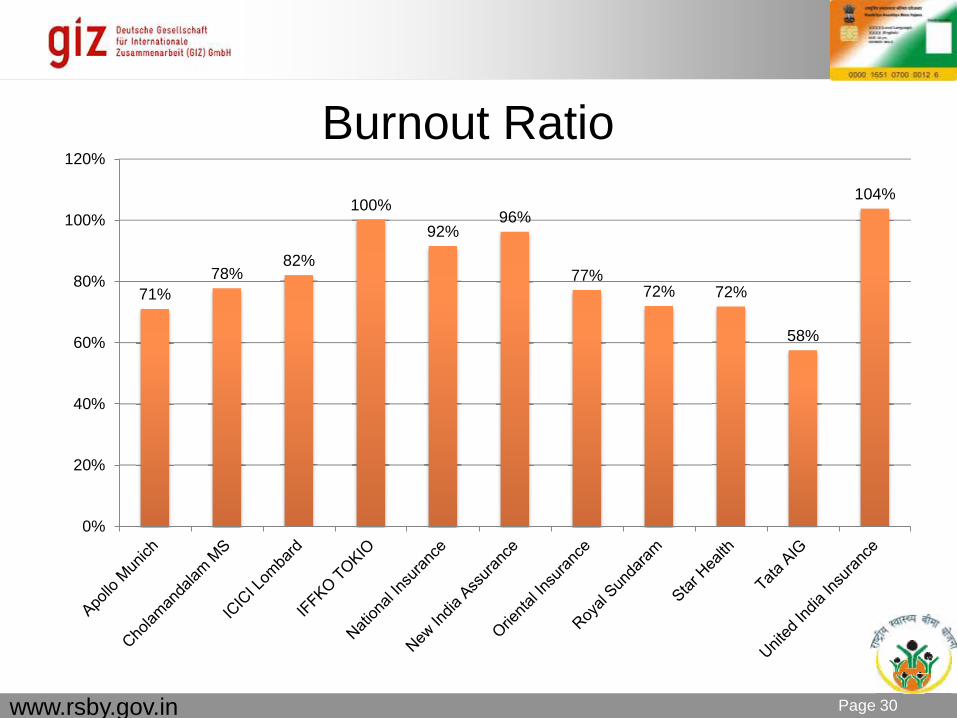
16.07.2013 Seite 30 www.rsby.gov.in Page 30
Burnout Ratio
71% 78%
82%
100% 92%
96%
77% 72% 72%
58%
104%
0%
20%
40%
60%
80%
100%
120%

16.07.2013 Seite 31 www.rsby.gov.in Page 31
Road Ahead Much deeper Systematic Analysis of all this data is being
done now An Agency has been hired to dig deep into this data and
do analysis A data analysis framework is also being developed
which will guide data analysis A dashboard is being developed which will help both
Central and State Governments in analysing data at different levels
Regular reports will be published based on this data analysis

16.07.2013 Seite 32 www.rsby.gov.in Page 32
Where do we want to enter?

16.07.2013 Seite 33 www.rsby.gov.in Page 33
Impact Improvement in access to Healthcare.
Hospitals being set up in remote areas by the private sector Public Sector hospitals competing and improving
performance to gain access to flexible funds & incentives Share of claims of public hospitals increasing over time
Penetration in the areas affected by extremist activities. Marked improvement in utilization by women in scheme. For expenditures beyond Rs. 30,000, State Governments
designing own schemes Himachal Pradesh, Meghalaya, Gujarat and Kerala are already
providing Few other States are in the process of taking decision
BPL lists is improving

16.07.2013 Seite 34 www.rsby.gov.in Page 34
Impact Utilisation data from States is able to provide disease
profiling across different districts As per different evaluations Out of pocket expenditure on
health of RSBY beneficiaries has come down dramatically As per different evaluations instances of health related
debts have come down Access to health care has improved considerably for RSBY
beneficiaries Migrant workers are getting benefits across districts and
States of RSBY

16.07.2013 Seite 35 www.rsby.gov.in Page 35
RSBY Smart Card Platform RSBY Smart Card Platform is emerging a robust platform
to deliver other social security schemes also Ministry of Finance has taken a decision to use RSBY
Smart card to deliver Aam Aadmi Bima Yojana benefits to the beneficiaries
MoRD has taken a decision to use this smart card for National Social Assistance Programme
State of Chhattisgarh is delivering PDS through RSBY Smart Card
Discussions are going on to test RSBY Smart card platform for MGNREGS