Embed Size (px)
Citation preview
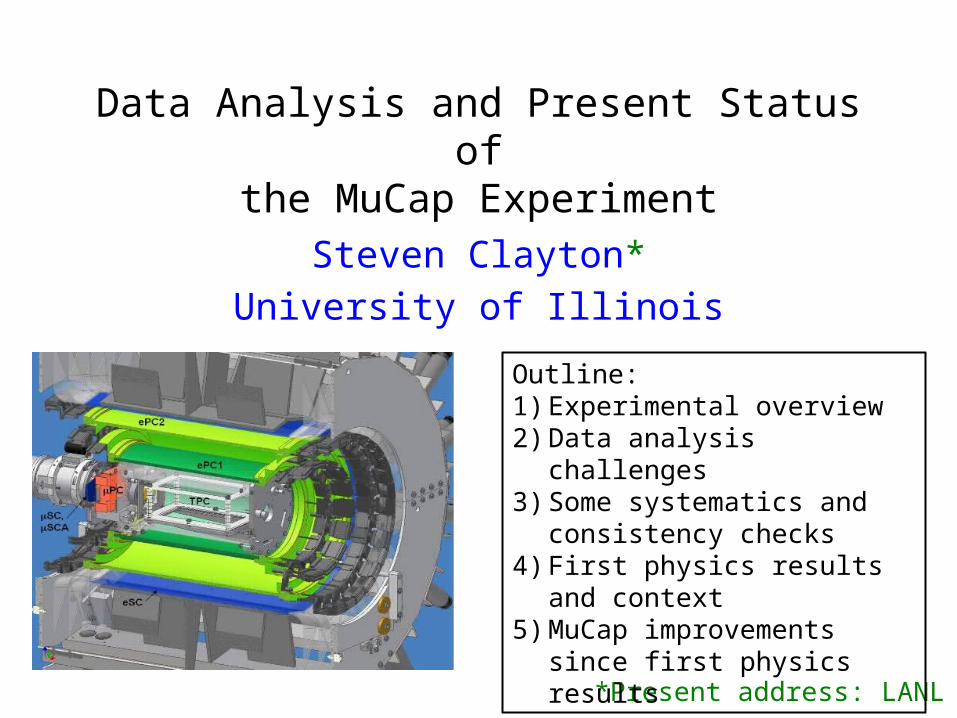
Data Analysis and Present Status ofthe MuCap Experiment
Steven Clayton*University of Illinois
*Present address: LANL
Outline:1) Experimental overview2) Data analysis challenges3) Some systematics and
consistency checks4) First physics results and context5) MuCap improvements since first
physics results
2
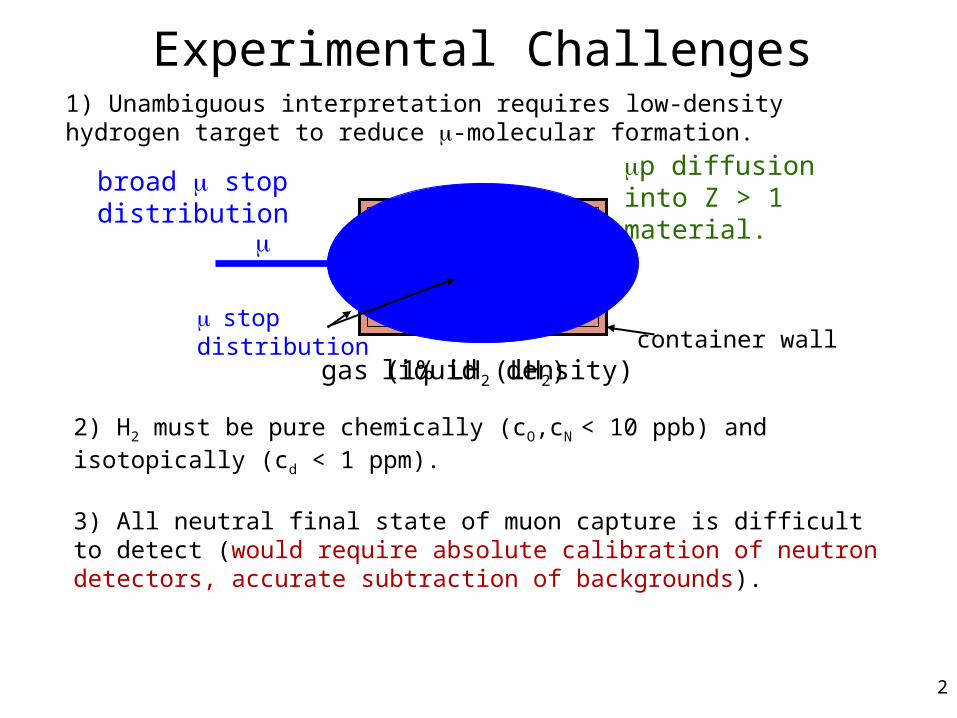
Experimental Challenges
2) H2 must be pure chemically (cO,cN < 10 ppb) and isotopically (cd < 1 ppm).
3) All neutral final state of muon capture is difficult to detect (would require absolute calibration of neutron detectors, accurate subtraction of backgrounds).
1) Unambiguous interpretation requires low-density hydrogen target to reduce -molecular formation.
p diffusion into Z > 1 material.
liquid (LH2)gas (1% LH2 density)
stopdistribution
broad stop distribution
container wall

3
slope = l ≡ 1/t
DT
Lo
g N
eve
nts
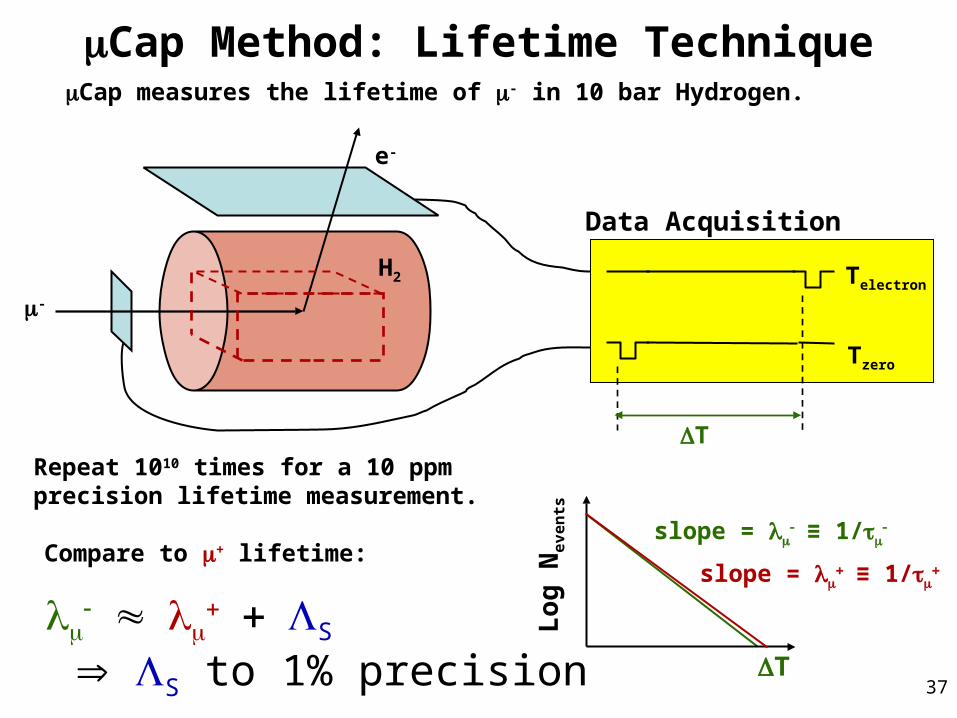
mCap Method: Lifetime TechniquemCap measures the lifetime of m- in 10 bar Hydrogen.
m-
e-
Tzero
Telectron
slope = l ≡ 1/t
Data Acquisition
DTRepeat 1010 times for a 10 ppm precision lifetime measurement.
H2
S
S to 1% precision
Compare to + lifetime:
4
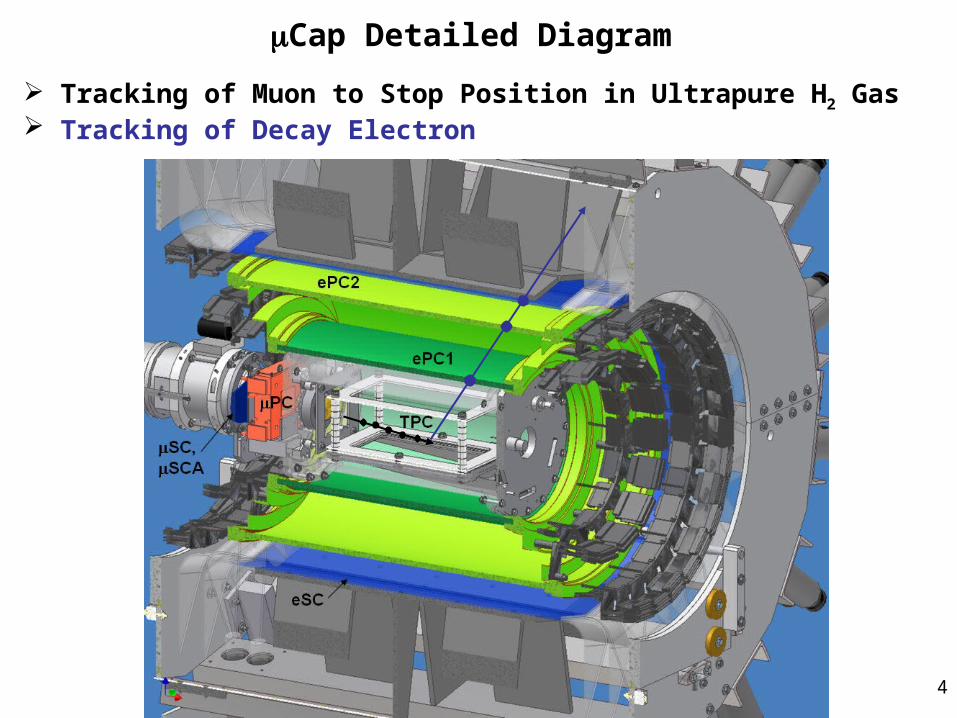
mCap Detailed Diagram
Tracking of Muon to Stop Position in Ultrapure H2 Gas Tracking of Decay Electron
5
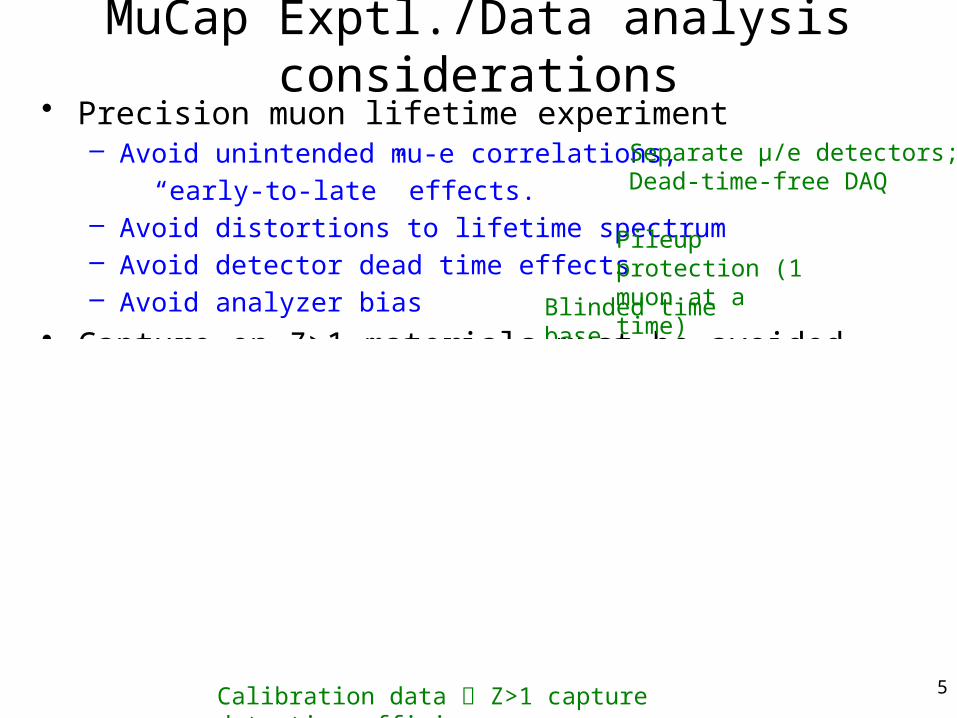
MuCap Exptl./Data analysis considerations• Precision muon lifetime experiment
– Avoid unintended mu-e correlations,
“early-to-late” effects.– Avoid distortions to lifetime spectrum– Avoid detector dead time effects– Avoid analyzer bias
• Capture on Z>1 materials must be avoided– Fiducial cut– μ+p scatters vs. “delta electrons”– Diffusion (μp and μd)
• Z>1 impurities in the protium gas– Identify impurity concentration, effect on lifetime
Pileup protection (1 muon at a time)
Separate μ/e detectors;Dead-time-free DAQ
Blinded time base
Robust “muon” definition
Impact parameter cut studies
Z>1 captures within TPC have unique signature.Calibration data Z>1 capture detection efficiency
6
p
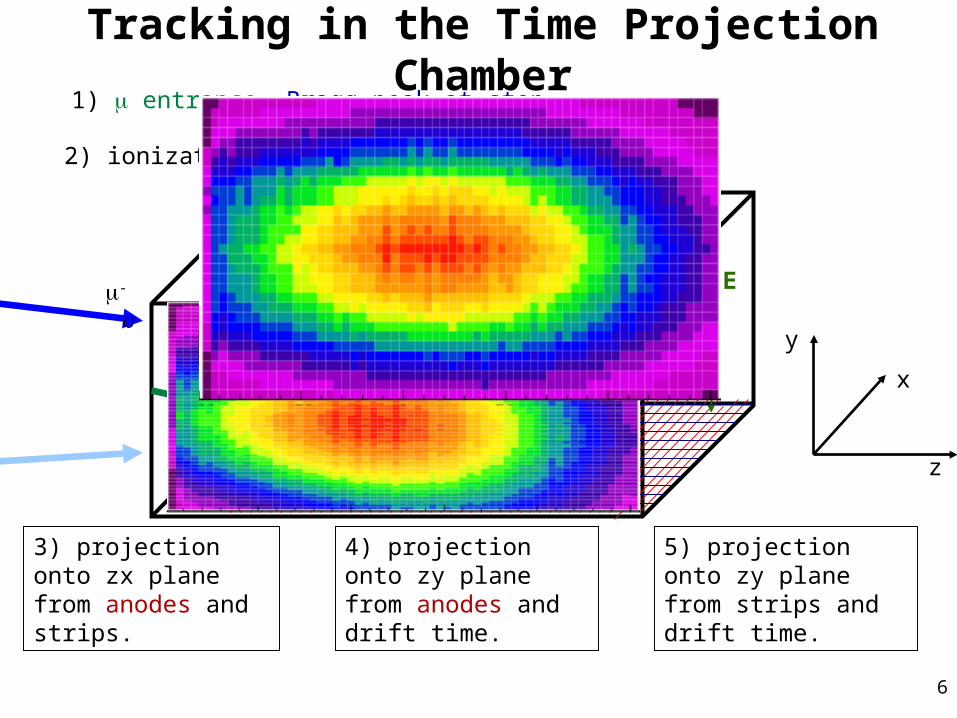
Tracking in the Time Projection Chamber
E
e-
z
x
y
m-
1) entrance, Bragg peak at stop.
2) ionization electrons drift to MWPC.
3) projection onto zx plane from anodes and strips.
4) projection onto zy plane from anodes and drift time.
5) projection onto zy plane from strips and drift time.
7
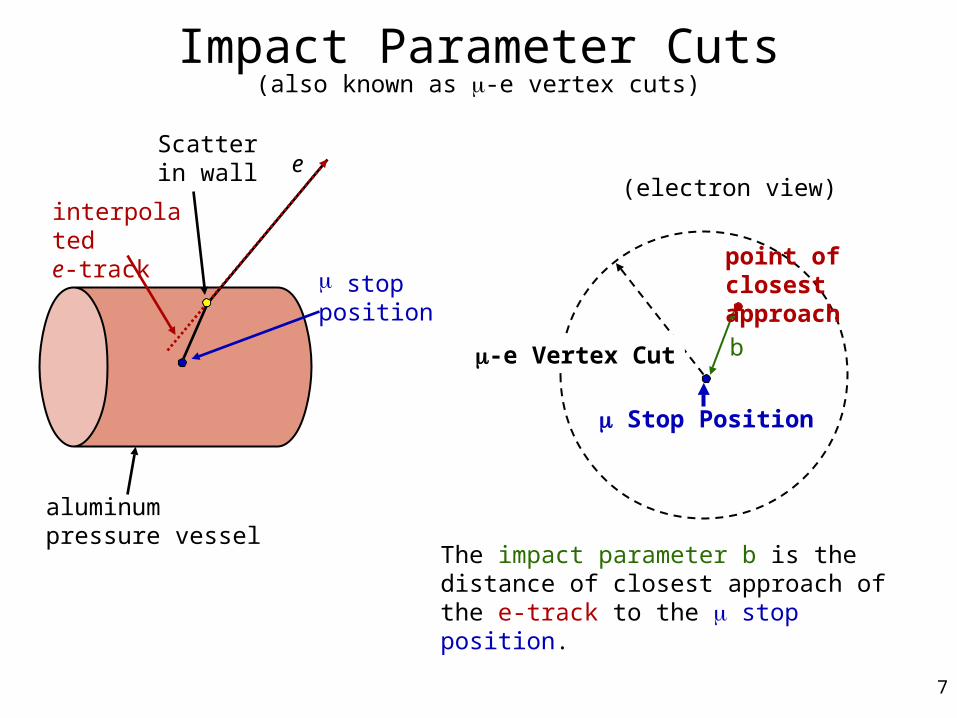
Impact Parameter Cuts
e
m stopposition
interpolatede-track
aluminumpressure vessel
m Stop Position
m-e Vertex Cut
(also known as -e vertex cuts)
b
(electron view)
The impact parameter b is the distance of closest approach of the e-track to the stop position.
point of closest approach
Scatterin wall
8
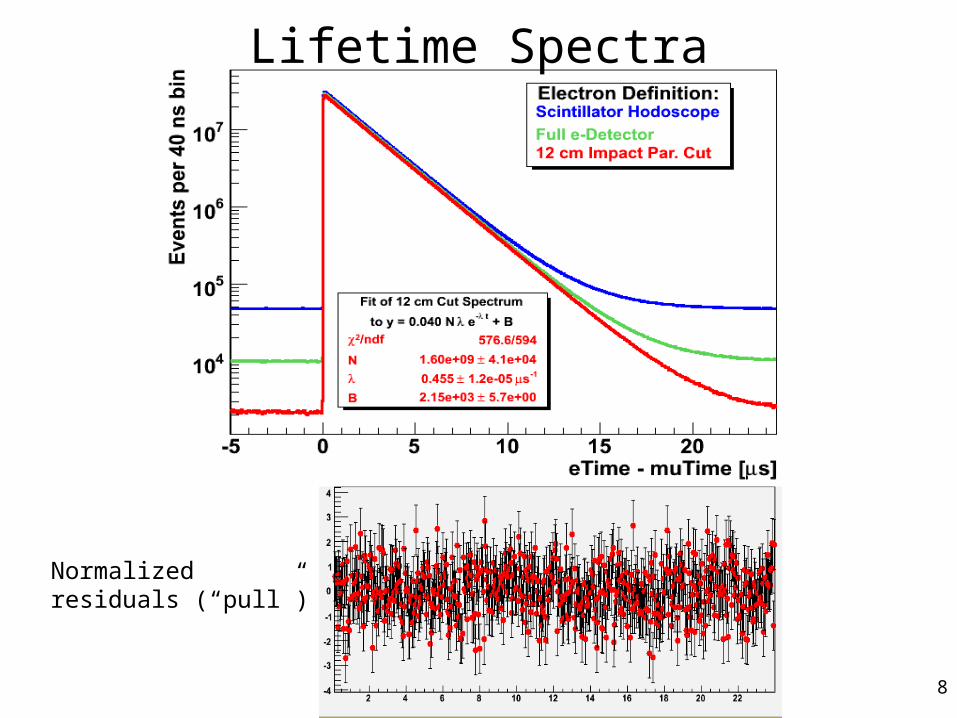
Lifetime Spectra
Normalizedresiduals (“pull”)
9
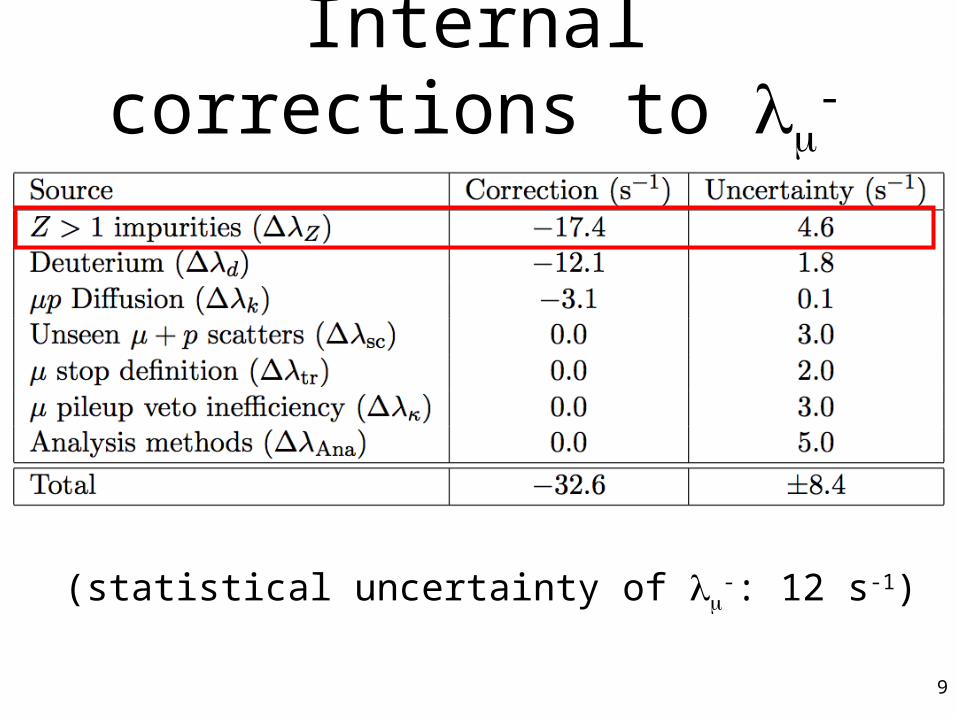
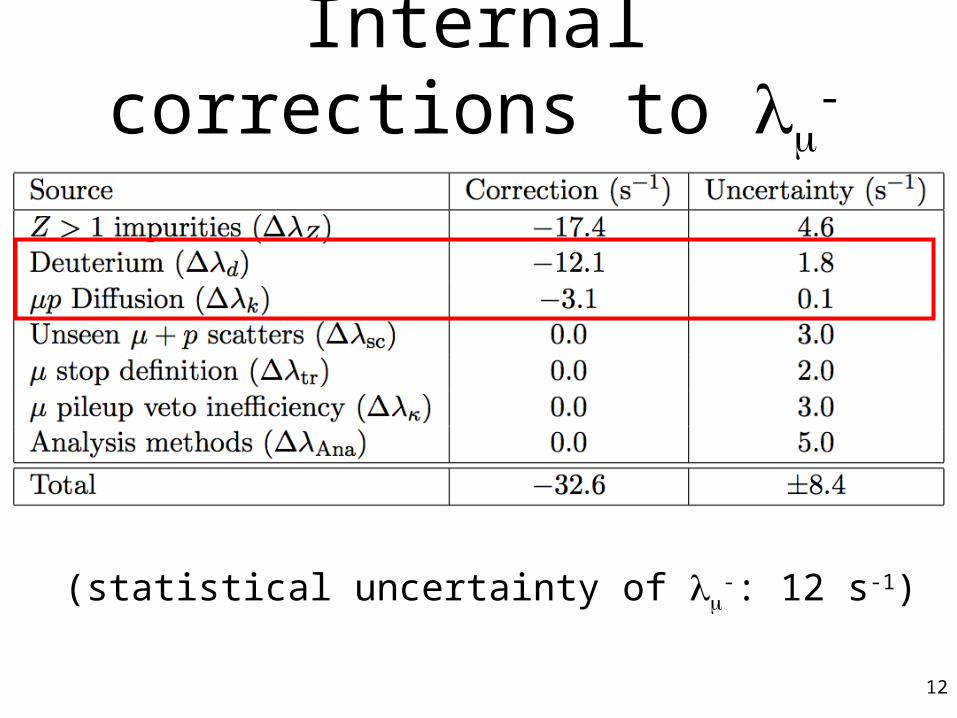
Internal corrections to -
(statistical uncertainty of -: 12 s-1)
10
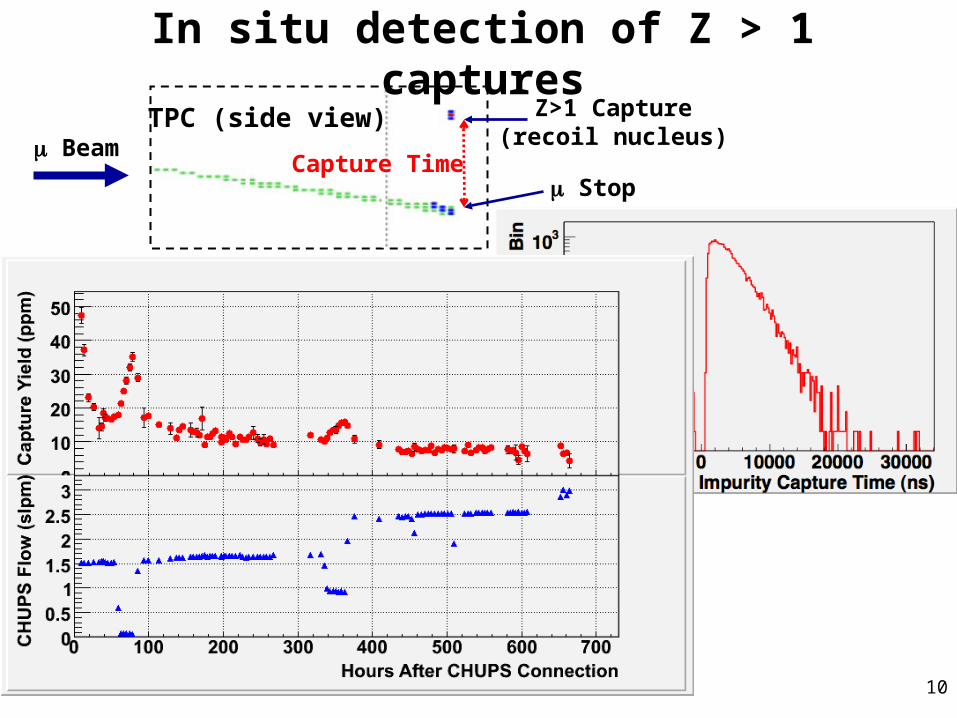
In situ detection of Z > 1 captures
m Beam
m Stop
Z>1 Capture(recoil nucleus)
Capture Time
TPC (side view)
11
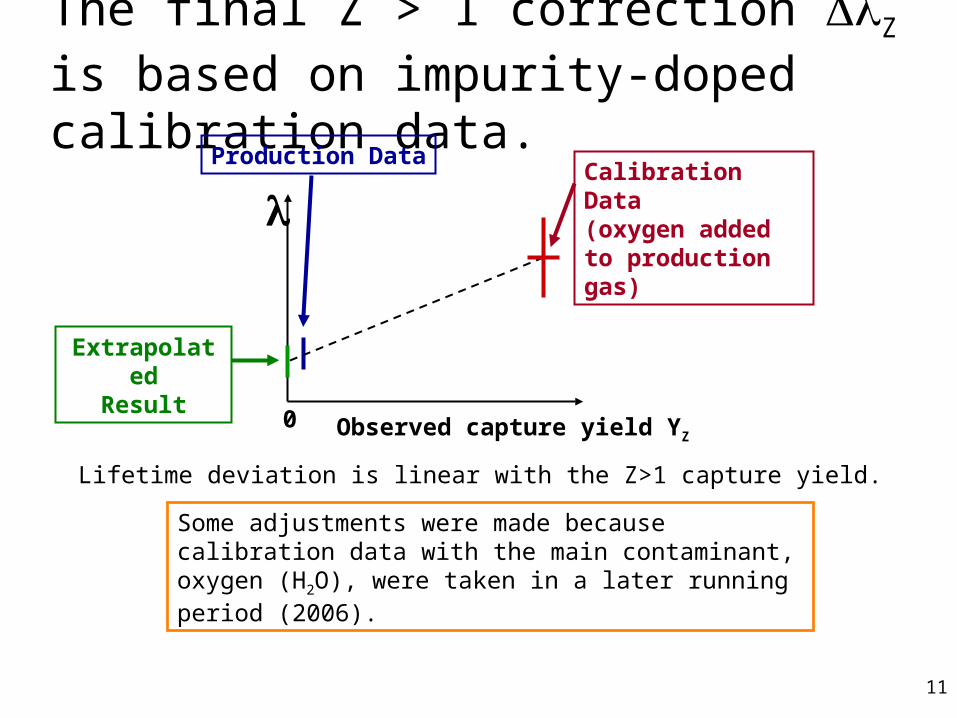
The final Z > 1 correction Z is based on impurity-doped calibration data.
l
0
Production DataCalibration Data(oxygen added to production gas)
ExtrapolatedResult
Observed capture yield YZ
Some adjustments were made because calibration data with the main contaminant, oxygen (H2O), were taken in a later running period (2006).
Lifetime deviation is linear with the Z>1 capture yield.
12
Internal corrections to -
(statistical uncertainty of -: 12 s-1)
13
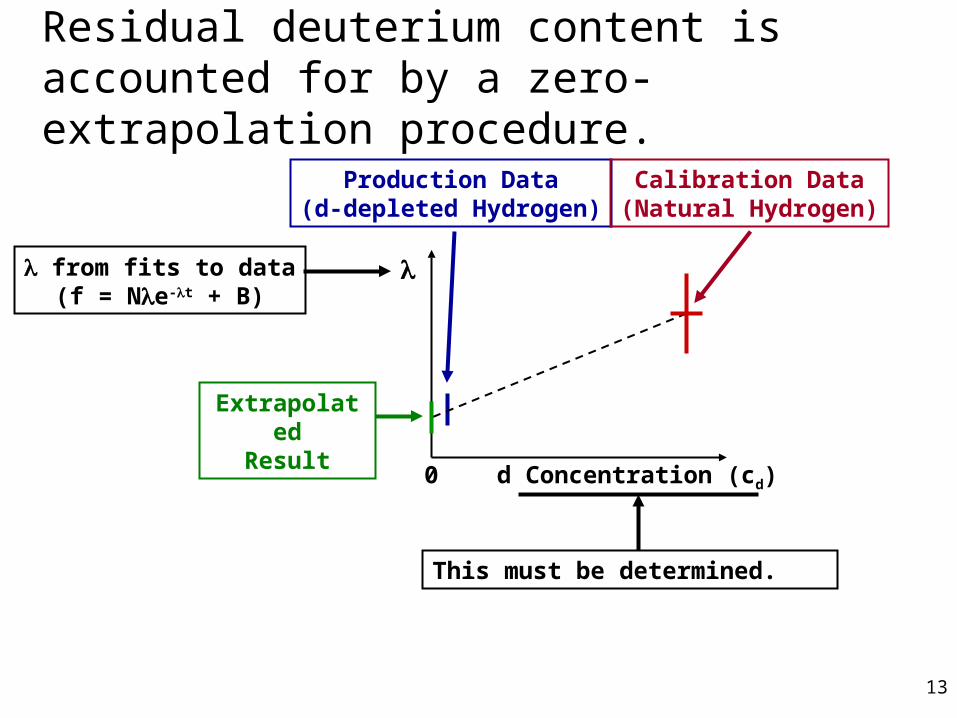
Residual deuterium content is accounted for by a zero-extrapolation procedure.
l
d Concentration (cd)0
Production Data(d-depleted Hydrogen)
Calibration Data(Natural Hydrogen)
ExtrapolatedResult
l from fits to data(f = Nle-lt + B)
This must be determined.
14
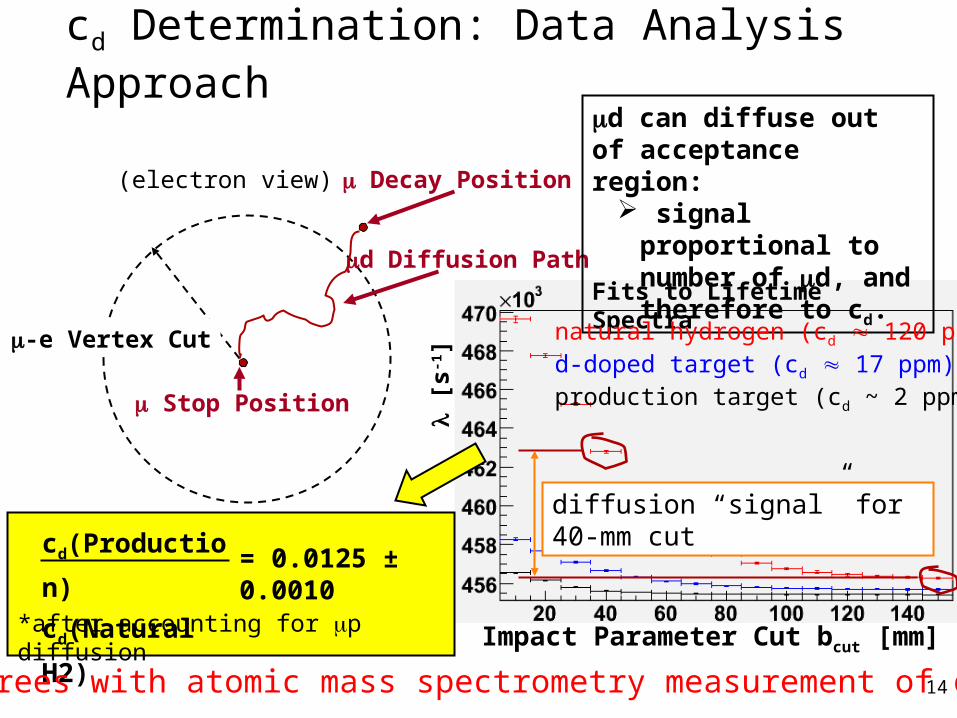
cd Determination: Data Analysis Approach
m Stop Position
m Decay Position
md Diffusion Path
m-e Vertex Cut
md can diffuse out of acceptance region: signal proportional to
number of md, and therefore to cd.
Impact Parameter Cut bcut [mm]
[s
-1]
Fits to Lifetime Spectra
diffusion “signal” for 40-mm cut
cd(Production)
cd(Natural H2)= 0.0125 ± 0.0010
*after accounting for p diffusion
(electron view)
natural hydrogen (cd 120 ppm)d-doped target (cd 17 ppm)production target (cd ~ 2 ppm)
Agrees with atomic mass spectrometry measurement of cD
15
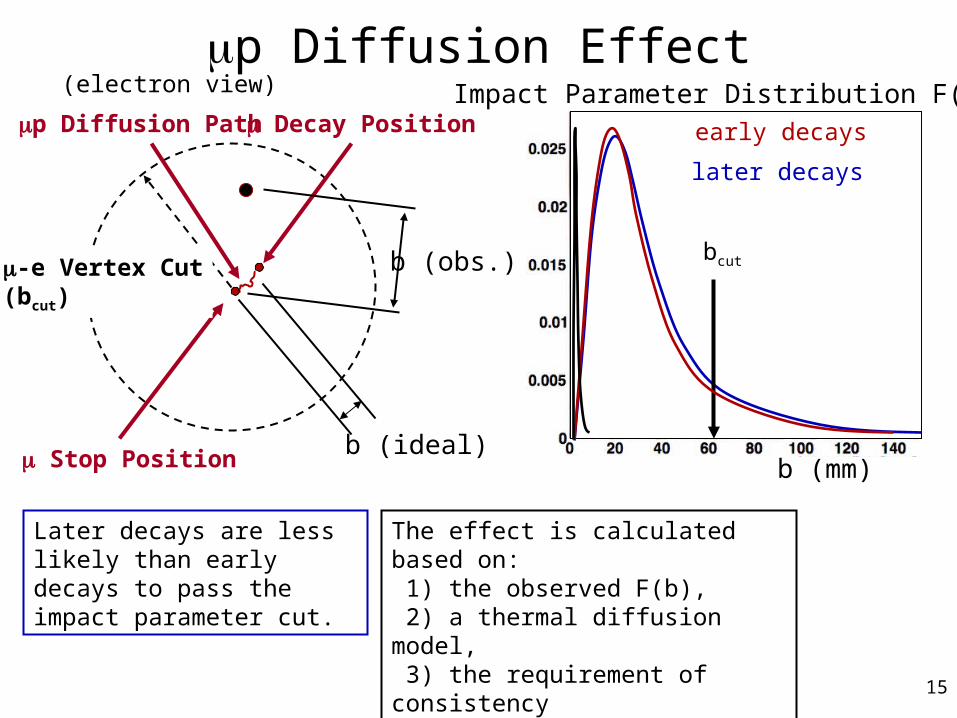
p Diffusion Effect
m Stop Position
m Decay Positionmp Diffusion Path
m-e Vertex Cut(bcut)
Impact Parameter Distribution F(b)
b (mm)
bcut
early decays
later decays
b (ideal)
b (obs.)
Later decays are less likely than early decays to pass the impact parameter cut.
The effect is calculated based on: 1) the observed F(b), 2) a thermal diffusion model, 3) the requirement of consistency of the cd ratio vs. bcut (prev. slide).
(electron view)
16
Consistency Checks
• lifetime vs. variations in parameters not expected to change the results
17
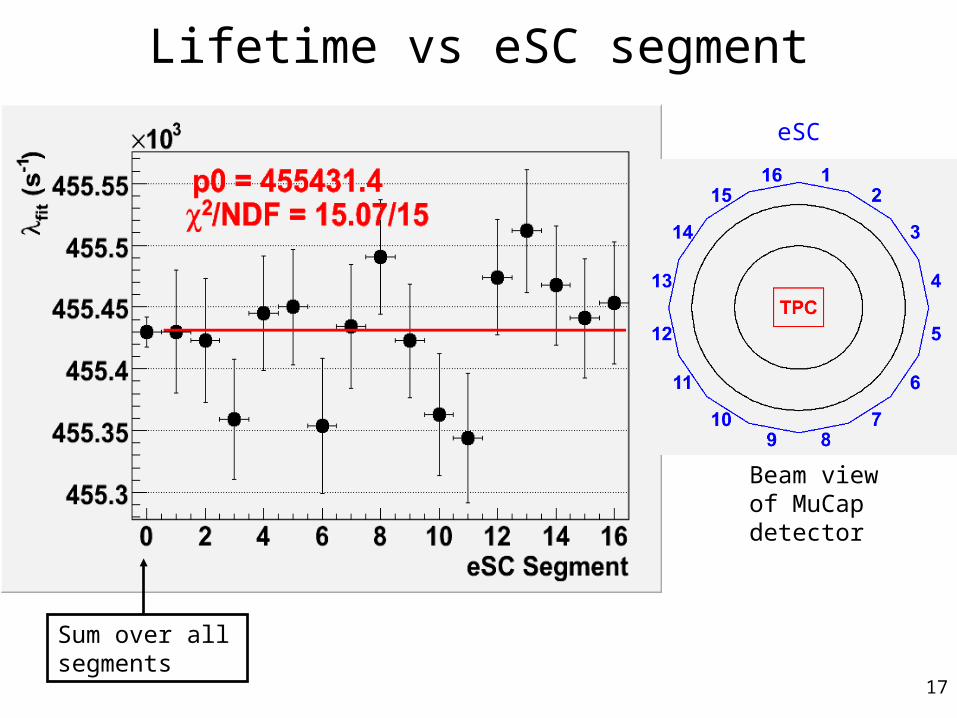
Lifetime vs eSC segment
Beam viewof MuCapdetector
eSC
Sum over all segments
18
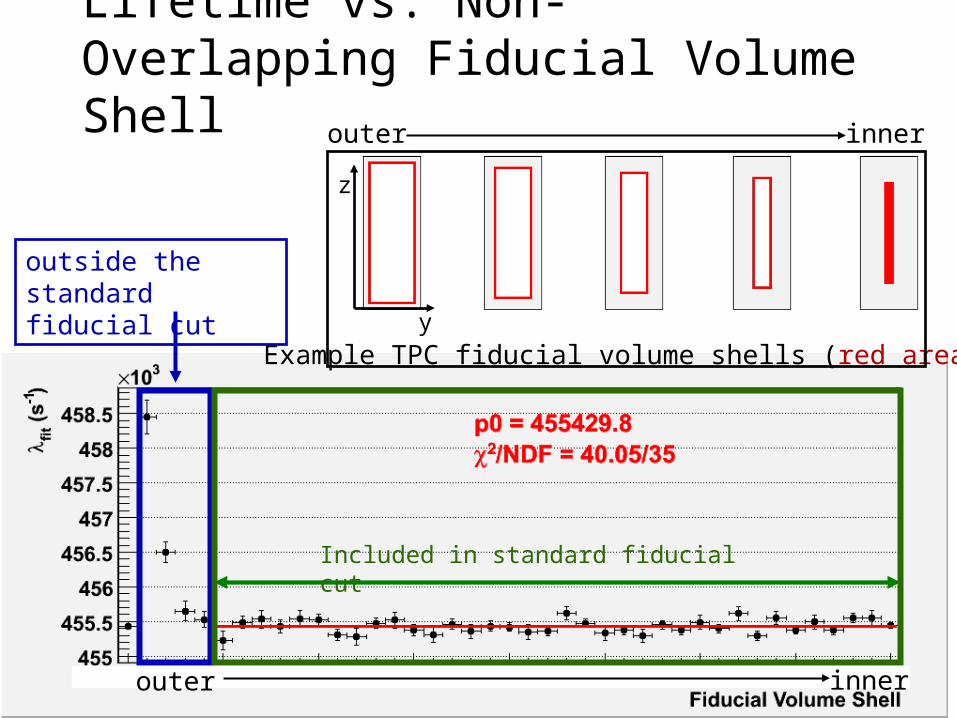
Lifetime vs. Non-Overlapping Fiducial Volume Shell
Included in standard fiducial cut
z
y
Example TPC fiducial volume shells (red areas)
outside the standard fiducial cut
outer inner
outer inner
19
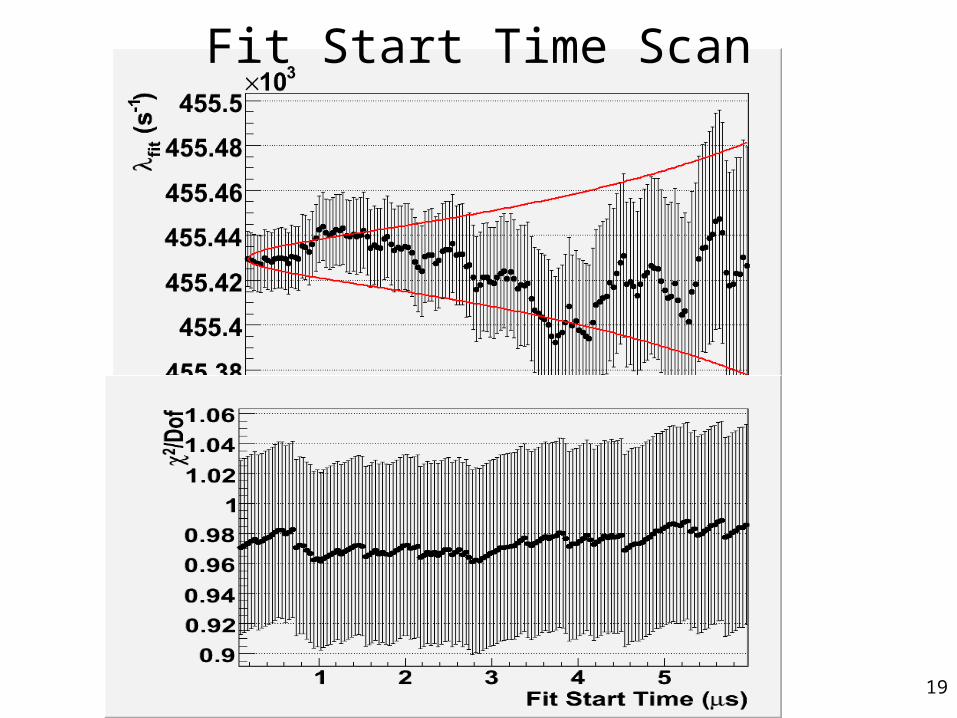
Fit Start Time Scan
20
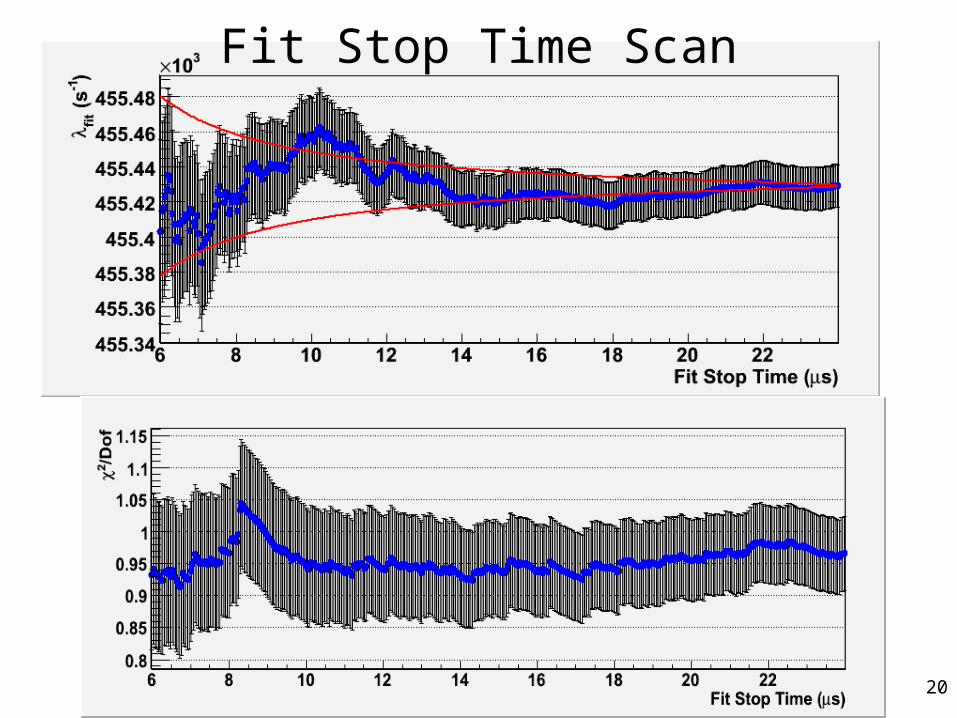
Fit Stop Time Scan
21
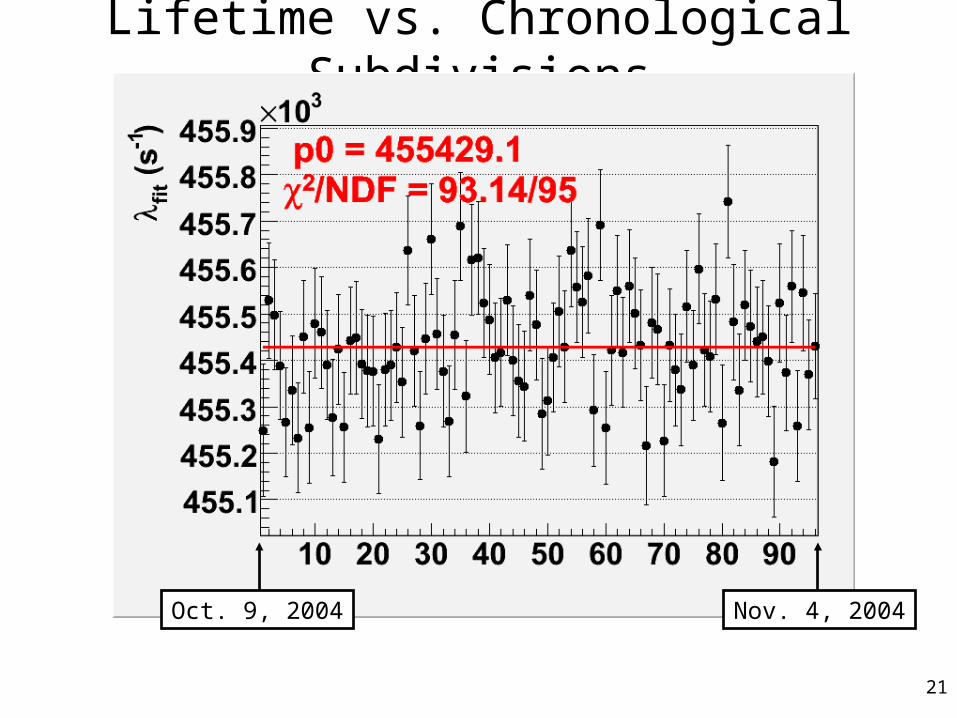
Lifetime vs. Chronological Subdivisions
Oct. 9, 2004 Nov. 4, 2004
22
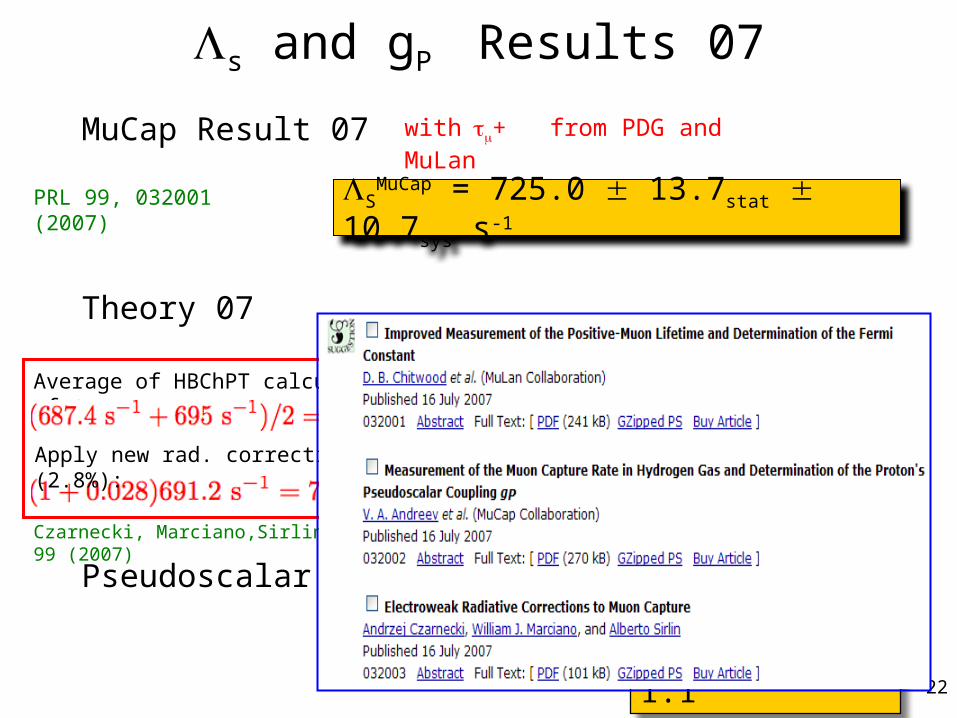
Czarnecki, Marciano,Sirlin , PRL 99 (2007)
PRL 99, 032001 (2007) SMuCap = 725.0 13.7stat 10.7sys s-1
Average of HBChPT calculations of S:
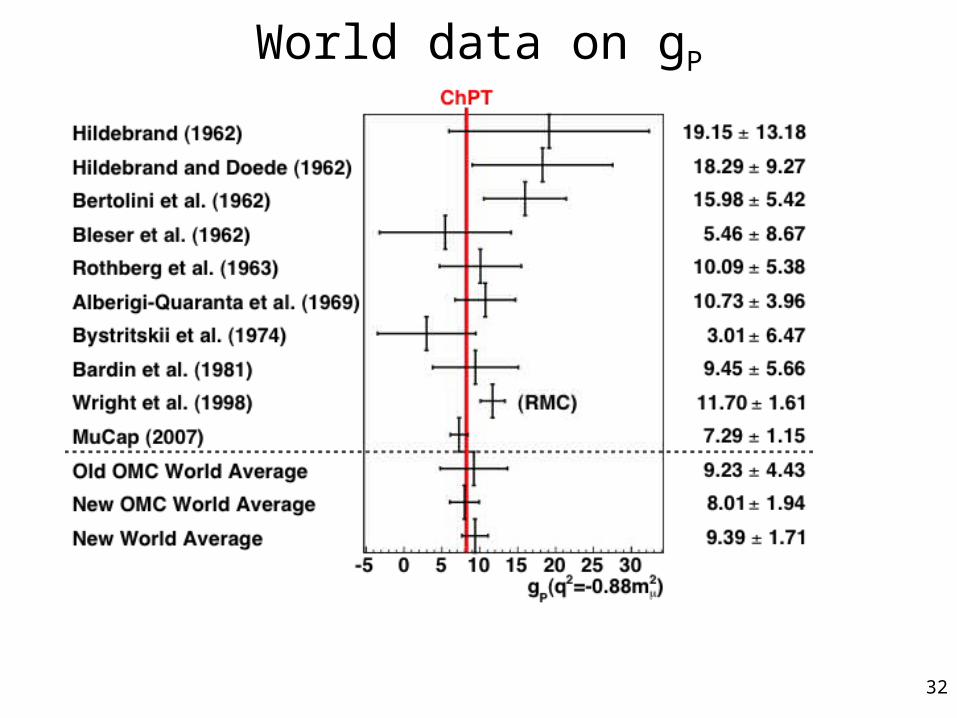
gP = 7.3 ± 1.1
Apply new rad. correction (2.8%):
further sub percent theory required
with + from PDG and MuLan
Ls and gP Results 07
MuCap Result 07
Theory 07
Pseudoscalar coupling from MuCap 07
STheory = 710.6 s-1
23
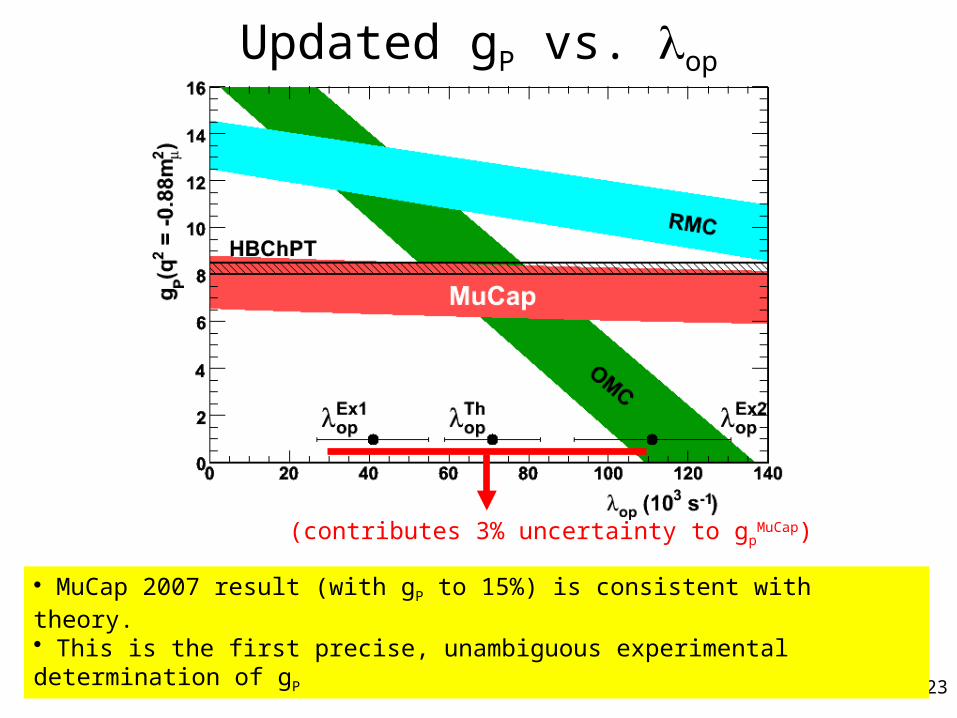
Updated gP vs. op
• MuCap 2007 result (with gP to 15%) is consistent with theory.• This is the first precise, unambiguous experimental determination of gP
(contributes 3% uncertainty to gpMuCap)
24
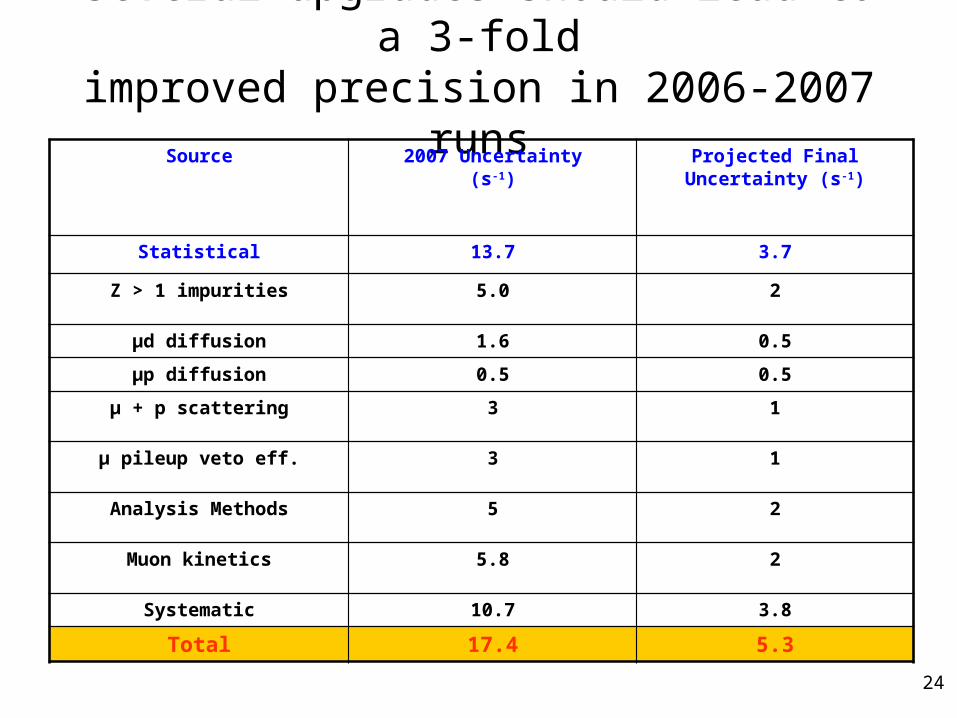
Several upgrades should lead to a 3-foldimproved precision in 2006-2007 runs
Source 2007 Uncertainty (s-1)
Projected Final Uncertainty (s-1)
Statistical 13.7 3.7
Z > 1 impurities 5.0 2
µd diffusion 1.6 0.5
µp diffusion 0.5 0.5
µ + p scattering 3 1
µ pileup veto eff. 3 1
Analysis Methods 5 2
Muon kinetics 5.8 2
Systematic 10.7 3.8
Total 17.4 5.3
25
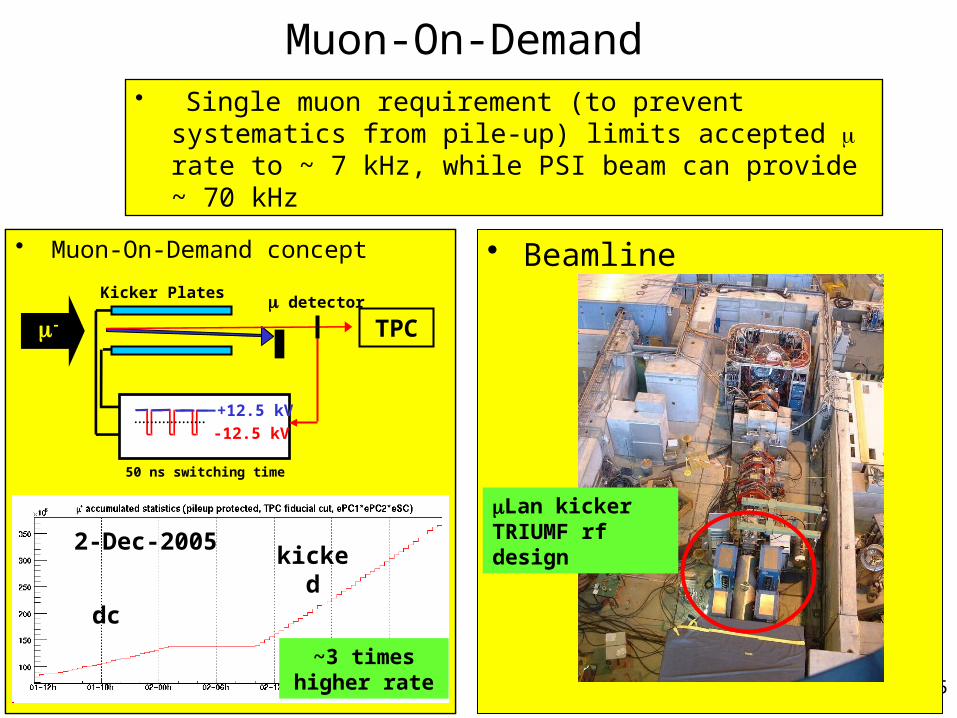
• Muon-On-Demand concept
• Muon-On-Demand concept
Muon-On-Demand
• Beamline
• Single muon requirement (to prevent systematics from pile-up) limits accepted m rate to ~ 7 kHz, while PSI beam can provide ~ 70 kHz
m-
+12.5 kV -12.5 kV
Kicker Plates
50 ns switching time
m detector
TPC
Fig will be improved
~3 times higher rate
dc
kicked2-Dec-2005
mLan kickerTRIUMF rf design

26
Several upgrades should lead to a 3-foldimproved precision in 2006-2007 runs
Source 2007 Uncertainty (s-1)
Projected Final Uncertainty (s-1)
Statistical 13.7 3.7
Z > 1 impurities 5.0 2
µd diffusion 1.6 0.5
µp diffusion 0.5 0.5
µ + p scattering 3 1
µ pileup veto eff. 3 1
Analysis Methods 5 2
Muon kinetics 5.8 2
Systematic 10.7 3.8
Total 17.4 5.3
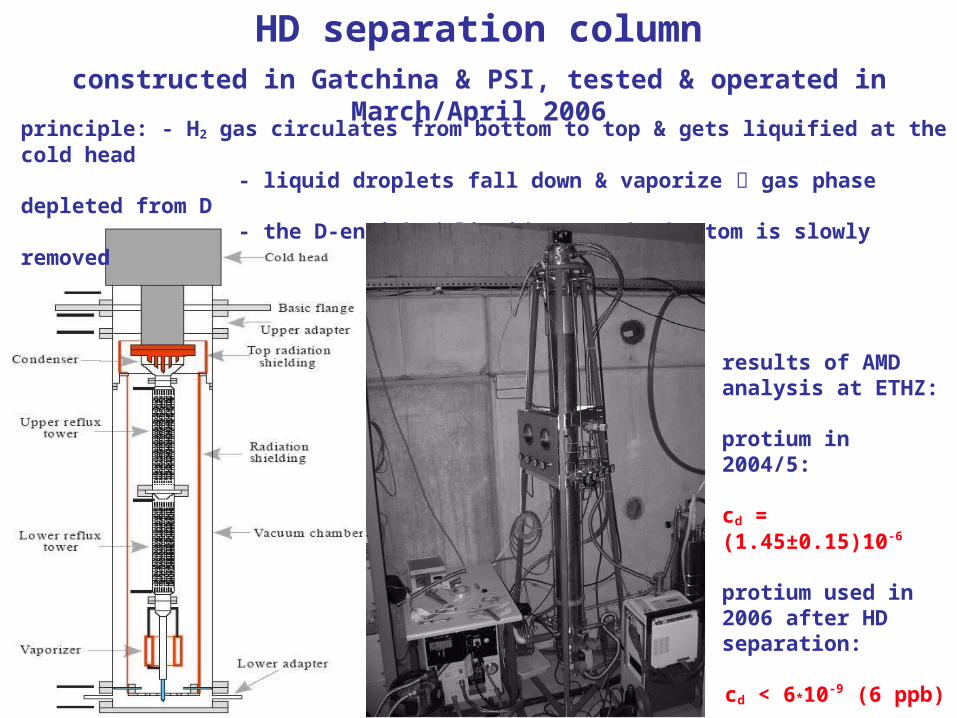
HD separation columnconstructed in Gatchina & PSI, tested & operated in March/April 2006
principle: - H2 gas circulates from bottom to top & gets liquified at the cold head - liquid droplets fall down & vaporize gas phase depleted from D - the D-enriched liquid H2 at the bottom is slowly removed
results of AMD analysis at ETHZ:
protium in 2004/5:
cd = (1.45±0.15)10-6
protium used in 2006 after HD separation:
cd < 6*10-9 (6 ppb)

28
Several upgrades should lead to a 3-foldimproved precision in 2006-2007 runs
Source 2007 Uncertainty (s-1)
Projected Final Uncertainty (s-1)
Statistical 13.7 3.7
Z > 1 impurities 5.0 2
µd diffusion 1.6 0.5
µp diffusion 0.5 0.5
µ + p scattering 3 1
µ pileup veto eff. 3 1
Analysis Methods 5 2
Muon kinetics 5.8 2
Systematic 10.7 3.8
Total 17.4 5.3
29
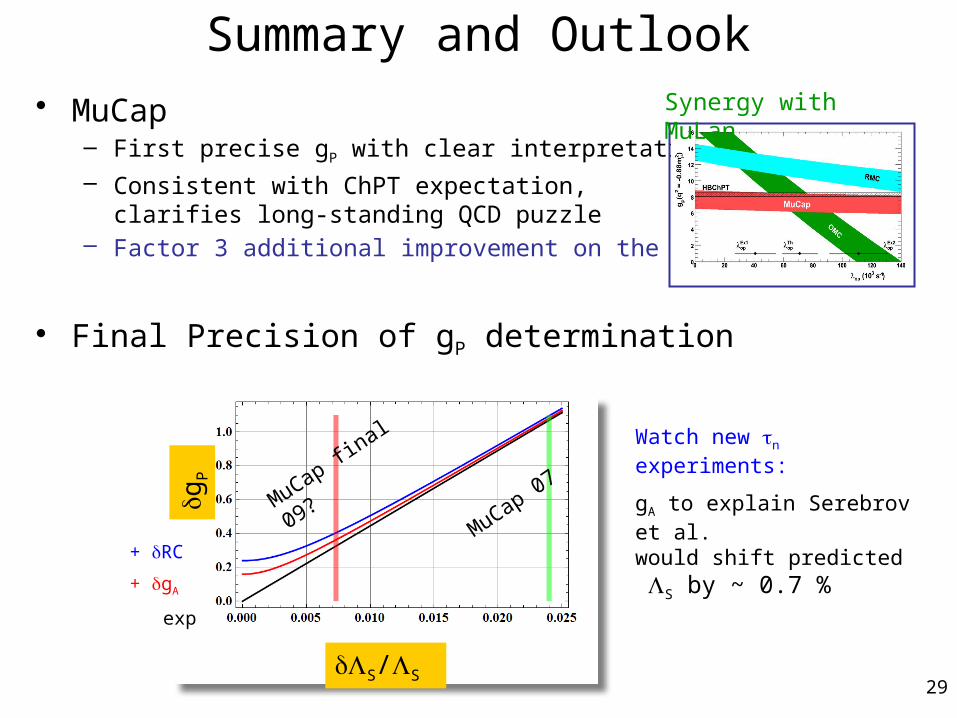
Summary and Outlook• MuCap
– First precise gP with clear interpretation
– Consistent with ChPT expectation, clarifies long-standing QCD puzzle
– Factor 3 additional improvement on the way
• Final Precision of gP determination
Synergy with MuLan
dg
P
MuCap 07MuCap fin
al 09?
dLS/LS
+ dRC
+ dgA
exp
Watch new tn experiments:
gA to explain Serebrov et al.would shift predicted LS by ~ 0.7 %
30
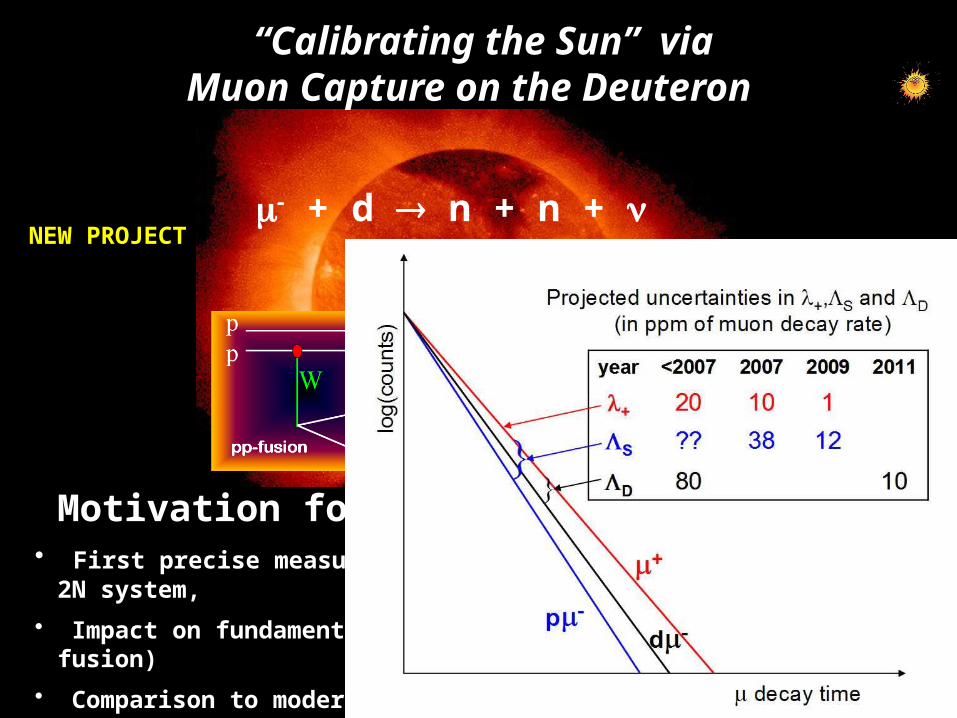
“Calibrating the Sun” via Muon Capture on the Deuteron
m- + d n + n + n
Motivation for the MuSun Experiment:• First precise measurement of basic Electroweak reaction in 2N system,
• Impact on fundamental astrophysics reactions (n’s in SNO, pp fusion)
• Comparison to modern high-precision calculations
NEW PROJECT
31
MuCap Collaboration
V.A. Andreev, T.I. Banks, B. Besymjannykh, L. Bonnet, R.M. Carey, T.A. Case, D. Chitwood, S.M. Clayton, K.M. Crowe, P. Debevec, J. Deutsch, P.U. Dick, A. Dijksman, J. Egger, D. Fahrni, O. Fedorchenko, A.A. Fetisov, S.J. Freedman, V.A. Ganzha, T. Gorringe, J. Govaerts, F.E. Gray, F.J. Hartmann, D.W. Hertzog, M. Hildebrandt, A. Hofer, V.I. Jatsoura, P. Kammel, B. Kiburg, S. Knaak, P. Kravtsov, A.G. Krivshich, B. Lauss, M. Levchenko, E.M. Maev, O.E. Maev, R. McNabb, L. Meier, D. Michotte, F. Mulhauser, C.J.G. Onderwater, C.S. Özben, C. Petitjean, G.E. Petrov, R. Prieels, S. Sadetsky, G.N. Schapkin, R. Schmidt, G.G. Semenchuk, M. Soroka, V. Tichenko, V. Trofimov, A. Vasilyev, A.A. Vorobyov, M. Vznuzdaev, D. Webber, P. Winter, P. Zolnierzcuk
Petersburg Nuclear Physics Institute (PNPI), Gatchina, RussiaPaul Scherrer Institute (PSI), Villigen, Switzerland
University of California, Berkeley (UCB and LBNL), USAUniversity of Illinois at Urbana-Champaign (UIUC), USA
Université Catholique de Louvain, BelgiumTU München, Garching, Germany
University of Kentucky, Lexington, USABoston University, USA
32
World data on gP
33
MuCap 07
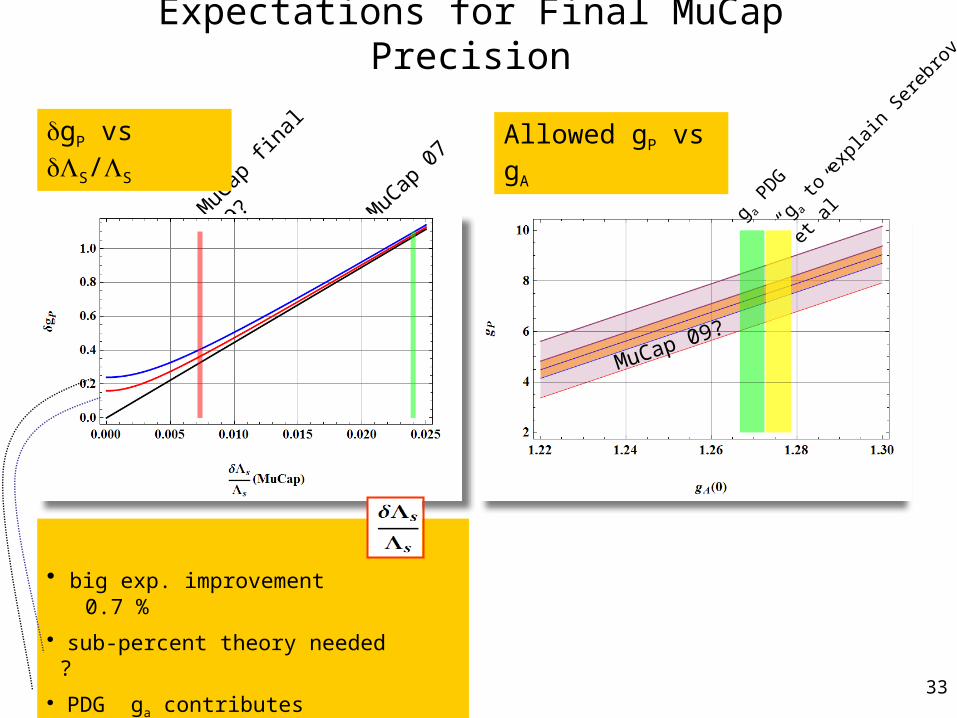
Expectations for Final MuCap Precision
MuC
ap 0
7
MuC
ap fin
al 09
?
• big exp. improvement 0.7 %
• sub-percent theory needed ?
• PDG ga contributes 0.36 %
• Rad. corr. 0.4 %
dgP vs dLS/LS Allowed gP vs gA
MuCap 09?
“g a to
exp
lain
Sereb
rov
et a
l”
g a P
DG
34
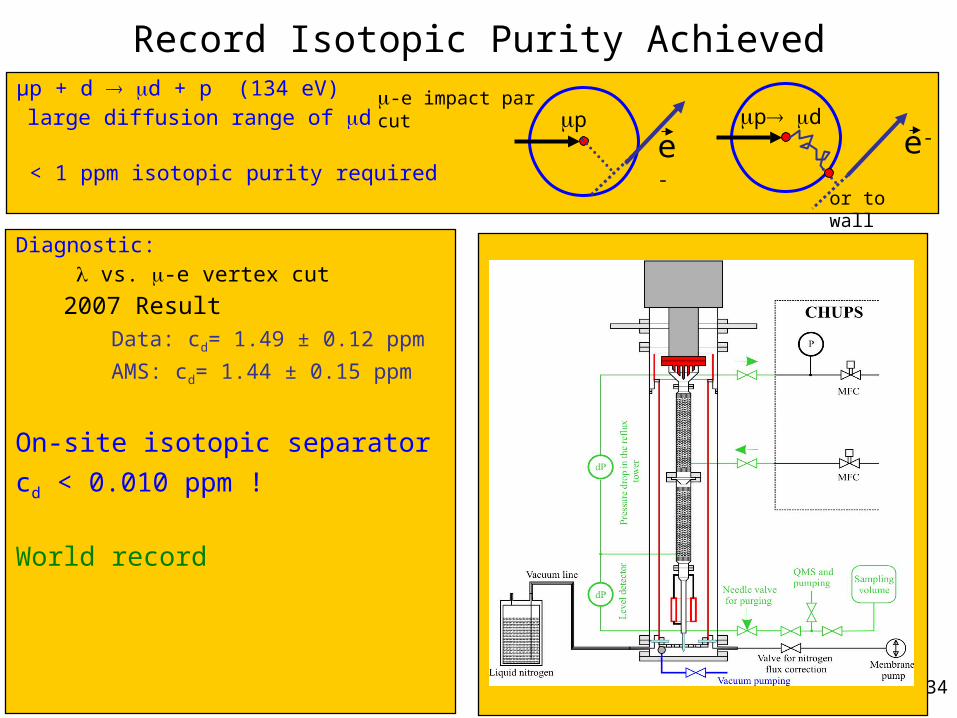
µp + d md + p (134 eV) large diffusion range of md
< 1 ppm isotopic purity required
Record Isotopic Purity Achieved
Diagnostic: l vs. m-e vertex cut
2007 ResultData: cd= 1.49 ± 0.12 ppm
AMS: cd= 1.44 ± 0.15 ppm
On-site isotopic separator
cd < 0.010 ppm !
World record
AMS, ETH Zurich
e- e-mp mp md
or to wall
m-e impact par cut
AMS, ETH Zurich
35
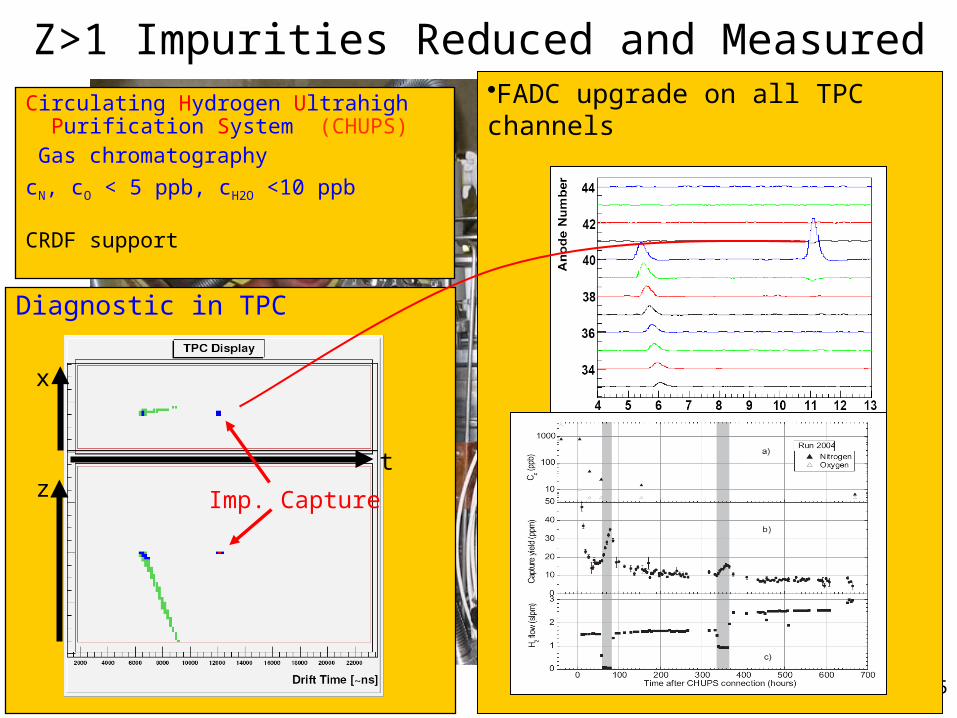
CHUPS•FADC upgrade on all TPC channels
Z>1 Impurities Reduced and MeasuredCirculating Hydrogen Ultrahigh Purification System (CHUPS) Gas chromatography
cN, cO < 5 ppb, cH2O <10 ppb
CRDF support
Diagnostic in TPC
Imp. Capture
x
zt
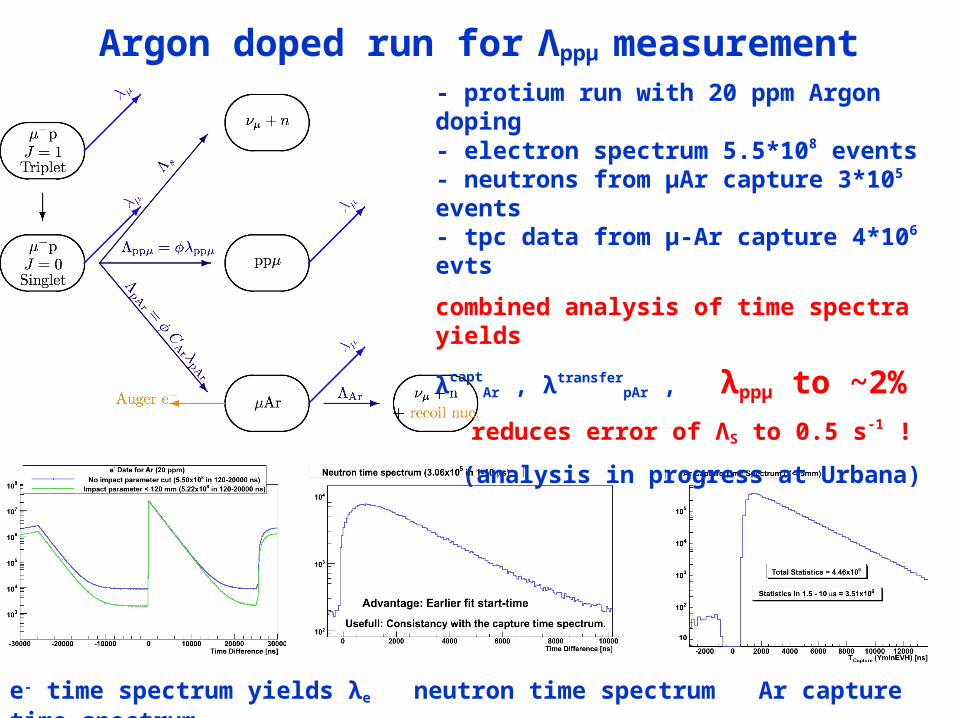
Argon doped run for Λppμ measurement
e- time spectrum yields λe neutron time spectrum Ar capture time spectrum
- protium run with 20 ppm Argon doping- electron spectrum 5.5*108 events- neutrons from μAr capture 3*105 events- tpc data from μ-Ar capture 4*106 evts
combined analysis of time spectra yields
λcaptAr , λ
transferpAr , λppμ to ~2%
reduces error of ΛS to 0.5 s-1 !
(analysis in progress at Urbana)
37
slope = l ≡ 1/t
DT
Lo
g N
eve
nts
mCap Method: Lifetime TechniquemCap measures the lifetime of m- in 10 bar Hydrogen.
m-
e-
Tzero
Telectron
slope = l ≡ 1/t
Data Acquisition
DTRepeat 1010 times for a 10 ppm precision lifetime measurement.
H2
S
S to 1% precision
Compare to + lifetime:
38
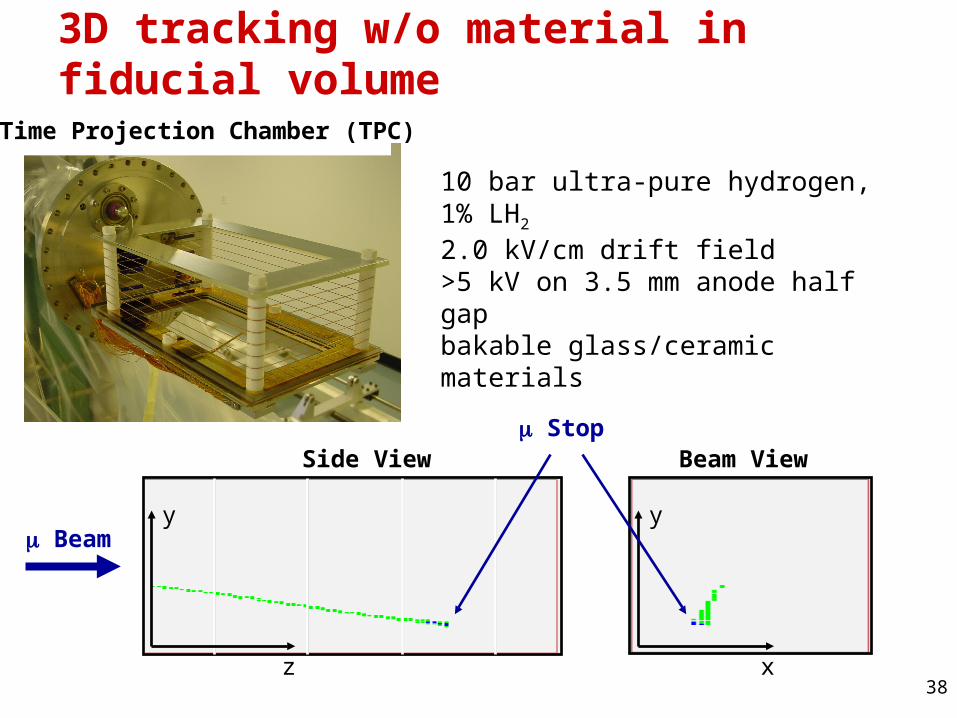
3D tracking w/o material in fiducial volume
10 bar ultra-pure hydrogen, 1% LH2
2.0 kV/cm drift field >5 kV on 3.5 mm anode half gapbakable glass/ceramic materials
Time Projection Chamber (TPC)
Beam ViewSide View
m Beam
m Stop
y
xz
y
39
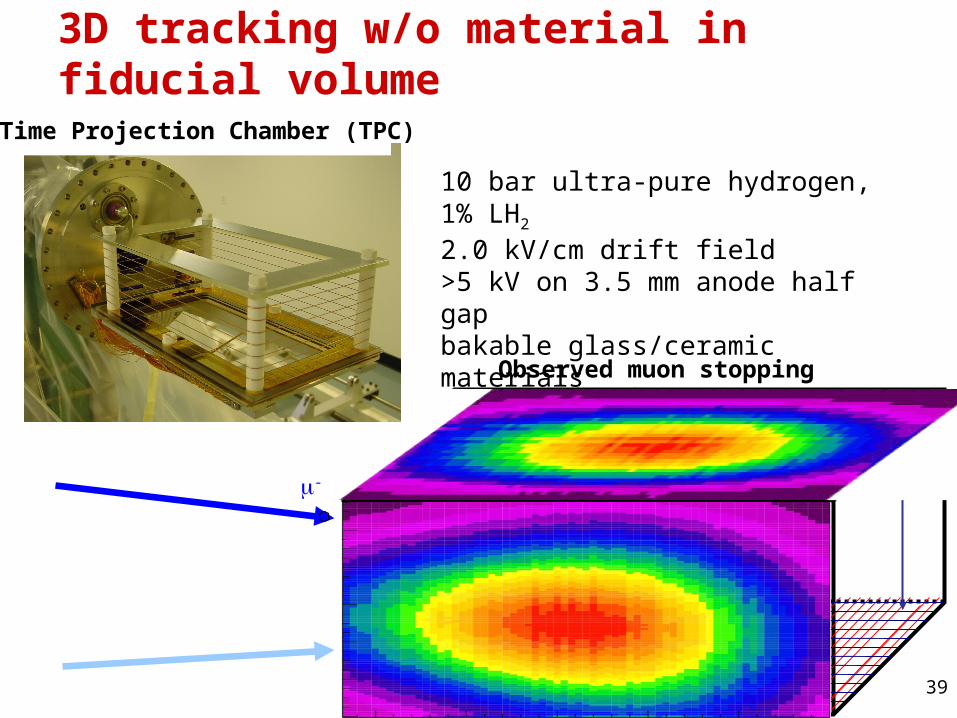
p
m-
Observed muon stopping distribution
E
e-
3D tracking w/o material in fiducial volume
10 bar ultra-pure hydrogen, 1% LH2
2.0 kV/cm drift field >5 kV on 3.5 mm anode half gapbakable glass/ceramic materials
Time Projection Chamber (TPC)
40
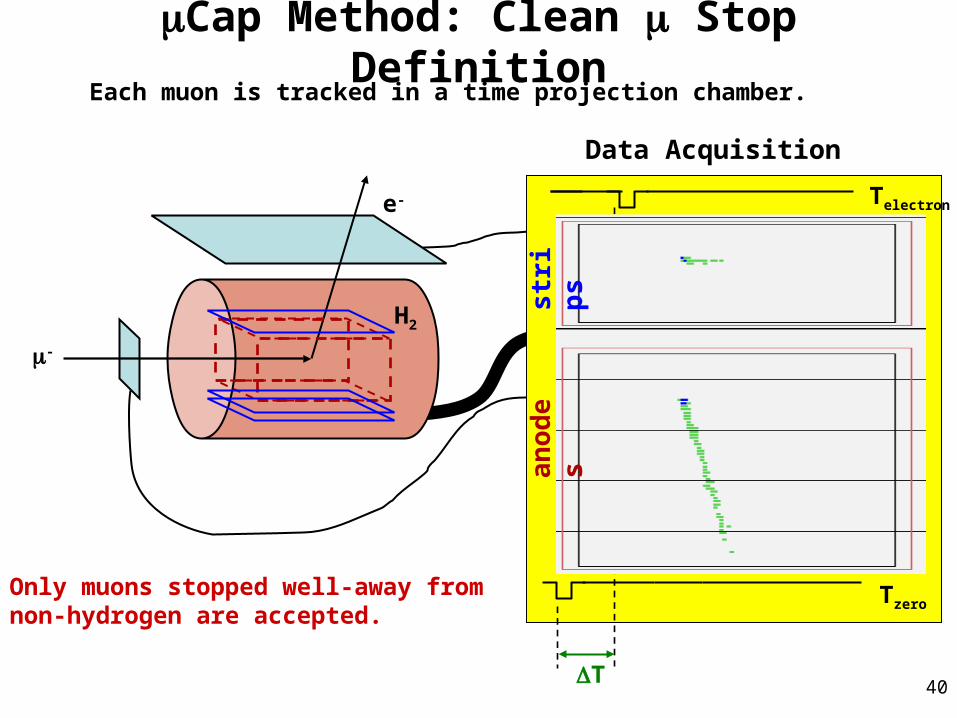
mCap Method: Clean Stop DefinitionEach muon is tracked in a time projection chamber.
m-
e-
Tzero
Telectron
Data Acquisition
DT
Only muons stopped well-away from non-hydrogen are accepted.
H2
an
od
es
str
ips

41
mCap Detailed Diagram
Tracking of Muon to Stop Position in Ultrapure H2 Gas Tracking of Decay Electron
42
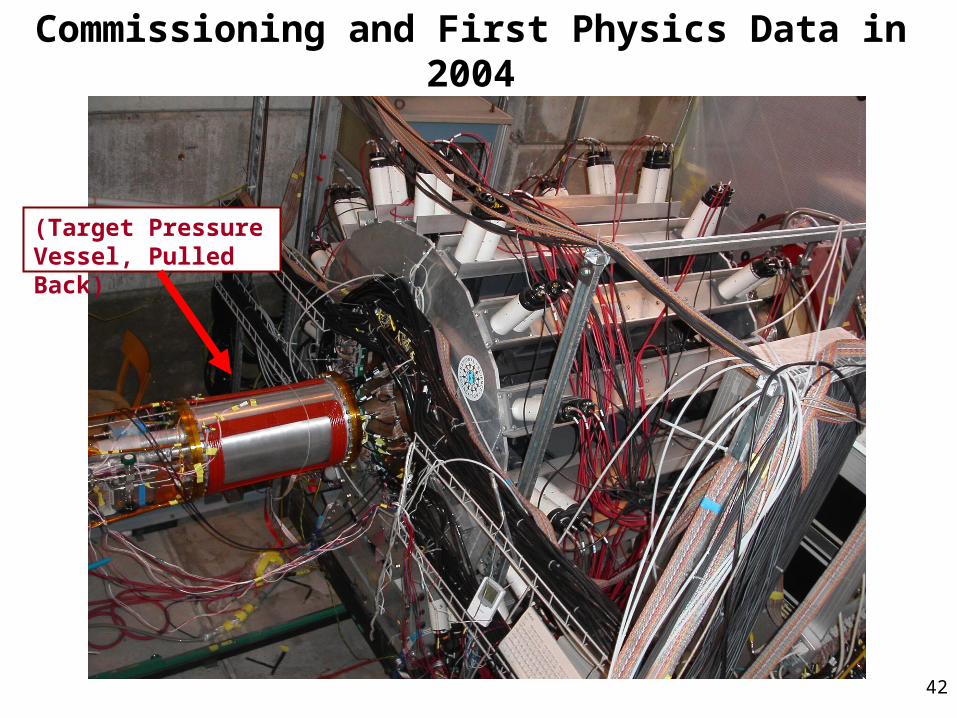
Commissioning and First Physics Data in 2004
(Target Pressure Vessel, Pulled Back)
43
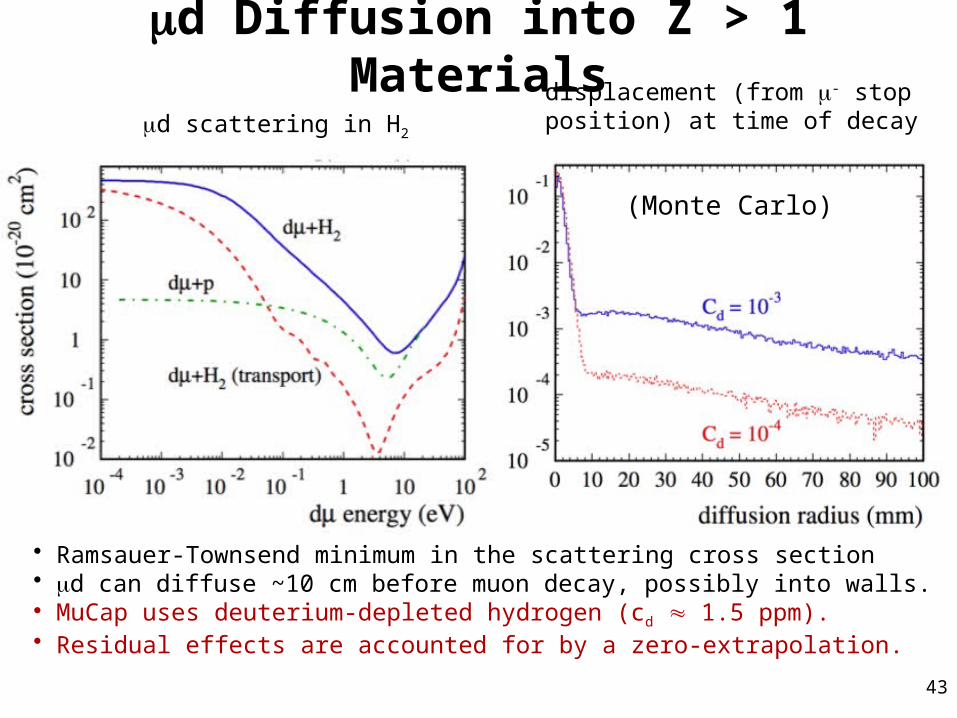
d Diffusion into Z > 1 Materials
d scattering in H2
displacement (from - stopposition) at time of decay
• Ramsauer-Townsend minimum in the scattering cross section• d can diffuse ~10 cm before muon decay, possibly into walls.• MuCap uses deuterium-depleted hydrogen (cd 1.5 ppm).• Residual effects are accounted for by a zero-extrapolation.
(Monte Carlo)
44
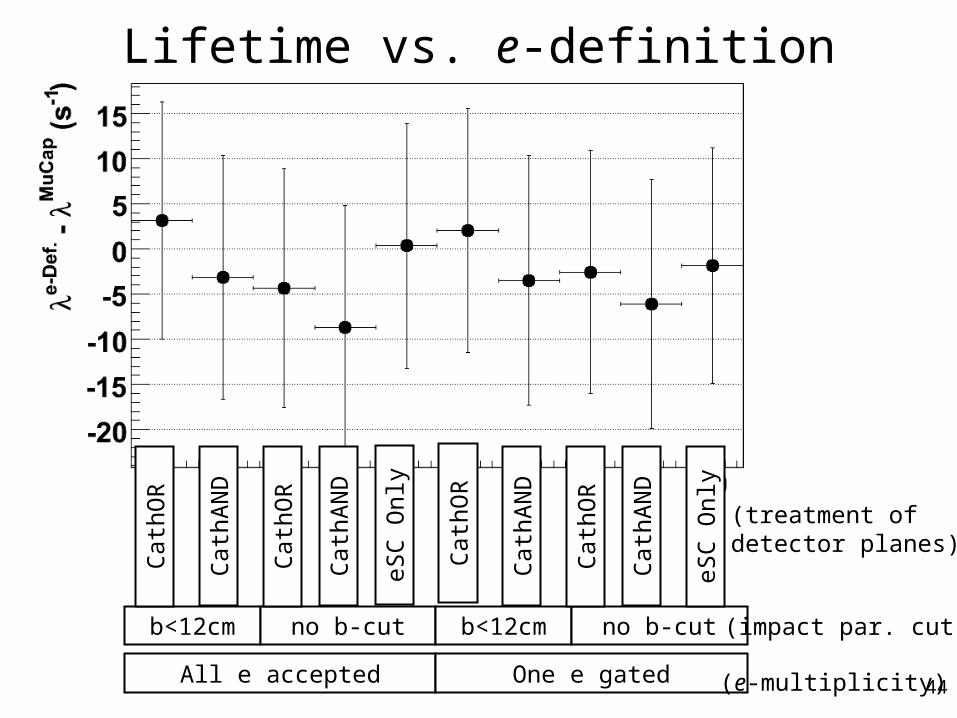
Lifetime vs. e-definition
All e accepted One e gated
b<12cm no b-cut b<12cm no b-cut
Cat
hOR
Cat
hAN
D
eSC
Onl
y
Cat
hOR
Cat
hAN
D
Cat
hOR
Cat
hAN
D
eSC
Onl
y
Cat
hOR
Cat
hAN
D(impact par. cut)
(treatment ofdetector planes)
(e-multiplicity)
45
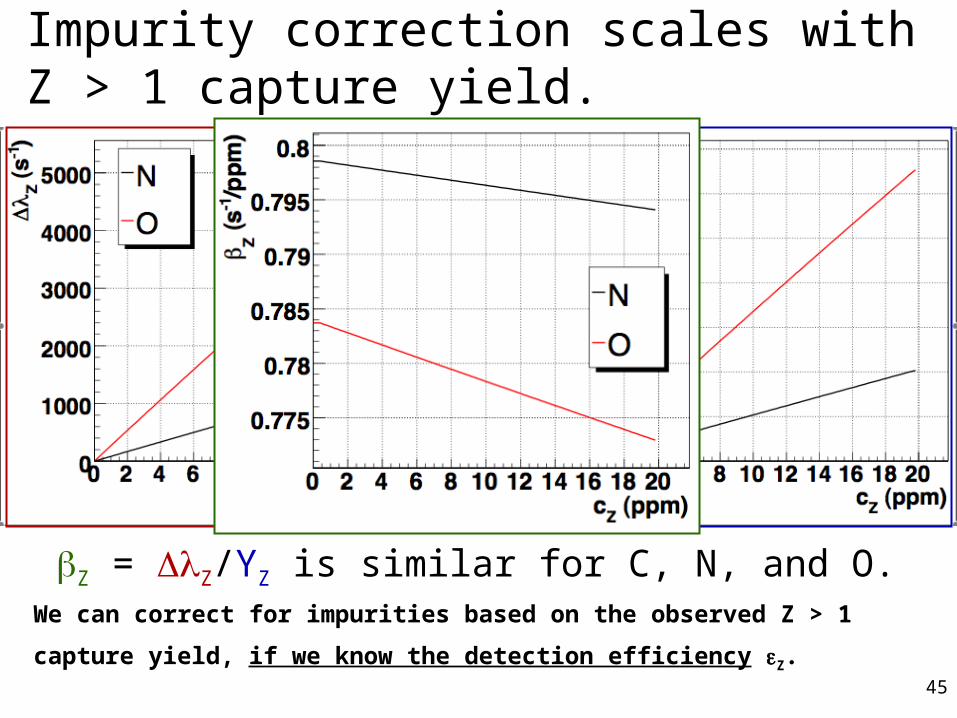
Impurity correction scales with Z > 1 capture yield.
Z = Z/YZ is similar for C, N, and O.We can correct for impurities based on the observed Z > 1 capture yield, if we
know the detection efficiency Z.
46
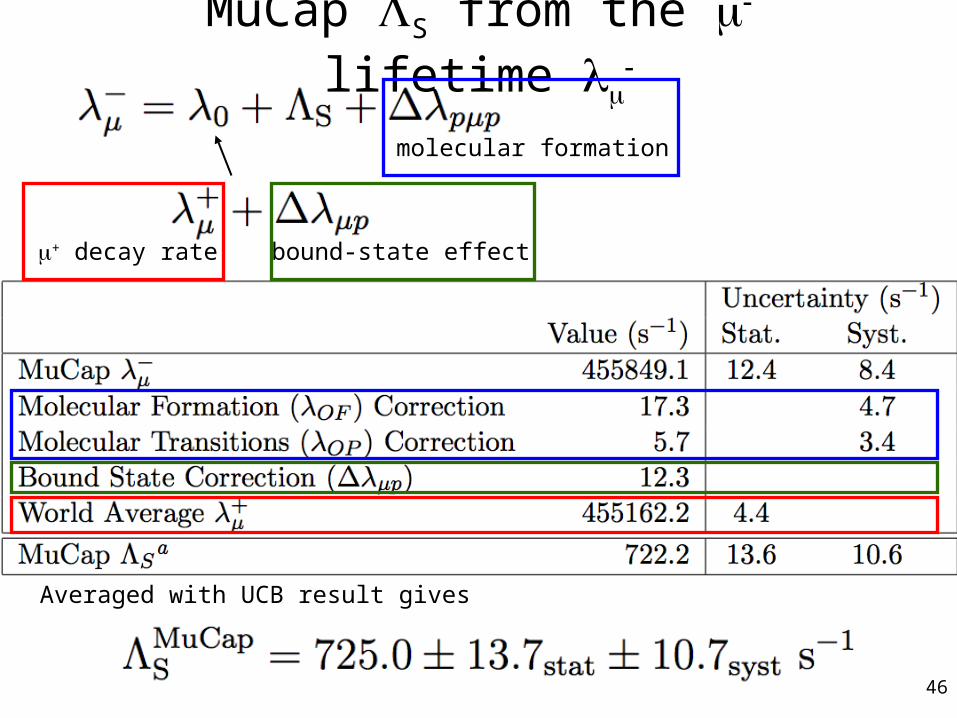
MuCap S from the lifetime
bound-state effect+ decay rate
molecular formation
Averaged with UCB result gives
47
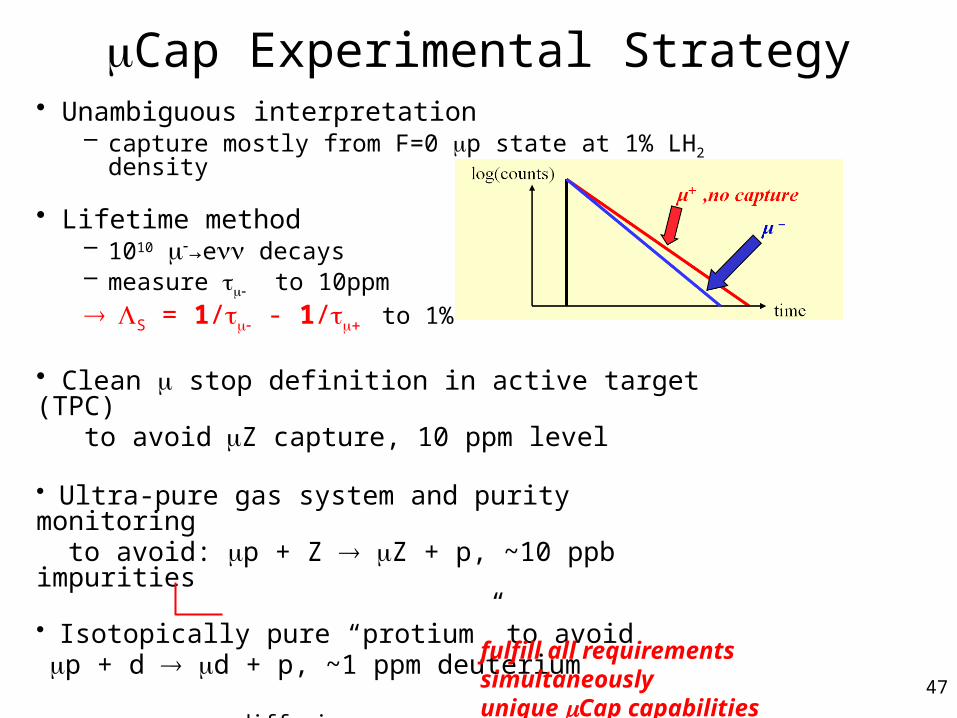
• Unambiguous interpretation– capture mostly from F=0 mp state at 1% LH2 density
• Lifetime method– 1010 m-→enn decays– measure - to 10ppm
S = 1/- - 1/+ to 1%
• Clean m stop definition in active target (TPC) to avoid mZ capture, 10 ppm level
• Ultra-pure gas system and purity monitoring to avoid: mp + Z mZ + p, ~10 ppb impurities
• Isotopically pure “protium” to avoid mp + d md + p, ~1 ppm deuterium
diffusion range ~cm
mCap Experimental Strategy
fulfill all requirements simultaneouslyunique mCap capabilities
48
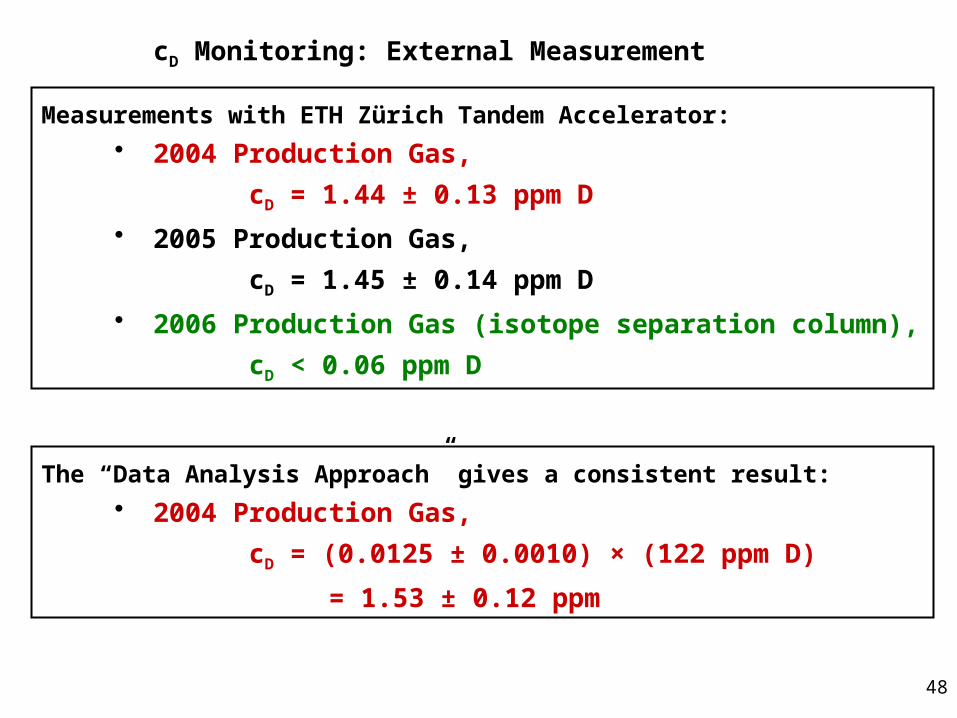
cD Monitoring: External Measurement
Measurements with ETH Zürich Tandem Accelerator:
• 2004 Production Gas,
cD = 1.44 ± 0.13 ppm D
• 2005 Production Gas,
cD = 1.45 ± 0.14 ppm D
• 2006 Production Gas (isotope separation column),
cD < 0.06 ppm D
The “Data Analysis Approach” gives a consistent result:
• 2004 Production Gas,
cD = (0.0125 ± 0.0010) × (122 ppm D)
= 1.53 ± 0.12 ppm