Embed Size (px)
Citation preview

296
CHAPTER 7
DATA ANALYSIS
Index :
7.1 Introduction 297
7.2 Member Brokers Questionnaire and Analysis of the Data 297
7.3 Investor’s Questionnaire and Analysis of the Data 331

297
CHAPTER 7
DATA ANALYSIS
7.1 Introduction:
It is necessary to understand the opinions of the brokers and the
investors about the equity derivatives market it was felt necessary to collect
data through questionnaires. It was also important to gather the primary data
from the brokers and the investors in the equity derivatives markets to
formulate the opinion about the issues, concerns and other relevant changes that
could be suggested in the equity derivatives markets. For the purpose, there
were two types of structured questionnaires prepared to gather the primary data,
one for the investors and the other for the members/stock brokers. The data was
sought from the investors and the member brokers in the physical as well as the
online mode. The details of the questionnaire and the analysis of the data are
elaborated in this chapter.
7.2 Member Brokers Questionnaire and Analysis of the Data:
The primary information was also sought from the brokers in the equity
derivatives market though the interviews, meetings and online mode. Largely
the data was gathered through the circulation of questionnaire in the online
mode from the nationwide network of the brokers. The questionnaire was
designed to understand the type of broking entity and which exchanges it is
registered on, types of clients they deal with and through which mode etc. The
questionnaire further focused on seeking opinion on need of certified dealers
operating the terminals, only certified retail investors, allowing options to
clients and their profiling, preference of equity derivative product for
investment and periodicity of contracts preferred by clients, purpose of trading
and any strategies adopted for the same by clients, opinion on contract size,
risks of concern, margining system for brokers and margins levied, effective
utilization of capital deployed, risk management system, need to increase the
stocks in the equity derivatives market, need for wide basket of products, need

298
to reduce the transaction cost, need to change in the regulation style, need for
OTC derivatives market in India like global markets etc.
For the purpose of collection of primary data from the brokers, a
questionnaire was collected from stock brokers across the broking industry
spread across India. The questionnaire form was sent to all the broking
members in the industry. The help was also taken from Association of National
Exchanges Members of India (ANMI), a PAN India body comprising of the
trading members of National Stock Exchange of India Limited (NSEIL) and
Bombay Stock Exchange (BSE) spread across the country to circulate the
questionnaire form to all the brokers in the broking fraternity.
There were 903 and 1329 equity derivatives brokers registered as of
December 2011 for trading in the equity derivatives segment of BSE and NSE
respectively. Most of the brokers have obtained registration on both the
exchanges in the equity derivatives segment. As an intensive study of
derivatives market in India, for the purpose of study the questionnaire was
sought from all the brokers keeping in mind to cover at least 5% brokers, i.e. 66
brokers of NSE and 45 brokers of BSE as sample respondents, with a view to
project working of the derivatives market in India, understand trends observed
and the problems faced by them. However, since responses to the questionnaire
could be collected from 80 brokers of NSE and 65 brokers of BSE, all these
responses to the questionnaire were taken as a sample. These respondents’
practical exposure helped in understanding the problems and prospects of
derivatives market in India.
However, due to company policies, many broking outfits and officials
could not express the view of the organization and hence large number of these
responses were mentioned to be their personal view and not of the company. With
this caveat, the responses were evaluated. The revelations of the responses to the
questionnaires have been evaluated and tabulated below under various heads:
1. Break up of equity broking entities as per their membership on Indian
Exchange(s):
As mentioned earlier, there were 80 respondents who provided
responses to the questionnaire. The brokers can obtain various types of
memberships as described in the earlier chapter like Limited Trading
Membership, Trading membership clubbed with Self Clearing Membership,

299
Trading and Clearing membership and Professional Clearing membership.
Some of these broking entities are brokers on both the exchanges i.e. BSE
and NSE as well. The table given below shows that some of the broking
entities has obtained multiple memberships on the exchanges:
Table 7.1
Category-wise Break-up of respondent brokers of equity derivatives
memberships
Equity Derivatives
Membership Response Percent Response Count
BSE (Limited TM) 2.5% 2
BSE (TM) 45.0% 36
BSE (T & CM) 37.5% 30
BSE (SCM) 6.3% 5
BSE (PCM) 0.0% 0
Total BSE Respondents 65
NSE (TM) 50.0% 40
NSE (T & CM) 53.8% 43
NSE (SCM) 22.5% 18
NSE (PCM) 1.3% 1
Total NSE Respondents 80
Source: Questionnaire
There were 65 brokers of BSE and 80 brokers of NSE who
responded to the questionnaire. As can be seen from the above table, there
were large respondents who were TMs i.e. 50% in NSE and 45% in BSE
and T&CMs i.e. 53.8% in NSE and 37.5% in BSE. There were also no
brokers having PCM membership on BSE amongst the respondents. The
representation in the bar chart form is given below:
Chart 7.1
Category-wise Break-up of respondent brokers of equity derivatives
memberships
Source: Questionnaire

300
2. Category of Clients the broking entities deal with
The broking entities deal with various types of clients such as FIIs,
Sub-accounts, Financial Institutions, Non Resident Indians (NRIs), High
Net-worth Individuals (HNIs), Retail Clients etc. The researcher had asked
the equity derivatives brokers about the type of clients they deal with in
order to understand the nature of brokers responding to the questionnaire to
evaluate need to expand the sample if required to make the same broad
based. The answers received to the subsequent questions then would be
responded by the respondents based on their experiences of dealing with
these different types of clients. The following table gives the break-up of
category of clients the brokers deal with:
Table 7.2
Category of Clients the broking entities deal with in the equity
derivatives market
Responses Response
Percent Response Count
Institutional Clients (FIIs, Sub-accounts) 58.8% 47
Financial Institutions, Mutual Funds 66.3% 53
NRI clients 77.5% 62
HNI Clients 85.0% 68
Retail Clients 77.5% 62
Total Responses 80
Source: Questionnaire
As can be seen from the above table, large number of brokers who
filled up the questionnaire dealt with HNI clients (85%), followed by Retail
and NRI clients (77.5%), then with Financial Institutions, Mutual Funds
(66.3%) and lastly with Institutional Clients (FIIs, Sub-accounts) (58.8%).
Thus, the respondent base is broad based and they dealt with varied set of
clients in their equity derivatives dealing on day to basis. Hence, the
answers to the subsequent questions would be broad based and taking into
considerations the experiences of these brokers in dealing with such a
varied set of clients.
The column chart given below shows the breakup of various
categories of clients the respondents who filled up the questionnaire deal
with:

301
Chart 7.2
Category of Clients the broking entities deal with in the equity
derivatives market
Source: Questionnaire
It can be seen from the above chart that more than 50% of the
respondents have dealt with all the set of clients in the equity derivatives
market such as Institutional Clients, Financial Institutions, NRI clients, HNI
clients and retail clients. Thus, the respondent broker’s base is broad based.
3. Certification of dealers operating trading terminal in equity derivatives
segment:
At the time of allowing derivatives market in India, as
recommended in the L. C. Gupta committee report, SEBI has mandated all
the dealing terminals should be operated by only the derivatives certified
persons. This was the requirement in 2000, when many people did not have
any knowledge about the derivatives market and the products in the
derivatives market. Also, if the persons manning the dealing terminals did
not have basic knowledge about the derivatives market, the risk that can
pose to the market could be huge. Besides, this there were also chances of
mis-selling of the derivatives products to the investors. Hence, at that point
of time there was a need felt to allow only derivatives certified persons to
operate the dealing terminal. For this purpose, NSE and BSE have put in
place a facility for testing and certification by launching NSE's Certification
in Financial Markets (NCFM) and BSE's Certification on Financial Markets
(BCFM) respectively.

302
The NCFM and BCFM are an online testing and certification
programmes. These programmes test the practical knowledge and skills
required to operate in the financial markets. Tests are conducted in a
secured and unbiased manner and certificates are awarded based on merit of
the candidate to qualify the on-line test. The exchanges offer a certification
in Derivatives Market (Dealers) Module for the dealers. These certificates
are valid for a period of three years which can further be renewed for a
period of two years.
The brokers have grown in size and stature over a period of time.
Today, big brokers have thousands of terminals operated PAN India either
from their own office or from their branches or the sub-broker/Authorized
Person’s network. There is also responsibility casted on the brokers for
resolution of any grievances from the clients with regard to any act of either
their employee or by any other associated individuals/entities in any
capacity with them. Thus, it was felt necessary by the researcher to
understand from the broker’s to understand whether such a certification
should be made mandatory or this requirement over a period of time has
lost its significance and the guidelines in this regard need to be relaxed.
Hence, for this purpose the brokers were asked to respond to the
appropriateness of the requirement of only certified dealers should be
operating the terminal in today’s scenario. The outcome of the responses to
the questionnaire is as follows:
Table 7.3
Requirement of operating trading terminal in equity
derivatives segment by only certified dealers is Appropriate
Responses Response Percent Response Count
YES 81.3% 65
NO 18.8% 15
Total Participants 80
Source: Questionnaire
The representation of the responses as tabulated above is presented
in the Pie Chart form below:

303
Chart 7.3
Need of operating trading terminal in equity derivatives segment by only
certified dealers is appropriate
Source: Questionnaire
As can be seen for the above table and chart, 81.3% of the brokers
feel that the terminals should be operated by certified dealers only. It is only
18.8% of the respondents who feel otherwise. The main reason for large
number of respondents feeling the need is that any misconduct or mistake
of the dealers, the broker is responsible/ liable for their actions. They also
understand that the chances of certified dealers doing the mistake are less
than the completely naïve dealer. Thus, a large number of brokers support
the requirement of the only certified dealers operating the trading terminal.
4. Certification requirement for the algorithmic terminals:
One is able to understand the comfort of the brokers drawing from
the fact that only the certified dealers are manning the terminals will reduce
the mistakes such as punching errors, not misunderstanding the premium
per lot with per share etc. However, today with the advancement of
technology and the class of High Frequency Traders, the trading activity
pattern has been shifting to automated trading activity through system build
algorithms which is also called as algorithmic trading. In the algorithmic
trading, there is no manual intervention of the dealers for placing the orders
as the orders are placed by the system itself based on the built in logic and
parameters set.
As per existing requirement, any new terminal in the equity
derivatives segment is allotted only to the person who is certified. Hence,
304
even such algo terminals would require mentioning and maintaining
certification of separate persons for each terminal. Thus, it was felt
necessary to understand from the brokers whether they feel it is necessary to
have a requirement of only certified dealers operating the terminal even for
such algo terminals. The result of the responses is as follows:
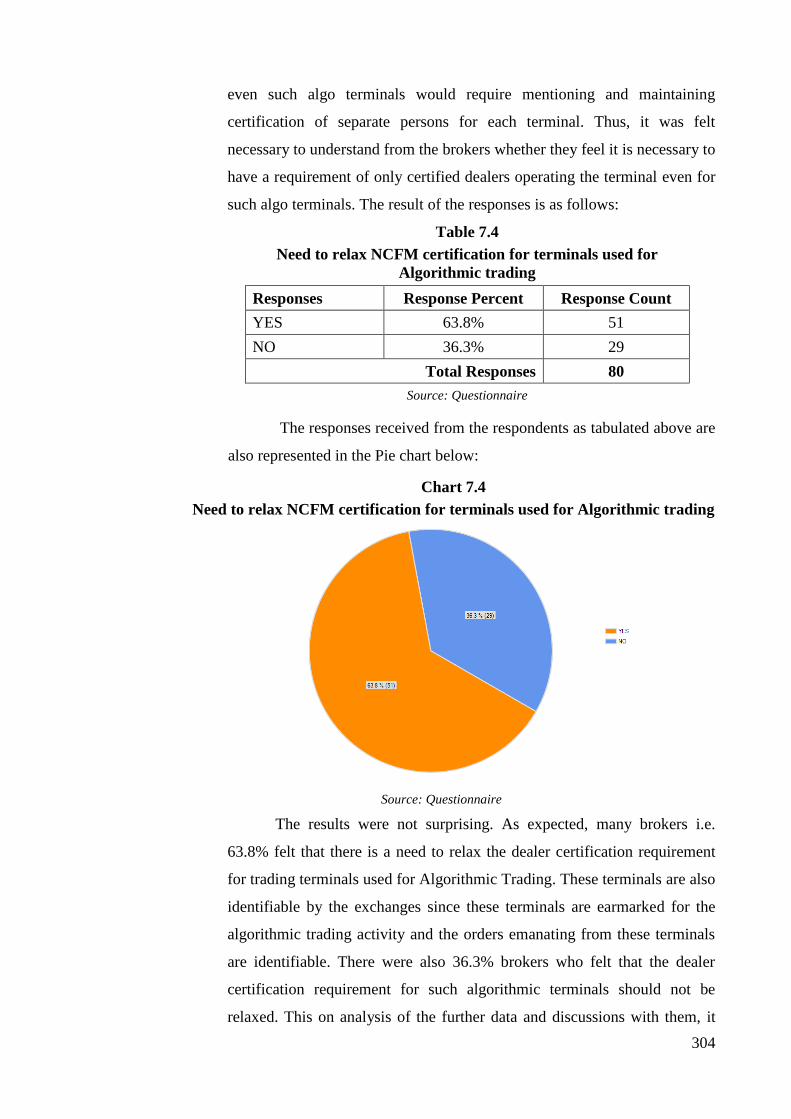
Table 7.4
Need to relax NCFM certification for terminals used for
Algorithmic trading
Responses Response Percent Response Count
YES 63.8% 51
NO 36.3% 29
Total Responses 80
Source: Questionnaire
The responses received from the respondents as tabulated above are
also represented in the Pie chart below:
Chart 7.4
Need to relax NCFM certification for terminals used for Algorithmic trading
Source: Questionnaire
The results were not surprising. As expected, many brokers i.e.
63.8% felt that there is a need to relax the dealer certification requirement
for trading terminals used for Algorithmic Trading. These terminals are also
identifiable by the exchanges since these terminals are earmarked for the
algorithmic trading activity and the orders emanating from these terminals
are identifiable. There were also 36.3% brokers who felt that the dealer
certification requirement for such algorithmic terminals should not be
relaxed. This on analysis of the further data and discussions with them, it

305
was found out that many of them who were not in favor of such relaxation
do not use any such algorithmic trading systems.
Thus, it is felt that the regulatory body may like to revisit the
requirement with regard to the dealer certification requirement for the
terminals used for algorithmic trading.
5. Opinion on Basic Test requirement for admitting clients in the Equity
Derivatives
Derivatives per se are considered to be complex products. Hence, it
is also presumed that many investors and clients do not understand this
product and the investment techniques. Many of them are also not familiar
with the terminologies used in the equity derivatives and the risks involved
in trading in the derivatives markets. It has also been seen from many
complaints filed by the investor that the investors were completely unaware
of the derivatives products but were still trading without understanding the
risks and consequences of trading in derivatives. Thus, it was felt necessary
to understand from the brokers whether it would be prudent to make it
mandatory for all derivative investors to take up the basic derivatives test
before allowing them to trade in the equity derivatives market. The results
of the questionnaire are as follows:
Table 7.5
Opinion on Basic Test requirement for admitting clients in the
Equity Derivatives
Responses Response Percent Response Count
YES 71.3% 57
NO 28.8% 23
Total Responses 80
Source: Questionnaire
The response received from the respondents as tabulated above are
also presented in the Pie chart below:

306
Chart 7.5
Opinion on Basic Test requirement for admitting clients in the Equity
Derivatives
Source: Questionnaire
As can be seen from the above table and the chart, 71.3%
respondents feel that there should be basic test taken up by the investors
before them being allowed to trade in the equity derivatives market for the
first time trading where as only 28.8% do not feel for such a need.
Considering the above responses, the regulators may like to evaluate such
requirement and may like to evaluate the manner in which the test can be
carried out since this requirement also should not become a stumbling block
for investors to participate in the market and keep away large number of
first time investors from the equity derivatives market. The test may cover
various aspects like products in the equity derivatives, margin requirements,
their rights and obligations, risks associated with the derivatives trading etc.
The process can be made easy by allowing the clients to take up the test
online and may be of a very short duration.
6. Need to restrict certain set of investors from trading in the Options
The options are leveraged product. Leverage is used to amplify
investment gains and losses on money invested. The buyer of the option has
to pay only the premium and can have unlimited upside. However, seller of
the option receives only the premium amount involved but in the adverse
scenarios there could be unlimited downside to the seller. Thus, the options
are risky for seller of the options and if the investors are naïve and do not
understand the product he/she may wipe out the entire funds available with
him/her and sometimes may end up into debt. Thus, it was considered to

307
understand from the respondents whether the options should be restricted to
certain set of clients, say those clients with high risk appetite, those with the
income above some threshold and such other criteria. The outcome of the
responses to the questionnaire was very surprising. The same has been
tabulated below:
Table 7.6a
Option trading be restricted to certain set of investors
Responses Response Percent Response Count
YES 50.0% 40
NO 50.0% 40
Total Responses 80
Source: Questionnaire
The response received from the respondents as tabulated above is
also presented in the Pie chart below:
Chart 7.6a
Option trading be restricted to certain set of investors
Source: Questionnaire
As mentioned earlier, the result was really surprising. There was no
conclusion that could be drawn from the questionnaire. 50% of the
respondents felt that options should be restricted to certain set of investors
and other 50% felt that options trading should not be restricted to any
investors. This could be analysed in light of the recent trading pattern where
in FY 2011-12, 72% of the trading volume is attributed to the Index options
trading and around 3% trading has taken place in Stock Options. Thus,
options trading accounted for almost 75% of the total market volume during
the FY2011-12. This also means a generation of revenue for the brokers. In

308
the event any set of clients are restricted, it would also affect the income of
the brokers. This could be one of the reasons to explain the outcome. There
are also few brokers who service mainly institutional clients and may not
get affected by any guideline in this regard. However, keeping in mind the
risk that is involved in selling the option for the small investor or who have
got very low risk appetite, it would be prudent to introduce such a
restriction which may get extended to sell side only.
The researcher also tried to find out whether the above suggestion
given is enforceable since the brokers are required to know the risk appetite
of the clients through client profiling, if the suggestion is to be implemented.
Thus, question was asked on whether the brokers currently carry out any
profiling of their clients before allowing them to trade in the equity
derivatives. The outcome of the responses to the questionnaire is as follows:
Table 7.6b
Client profiling is carried out before allowing any clients to trade
in equity derivatives
Responses Response Percent Response Count
YES 83.8% 67
NO 16.3% 13
Total Responses 80
Source: Questionnaire
The response received from the respondents as tabulated above is
also presented in the Pie chart below:
Chart 7.6b
Client profiling is carried out before allowing any clients to trade in equity
derivatives
Source: Questionnaire

309
As can be seen from the above table and chart, the client profiling is
carried out of the client by almost 83.8% of the respondents. It is only
16.3% of the respondents do not carry out any such client profiling, some of
these are dealing with only the institutional clients hence does not require to
carry out any client profiling for them. Hence, it can be concluded that
almost all of the brokers are already carrying out the client profiling of
clients to understand the client’s risk appetite and to understand the
suitability of the products offered to them.
7. The product preferred by the clients of the brokers:
Even though, it has been tried to find out from the investors directly,
an attempt was made to find out from the brokers the most preferred
product of their clients. It was found out that in line with the trading pattern
exhibited on the exchange platform the most preferred product by the client
is Index Options. The results of the responses to the questionnaire have
been tabulated below:
Table 7.7
The most preferred type of product used by clients in
Equity Derivatives
Answer Options Response Percent Response Count
Index Futures 22.5% 18
Index Options 63.8% 51
Stock Futures 10.0% 8
Stock Options 3.8% 3
Total Responses 80
Source: Questionnaire
The response received from the respondents as tabulated above is
also presented in the Pie chart below:
Chart 7.7
The most preferred type of product used by clients in Equity Derivatives
Source: Questionnaire

310
As can be seen from the above table and chart, the respondents
mentioned that 63.8% of the clients prefer index options, followed by
22.5% of the clients preferring index futures, then 10% of the clients
preferring stock futures and lastly 3.8% clients preferring stock options.
Thus, respondents mentioned that the most preferred by their clients are
Index Options, followed by Index Futures, then Stock Futures and lastly the
Stock Options.
8. Type of trading activity for which equity derivatives products used by
investors:
There are various types of activities for which the product can be
used such as for speculation, hedging and arbitrage activities. The
researcher tried to understand the type of activities from the brokers for
which the derivatives products are used by the investors. The outcome of
the responses to the questionnaire is tabulated below:
Table 7.8
Type of trading activity for which equity derivatives
products used by investors
Responses Response Percent Response Count
Hedging 73.8% 59
Speculation 91.3% 73
Arbitrage 42.5% 34
Total Responses 80
Source: Questionnaire
The response received from the respondents as tabulated above is
also presented in the Column Chart below:
Chart 7.8
Type of trading activity for which equity derivatives products used by investors
Source: Questionnaire

311
As can be seen from the above table and chart, most of the investors
prefer all kinds of trading activity at different points of time. Outcome
shows that 91% of the investors carry out the trading activity of speculative
nature, followed by hedging activity which is also carried out by 74%
investors and then the arbitrage activity which is carried out by 42% of the
investors at some point of the time or other.
9. Various strategies used for Equity Derivatives Trading by investors:
There are many strategies that can be used in the equity derivatives
market depending upon the market scenario, risk appetite of the investor
and the outlook on the future of the market. The researcher tried to find out
from the brokers which are the strategies that are normally used by the
clients of the brokers at various points of time. The outcome of the
responses to the questionnaire is as follows:
Table 7.9
Various strategies used for equity derivatives trading by
investors
Responses Response Percent Response Count
Straddle 23.8% 19
Strangle 18.8% 15
Protective put buying 3.8% 3
Protective call buying 3.8% 3
Covered call writing 20.0% 16
Collar 1.3% 1
Covered put writing 12.5% 10
Reverse Collar 1.3% 1
Butterfly Spread 13.8% 11
Condor 5.0% 4
Strip 0.0% 0
Strap 0.0% 0
None of the strategy used 17.5% 14
Almost all the strategies
used at some point 56.3% 45
Other (please specify) 4
Total Responses 80 Source: Questionnaire
The response received from the respondents as tabulated above is
also presented in the Column Chart below:

312
Chart 7.9
Various strategies used for equity derivatives trading by investors
Source: Questionnaire
As can be seen from the above, the respondents have indicated that
56.3% of the times clients use almost all these strategies at some point or
the other. There are 17.5% of the respondents who are of the opinion that
the clients do not use any strategy but merely trade in the market. This can
be for the intraday speculation in the derivatives product. As per
respondents, the other strategies used were straddle by 23.8% times by
clients, covered call writing by 20% times by clients, strangle by 18.8%
times by clients, butterfly spread by 13.8% times by clients, covered put
writing by 12.5% times by clients and remaining various other strategies by
less than 5% times by clients. This indicates that there are large number of
investors who are now familiar with of the equity derivatives market and
products and are also familiar with the various strategies that can be applied
while trading in the equity derivatives market.
10. Need for reduction in contract size for stock and index derivatives
contracts to get larger participation
The contract size since the beginning of the equity derivatives
trading in India was standardized at the value of Rs. 2 lacs. Subsequently, in
December 2007 the mini contracts only on the stock indexes with the
contract size value of reduced to Rs. 1 lac were allowed by SEBI. However,

313
these mini contracts now have been banned by SEBI since November 30,
2012. Thus, it was felt necessary to understand from the brokers whether
there is any need to revisit the contract size now after the market has been
matured for over a decade. The results of the responses received for this
question are tabulated below:
Table 7.10a
Need for reduction in contract size for stock and index
derivatives contracts
Responses Response Percent Response Count
YES 50.0% 40
NO 50.0% 40
Total Responses 80
Source: Questionnaire
The response received from the respondents as tabulated above is
also presented in the Pie chart below:
Chart 7.10a
Need for reduction in contract size for stock and index derivatives contracts
Source: Questionnaire
It was surprising to see that the broker’s opinion on whether the
contract size value should be reduced has been equally divided in the ratio
of 50:50. Further, in order to understand the contract size value that would
be found appropriate by the brokers, the brokers were asked to indicate the
contract size value considered to be suitable by them.
These respondents who had indicated that they preferred reduction
in the contract size indicated various options below Rs. 2 lacs of values and
other indicated more than Rs. 2 lacs of value options. The results from the
respondents were as follows:

314
Table 7.10b
Contract size (in terms of contracts value) appropriate for derivatives
contracts
Responses Response Percent Response Count
Upto Rs. 10,000/- 1.3% 1
Rs. 10,001/- to Rs. 50,000/- 5.0% 4
Rs. 50,001/- to Rs. 1,00,000/- 20.0% 16
Rs. 1,00,001/- to Rs. 2,00,000/- 28.8% 23
Rs. 2,00,001/- to Rs. 4,00,000/- 40.0% 32
Above Rs. 4,00,001/- 5.0% 4
Total Responses 80
Source: Questionnaire
The response received from the respondents as tabulated above is
also presented in the Pie chart below:
Chart 7.10b
Contract size (in terms of contracts value) appropriate for derivatives contracts
Source: Questionnaire
It is very interesting to see that 50% of total respondents felt that
there was no need to reduce the contract size value to attract more
participation in the equity derivatives trading. They felt that the contract
size of Rs. 2 lacs to Rs. 4 lacs would be appropriate. Further, those who felt
that there should be reduction in the contract size value, 57% of them felt
that the contract size should be between Rs. 1 lac to Rs. 2 lacs, 32% of them
felt that the contract size should be between Rs, 50,000/- to Rs. 1 lac.
Thus, if this outcome is seen in combination with the outcome of the
responses to the questionnaire of the investor, there is strong urge felt from
the investor to reduce the size of the contract value to increase participation
in the equity derivatives market from the retail investors.

315
11. Derivatives Exchanges to start physical delivery settlement for equity
derivatives
SEBI vide its circular dated July 15, 2010 allowed the stock
exchanges to start the physical delivery settlement in the equity derivatives
subject to certain conditions laid down by the regulator. BSE started the
physical delivery settlement in February 2011, however in the absence of
any liquidity on the exchange, this product did not click. However, NSE did
not start this product on the exchange platform. Thus, the need was felt by
the researcher to ask the brokers whether NSE starting this product on its
exchange platform could make this product successful and get further
participation from the investors. The outcome of the responses to the
questionnaire is as follows:
Table 7.11
Both the Indian Derivatives Exchanges should start the
physical delivery settlement for equity derivatives
Responses Response Percent Response Count
YES 71.3% 57
NO 28.8% 23
Total Responses 80
Source: Questionnaire
The response received from the respondents as tabulated above is
also presented in the Pie chart below:
Chart 7.11
Both the Indian Derivatives Exchanges should start the physical delivery
settlement for equity derivatives
Source: Questionnaire

316
It can be seen from the above table and the chart that 71.3% of the
respondents feel that both the Indian Derivatives Exchanges should start the
physical delivery derivatives contacts in the Indian market whereas only
28.8% respondents feel that the status quo may be maintained and even
when the exchanges start the physical delivery derivatives contracts on both
the exchanges there may not be many participants who would participate.
12. Efficiency of Current margining system to use the capital of the
brokers
There is considered to be stringent requirement of the capital on the
exchanges. The structure for the equity derivatives market is such that the
Clearing members are required to place adequate capital with the clearing
corporation to enjoy uninterrupted trading access and activity. If the capital
with exchange is short and not made good in time, the exchange may
deactivate such clearing members from further placing/receiving fresh order
and would put the clearing members in the square off mode. Thus, in order
to avoid such situation it is not only the excess capital infusion is necessary,
but it is necessary to understand from the brokers whether the capital placed
by them with the Exchange or the Clearing Corporation is efficiently and
effectively used. The outcome of responses to the questionnaire is as
follows:
Table 7.12
Current margining system is appropriate and it efficiently
uses the capital of brokers
Responses Response Percent Response Count
YES 88.8% 71
NO 11.3% 9
Total Responses 80
Source: Questionnaire
The response received from the respondents as tabulated above is
also presented in the Pie chart below:

317
Chart 7.12
Current margining system is appropriate and it efficiently uses the
capital of brokers
Source: Questionnaire
As can be seen from the above table and the chart, 88.8%
respondents feel that the current margining system effectively uses the
capital deployed by the brokers. It is only 11.3% respondents who feel that
their capital deployed is not effectively used in the current margining
system. There was also one of the suggestions which came from the
respondent that the clearing corporation may consider passing on the
interest earned on the cash deposited with them by the brokers in order to
make the best use of the capital deployed by them. Thus, exchanges may
evaluate this suggestion considering the rules, regulations and bye-laws of
the exchange and the other regulatory guidelines.
13. Adequacy/excessiveness of margins levied in Indian Equity Derivatives
Market
Today, exchanges and clearing corporations collect various types of
margins such as initial margin, premium margin, assignment margins, and
exposure margins from the brokers for the trading activity carried out in the
equity derivates market. It was thus felt necessary by the researcher to
understand from the brokers whether they feel the pinch of margins and
they feel that the margins levied by the exchanges are excessive. The
outcome of the responses to the questionnaire has been tabulated below:
Table 7.13
Margins levied today in Indian Equity Derivatives Market
are excessive
Responses Response Percent Response Count
YES 68.8% 55
NO 31.3% 25
Total Responses 80
Source: Questionnaire

318
The response received from the respondents as tabulated above is
also presented in the Pie chart below:
Chart 7.13
Margins levied today in Indian Equity Derivatives Market are excessive
Source: Questionnaire
It can be seen from the above table and chart that almost 68.8%
respondents feel that the margins charged by the exchanges are excessive
whereas 31.3% of the respondents feel that the margins charged are
appropriate and not excessive. Margins are primary for the risk
management and to ensure smooth functioning of the equity derivatives
market without any default by the brokers and their clients. In light of the
feeling of the market participants, the regulatory body may evaluate
reducing the margin requirements wherever possible by further extending
the benefit of cross margining across exchanges under the same broker or
cross margining benefits for additional products. However, the regulator has
to take a balanced approach and has to also ensure that the collection of
margin is adequate to ensure that there are no defaults on the exchanges and
it does not cause any systemic risk.
14. Strength of the existing risk management system adopted by the
Exchanges
An incident happened on October 05, 2012 when the S&P Nifty, the
benchmark index of NSE, plunged by 900 points, or 16 per cent, within two
minutes at around 9.49 am. The crash wiped out almost over Rs 3 lakh
crores ($58 billion) which was caused by a mere Rs 650 crores sell order by
one of the broker Emkay Global Financial Services.

319
As understood from the news reports, it was a single order that
placed 59 trades at a significantly lower price which pulled down the index
from 5,773 to 4,888. Nifty finally closed at 5,747 on that day after the
market recovery took place when the news of freak trade spread cooling off
the market. The news article further states that the broker wanted to place a
basket sell order for Rs 65 crores for an institutional client but punched in
an order worth Rs 650 crores by error.
As per the existing index filters, the trading on the exchanges should
be halted for an hour if there is a fall of 10% in the Nifty or Sensex before
1.00 pm and for 30 minutes if the limit is breached between 1 pm and 2:30
pm. These norms are similar if indices rise or fall by 15 per cent and 20 per
cent. Thus, in the above instance even when there was fall of 16% before
1.00 pm, NSE halted trades for less than 15 minutes from 9.51 am and
resumed trading at 10:04 am. Besides this, there also should have been
market halt at 10% fall in the index which did not happen till index fell by
16%. Even though, there was no monetary distress caused to the exchange
or there were no defaults, this freak trade has raised the eyebrows on the
shallow depth of the market and the flaws in risk management system.
Thus, it was felt necessary by the researcher to ask the brokers their opinion
on the strength of the risk management system adopted by the exchange.
The outcome of responses to the questionnaire is as follows:
Table 7.14
Strength of the existing risk management system adopted by the
Exchanges
Responses Response Percent Response Count
Excellent 13.8% 11
Strong 66.3% 53
Medium Strong 18.8% 15
Weak 1.3% 1
Very Weak 0.0% 0
Total Responses 80
Source: Questionnaire
The response received from the respondents as tabulated above is
also presented in the Pie chart below:

320
Chart 7.14
Strength of the existing risk management system adopted by the Exchanges
Source: Questionnaire
As can be seen from the above table and the chart, 13.8%
respondents feel that the risk management system adopted by the exchanges
is excellent, 66.3% respondents feel that the risk management system
adopted by the exchanges is strong, and 18.8% feel the same is medium
strong. Thus, largely the respondents feel that the risk management system
adopted by the exchanges is adequate. However, the recent incident pointed
out above where Nifty plunged by almost 16% within two minutes and still
the index filters did not get triggered thereby halting the market nor was
broker’s terminal who placed the orders got deactivated in time revealed
that there are still few gaps in the system and the risk management system
needs to be made robust. The regulatory body and the exchanges need to
take some concrete steps to plug all such loopholes to ensure that the
trading system and the risk management system are strong and robust to
avoid recurrence of such events in future.
15. Risk of the most concern in the equity derivative market to clients /
brokers:
As discussed earlier in the chapters, there are various risks that are
embedded while trading in the equity derivatives segment. They are mainly
Systemic risk, Market risk or Price risk or Potential Loss risk, Settlement
risk, Credit risk or Counterparty Default risk, Liquidity risk, Operational
risk and Legal risk. The researcher hence felt necessary to understand from
the brokers which are the risk that is of their prime concern while trading in

321
the equity derivatives market today. The outcome of responses to the
questionnaire has been tabulated below:
Table 7.15
Type of Risk of most concern in the equity derivative market for
brokers
Responses Response
Percent
Response
Count
Systemic risk 37.5% 30
Market Risk/Price Risk/Potential Loss Risk 41.3% 33
Settlement risk 1.3% 1
Credit Risk/Counterparty Default risk 1.3% 1
Liquidity Risk 8.8% 7
Operational Risk 10.0% 8
Legal Risk 0.0% 0
Total Responses 80
Source: Questionnaire
The response received from the respondents as tabulated above is
also presented in the Pie chart below:
Chart 7.15
Type of Risk of most concern in the equity derivative market for brokers
Source: Questionnaire
As can be seen from the above table, the respondents today are more
concerned about Market Risk/Price Risk/Potential Loss Risk which
accounts as a concern of almost 41.3% respondents, followed by Systemic
Risk which accounts as a concern of almost 37.5% respondents and then the
Operational Risk which accounts as a concern of almost 10% respondents.
The other risks such as settlement risk, credit risk/counterparty default risk
and operational risk account for 11.4% respondents. There has not been any
concern on the Legal Risk by any respondents. This is due to the fact that

322
all the contracts are now standardized and structured as per guidelines of the
regulatory body, thereby leaving no scope for the legal risk.
16. Revisit to the criteria for inclusion of the stocks in the equity
derivatives market:
SEBI has laid down the criteria for inclusion of stocks in the equity
market derivatives and the same has been modified from time to ensure the
sanctity of the market. At the time of introduction of the equity derivatives
on the single stocks in 2001-02, there were 31 stocks included in the list.
Slowly and steadily as the regulatory body and the exchanges drew comfort
from the market functioning, the number of stocks in the equity derivatives
list went on increasing 265 in 2007-08 and has now again come down to
151 stocks. Thus, it was felt necessary to understand from the market
participants that whether the criteria adopted today for inclusion of the
stocks is appropriate to maintain the same list of stocks or the same should
be made further stringent to reduce the stocks in the list or should be
relaxed to increase the number of stocks in the list on which equity
derivatives are traded. The outcome of responses to the questionnaire was
as follows:
Table 7.16
The criteria for inclusion of the stocks in the equity derivatives
market
Responses Response
Percent
Response
Count
Be diluted to include more number of stocks 55.0% 44
Be made stricter to reduce number of stocks 22.5% 18
Remain as it is (the current universe of stocks is ok) 22.5% 18
Total Responses 80
Source: Questionnaire
The response received from the respondents as tabulated above is
also presented in the Pie chart below:

323
Chart 7.16
The criteria for inclusion of the stocks in the equity derivatives market
Source: Questionnaire
As can be seen from the above table and the chart, there are 55%
respondents who feel that the criteria for selection/inclusion of the stocks in
the equity derivatives market should be relaxed and more number of stocks
should be included. Also, 22.5% of the respondents felt that the criteria
should be stringent and the number of stocks currently covered under the
equity derivatives coverage should be reduced further, whereas the same
22.5% of respondents felt that the criteria adopted today is good and it
should remain same, at the same time retaining the similar number of stock
universe being covered under the equity derivatives market. Thus, it is felt
that the SEBI and the Exchanges may revisit the criteria adopted today for
selection/inclusion of the stocks in the equity derivatives market to include
few more stocks in the list to provide additional stock contracts to trade to
the market participants.
17. Readiness of market for other complex products in derivatives:
It has now been more than a decade since equity derivatives have
been launched in the Indian markets and there are still limited products on
the stock exchanges available for trading to the investors. The respondents
were also asked whether the time is ripe introduce other complex products
such as exotic derivatives, ETF derivatives, interest rate options and the
structured products etc. the outcome of responses to the questionnaire is as
follows:
324
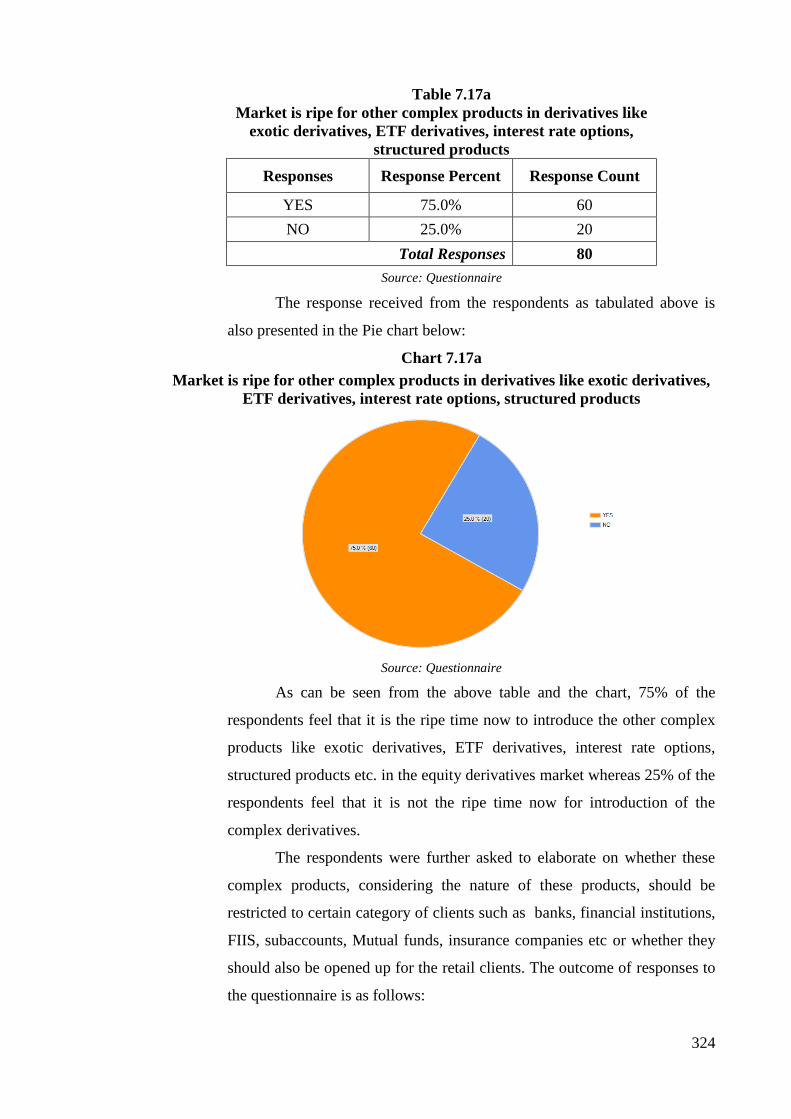
Table 7.17a
Market is ripe for other complex products in derivatives like
exotic derivatives, ETF derivatives, interest rate options,
structured products
Responses Response Percent Response Count
YES 75.0% 60
NO 25.0% 20
Total Responses 80
Source: Questionnaire
The response received from the respondents as tabulated above is
also presented in the Pie chart below:
Chart 7.17a
Market is ripe for other complex products in derivatives like exotic derivatives,
ETF derivatives, interest rate options, structured products
Source: Questionnaire
As can be seen from the above table and the chart, 75% of the
respondents feel that it is the ripe time now to introduce the other complex
products like exotic derivatives, ETF derivatives, interest rate options,
structured products etc. in the equity derivatives market whereas 25% of the
respondents feel that it is not the ripe time now for introduction of the
complex derivatives.
The respondents were further asked to elaborate on whether these
complex products, considering the nature of these products, should be
restricted to certain category of clients such as banks, financial institutions,
FIIS, subaccounts, Mutual funds, insurance companies etc or whether they
should also be opened up for the retail clients. The outcome of responses to
the questionnaire is as follows:

325
Table 7.17b
Complex products be opened for institutional players and not
to retail clients
Responses Response Percent Response Count
YES 85.0% 68
NO 15.0% 12
Total Responses 80
Source: Questionnaire
The response received from the respondents as tabulated above is
also presented in the Pie chart below:
Chart 7.17b
Complex products be opened for institutional players and not to retail clients
Source: Questionnaire
It can be seen from the above table and the chart that almost 85% of
the respondents feel that these complex products should be restricted to
only banks, financial institutions, FIIs, Sub-accounts, Mutual Funds,
Insurance companies etc. It was only 15% of the respondents felt that these
products also should be extended to retail clients as well. Thus, since many
respondents feel that it is ripe time to introduce the other complex products
like exotic derivatives, ETF derivatives, interest rate options, structured
products etc. in the equity derivatives market, the Regulatory body and the
exchanges may like to consider introducing these complex products in the
market restricting them to only the category of investors like banks,
financial institutions, FIIs, Sub-accounts, Mutual Funds, Insurance
companies etc and not to the retail investors.

326
18. Opinion on Possible Export of Equity Derivatives Market to Offshore
happening:
The news items about the Open Interest in NIFTY futures on SGX
have taken over the NSE’s Nifty futures Open Interest figures which started
surfacing since January 2012. As pointed out in the earlier chapter, there
has been concern on the export of turnover happening to the offshore
exchanges mainly SGX. In light of this development, the brokers were
asked to give their views on this transition seen is across the globe. One of
the factors highlighted here was higher transaction cost as one of the big
factor in such a shift in the NIFTY Index Futures happening from NSE to
SGX. The broker’s opinion was sought to understand whether development
of such export of volumes and trading to the offshore exchanges is due to
higher transaction cost. The outcome of responses to the questionnaire is
tabulated below:
Table 7.18
Higher transaction costs in India transferring trading in
NIFTY Index Futures to SGX
Responses Response Percent Response Count
YES 93.8% 75
NO 6.3% 5
Total Responses 80
Source: Questionnaire
The response received from the respondents is also presented in the
Pie chart below:
Chart 7.18
Higher transaction costs in India transferring trading in NIFTY
Index Futures to SGX
Source: Questionnaire

327
As can be seen from responses to the questionnaire, a whopping
93.8% of the respondents feel that the export of volume and trading activity
to the offshore exchange mainly SGX can be attributed to higher transaction
costs in India compared to those in the offshore markets. Hence, the
government really needs to take the note of the concerns of the market and
work towards reducing transaction cost. The earlier analysis has revealed
that the major part of the transaction cost is the Securities Transaction Tax.
Hence, the Government really needs to work towards easing the burden to
ensure that the equity derivatives market remains onshore.
19. Acceptance of direct pledge from big clients by Clearing Corporations
The researcher while interacting with various brokers had got the
feedback that current collateral pledge and placing process with the
Clearing Corporation is only available to the Clearing Members and Self
Clearing Members at large. The Clients have to place the collaterals with
the Trading Members who in turn, if possible, place such collateral with the
Clearing Members and Clearing Members then if possible places these
collaterals with the Clearing Corporation. Some of the collaterals accepted
by the Trading Members and Clearing Members are also not possible to be
placed further with the Clearing Members and Clearing Corporations
respectively such as Bank Guarantees and Fixed Deposits obtained from the
clients and Trading Members discharged or lien marked in favour of
Trading Members and Clearing Members respectively. This kicks in the
need for capital requirement by the TMs and CMs separately to grant such
clients/TMs the exposures. Thus, it was felt by the researcher to get the
opinion of various other brokers on the thought of an idea of Custodial
Participants and Big clients bringing in collateral of more than Rs. 1 crore
should be directly allowed to place such collateral with the
Exchange/Clearing Corporation. The outcome of responses to the
questionnaire is tabulated below:
Table 7.19
Collateral be permitted to be directly pledged with the Clearing
Corporations
Responses Response Percent Response Count
YES 87.5% 70
NO 12.5% 10
Total Responses 80
Source: Questionnaire

328
The response received from the respondents as tabulated above is
also presented in the Pie chart below:
Chart 7.19
Collateral be permitted to be directly pledged with the Clearing Corporations
Source: Questionnaire
As can be seen from the above table and the chart, 87.5%
respondents are of the opinion that the custodial participants and big clients
bringing in collateral of more than Rs. 1 crore should be permitted to
directly pledge the collateral with the clearing Corporation. This appears to
be giving the brokers a huge relief in utilization of their capital and their
funds which may accordingly get freed to make use for further trading
activity or any other such use. Thus, it is felt that the Exchange and the
regulators may look at this option depending upon the comfort drawn by the
Exchanges and also the feasibility of the structure that is conducive to the
market. It may decide on the amount which may be Rs. 1 crore or Rs. 5
crores or Rs. 10 crores or whatever the Exchange and the Clearing
Corporation draws comfort with for the best utilization of the collateral.
20. Need to shift to the Principle based regulation from the Rule based
regulation
It has been tendency of the market to complain about the regulators
being very strict and does not act taking into consideration the practical
aspect of implementation of the directives issued to the exchanges and the
participants.
There is a long standing debate about the relative merits of rule-
based versus principle-based regulatory systems. Rule-based regulation
prescribes in detail how to behave. For example, the limit on the Pune-

329
Mumbai Expressway is 80 Km/hour. In principle-based regulation norms
are formulated as guidelines. The exact implementation is left to the subject
of the norm. For example, in the above instance drive responsibly as high
speed driving causes accident.
One of the strongest criticisms against the SEBI is that it adopts rule
based regulations. There is plethora of rules that the intermediaries in the
system are required to adhere. This is considered to inhibit risk taking and
innovation. Principle based regulation points to the success that the
Financial Service Authority (FSA) has had in UK. It is said that FSA
intervenes only if a situation warrants such intervention, say, if certain
undesirable outcomes have resulted. Thus, it was felt necessary to
understand from the brokers whether there is a need for the regulator to
shift from rule based regulation to principle based regulation. The outcome
of responses to the questionnaire has been tabulated below:
Table 7.20
Need to shift to the principle based regulation from the rule
based regulation
Responses Response Percent Response Count
YES 70.0% 56
NO 30.0% 24
Total Responses 80
Source: Questionnaire
The response received from the respondents as tabulated above is
also presented in the Pie chart below:
Chart 7.20
Need to shift to the principle based regulation from the rule based regulation
Source: Questionnaire
As can be seen from the above results and the pie chart, almost 70%
respondents feel that there is a need for the regulatory body to shift from the

330
rule based regulation to principle based regulations. The market has now
evolved over a period of time into a matured market where financial
products such as securities, derivatives and other such financial products are
effectively fungible. Also, the brokers, banks and other such intermediaries
operate as group companies offering most of the financial market services.
Application of too many specific rules will only allow the bad apples to
escape effective regulation. The implementation of the rules may happen
only on paper whereas the implementation may not happen in the spirit.
Thus, it is felt that understanding the need of the hour and the sentiment of
the respondents for the change required in the approach by the regulators,
the regulatory body may adopt the principle based regulatory approach than
the existing rule based regulatory approach.
21. Allowing Over The Counter (OTC) derivatives in India like global
markets:
Over-the-counter (OTC) derivatives are private contracts negotiated
between parties. The main advantage of OTC derivatives markets is that it
gives unlimited flexibility in contract design. The underlying asset can be
anything, the size of the contract can be any amount, and the delivery can
be made at any time and at any location. The only requirement of an OTC
contract is a willing buyer and seller. There are also disadvantages of OTC
markets such as willing buyers and sellers are required to spend time in identifying
each other, there is credit risk involved etc. Some of the examples of OTC
products are Exotics, Swaps, and Forward Rate Agreements etc. Thus, it was felt
necessary to understand from the markets that whether now market has
matured enough to accept that there should be OTC derivatives in the Indian
Markets. The outcome of responses to the questionnaire is as follows:
Table 7.21
Allowing Over The Counter (OTC) derivatives in the Indian
markets
Responses Response Percent Response Count
YES 51.3% 41
NO 48.8% 39
Total Responses 80
Source: Questionnaire

331
The response received from the respondents as tabulated above is
also presented in the Pie chart below:
Chart 7.21
Allowing Over The Counter (OTC) derivatives in the Indian markets
Source: Questionnaire
It can be seen from the responses received from the respondents that
the opinion on allowing Over-The-Counter derivatives in India is divided.
Almost, 51.3% respondents feel that the OTC derivatives should be allowed in
India whereas 48.8% of the respondents feel that the same should not be
allowed in India. Since, the opinion of the respondents is divided, it is felt that
the regulators may form its view after analysis the pros and cons of allowing
OTC derivatives in India. It may also be noted that the WFE report states that
OTC market is a very big market in EAME region.
7.3 Investor’s Questionnaire and Analysis of the Data:
There are lacs of investors who trade everyday in the equity markets and
many of them also in the equity derivatives market. The actual figure of number
of client is also not possible to be arrived at since this data is not published
anywhere. Further, the clients can trade through multiple brokers and hence
they have multiple client codes at the exchange level. Hence, even with the data
of clients from the brokers, it would be difficult to identify the unique clients.
The primary information from the investors was collected through the
questionnaire which was circulated from the online mode, through the
interviews and meetings. It was circulated to the individuals at large. The
questionnaire could reach large number of investors online and they answered
to all the questions patiently. Largely the data could be gathered through online
mode by collecting the responses to the questionnaire across nation. The

332
questionnaire was designed to understand personal profile of the investor such
as age, gender, place of residence, education, experience in derivatives market,
category of investor, income range, occupation details etc. The questionnaire
further focused on seeking other equity derivatives market related information
like derivatives training undertaken, the need for the same, where does investor
invest, preference of equity derivative product for investment and periodicity of
contracts, purpose of trading and any strategies adopted for the same, opinion
on contract size, what kind of risk is of his concern, what does investor think of
growth of equity derivatives market in India, margins levied, need for wide
basket of products etc.
The questionnaire was circulated online to gather the responses from the
investors in the equity derivatives segment. The respondents were selected by
adopting random sampling technique. There were as many as 6617 responses
received to the questionnaire. The same were analyzed as below to arrive at the
result of the questionnaire. The results to the questions asked have been
analyzed below:
1. Sample investor population on the basis of the gender:
The investors were asked to disclose their gender in order to analyse
which gender has more number of investors in the equity derivatives market
and if any other conclusion could be drawn out of the same. The table
representing the division of sample population on the basis of gender of the
investors is given below:
Table 7.22
Gender of Investor Respondents
Answer Options Response Percent Response Count
Male 87.9% 5817
Female 12.1% 800
Total Responses 6617
Source: Questionnaire
The response received from the respondents as tabulated above is
also presented in the Pie chart below:

333
Chart 7.22
Gender of Investor Respondents
Source: Questionnaire
As can be seen from the above table and chart, out of the total 6617
responses received for the questionnaire, 87.9% of the sample population
was Male population and 12.1% of the sample population was Female
population thereby denoting that a large number of investors are male in the
equity derivatives market. This may be due to large working and earning
population is male who also make investment decisions on their own.
2. Sample investor population on the basis of the Age:
The researcher further tried to find out the age group of the investors
in the equity derivatives market. The table representing the division of
sample population on the basis of age of the investors is given below:
Table 7.23
Age of Investor Respondents
Responses Response Percent Response Count
18 - 25 Years 15.0% 995
26 - 35 Years 64.1% 4241
36 - 45 Years 6.1% 401
46 - 55 Years 9.8% 650
55 - 65 Years 4.5% 301
Above 65 Years 0.4% 29
Total Respondents 6617
Source: Questionnaire
The response received from the respondents as tabulated above is
also presented in the Pie chart below:

334
Chart 7.23
Age of Investor Respondents
Source: Questionnaire
As we can see from the above table and Pie Chart, there is a large
population of respondents falling in the Age group of 26-35 accounting for
64.1%, followed by respondents falling in the Age group of 18-25
accounting for 15.0% of the total sample population, followed by
respondents falling in the Age group of 46-55 accounting for 9.8% of the
total sample population, then the respondents falling in the Age group of
36-45 accounting for 6.1% of the total sample population, then the
respondents falling in the Age group of 55-65 accounting for 4.5% of the
total sample population and respondents falling in the Age group of above
65 years accounted for merely 0.4% of the total sample population.
3. Sample investor population on the basis of the State of Residence:
The investors in the equity derivatives market in India are located in
nook and corner of the country. Thus, the data was gathered through the
questionnaire online to get the maximum diversified responses from all over
India. The responses received were then classified into various buckets of
the States. The same has been tabulated below in the table:

335
Table 7.24
Break up of Respondents based on State/Union Territory/Country of
Residence
Sr. No. State/Union Territory /
Country of Residence
No. of
Respondents %
1 Andhra Pradesh 819 12.38%
2 Assam 19 0.29%
3 Bihar 71 1.07%
4 Chandigarh 115 1.74%
5 Chhattisgarh 17 0.26%
6 Dadra Nagar Haveli 3 0.05%
7 Delhi 541 8.18%
8 Goa 9 0.14%
9 Gujarat 252 3.81%
10 Haryana 220 3.32%
11 Himachal Pradesh 32 0.48%
12 Jammu and Kashmir 6 0.09%
13 Jharkhand 52 0.79%
14 Karnataka 396 5.98%
15 Kerala 28 0.42%
16 Madhya Pradesh 250 3.78%
17 Maharashtra 1869 28.25%
18 Nagaland 4 0.06%
19 Orissa 68 1.03%
20 Pondicherry 4 0.06%
21 Punjab 173 2.61%
22 Rajasthan 350 5.29%
23 Sikkim 16 0.24%
24 Tamil Nadu 448 6.77%
25 Tripura 3 0.05%
26 Uttar Pradesh 436 6.59%
27 Uttaranchal 25 0.38%
28 West Bengal 389 5.88%
29 Outside India 2 0.03%
Total 6617 100.00%
Source: Questionnaire
The response received from the respondents as tabulated above is
also presented in the Bar chart below:

336
Chart 7.24
State/Union Territory/Country of Residence wise Break up of Respondents
Source: Questionnaire
As can be seen from the above table and bar chart from the
responses received to the questionnaire, almost 28.25% of respondents are
from Maharashtra, 12.38% of respondents are from Andhra Pradesh,
8.18% of respondents are from Delhi, 6.77% of respondents are from Tamil
Nadu, 6.59% of respondents are from Uttar Pradesh, 5.88% of respondents
are from West Bengal, 5.29% of respondents are from Rajasthan, 5.98% of
respondents are from Karnataka, 3.78% of respondents are from Madhya
Pradesh, 3.32% of respondents are from Haryana, 3.81% of respondents
are from Gujarat, 2.61% of respondents are from Punjab, 1.74% of
respondents are from Chandigarh, 1.07% of respondents are from Bihar,
1.03% of respondents are from Orissa and from other states and union
territories the respondents are less than 1%.
4. Sample investor population on the basis of Education:
Since, equity derivatives market is considered to be sophisticated,
the investors were asked their education background to understand the level

337
of education taken by the investors. The responses received to the
questionnaire have been tabulated below:
Table 7.25
Highest Education Obtained by the Respondents
Responses Response Percent Response Count
10th Std 0.1% 4
12th std 1.3% 84
Graduate 70.0% 4634
Post graduate 28.5% 1884
Doctorate 0.2% 11
Other (please specify) 141
Total Respondents 6617
Source: Questionnaire
The representation of the responses received to the questionnaire is
represented in the pie chart form as given below:
Chart 7.25
Highest Education Obtained by the Respondents
Source: Questionnaire
As we can see from the above Pie Chart, there is large population of
investors who are Graduates accounting for 70.0% of the total sample
population, followed by Post Graduates accounting for 28.5% of the total
sample population. There were also few Doctorates accounting for 0.2% of
the total sample population and there were 1.4% undergraduates. Thus, it
may be noted that a large number of respondents were well educated i.e.
almost 98.7% of the population were above graduate level.
5. Sample investor population on the basis of experience in the equity
derivatives market:
The equity derivatives market in India has now been more than a
decade old. It is necessary to know the experience of the investors

338
responding to the questionnaire. Out of the total 6617 respondents, the
investors had varied experience in the equity derivatives market. These
were bucketed accordingly in various buckets depending on the number of
years of experience i.e. upto 1 years of experience, 1-2 years of experience,
2-5 years of experience, 5-10 years of experience, and above 10 years of
experience in the equity derivatives markets. The outcome of responses to
the questionnaire has been tabulated in the table below:
Table 7.26
Experience in Equity Derivatives Market of the Respondents
Responses Response
Percent
Response
Count
Zero days to 1 Year 13.9% 917
More than 1 Year but less than 2 Years 20.7% 1373
More than 2 Years but less than 5 Years 51.9% 3434
More than 5 years but less than 10 Years 13.4% 887
More than 10 Years 0.1% 6
Total Respondents 6617
Source: Questionnaire
The pie chart representation of the division of sample population on
the basis of experience of the investors is given below:
Chart 7.26
Experience in Equity Derivatives Market of the Respondents
Source: Questionnaire
As we can see from the above Pie Chart, there is large population of
investors who are having good experience of trading in the equity
derivatives market. Almost 51.9% of the total respondents have experience
of more than 2 years but less than 5 years of trading in equity derivatives,
20.7% of the total respondents had an experience of 1-2 years, 13.9% have

339
2-5 years of experience, 13.4% of population has 5-10 years of experience
and 0.1% of population have above 10 years of experience of the total
sample population. Hence, as can be seen the population of the respondents
was fairly diversified.
6. Sample investor population on the basis of category of investor:
The investors are normally categorized into retail, High Net-worth
Individuals (HNIs), Non Residential Indians (NRIs), Corporate Bodies
(Private Limited Company, Limited Company etc), Mutual Funds, Banks
and Other Financial Institutions (MFs, Banks and Other FIs), Foreign
Institutions (Foreign Institutional Investors, Sub-accounts and Overseas
Corporate Bodies). The researcher tried to find out from the respondents the
type of investors chosen as a sample. The breakup of the same is provided
below in the table:
Table 7.27
Population on the Basis of Category of Investor
Responses Response
Percent
Response
Count
Retail 97.3% 6441
High Net-worth Individual (HNI) 2.5% 163
NRIs 0.0% 1
Indian Corporates (Pvt Ltd Co, Ltd Co etc) 0.1% 4
Foreign Institutions (FII, Sub-Account, OCBs) 0.0% 1
MFs, Banks, Insurance Companies, Other
Financial Institutions 0.1% 7
Total Respondents 6617
Source: Questionnaire
The pie chart representation of the division of sample population on
the basis of category of investors they fall in is given below:
Chart 7.27
Population on the Basis of Category of Investor
Source: Questionnaire

340
As can be seen from the above Pie Chart, there is large population
of investors who belong to retail category. Out of total respondents, almost
97.3% of population belongs to Retail category, 2.5% of population belongs
to HNI Category and 0.2% of population belongs to all other categories
such as NRI, Corporate Bodies, MFs, Banks and Other Financial
Institutions.
7. Sample investor population on the basis of income of respondents:
It is very important to know the income range of the investors since
there are questions asked with regard to value of contract they would want
in the equity derivatives, type of activities carried out by them in the equity
derivatives market etc. All the respondents were bucketed accordingly
depending on the income range they fall into i.e. income of upto Rs. 1 lac,
income of Rs. 1-5 lacs, income of Rs. 6-10 lacs, income of Rs. 10-15 lacs,
income of Rs. 15-25 lacs and income above 25 lacs. The summary of the
respondents based on the income range as disclosed by them is presented in
the following table:
Table 7.28
Income Range of the Respondent Investors
Responses Response
Percent
Response
Count
Upto Rs. 1 lac 6.5% 429
Rs. 1,00,001 - Rs. 5 lacs 78.3% 5180
Rs. 5,00,001 - Rs. 10 lacs 8.8% 580
Rs. 10,00,001 - Rs. 15 lacs 1.1% 72
Rs. 15,00,001 - Rs. 25 lacs 3.2% 211
Above Rs. 25 lacs 2.2% 145
Total Respondents 6617
Source: Questionnaire
The pie chart representation of the division of sample population on
the basis of income range of respondents is given below:

341
Chart 7.28
Income Range of the Respondent Investors
Source: Questionnaire
As can be seen from the above table and the Pie Chart, large
respondent population falls in the income range of Rs. 1 lac to Rs 5 lacs. As
we see from the above table, almost 78.3% of the respondent population fall
in the income range of Rs. 1,00,001 – Rs. 5 lacs, 8.8% of population fall in
the income range of Rs. 5,00,001 – Rs. 10 lacs, 6.5% of population fall in
the income range of upto Rs. 1 lac, 3.2% of population fall in the income
range of Rs. 15,00,001 - 25 lacs, 2.2% of population fall in the income
range of above Rs. 25 lacs and 1.1% of population fall in the income range
of Rs. 10,00,001 – Rs. 15 lacs. Thus, the large number of respondent base is
largely skewed towards the income range of Rs. 1-5 lacs. Thus, as can be
seen from the above, the respondents belonged to diverse income groups.
8. Sample investor population on the basis of occupation of respondents:
It was also necessary to understand the occupation of the respondent
population in order to know the kind of investors in the equity derivatives market
participate. The respondents were bucketed according to their occupation in
various buckets. The same are presented below in the tabular form:
Table 7.29
Population on the Basis of Occupation of the Investor
Responses Response Percent Response Count
Service 80.5% 5326
Business 9.2% 611
Professional 0.6% 39
Agriculturist 0.3% 17
Retired 2.0% 133
Housewife 3.4% 224
Student 4.0% 267
Total Respondents 6617
Source: Questionnaire

342
The pie chart representation of the division of sample population on
the basis of occupation of the respondents is given below:
Chart 7.29
Population on the Basis of Occupation of the Investor
Source: Questionnaire
As can be seen from the above table and the Pie Chart, almost
80.5% of population belongs to service class, 9.2% of population belong to
business class, 4.0% of population are Students, 3.4% of population are
Housewives, 2.0% of population are retired persons, 0.6% of population are
Professionals and 0.3% of population is Agriculturist. Thus, we see that
large number of investors appear to be the service or working class. Thus,
large number of respondents belonged to service class.
9. Analysis of Training requirements in Equity Derivatives
The respondents were advised to mention whether they had
undergone any training in derivatives from NSE, BSE or Broking firms
before starting trading in equity derivatives. This is important to know since
the respondents with good experience and with some training in derivatives
would be in a better position to answer the questions on training
requirement, strategy used, pace of growth of market etc. The respondents
were candid enough to respond to the question. There are many brokers
who offer online trading to their clients. Hence, apart from the Exchanges
and the regulatory body, the broking entities also conduct sessions for the
investors to make them understand the equity derivatives market and to
familiarize the clients with their online trading platform. The responses of
the respondents have been tabulated below in the table:

343
Table 7.30a
Respondents who have undergone some training in derivatives
Responses Response Percent Response Count
YES 33.1% 2188
NO 66.9% 4429
Total Respondents 6617
Source: Questionnaire
The pie chart representation of the division of respondents who had
undergone some training in equity derivatives before starting trading has
been given below:
Chart 7.30a
Respondents who have undergone some training in derivatives
Source: Questionnaire
As can be seen from the above table, almost 66.9% of total
respondents have not undergone any training before starting trading activity
in the equity derivatives market. Only 33.1% of the respondents had
undergone some training in derivatives from NSE, BSE or Broking Firms
before starting trading in equity derivatives. It was interesting to know that
there is a good number of investors who have undergone the training before
starting the derivatives trading activity are informed investors about the
equity derivatives market. SEBI has made it mandatory only for the persons
manning the dealing terminals to obtain Equity Derivatives Certification
from the Exchanges (NSE or BSE) or National Institute of Securities
Management (NISM), a separate body formed by SEBI to impart the
international level securities market education to the Indian market.
However, since there are many brokerage houses which offer the trading
platform online, they have been training the clients on how to use their

344
trading website and imparting the training on various products including the
equity derivatives products.
Further, to understand the need for the training of the investors in
the derivatives, the investors were asked whether they felt there was a need
to make it mandatory condition for all the investors to undertake training in
equity derivatives before they are allowed to trade in the derivatives market.
The outcome of responses to the questionnaire is as follows:
Table 7.30b
Investors with some training in derivatives be allowed to trade in the
derivatives market
Responses Response Percent Response Count
YES 96.4% 6379
NO 3.6% 238
Total Respondents 6617
Source: Questionnaire
The Pie Chart representing the break-up of investors who think that
only the investors with prior training in derivatives should be allowed to
trade in the equity derivatives market is presented below:
Chart 7.30b
Investors with some training in derivatives be allowed to trade in
the derivatives market
Source: Questionnaire
As can be seen from the above table and the chart, 96.4%
respondents feel that there is a need for all investors to undergo training
before they are allowed to trade in the equity derivatives market. Thus,
there is a large population who feel that only investors with some training in
derivatives should be allowed to trade in the equity derivatives market.

345
SEBI has been playing a very important role of protecting the small
investors in the market from being cheated or taken for a ride. That is the
precise reason SEBI has made it mandatory for brokers to inform/disclose
to all the clients about the risks involved in the derivatives trading. SEBI
has made this as a part of the Know Your Client (KYC) document kit which
the investor has to fill in before being accepted/registered by any broker as
a client. SEBI has also made it mandatory to obtain a specific signature if
the client wishes to trade in the derivatives market. However, even when
these requirements are stipulated, it has been observed that there are
practices prevailing in the market of obtaining only client’s signatures on
the form whereby the client is unknowingly accepting to trade in the equity
derivatives segment without even being aware of the risks involved in
trading in the equity derivatives market.
Thus, it was felt that the SEBI and/or Exchanges may evaluate
conducting online examination or training course or induction course
making it a pre-requisite for client to be allowed to trade in the equity
derivatives market in India.
10. Analysis of Derivatives Investment Avenues used by investors
Besides equity derivatives there are other two prominent investment
avenues available for the investors to invest in derivatives market in India.
They are namely, Commodity Derivatives and Currency Derivatives. Thus,
the researcher tried to find out which amongst all these derivatives markets
are the most popular amongst the investors and whether the investors
equally use the other investment avenues. The outcome of responses to the
questionnaire is as follows:
Table 7.31
Derivatives Investment Avenues used by the respondents
Responses Response Percent Response Count
Equity 99.7% 6596
Currency 24.1% 1593
Commodity 29.1% 1924
Other (please specify) 0
Total Respondents 6617
Source: Questionnaire

346
The outcome of the responses to the various avenues in derivatives
investments used by investors is presented in the bar chart below:
Chart 7.31
Derivatives Investment Avenues used by the respondents
Source: Questionnaire
It can be seen from the above table and chart that amongst all
derivatives markets, equity derivatives markets are widely used as an
investment option by the investors accounting for 99.7% of the investors.
However, there were also 24.1% respondents who also trade in Currency
Derivatives and 29.1% respondents who also trade in the Commodity
Derivatives. There have not been many users of the currency and
commodity derivatives market as compared to equity derivatives which
requires a further fillip to increase the investor base there. Thus, the most
popular derivatives market used by the investors is the Equity Derivatives
market in India today.
11. Most preferred type of Product in Equity Derivatives by the
respondents
Even though it is very prominent from the trading activity on the
equity derivatives exchanges that the most preferred product in the equity
derivatives market today is the Stock Index Options, since there is no
break-up of the detailed trades to identify whether it is the most preferred
by Foreign and large investors driving up the volume, this specific
question was asked to the investors. The results were more or less in line
with the trading activity carried out on the exchanges. The outcome of
responses to the questionnaire is as follows:

347
Table 7.32
The preference to the type product in Equity Derivatives of the
respondents
Responses Response Percent Response Count
Index Futures 36.1% 2391
Stock Futures 12.9% 854
Index Options 50.7% 3358
Stock Options 0.2% 14
Total Respondents 6617
Source: Questionnaire
The results of the responses to the questionnaire as tabulated
above have been presented below in the Pie chart:
Chart 7.32
The preference to the type product in Equity Derivatives of the respondents
Source: Questionnaire
As can be seen from the table and the chart, 50.7% have indicated
that the most preferred investment product in equity derivatives as Index
Option, followed by Index future which is preferred by 36.1%
respondents, followed by Stock Futures preferred by 12.9% respondents.
The least preferred product was Stock Options accounting for hardly
0.2%. Thus, today Stock Index Options are the most preferred type of
product by the investors in the equity derivatives market followed by
Index Futures, then by Stock Futures and then the Stock Options.
12. Periodicity of contracts normally preferred by Investors:
As per the product specifications and the contracts allowed by
SEBI for trading in the equity derivatives market, the contracts can have
the periodicity from 1 month to 5 years depending on the type of
products. Thus, the clients were asked to mention the most preferred

348
periodicity of contracts used by them to trade in the equity derivatives
markets where the product’s periodicity of contract ranges from 1 month
to 5 years. The outcome of responses to the questionnaire has been
brought out below:
Table 7.33
Periodicity of contracts normally preferred by investors to invest in
Responses Response
Percent
Response
Count
Contracts expiring in 1 Month 52.5% 3477
Contracts expiring in 2 Months 30.3% 2008
Contracts expiring in 3 Months 13.5% 891
Contracts expiring in 6 Months 3.1% 203
Contracts expiring in 9 Months 0.0% 0
Contracts expiring in 12 Months 0.1% 8
Contracts expiring in 1 to 3 Years 0.1% 4
Contracts expiring in 3 to 5 Years 0.0% 3
I do not invest in Securities Market at all 0.1% 6
Do not invest since I consider investing in
derivatives is risky 0.2% 12
Do not invest due to lack of knowledge of
derivatives 0.1% 5
Total Respondent 6617
Source: Questionnaire
The result of the periodicity of contracts preferred by clients as
tabulated has been presented below in the pie chart:
Chart 7.33
Periodicity of contracts normally preferred by investors to invest in
Source: Questionnaire
As can be seen from the above, almost 52.5% of the respondents
prefer contract expiring in 1 month, 30.3% respondents prefer contracts
expiring in 2 months and 30.3% of the respondents prefer contracts

349
expiring 3 months, 13.5% of the respondents prefer contracts expiring in 6
months and other preferences are meager. The results showed that the
most preferred contract period is the contract expiring in one month or as
popularly called as the contract expiring in the near month. It was also
observed that even though SEBI has introduced the long dated options
they are not found to be so popular in the investors. Since, we see
different type of investors, it is very obvious that the investors prefer the
near month contracts to speculate and for arbitrage.
13. Characteristics of the investors in the equity derivatives market
There are normally three types of investors in the equity
derivatives markets namely Hedgers, Speculators and Arbitragers. The
researcher tried to find out the characteristic of the type of investor
belonging to these above categories and the outcome of the responses to
the questionnaire have been tabulated below:
Table 7.34
Characteristics of the trading activity of investors in the equity
derivatives market
Responses Response Percent Response Count
Hedging 47.9% 3170
Speculation 87.1% 5763
Arbitrage 36.1% 2388
Total Respondent 6617
Source: Questionnaire
The result of the questionnaire as tabulated above has been
presented in the Column Chart given below:
Chart 7.34
Characteristics of the trading activity of investors in the equity
derivatives market
Source: Questionnaire

350
As can be seen from the above, 87.1% of the trading activity is
carried out as speculators, 47.9% time the respondents carry out equity
derivatives trading activity as hedgers and 36.9% time the respondents act
in the capacity of arbitragers. Thus, large number of times the investors
are speculators and sometimes hedgers. Today, with the development of
technology, the arbitrage opportunities are captured at a very fast speed
since there are large numbers of big players operating in the market who
capture the arbitrage opportunities with the automated trading system or
the algorithmic system developed by them. Hence, the retail clients in the
market hardly find any opportunity to capitalize on any opportunity that is
available in the market as arbitrage opportunity.
14. Strategies used for investments by investors
There are many strategies that can be used in the derivatives
market. However, there has been lack of education on the various
strategies that can be used to the retail investor at large. These investors
normally make the investments on the basis of the advice from the
brokers or the investments are made in a generic manner where the
investors do it for the speculations or hedging for the positions taken in
the cash market. The outcome of responses to the questionnaire has been
tabulated below:
Table 7.35
Strategies used for equity derivatives investments by the respondents
Responses Response
Percent
Response
Count
Straddle 0.2% 11
Strangle 0.1% 7
Protective put buying 0.1% 5
Protective call buying 0.2% 13
Covered call writing 0.1% 7
Collar 0.0% 0
Covered put writing 0.0% 1
Reverse Collar 0.0% 1
Butterfly Spread 0.0% 3
Condor 0.0% 2
Strip 0.0% 0
Strap 0.0% 0
More than one strategy used at some point or other 36.1% 2388
General Equity Derivatives Trading (No specific
Strategy used) 63.8% 4221
Total Respondent 6617
Source: Questionnaire

351
The representation of the strategies used by the clients is provided
below in the Column chart.
Chart 7.35
Strategies used for equity derivatives investments by the respondents
Source: Questionnaire
As it can be seen from the above, large number respondents i.e.
almost 63.8% carry out generic equity derivatives trading activity and do
not use any specific strategy for trading. Further, 36.1% of the
respondents use more than one strategy at some point of time or other
depending on the market condition. Thus, the trading activity carried out
by them in the equity derivatives market is of a generic nature without
knowing which strategy is being used by them. This emphasizes on the
need for training to be imparted to such clients on the various strategies
that can be used in the market, when these strategies should be used, what
are the benefits of usage of such strategies etc in order to enable the best
use of equity derivatives for the retail clients.
15. Need for reduction in the Contract Size Value below Rs. 2 lacs
There has been always debate on the contract size value. It has
been questioned many times whether the contract size value of Rs. 2 lacs
is correct or there should be reduction in the contract size. SEBI had also
permitted the mini contracts on the Sensex and Nifty on NSE and BSE
respectively on December 27, 2007. However, the same was subsequently
withdrawn recently by SEBI on November 20, 2012. As can be seen from
the outcome, the investors feel that there should be reduction in the value

352
of derivatives contracts. The outcome of responses to the questionnaire
has been tabulated below:
Table 7.36a
Need to reduce minimum contract size value from the current
Rs. 2 lacs
Responses Response Percent Response Count
YES 92.4% 6113
NO 7.6% 504
Total Respondents 6617
Source: Questionnaire
The representation of the views of the investors as tabulated above
is represented in the Pie chart given below:
Chart 7.36a
Need to reduce minimum contract size value from the current Rs. 2 lacs
Source: Questionnaire
As can be seen from the above analysis, almost 92.4% of the
investors feel that there is a need for the reduction of contract size value
of the derivatives contract in the market. The investors feel that there is a
need to reduce the contract size from the current Rs. 2 lac value in order
to increase the participation from more retail investors in the equity
derivatives market.
In order to further gauge the appropriate contract size expected in
the opinion of the respondents, the respondents were asked to suggest the
contract size ranging from Rs. 10,000/- to Rs. 4 lacs and also above Rs. 4
lacs. The options for the respondents were contract size value upto
Rs.10,000/-, Rs. 10,001/- to Rs. 50,000/-, Rs. 50,001/- to Rs, 1,00,000/-,
Rs. 1,00,001/- to Rs. 2,00,000/-, Rs, 2,00,001/- to Rs.4,00,000/- and the

353
last one being contract size value above Rs. 4,00,001/-. The outcome of
the responses to the questionnaire has been tabulated below:
Table 7.36b
Minimum contract size value expected by the investors in the
Equity Derivatives Market
Responses Response Percent Response Count
Upto Rs. 10,000/- 0.3% 21
Rs. 10,001/- to Rs. 50,000/- 26.1% 1727
Rs. 50,001/- to Rs. 1,00,000/- 32.2% 2131
1,00,001/- to 2,00,000/- 35.5% 2349
2,00,001/- to 4,00,000/- 5.8% 384
Above Rs. 4,00,001/- 0.1% 5
Total Respondents 6617
Source: Questionnaire
The representation of the responses received is provided in the Pie
Chart below:
Chart 7.36b
Minimum contract size value expected by the investors in the
Equity Derivatives Market
Source: Questionnaire
As can be seen from the above table, 35.5% respondents want the
contract size value to be in the range of Rs. 1 lac to Rs. 2 lacs, 32.2%
respondents would like the same to be in the range of Rs. 50,001 to
1,00,000, 26.1% respondents want the contract size value to be in the
range of Rs.10,001 to Rs. 50,000 and 5.8% of the respondents want the
status quo to be maintained with the contract size value remaining in the
range of Rs. 2 lacs to Rs.4 lacs. With regard to other contract size values
in the options less than 1% of the respondents had expressed their desire
for these contract size values.

354
Thus, this not only reveals the need for mini contracts (contract
size value of Rs. 1 lac) in all product types but also emphasizes on the
need to further reduce the contract size value, if possible, to increase the
participation of the retail investors. This will also give some relief to the
small retail investors who could also use effectively the equity derivatives
products to reallocate the risk to other willing participants.
16. Most concerning Risk in the Derivatives Market today for the
Respondents
The researcher also tried to understand from the investors out of
various risks embedded in the equity derivatives market, viz. Systemic
risk, Market Risk/Price risk/Potential Loss Risk, Settlement risk, Credit
Risk/Counterparty Default risk, Liquidity Risk, Operational Risk or Legal
Risk, which risk are of the most concern to them in today’s environment.
It was not surprising to learn that the risk which large number of investors
are concerned about is the in the derivatives market today for the
respondents is Market Risk/Price risk/Potential Loss Risk. The outcome
of responses has been brought out below:
Table 7.37
Risk of the most concern in the equity derivatives market to the
respondents today
Responses Response
Percent
Response
Count
Systematic risk 12.5% 824
Market Risk/Price risk/Potential Loss Risk 56.9% 3764
Settlement risk 0.1% 8
Credit Risk/Counterparty Default risk 0.1% 9
Liquidity Risk 1.2% 80
Operational Risk 29.2% 1932
Legal Risk 0.0% 0
Total Respondents 6617
Source: Questionnaire
The outcome of the responses of the questionnaire has been
brought out in the form of Pie chart below:

355
Chart 7.37
Risk of the most concern in the equity derivatives market to the
respondents today
Source: Questionnaire
As can be seen from the above table and chart, 56.9% respondents
consider market risk/price risk/potential loss risk to be of a prime concern,
followed by Operational Risk with 29.2% respondents and then followed
by systemic risk which is a concern of almost 12.5% of the respondents.
It can be seen from the above table that today with the efficient regulatory
framework, robust risk managements systems adopted by the Exchanges,
a well defined and tested clearing and settlement system, standardized
contracts, and large trade Guarantee fund to provide novation most of the
other risks have been addressed or so is felt by the investors at large.
Thus, it has been largely the market risk/price risk/potential loss risk
which the investors are most concerned about today.
17. Opinion of the respondents on the growth of Equity Derivatives
Segment in India
Even though the pace of growth of equity derivatives market in
India has been analyzed in detail in the earlier chapters from the
secondary data available in the public domain, it was felt necessary by the
researcher to understand from the investor about their opinion on the
growth of the equity derivatives market in India. Thus, the respondents
were asked about their opinion on pace of growth of equity derivatives
market in India. The outcome of responses to the questionnaire has been
tabulated below:

356
Table 7.38
Pace of growth of the trading in Equity Derivatives Market in
India since 2000
Responses Response Percent Response Count
Grew at very fast pace 50.7% 3356
Growth was moderate 49.1% 3250
Growth was slow 0.1% 8
Did not grow much 0.0% 3
Total Respondents 6617
Source: Questionnaire
The outcome of the responses as tabulated above has been brought
out below in the pie chart form:
Chart 7.38
Pace of growth of the trading in Equity Derivatives Market
in India since 2000
Source: Questionnaire
As can be seen from the above table and chart, 50.7% of the
respondents feel that the equity derivatives market in India grew at fast pace
and 49.1% felt that the growth was moderate. Other opinions were almost
negligible. Thus, it can be seen from the above table that the large population
feels the same way as seen from the secondary data that the equity
derivatives market grew at fast pace and there is no doubt about the same.
18. Opinion on the excessive margins felt in Indian Market
Today, in the Indian equity markets there are various margins
levied on the positions taken in the equity derivatives markets. There are
initial margins, exposure margins, adhoc margins and MTM losses etc
charged from the clients. The investors are always going to feel the heat
whatever the amount of margin would be charged to them. However, the
investors were asked whether they felt that the margins charged in the Indian

357
equity markets are excessive. The answer to this has almost been in unison.
The outcome of responses to the questionnaire has been tabulated below:
Table 7.39
Opinion on the excessive margins charged in Indian Market
Responses Response Percent Response Count
YES 68.9% 4558
NO 31.1% 2059
Total Respondents 6617
Source: Questionnaire
The results as mentioned above have been brought out below in
the form of pie chart:
Chart 7.39
Opinion on the excessive margins charged in Indian Market
Source: Questionnaire
As can be seen from the above table and pie chart, almost 68.9%
of the respondents feel that the margins charged today in the equity
derivatives markets are on the higher side than other markets. Further,
31.1% of the respondents feel that the margin is not excessive. Thus,
taking the responses into account it is felt that the regulatory body and the
exchanges may consider further reducing the margins to give some more
room to the investors to trade more since reduction on margin will also
mean some more margin amount in the hands of the investors to trade
further. However, regulatory body and the exchanges also have another
task in hand which is to keep the market default free and hence it will
have to play the balancing act while dealing with margining system.

358
19. Opinion on readiness of the market for other complex products in
derivatives:
It has been almost over a decade when the equity derivatives
trading started in the exchanges. Since then there has been introduction of
various products in the market such as Index Futures, Index Options,
Stock Futures, Stock Options, interest rate futures, Futures on the foreign
indices, mini contracts, long dated options, currency futures etc.
However, it was felt by the researcher to seek opinion from the investors
about whether this the ripe time for the equity markets to launch other
complex products in the derivatives such as exotic derivatives, structured
products, Exchange Traded Fund Derivatives, interest rate options etc. the
outcome of responses to the questionnaire has been tabulated below:
Table 7.40a
Market is ripe for introduction of other complex products in
Indian Equity Derivatives
Responses Response Percent Response Count
YES 59.9% 3965
NO 40.1% 2652
Total Respondents 6617
Source: Questionnaire
The outcome of the responses as tabulated above has been brought
out below in the pie chart form:
Chart 7.40a
Market is ripe for introduction of other complex products in
Indian Equity Derivatives
Source: Questionnaire
As can be seen from the above table, 59.9% of the respondents
feel that equity derivatives markets should now introduce next logical

359
complex products. Thus, even though there have not been many of the
respondents who had undergone the training for trading in the derivatives
contracts, also many of them do not appear to be so much familiar with
the various types of strategies that are used in the market, these
respondents feel that it is the ripe time to open up the derivatives market
for various complex products.
The respondents were further asked to indicate whether these new
complex products be opened to the retail clients in general or should be
with restricted access to only few large participants such as banks,
financial institutions, FIIS, sub-accounts, Mutual funds, insurance
companies etc. The outcome of responses to the questionnaire is as
follows:
Table 7.40b
Views on opening the complex products for participation to big
institutional investors and not retail clients
Responses Response Percent Response Count
YES 87.2% 5768
NO 12.8% 849
Total Respondents 6617
Source: Questionnaire
The outcome of the responses as tabulated above has been brought
out below in the pie chart form:
Chart 7.40b
Views on opening the complex products for participation to
big institutional investors and not retail clients
Source: Questionnaire
As can be seen from the above table, there are 87.2% respondents
feel that the access to the complex products such as exotic derivatives,

360
structured products, Exchange Traded Fund Derivatives, interest rate
options etc. even if introduced in the market should be restricted to the
larger players in the market such as banks, financial institutions, FIIS,
sub-accounts, Mutual funds, insurance companies etc. and not be opened
to the retail clients. This must have been because the retail clients want to
first understand the products, its usage etc. and then participate in the
same. Also, they must have been feeling that these products could be
tested by the larger participants who have bigger appetite to take the risk
compared to the smaller investors. In reality, this is also the correct
approach since when these products are opened for the retail clients, the
liquidity in these products would have been developed and these products
would have been extensively tried and tested by the larger players who
also have the wherewithal to understand them and also ensure that the
exchanges offer the product suitable to the market at large.
20. Need for Physical delivery settlement for equity derivatives on both
the exchanges
SEBI had permitted the stock exchanges to introduce physical
settlement stock options and/or stock futures on July 15, 2010. However,
it was only BSE who introduced the physical delivery settlement product
in the equity derivatives market. Also, if we look at the trading activity on
BSE at that point of time, it was almost negligible. Hence, the
introduction of this product did not make much sense when the other
exchange i.e. NSE was prominent derivatives exchange holding lions
share in the equity derivatives trading volume not launching the product.
Thus, the opinion was sought from the investors about whether this
product should be introduced by both the exchanges so that it could
become one more product in the basket to be offered to the investors at
large. The following was the outcome of responses to the questionnaire:
Table 7.41
Introducing Physical delivery settlement for equity derivatives by
both exchanges
Responses Response Percent Response Count
YES 85.6% 5664
NO 14.4% 953
Total Respondents 6617
Source: Questionnaire

361
The outcome of responses to the questionnaire has been brought
out in the pie chart below:
Chart 7.41
Introducing Physical delivery settlement for equity derivatives by
both exchanges
Source: Questionnaire
As can be seen from the above table and chart, almost 85.6% of
the respondents were of the opinion that both the exchanges should start
the product with the physical delivery settlement in the equity derivatives
market which may generate some interest and further footfalls in the
market. This would also give some fillip to the now lackluster Securities
Lending and Borrowing Mechanism and also one more product to invest
into and also carry out the arbitrage trades to the market players. Thus,
Exchanges may like to consider introduction of the physical settlement
delivery on the exchange and tap on the growing demand and opportunity
to offer one more product for the market participants.