Embed Size (px)
Citation preview
resources
Article
Data Analytic Approaches for Mining ProcessImprovement—Machinery Utilization Use Case
Edyta Brzychczy 1,* , Paulina Gackowiec 1 and Mirko Liebetrau 2
1 Faculty of Mining and Geoengineering, AGH University of Science and Technology, 30-059 Cracow, Poland;[email protected]
2 Talpasolutions GmbH, 45327 Essen, Germany; [email protected]* Correspondence: [email protected]
Received: 5 December 2019; Accepted: 31 January 2020; Published: 7 February 2020�����������������
Abstract: This paper investigates the application of process mining methodology on the processes of amobile asset in mining operations as a means of identifying opportunities to improve the operationalefficiency of such. Industry 4.0 concepts with related extensive digitalization of industrial processesenable the acquisition of a huge amount of data that can and should be used for improving processesand decision-making. Utilizing this data requires appropriate data processing and data analysisschemes. In the processing and analysis stage, most often, a broad spectrum of data mining algorithmsis applied. These are data-oriented methods and they are incapable of mapping the cause-effectrelationships between process activities. However, in this scope, the importance of process-orientedanalytical methods is increasingly emphasized, namely process mining (PM). PM techniques area relatively new approach, which enable the construction of process models and their analyticsbased on data from enterprise IT systems (data are provided in the form of so-called event logs).The specific working environment and a multitude of sensors relevant for the working process causesthe complexity of mining processes, especially in underground operations. Hence, an individualapproach for event log preparation and gathering contextual information to be utilized in processanalysis and improvement is mandatory. This paper describes the first application of the concept ofPM to investigate the normal working process of a roof bolter, operating in an underground mine.By applying PM, the irregularities of the operational scheme of this mobile asset have been identified.Some irregularities were categorized as inefficiencies that are caused by either failure of machinery orsuboptimal utilization of the same. In both cases, the results achieved by applying PM to the activitylog of the mobile asset are relevant for identifying the potential for improving the efficiency of theoverall working process.
Keywords: mining process; data mining; process mining; process improvement; BPM
1. Introduction
Introducing digitalization to the mining industry provides opportunities to improve productivity [1].The acquisition of large amounts of machine data allows obtaining a more complete picture and in-depthknowledge of the efficiency in which processes are carried out. Hence, decision-making can besupported, and indications for processes efficiency improvement identified [2].
Mining companies aspire to continuously improve processes to increase the operational efficiencyand safety of their personnel. Mining processes are characterized by very demanding and complexactivities due to the challenging physical aspects (heat, cold, vibrations, noise) and the unpredictableconditions of work. In such environments, human errors, and defective equipment, as well as naturalhazards, are serious risk factors. Risks in mining operations also arise from the use of heavy equipmentand the occurrence of different types of energy (electrical, mechanical, other), which holistically
Resources 2020, 9, 17; doi:10.3390/resources9020017 www.mdpi.com/journal/resources
Resources 2020, 9, 17 2 of 17
contribute to a volatile environment [3]. Therefore, it is essential to accurately monitor the operationalprocesses and mine-site equipment, comprehensively, and continuously, as well as to leverage insightsthat are generated by the monitoring solutions to support the decision-making process. The essence ofenvironment and machinery monitoring in an underground mine is exemplified in [4,5].
Process data may derive from a variety of sources, for example, Enterprise Resource Planning(ERP) systems, machinery and device monitoring systems, the working environment, or employeelocation. The origins of different sources of data cause different degrees of granularity: from themost general (e.g., geometrical dimensions of the excavation), through more detailed operating statesof machines (work, alarm, shutdown), for simple measurements (e.g., methane, currents in motors,switching on transformers). It is crucial that all such data are accounted to a specific process and theyshould be analyzed in this context, to provide for an in-depth efficiency and safety analysis.
Scientific publications suggest a variety of approaches for data analyses regarding variousprocesses or working environment conditions. Most often, these approaches include a broad spectrumof data mining algorithms, used in the tasks of description [6–10], prediction [11–17], or classificationof phenomena [18–22]. It is worth noting that these data-oriented methods are incapable of mapping thecausal relationship between activities in the process to a degree where inefficiencies can be identifiedeasily and on-point [23]. Therefore, in case process improvements are thought, it is mandatory to applymore process-oriented methods, e.g., Process Mining.
Process Mining (PM) originates in workflow analysis. Meanwhile, it is one of the most commonlyused analytical approaches in Business Process Management (BPM). The tools that are applied in PMare various and they include techniques, like process model discovery, conformance checking, processmodel repair, role discovery, bottleneck analysis, or predicting the remaining flow time [24].
So far, individual cases of using this type of analysis in mining operations can be found. He et al. [25]reports on the application of PM to emergency rescue processes of fatal gas explosion accidents inChina, while, in [26,27], the creation of event logs from a longwall monitoring system is presented.
Contemporary mining machinery is equipped with a wide variety of sensors. However, onlya fraction of the data generated from these sensors is commonly utilized. The main reasons are thelack of a reliable and common system of data storage and analysis [28], as well as a lack of analyticexpertise among process executors, and managers.
This paper presents the very first application of the PM approach for the analysis of mobile miningasset operation. The remainder of this paper is structured, as follows. In Section 2, to generate commonbasic understanding, introduction to selected concepts, such as the business process management, datamining, and process mining is presented. In this section, challenges related to PM implementation intothe mining domain are also briefly described. The process mining analysis of roof bolter operation,based on the created event log, is presented in Section 3. The results of our analysis are discussedand the potentials for process improvement are identified. Finally, Section 4 concludes the paper andprovides several directions for future work, pointing out the value of PM application in the effectivemanagement of mining machinery operations.
2. Materials and Methods
2.1. Business Process Management
This section will introduce the basics of Business Process Management (BPM) to achieve a generalunderstanding of how process optimization is carried out. BPM has received considerable attentionin recent years due to its potential for significantly increasing productivity and saving costs [29].This discipline can be seen as an alignment of Information Technology (IT) infrastructure (e.g., datagathering systems, like an ERP tool) with current organizational demands of process improvement [30].BPM is an iterative approach and it promotes the constant improvement of processes and proceduresin organizations.
Resources 2020, 9, 17 3 of 17
The overall process architecture of the considered organization should be defined first in order toidentify the critical processes. The evaluation of the processes can then be carried out with respect toits relevance to the whole process chain, as well as the identified degree of efficiency. This leads to aprocess hierarchy to most efficiently perform the process improvement.
BPM addresses different activities aiming for process improvement, generally presented as a cycle,referred to as the BPM cycle.
The BPM cycle consists of the following phases [31]:
• process model discovery,• process analysis,• process redesign,• process implementation, and• process monitoring and controlling.
Process model discovery helps to define a model that reflects how and in what sequence theprocesses are implemented in the organization (“as-is” model). At this stage, techniques for automaticmodel detection that are based on data can be used in addition to analyzing documentation, observations,and interviews. The current state of the process is documented in the form of one or several models.
Process analysis is carried out in order to identify errors that typically occur and lead to an extendedduration or workload of the considered process. For this step, documentation and quantificationconcerning process effectiveness measures are crucial. In terms of the latter, various quantitative andqualitative analytic techniques are used (e.g., value-added analysis, why-why method, flow analysis,simulations [31]).
Process redesign suggests changes in the process that potentially reduce the identified errors(as investigated in the process analysis stage) and allow for the process sequence to be performed withimproved efficiency. The effect of this stage is the “to-be” process model (redesigned, enhanced model).
Process implementation is the stage where the suggested changes or “to-be” process model isapplied for the first time. Here, efficiency gains are actually generated for the first time.
The final stage is monitoring and controlling the process by analyzing data from the implementedprocess. It is investigated whether the changes have brought the assumed effects, and an overall higherprocess efficiency was achieved.
One can see that the process improvement requires process modeling and its analysis. PM can beused in these phases, as well as in the process monitoring and control phase. Our research focuseson the first two steps (process model discovery and process analysis) to point out inefficiencies andpotential for optimization. Section 2.3 will present a characteristic of the PM approach.
2.2. Data Mining—Data-Oriented Approach in Process Analytics
Data mining is the exploration and analysis of large data sets to discover meaningful, previouslyunknown patterns and rules [32]. It is a component of a broader process, called knowledge discoveryfrom databases (KDD), which also contains a selection of data, data pre-processing and cleaning, datatransformation, as well as interpretation and evaluation phases [33].
Based on the kinds of investigated patterns, tasks in data mining can be classified into [34]:description, estimation, prediction, classification, clustering, and association.
Nowadays, the usefulness of various types of data mining algorithms for discovering new,potentially useful patterns and dependencies in data that can be used in the decision-making processare commonly known. However, their application is rather poor when it comes to process analysis(understood as a series of interrelated activities).
Among decision-makers and practitioners, managerial dashboards that descriptively present the“state” of the process are very popular [35]. On dashboards, most frequently, descriptive statistics,visualizations, and less frequently correlations are presented for information and decision-making
Resources 2020, 9, 17 4 of 17
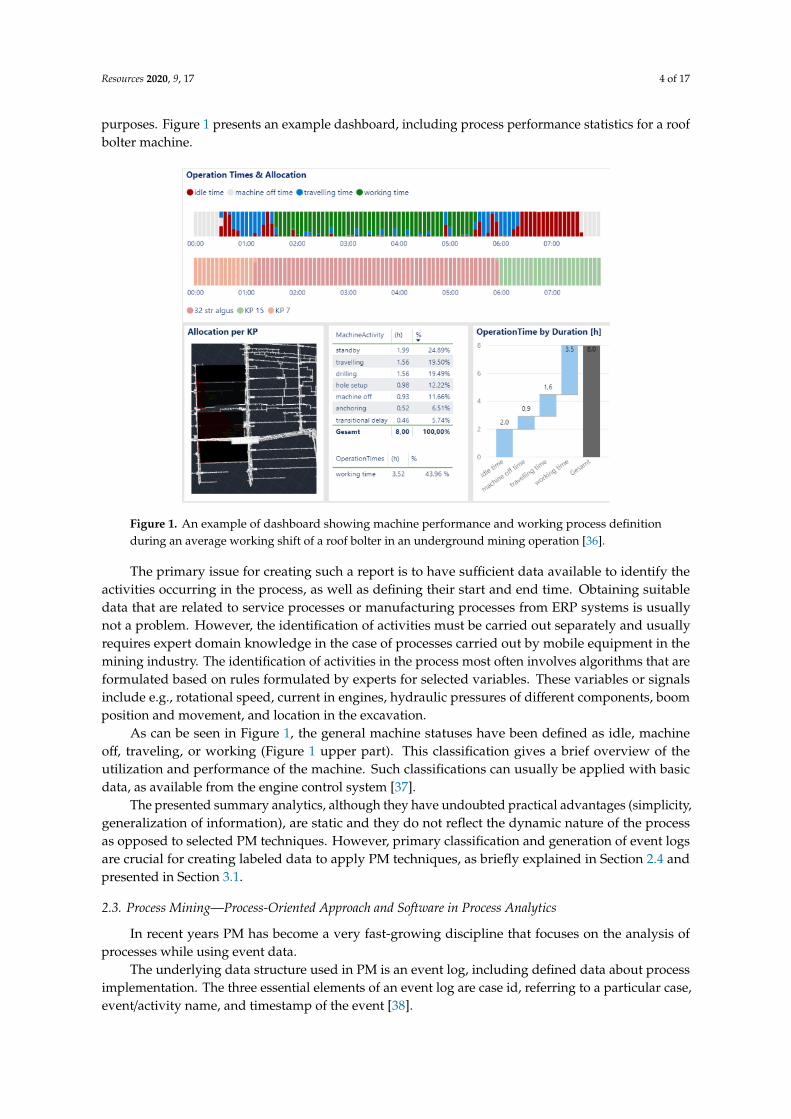
purposes. Figure 1 presents an example dashboard, including process performance statistics for a roofbolter machine.
Resources 2019, 8, x FOR PEER REVIEW 4 of 17
purposes. Figure 1 presents an example dashboard, including process performance statistics for a roof bolter machine.
The primary issue for creating such a report is to have sufficient data available to identify the activities occurring in the process, as well as defining their start and end time. Obtaining suitable data that are related to service processes or manufacturing processes from ERP systems is usually not a problem. However, the identification of activities must be carried out separately and usually requires expert domain knowledge in the case of processes carried out by mobile equipment in the mining industry. The identification of activities in the process most often involves algorithms that are formulated based on rules formulated by experts for selected variables. These variables or signals include e.g., rotational speed, current in engines, hydraulic pressures of different components, boom position and movement, and location in the excavation.
Figure 1. An example of dashboard showing machine performance and working process definition during an average working shift of a roof bolter in an underground mining operation [36].
As can be seen in Figure 1, the general machine statuses have been defined as idle, machine off, traveling, or working (Figure 1 upper part). This classification gives a brief overview of the utilization and performance of the machine. Such classifications can usually be applied with basic data, as available from the engine control system [37].
The presented summary analytics, although they have undoubted practical advantages (simplicity, generalization of information), are static and they do not reflect the dynamic nature of the process as opposed to selected PM techniques. However, primary classification and generation of event logs are crucial for creating labeled data to apply PM techniques, as briefly explained in Section 2.4 and presented in Section 3.1.
2.3. Process Mining—Process-Oriented Approach and Software in Process Analytics
In recent years PM has become a very fast-growing discipline that focuses on the analysis of processes while using event data.
The underlying data structure used in PM is an event log, including defined data about process implementation. The three essential elements of an event log are case id, referring to a particular case, event/activity name, and timestamp of the event [38].
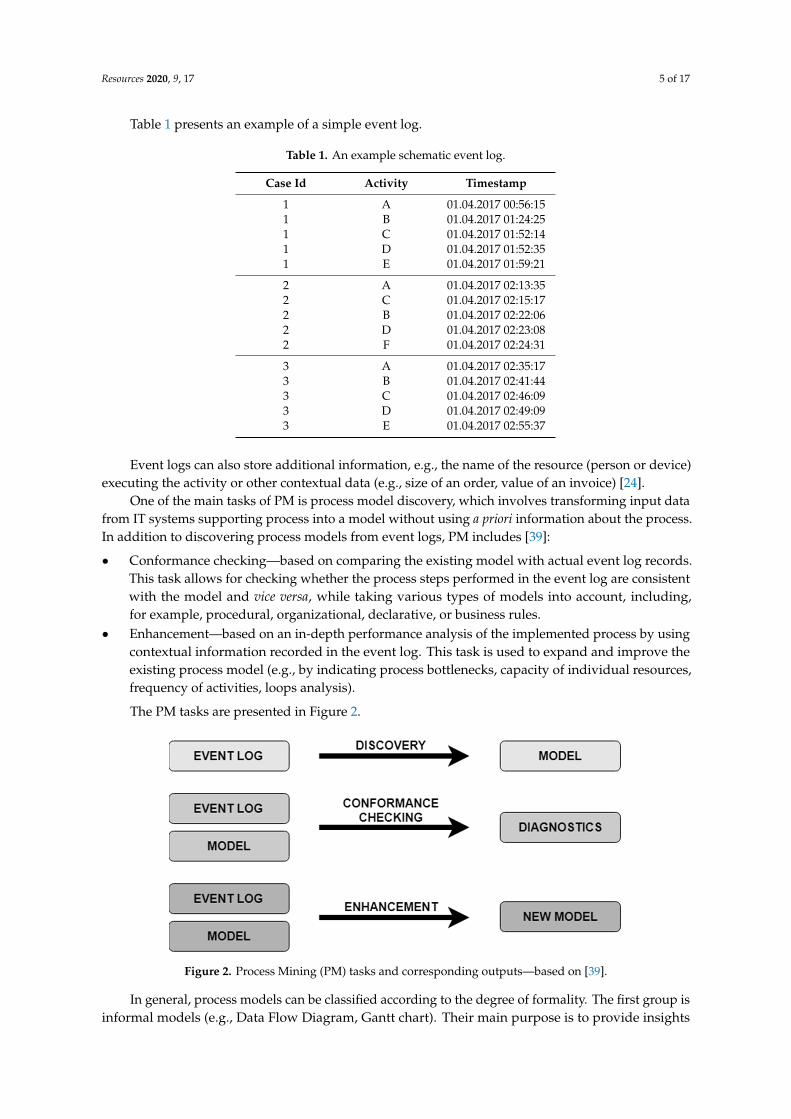
Table 1 presents an example of a simple event log.
Figure 1. An example of dashboard showing machine performance and working process definitionduring an average working shift of a roof bolter in an underground mining operation [36].
The primary issue for creating such a report is to have sufficient data available to identify theactivities occurring in the process, as well as defining their start and end time. Obtaining suitabledata that are related to service processes or manufacturing processes from ERP systems is usuallynot a problem. However, the identification of activities must be carried out separately and usuallyrequires expert domain knowledge in the case of processes carried out by mobile equipment in themining industry. The identification of activities in the process most often involves algorithms that areformulated based on rules formulated by experts for selected variables. These variables or signalsinclude e.g., rotational speed, current in engines, hydraulic pressures of different components, boomposition and movement, and location in the excavation.
As can be seen in Figure 1, the general machine statuses have been defined as idle, machineoff, traveling, or working (Figure 1 upper part). This classification gives a brief overview of theutilization and performance of the machine. Such classifications can usually be applied with basicdata, as available from the engine control system [37].
The presented summary analytics, although they have undoubted practical advantages (simplicity,generalization of information), are static and they do not reflect the dynamic nature of the processas opposed to selected PM techniques. However, primary classification and generation of event logsare crucial for creating labeled data to apply PM techniques, as briefly explained in Section 2.4 andpresented in Section 3.1.
2.3. Process Mining—Process-Oriented Approach and Software in Process Analytics
In recent years PM has become a very fast-growing discipline that focuses on the analysis ofprocesses while using event data.
The underlying data structure used in PM is an event log, including defined data about processimplementation. The three essential elements of an event log are case id, referring to a particular case,event/activity name, and timestamp of the event [38].
Resources 2020, 9, 17 5 of 17
Table 1 presents an example of a simple event log.
Table 1. An example schematic event log.
Case Id Activity Timestamp
1 A 01.04.2017 00:56:151 B 01.04.2017 01:24:251 C 01.04.2017 01:52:141 D 01.04.2017 01:52:351 E 01.04.2017 01:59:21
2 A 01.04.2017 02:13:352 C 01.04.2017 02:15:172 B 01.04.2017 02:22:062 D 01.04.2017 02:23:082 F 01.04.2017 02:24:31
3 A 01.04.2017 02:35:173 B 01.04.2017 02:41:443 C 01.04.2017 02:46:093 D 01.04.2017 02:49:093 E 01.04.2017 02:55:37
Event logs can also store additional information, e.g., the name of the resource (person or device)executing the activity or other contextual data (e.g., size of an order, value of an invoice) [24].
One of the main tasks of PM is process model discovery, which involves transforming input datafrom IT systems supporting process into a model without using a priori information about the process.In addition to discovering process models from event logs, PM includes [39]:
• Conformance checking—based on comparing the existing model with actual event log records.This task allows for checking whether the process steps performed in the event log are consistentwith the model and vice versa, while taking various types of models into account, including,for example, procedural, organizational, declarative, or business rules.
• Enhancement—based on an in-depth performance analysis of the implemented process by usingcontextual information recorded in the event log. This task is used to expand and improve theexisting process model (e.g., by indicating process bottlenecks, capacity of individual resources,frequency of activities, loops analysis).
The PM tasks are presented in Figure 2.
Resources 2019, 8, x FOR PEER REVIEW 5 of 17
Table 1. An example schematic event log.
Case id Activity Timestamp 1 A 01.04.2017 00:56:15 1 B 01.04.2017 01:24:25 1 C 01.04.2017 01:52:14 1 D 01.04.2017 01:52:35 1 E 01.04.2017 01:59:21 2 A 01.04.2017 02:13:35 2 C 01.04.2017 02:15:17 2 B 01.04.2017 02:22:06 2 D 01.04.2017 02:23:08 2 F 01.04.2017 02:24:31 3 A 01.04.2017 02:35:17 3 B 01.04.2017 02:41:44 3 C 01.04.2017 02:46:09 3 D 01.04.2017 02:49:09 3 E 01.04.2017 02:55:37
Event logs can also store additional information, e.g., the name of the resource (person or device) executing the activity or other contextual data (e.g., size of an order, value of an invoice) [24].
One of the main tasks of PM is process model discovery, which involves transforming input data from IT systems supporting process into a model without using a priori information about the process. In addition to discovering process models from event logs, PM includes [39]:
• Conformance checking—based on comparing the existing model with actual event log records. This task allows for checking whether the process steps performed in the event log are consistent with the model and vice versa, while taking various types of models into account, including, for example, procedural, organizational, declarative, or business rules.
• Enhancement—based on an in-depth performance analysis of the implemented process by using contextual information recorded in the event log. This task is used to expand and improve the existing process model (e.g., by indicating process bottlenecks, capacity of individual resources, frequency of activities, loops analysis).
The PM tasks are presented in Figure 2.
Figure 2. Process Mining (PM) tasks and corresponding outputs—based on [39].
In general, process models can be classified according to the degree of formality. The first group is informal models (e.g., Data Flow Diagram, Gantt chart). Their main purpose is to provide insights or support discussion, but cannot be used for enactment and rigorous analysis. The second group is formal models (e.g., Petri nets), allowing for deeper analysis and enactment. However, these models may be more difficult to construct than informal models. In practice, semi-formal models also exist (e.g.,
Figure 2. Process Mining (PM) tasks and corresponding outputs—based on [39].
In general, process models can be classified according to the degree of formality. The first group isinformal models (e.g., Data Flow Diagram, Gantt chart). Their main purpose is to provide insights
Resources 2020, 9, 17 6 of 17
or support discussion, but cannot be used for enactment and rigorous analysis. The second group isformal models (e.g., Petri nets), allowing for deeper analysis and enactment. However, these modelsmay be more difficult to construct than informal models. In practice, semi-formal models also exist(e.g., Business Process Model and Notation (BPMN), Unified Modelling Language (UML) activitydiagrams, Event-driven Process Chain (EPCs)) [40].
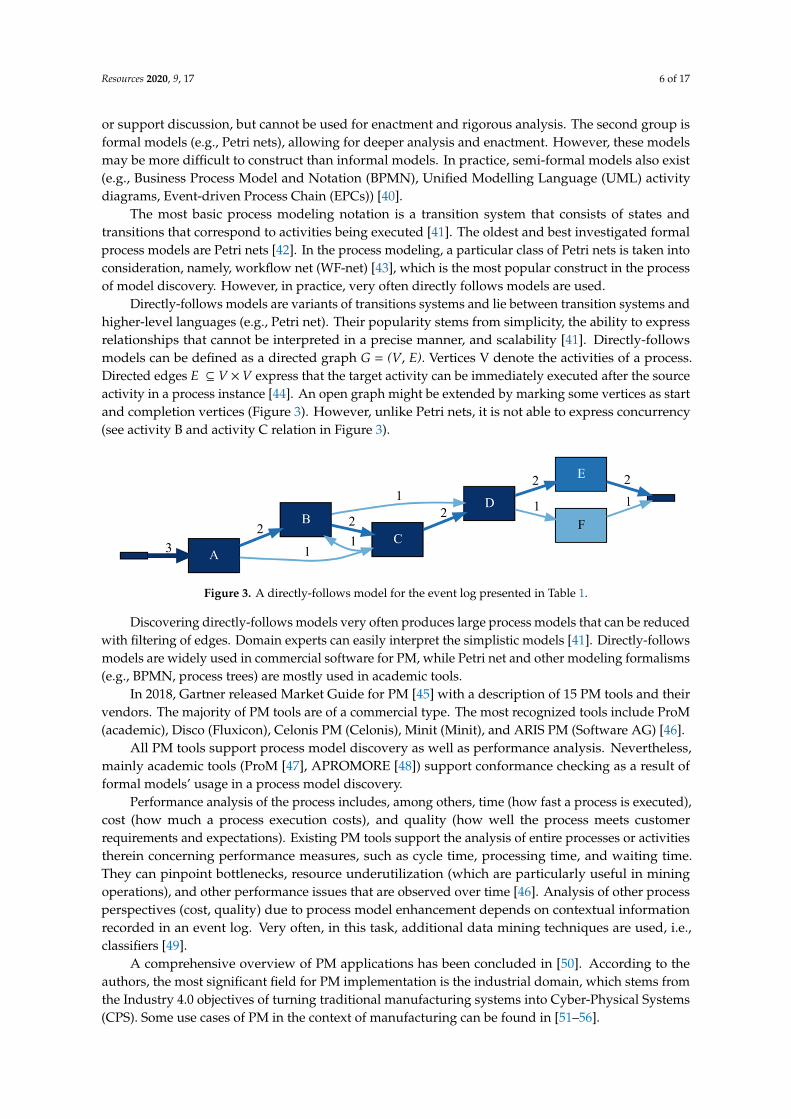
The most basic process modeling notation is a transition system that consists of states andtransitions that correspond to activities being executed [41]. The oldest and best investigated formalprocess models are Petri nets [42]. In the process modeling, a particular class of Petri nets is taken intoconsideration, namely, workflow net (WF-net) [43], which is the most popular construct in the processof model discovery. However, in practice, very often directly follows models are used.
Directly-follows models are variants of transitions systems and lie between transition systems andhigher-level languages (e.g., Petri net). Their popularity stems from simplicity, the ability to expressrelationships that cannot be interpreted in a precise manner, and scalability [41]. Directly-followsmodels can be defined as a directed graph G = (V, E). Vertices V denote the activities of a process.Directed edges E ⊆ V ×V express that the target activity can be immediately executed after the sourceactivity in a process instance [44]. An open graph might be extended by marking some vertices as startand completion vertices (Figure 3). However, unlike Petri nets, it is not able to express concurrency(see activity B and activity C relation in Figure 3).
Resources 2019, 8, x FOR PEER REVIEW 6 of 17
Business Process Model and Notation (BPMN), Unified Modelling Language (UML) activity diagrams, Event-driven Process Chain (EPCs)) [40].
The most basic process modeling notation is a transition system that consists of states and transitions that correspond to activities being executed [41]. The oldest and best investigated formal process models are Petri nets [42]. In the process modeling, a particular class of Petri nets is taken into consideration, namely, workflow net (WF-net) [43], which is the most popular construct in the process of model discovery. However, in practice, very often directly follows models are used.
Directly-follows models are variants of transitions systems and lie between transition systems and higher-level languages (e.g., Petri net). Their popularity stems from simplicity, the ability to express relationships that cannot be interpreted in a precise manner, and scalability [41]. Directly-follows models can be defined as a directed graph G = (V, E). Vertices V denote the activities of a process. Directed edges ⊆ express that the target activity can be immediately executed after the source activity in a process instance [44]. An open graph might be extended by marking some vertices as start and completion vertices (Figure 3). However, unlike Petri nets, it is not able to express concurrency (see activity B and activity C relation in Figure 3).
Figure 3. A directly-follows model for the event log presented in Table 1.
Discovering directly-follows models very often produces large process models that can be reduced with filtering of edges. Domain experts can easily interpret the simplistic models [41]. Directly-follows models are widely used in commercial software for PM, while Petri net and other modeling formalisms (e.g., BPMN, process trees) are mostly used in academic tools.
In 2018, Gartner released Market Guide for PM [45] with a description of 15 PM tools and their vendors. The majority of PM tools are of a commercial type. The most recognized tools include ProM (academic), Disco (Fluxicon), Celonis PM (Celonis), Minit (Minit), and ARIS PM (Software AG) [46].
All PM tools support process model discovery as well as performance analysis. Nevertheless, mainly academic tools (ProM [47], APROMORE [48]) support conformance checking as a result of formal models’ usage in a process model discovery.
Performance analysis of the process includes, among others, time (how fast a process is executed), cost (how much a process execution costs), and quality (how well the process meets customer requirements and expectations). Existing PM tools support the analysis of entire processes or activities therein concerning performance measures, such as cycle time, processing time, and waiting time. They can pinpoint bottlenecks, resource underutilization (which are particularly useful in mining operations), and other performance issues that are observed over time [46]. Analysis of other process perspectives (cost, quality) due to process model enhancement depends on contextual information recorded in an event log. Very often, in this task, additional data mining techniques are used, i.e., classifiers [49].
A comprehensive overview of PM applications has been concluded in [50]. According to the authors, the most significant field for PM implementation is the industrial domain, which stems from the Industry 4.0 objectives of turning traditional manufacturing systems into Cyber-Physical Systems (CPS). Some use cases of PM in the context of manufacturing can be found in [51–56].
Figure 3. A directly-follows model for the event log presented in Table 1.
Discovering directly-follows models very often produces large process models that can be reducedwith filtering of edges. Domain experts can easily interpret the simplistic models [41]. Directly-followsmodels are widely used in commercial software for PM, while Petri net and other modeling formalisms(e.g., BPMN, process trees) are mostly used in academic tools.
In 2018, Gartner released Market Guide for PM [45] with a description of 15 PM tools and theirvendors. The majority of PM tools are of a commercial type. The most recognized tools include ProM(academic), Disco (Fluxicon), Celonis PM (Celonis), Minit (Minit), and ARIS PM (Software AG) [46].
All PM tools support process model discovery as well as performance analysis. Nevertheless,mainly academic tools (ProM [47], APROMORE [48]) support conformance checking as a result offormal models’ usage in a process model discovery.
Performance analysis of the process includes, among others, time (how fast a process is executed),cost (how much a process execution costs), and quality (how well the process meets customerrequirements and expectations). Existing PM tools support the analysis of entire processes or activitiestherein concerning performance measures, such as cycle time, processing time, and waiting time.They can pinpoint bottlenecks, resource underutilization (which are particularly useful in miningoperations), and other performance issues that are observed over time [46]. Analysis of other processperspectives (cost, quality) due to process model enhancement depends on contextual informationrecorded in an event log. Very often, in this task, additional data mining techniques are used, i.e.,classifiers [49].
A comprehensive overview of PM applications has been concluded in [50]. According to theauthors, the most significant field for PM implementation is the industrial domain, which stems fromthe Industry 4.0 objectives of turning traditional manufacturing systems into Cyber-Physical Systems(CPS). Some use cases of PM in the context of manufacturing can be found in [51–56].
Resources 2020, 9, 17 7 of 17
2.4. Implementation of Process Mining into Mining Domain—Approach and Challenges
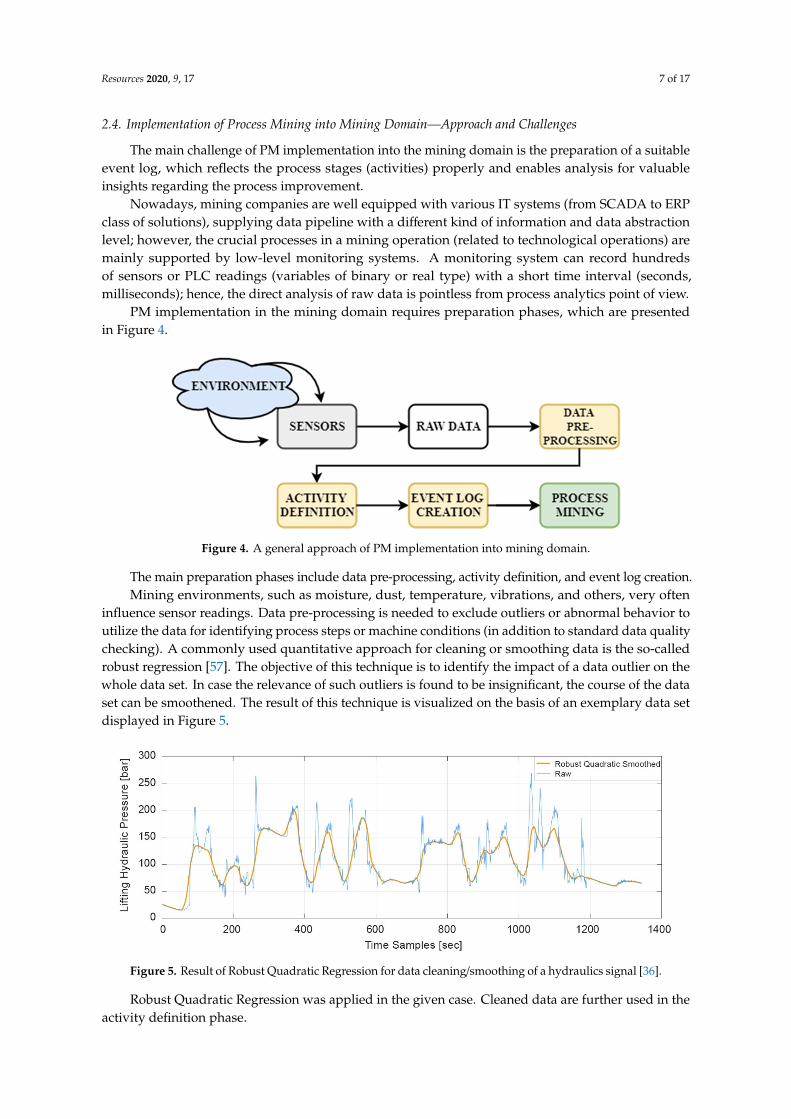
The main challenge of PM implementation into the mining domain is the preparation of a suitableevent log, which reflects the process stages (activities) properly and enables analysis for valuableinsights regarding the process improvement.
Nowadays, mining companies are well equipped with various IT systems (from SCADA to ERPclass of solutions), supplying data pipeline with a different kind of information and data abstractionlevel; however, the crucial processes in a mining operation (related to technological operations) aremainly supported by low-level monitoring systems. A monitoring system can record hundredsof sensors or PLC readings (variables of binary or real type) with a short time interval (seconds,milliseconds); hence, the direct analysis of raw data is pointless from process analytics point of view.
PM implementation in the mining domain requires preparation phases, which are presentedin Figure 4.
Resources 2019, 8, x FOR PEER REVIEW 7 of 17
2.4. Implementation of Process Mining into Mining Domain—Approach and Challenges
The main challenge of PM implementation into the mining domain is the preparation of a suitable event log, which reflects the process stages (activities) properly and enables analysis for valuable insights regarding the process improvement.
Nowadays, mining companies are well equipped with various IT systems (from SCADA to ERP class of solutions), supplying data pipeline with a different kind of information and data abstraction level; however, the crucial processes in a mining operation (related to technological operations) are mainly supported by low-level monitoring systems. A monitoring system can record hundreds of sensors or PLC readings (variables of binary or real type) with a short time interval (seconds, milliseconds); hence, the direct analysis of raw data is pointless from process analytics point of view.
PM implementation in the mining domain requires preparation phases, which are presented in Figure 4.
Figure 4. A general approach of PM implementation into mining domain.
The main preparation phases include data pre-processing, activity definition, and event log creation.
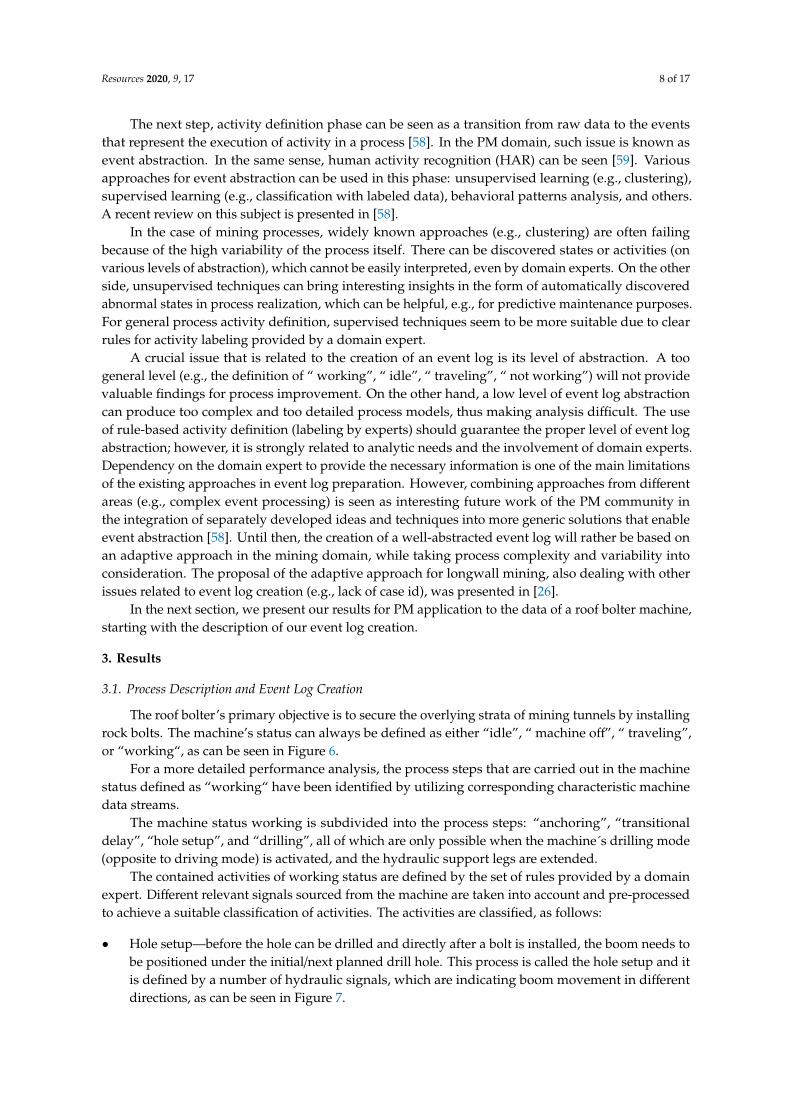
Mining environments, such as moisture, dust, temperature, vibrations, and others, very often influence sensor readings. Data pre-processing is needed to exclude outliers or abnormal behavior to utilize the data for identifying process steps or machine conditions (in addition to standard data quality checking). A commonly used quantitative approach for cleaning or smoothing data is the so-called robust regression [57]. The objective of this technique is to identify the impact of a data outlier on the whole data set. In case the relevance of such outliers is found to be insignificant, the course of the data set can be smoothened. The result of this technique is visualized on the basis of an exemplary data set displayed in Figure 5.
Figure 5. Result of Robust Quadratic Regression for data cleaning/smoothing of a hydraulics signal [36].
Figure 4. A general approach of PM implementation into mining domain.
The main preparation phases include data pre-processing, activity definition, and event log creation.Mining environments, such as moisture, dust, temperature, vibrations, and others, very often
influence sensor readings. Data pre-processing is needed to exclude outliers or abnormal behavior toutilize the data for identifying process steps or machine conditions (in addition to standard data qualitychecking). A commonly used quantitative approach for cleaning or smoothing data is the so-calledrobust regression [57]. The objective of this technique is to identify the impact of a data outlier on thewhole data set. In case the relevance of such outliers is found to be insignificant, the course of the dataset can be smoothened. The result of this technique is visualized on the basis of an exemplary data setdisplayed in Figure 5.
Resources 2019, 8, x FOR PEER REVIEW 7 of 17
2.4. Implementation of Process Mining into Mining Domain—Approach and Challenges
The main challenge of PM implementation into the mining domain is the preparation of a suitable event log, which reflects the process stages (activities) properly and enables analysis for valuable insights regarding the process improvement.
Nowadays, mining companies are well equipped with various IT systems (from SCADA to ERP class of solutions), supplying data pipeline with a different kind of information and data abstraction level; however, the crucial processes in a mining operation (related to technological operations) are mainly supported by low-level monitoring systems. A monitoring system can record hundreds of sensors or PLC readings (variables of binary or real type) with a short time interval (seconds, milliseconds); hence, the direct analysis of raw data is pointless from process analytics point of view.
PM implementation in the mining domain requires preparation phases, which are presented in Figure 4.
Figure 4. A general approach of PM implementation into mining domain.
The main preparation phases include data pre-processing, activity definition, and event log creation.
Mining environments, such as moisture, dust, temperature, vibrations, and others, very often influence sensor readings. Data pre-processing is needed to exclude outliers or abnormal behavior to utilize the data for identifying process steps or machine conditions (in addition to standard data quality checking). A commonly used quantitative approach for cleaning or smoothing data is the so-called robust regression [57]. The objective of this technique is to identify the impact of a data outlier on the whole data set. In case the relevance of such outliers is found to be insignificant, the course of the data set can be smoothened. The result of this technique is visualized on the basis of an exemplary data set displayed in Figure 5.
Figure 5. Result of Robust Quadratic Regression for data cleaning/smoothing of a hydraulics signal [36].
Figure 5. Result of Robust Quadratic Regression for data cleaning/smoothing of a hydraulics signal [36].
Robust Quadratic Regression was applied in the given case. Cleaned data are further used in theactivity definition phase.
Resources 2020, 9, 17 8 of 17
The next step, activity definition phase can be seen as a transition from raw data to the eventsthat represent the execution of activity in a process [58]. In the PM domain, such issue is known asevent abstraction. In the same sense, human activity recognition (HAR) can be seen [59]. Variousapproaches for event abstraction can be used in this phase: unsupervised learning (e.g., clustering),supervised learning (e.g., classification with labeled data), behavioral patterns analysis, and others.A recent review on this subject is presented in [58].
In the case of mining processes, widely known approaches (e.g., clustering) are often failingbecause of the high variability of the process itself. There can be discovered states or activities (onvarious levels of abstraction), which cannot be easily interpreted, even by domain experts. On the otherside, unsupervised techniques can bring interesting insights in the form of automatically discoveredabnormal states in process realization, which can be helpful, e.g., for predictive maintenance purposes.For general process activity definition, supervised techniques seem to be more suitable due to clearrules for activity labeling provided by a domain expert.
A crucial issue that is related to the creation of an event log is its level of abstraction. A toogeneral level (e.g., the definition of “ working”, “ idle”, “ traveling”, “ not working”) will not providevaluable findings for process improvement. On the other hand, a low level of event log abstractioncan produce too complex and too detailed process models, thus making analysis difficult. The useof rule-based activity definition (labeling by experts) should guarantee the proper level of event logabstraction; however, it is strongly related to analytic needs and the involvement of domain experts.Dependency on the domain expert to provide the necessary information is one of the main limitationsof the existing approaches in event log preparation. However, combining approaches from differentareas (e.g., complex event processing) is seen as interesting future work of the PM community inthe integration of separately developed ideas and techniques into more generic solutions that enableevent abstraction [58]. Until then, the creation of a well-abstracted event log will rather be based onan adaptive approach in the mining domain, while taking process complexity and variability intoconsideration. The proposal of the adaptive approach for longwall mining, also dealing with otherissues related to event log creation (e.g., lack of case id), was presented in [26].
In the next section, we present our results for PM application to the data of a roof bolter machine,starting with the description of our event log creation.
3. Results
3.1. Process Description and Event Log Creation
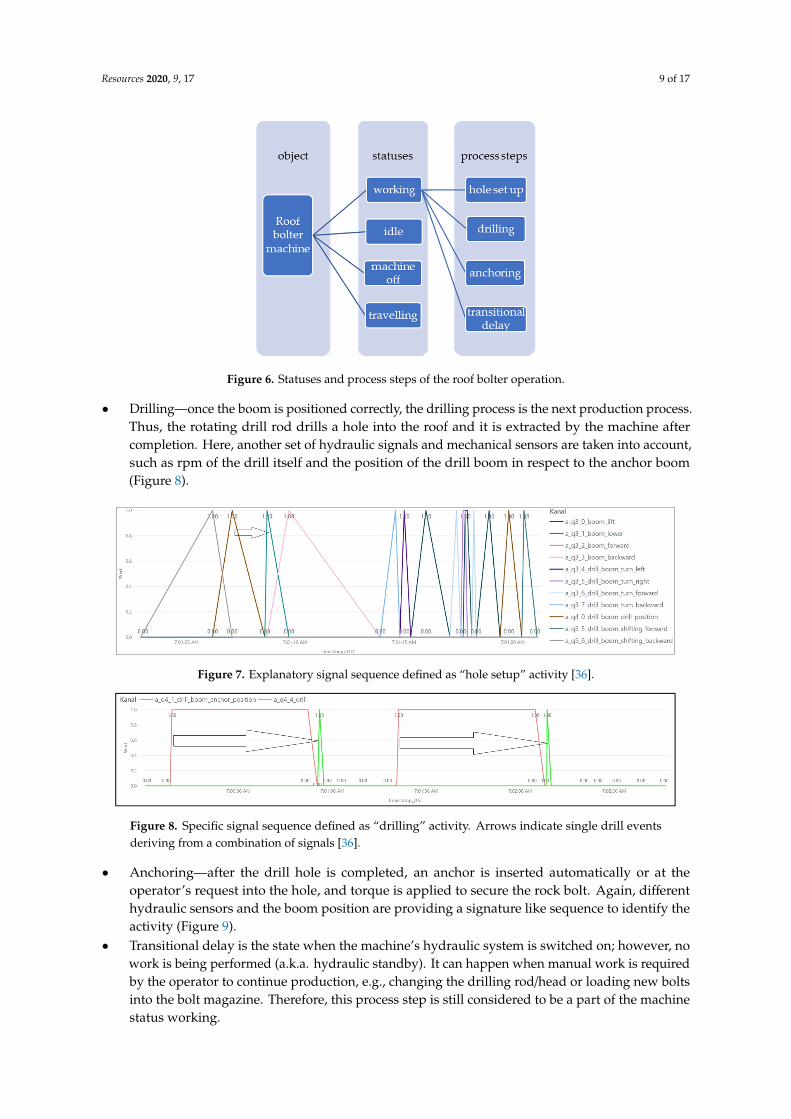
The roof bolter’s primary objective is to secure the overlying strata of mining tunnels by installingrock bolts. The machine’s status can always be defined as either “idle”, “ machine off”, “ traveling”,or “working“, as can be seen in Figure 6.
For a more detailed performance analysis, the process steps that are carried out in the machinestatus defined as “working“ have been identified by utilizing corresponding characteristic machinedata streams.
The machine status working is subdivided into the process steps: “anchoring”, “transitionaldelay”, “hole setup”, and “drilling”, all of which are only possible when the machine´s drilling mode(opposite to driving mode) is activated, and the hydraulic support legs are extended.
The contained activities of working status are defined by the set of rules provided by a domainexpert. Different relevant signals sourced from the machine are taken into account and pre-processedto achieve a suitable classification of activities. The activities are classified, as follows:
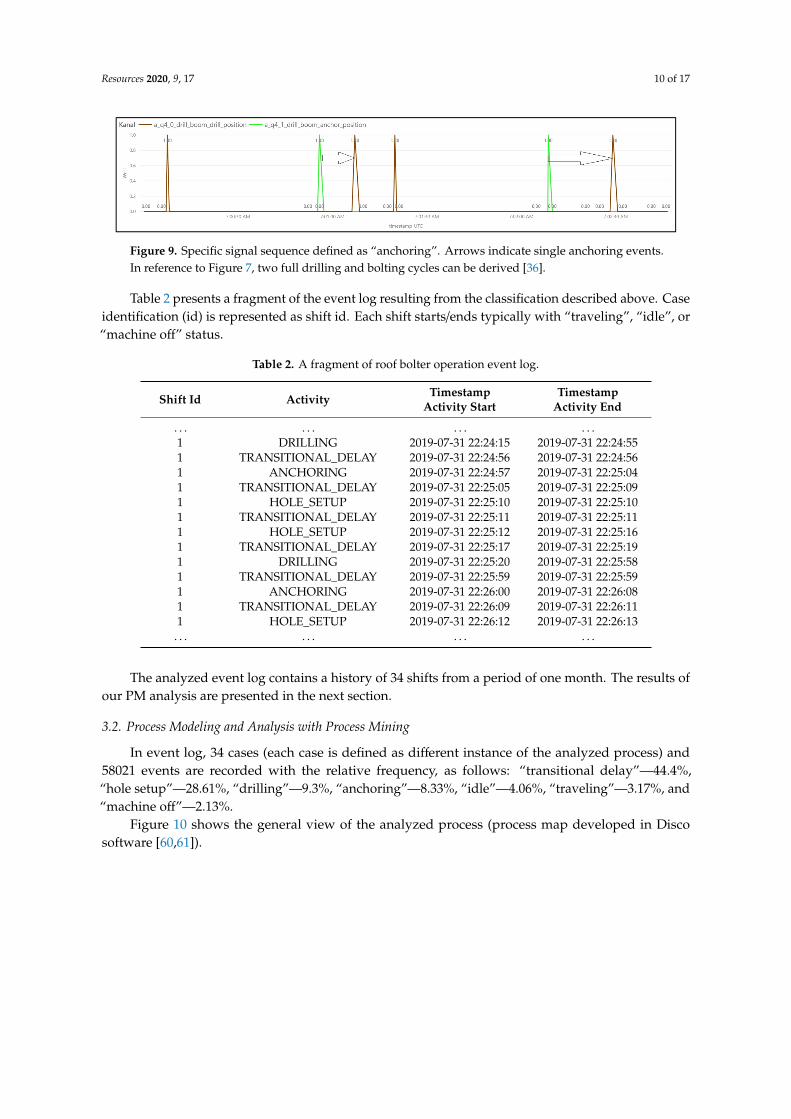
• Hole setup—before the hole can be drilled and directly after a bolt is installed, the boom needs tobe positioned under the initial/next planned drill hole. This process is called the hole setup and itis defined by a number of hydraulic signals, which are indicating boom movement in differentdirections, as can be seen in Figure 7.
Resources 2020, 9, 17 9 of 17
Resources 2019, 8, x FOR PEER REVIEW 8 of 17
Robust Quadratic Regression was applied in the given case. Cleaned data are further used in the activity definition phase.
The next step, activity definition phase can be seen as a transition from raw data to the events that represent the execution of activity in a process [58]. In the PM domain, such issue is known as event abstraction. In the same sense, human activity recognition (HAR) can be seen [59]. Various approaches for event abstraction can be used in this phase: unsupervised learning (e.g., clustering), supervised learning (e.g., classification with labeled data), behavioral patterns analysis, and others. A recent review on this subject is presented in [58].
In the case of mining processes, widely known approaches (e.g., clustering) are often failing because of the high variability of the process itself. There can be discovered states or activities (on various levels of abstraction), which cannot be easily interpreted, even by domain experts. On the other side, unsupervised techniques can bring interesting insights in the form of automatically discovered abnormal states in process realization, which can be helpful, e.g., for predictive maintenance purposes. For general process activity definition, supervised techniques seem to be more suitable due to clear rules for activity labeling provided by a domain expert.
A crucial issue that is related to the creation of an event log is its level of abstraction. A too general level (e.g., the definition of “ working”, “ idle”, “ traveling”, “ not working”) will not provide valuable findings for process improvement. On the other hand, a low level of event log abstraction can produce too complex and too detailed process models, thus making analysis difficult. The use of rule-based activity definition (labeling by experts) should guarantee the proper level of event log abstraction; however, it is strongly related to analytic needs and the involvement of domain experts. Dependency on the domain expert to provide the necessary information is one of the main limitations of the existing approaches in event log preparation. However, combining approaches from different areas (e.g., complex event processing) is seen as interesting future work of the PM community in the integration of separately developed ideas and techniques into more generic solutions that enable event abstraction [58]. Until then, the creation of a well-abstracted event log will rather be based on an adaptive approach in the mining domain, while taking process complexity and variability into consideration. The proposal of the adaptive approach for longwall mining, also dealing with other issues related to event log creation (e.g., lack of case id), was presented in [26].
In the next section, we present our results for PM application to the data of a roof bolter machine, starting with the description of our event log creation.
3. Results
3.1. Process Description and Event Log Creation
The roof bolter’s primary objective is to secure the overlying strata of mining tunnels by installing rock bolts. The machine’s status can always be defined as either “idle”, “ machine off”, “ traveling”, or “working“, as can be seen in Figure 6.
Figure 6. Statuses and process steps of the roof bolter operation.
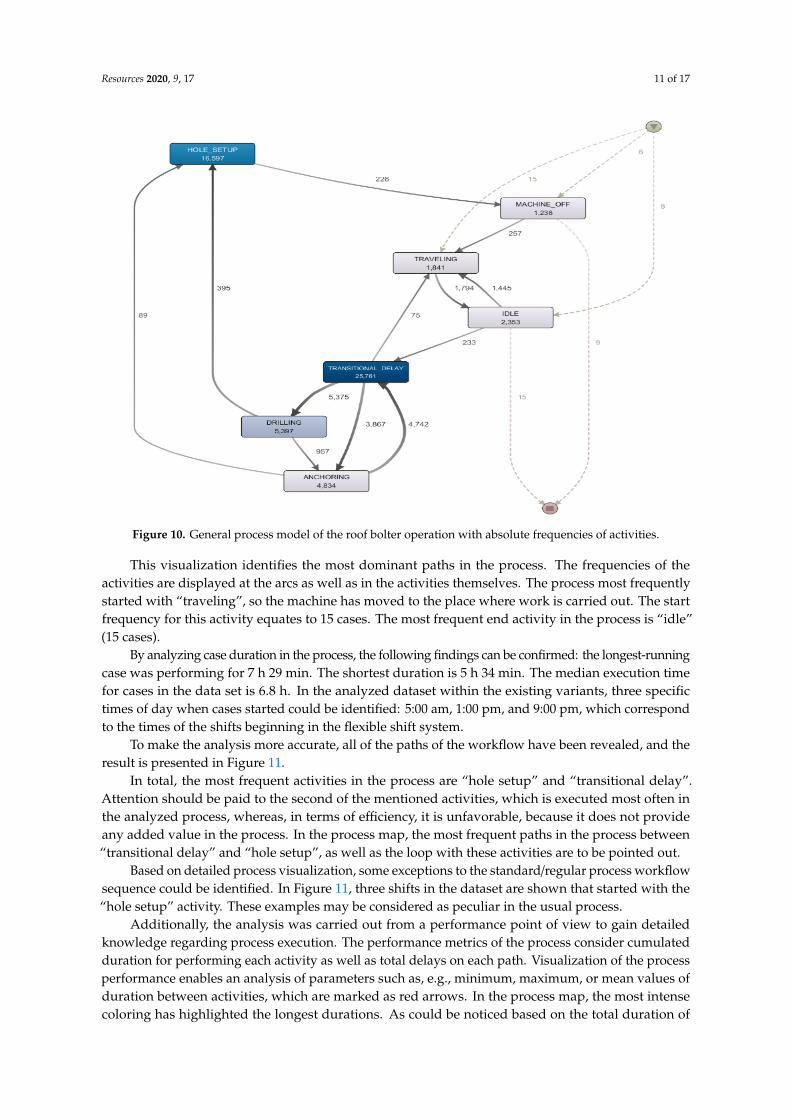
• Drilling—once the boom is positioned correctly, the drilling process is the next production process.Thus, the rotating drill rod drills a hole into the roof and it is extracted by the machine aftercompletion. Here, another set of hydraulic signals and mechanical sensors are taken into account,such as rpm of the drill itself and the position of the drill boom in respect to the anchor boom(Figure 8).
Resources 2019, 8, x FOR PEER REVIEW 9 of 17
Figure 6. Statuses and process steps of the roof bolter operation.
For a more detailed performance analysis, the process steps that are carried out in the machine status defined as “working“ have been identified by utilizing corresponding characteristic machine data streams.
The machine status working is subdivided into the process steps: "anchoring", "transitional delay", “hole setup”, and “drilling”, all of which are only possible when the machine´s drilling mode (opposite to driving mode) is activated, and the hydraulic support legs are extended.
The contained activities of working status are defined by the set of rules provided by a domain expert. Different relevant signals sourced from the machine are taken into account and pre-processed to achieve a suitable classification of activities. The activities are classified, as follows:
• Hole setup—before the hole can be drilled and directly after a bolt is installed, the boom needs to be positioned under the initial/next planned drill hole. This process is called the hole setup and it is defined by a number of hydraulic signals, which are indicating boom movement in different directions, as can be seen in Figure 7.
Figure 7. Explanatory signal sequence defined as "hole setup" activity [36].
• Drilling—once the boom is positioned correctly, the drilling process is the next production process. Thus, the rotating drill rod drills a hole into the roof and it is extracted by the machine after completion. Here, another set of hydraulic signals and mechanical sensors are taken into account, such as rpm of the drill itself and the position of the drill boom in respect to the anchor boom (Figure 8).
Figure 8. Specific signal sequence defined as "drilling" activity. Arrows indicate single drill events deriving from a combination of signals [36].
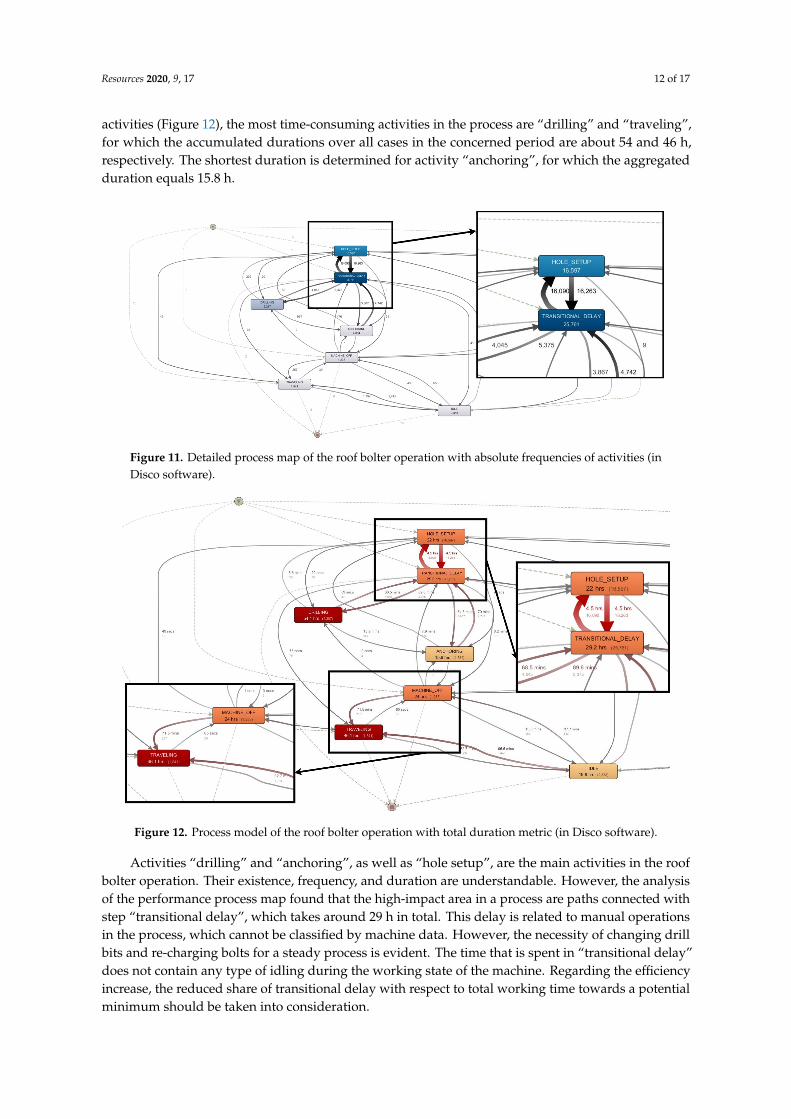
• Anchoring—after the drill hole is completed, an anchor is inserted automatically or at the operator's request into the hole, and torque is applied to secure the rock bolt. Again, different hydraulic sensors and the boom position are providing a signature like sequence to identify the activity (Figure 9).
Figure 7. Explanatory signal sequence defined as “hole setup” activity [36].
Resources 2019, 8, x FOR PEER REVIEW 9 of 17
Figure 6. Statuses and process steps of the roof bolter operation.
For a more detailed performance analysis, the process steps that are carried out in the machine status defined as “working“ have been identified by utilizing corresponding characteristic machine data streams.
The machine status working is subdivided into the process steps: "anchoring", "transitional delay", “hole setup”, and “drilling”, all of which are only possible when the machine´s drilling mode (opposite to driving mode) is activated, and the hydraulic support legs are extended.
The contained activities of working status are defined by the set of rules provided by a domain expert. Different relevant signals sourced from the machine are taken into account and pre-processed to achieve a suitable classification of activities. The activities are classified, as follows:
• Hole setup—before the hole can be drilled and directly after a bolt is installed, the boom needs to be positioned under the initial/next planned drill hole. This process is called the hole setup and it is defined by a number of hydraulic signals, which are indicating boom movement in different directions, as can be seen in Figure 7.
Figure 7. Explanatory signal sequence defined as "hole setup" activity [36].
• Drilling—once the boom is positioned correctly, the drilling process is the next production process. Thus, the rotating drill rod drills a hole into the roof and it is extracted by the machine after completion. Here, another set of hydraulic signals and mechanical sensors are taken into account, such as rpm of the drill itself and the position of the drill boom in respect to the anchor boom (Figure 8).
Figure 8. Specific signal sequence defined as "drilling" activity. Arrows indicate single drill events deriving from a combination of signals [36].
• Anchoring—after the drill hole is completed, an anchor is inserted automatically or at the operator's request into the hole, and torque is applied to secure the rock bolt. Again, different hydraulic sensors and the boom position are providing a signature like sequence to identify the activity (Figure 9).
Figure 8. Specific signal sequence defined as “drilling” activity. Arrows indicate single drill eventsderiving from a combination of signals [36].
• Anchoring—after the drill hole is completed, an anchor is inserted automatically or at theoperator’s request into the hole, and torque is applied to secure the rock bolt. Again, differenthydraulic sensors and the boom position are providing a signature like sequence to identify theactivity (Figure 9).
• Transitional delay is the state when the machine’s hydraulic system is switched on; however, nowork is being performed (a.k.a. hydraulic standby). It can happen when manual work is requiredby the operator to continue production, e.g., changing the drilling rod/head or loading new boltsinto the bolt magazine. Therefore, this process step is still considered to be a part of the machinestatus working.
Resources 2020, 9, 17 10 of 17Resources 2019, 8, x FOR PEER REVIEW 10 of 17
Figure 9. Specific signal sequence defined as "anchoring". Arrows indicate single anchoring events. In reference to Figure 7, two full drilling and bolting cycles can be derived [36].
• Transitional delay is the state when the machine's hydraulic system is switched on; however, no work is being performed (a.k.a. hydraulic standby). It can happen when manual work is required by the operator to continue production, e.g., changing the drilling rod/head or loading new bolts into the bolt magazine. Therefore, this process step is still considered to be a part of the machine status working.
Table 2 presents a fragment of the event log resulting from the classification described above. Case identification (id) is represented as shift id. Each shift starts/ends typically with "traveling", "idle", or "machine off" status.
Table 2. A fragment of roof bolter operation event log.
Shift id Activity Timestamp
Activity Start Timestamp
Activity End … … … … 1 DRILLING 2019-07-31 22:24:15 2019-07-31 22:24:55 1 TRANSITIONAL_DELAY 2019-07-31 22:24:56 2019-07-31 22:24:56 1 ANCHORING 2019-07-31 22:24:57 2019-07-31 22:25:04 1 TRANSITIONAL_DELAY 2019-07-31 22:25:05 2019-07-31 22:25:09 1 HOLE_SETUP 2019-07-31 22:25:10 2019-07-31 22:25:10 1 TRANSITIONAL_DELAY 2019-07-31 22:25:11 2019-07-31 22:25:11 1 HOLE_SETUP 2019-07-31 22:25:12 2019-07-31 22:25:16 1 TRANSITIONAL_DELAY 2019-07-31 22:25:17 2019-07-31 22:25:19 1 DRILLING 2019-07-31 22:25:20 2019-07-31 22:25:58 1 TRANSITIONAL_DELAY 2019-07-31 22:25:59 2019-07-31 22:25:59 1 ANCHORING 2019-07-31 22:26:00 2019-07-31 22:26:08 1 TRANSITIONAL_DELAY 2019-07-31 22:26:09 2019-07-31 22:26:11 1 HOLE_SETUP 2019-07-31 22:26:12 2019-07-31 22:26:13
… … … …
The analyzed event log contains a history of 34 shifts from a period of one month. The results of our PM analysis are presented in the next section.
3.2. Process Modeling and Analysis with Process Mining
In event log, 34 cases (each case is defined as different instance of the analyzed process) and 58021 events are recorded with the relative frequency, as follows: "transitional delay"—44.4%, "hole setup"—28.61%, "drilling"—9.3%, "anchoring"—8.33%, "idle"—4.06%, "traveling"—3.17%, and "machine off"—2.13%.
Figure 10 shows the general view of the analyzed process (process map developed in Disco software [60,61]).
Figure 9. Specific signal sequence defined as “anchoring”. Arrows indicate single anchoring events.In reference to Figure 7, two full drilling and bolting cycles can be derived [36].
Table 2 presents a fragment of the event log resulting from the classification described above. Caseidentification (id) is represented as shift id. Each shift starts/ends typically with “traveling”, “idle”, or“machine off” status.
Table 2. A fragment of roof bolter operation event log.
Shift Id Activity TimestampActivity Start
TimestampActivity End
. . . . . . . . . . . .1 DRILLING 2019-07-31 22:24:15 2019-07-31 22:24:551 TRANSITIONAL_DELAY 2019-07-31 22:24:56 2019-07-31 22:24:561 ANCHORING 2019-07-31 22:24:57 2019-07-31 22:25:041 TRANSITIONAL_DELAY 2019-07-31 22:25:05 2019-07-31 22:25:091 HOLE_SETUP 2019-07-31 22:25:10 2019-07-31 22:25:101 TRANSITIONAL_DELAY 2019-07-31 22:25:11 2019-07-31 22:25:111 HOLE_SETUP 2019-07-31 22:25:12 2019-07-31 22:25:161 TRANSITIONAL_DELAY 2019-07-31 22:25:17 2019-07-31 22:25:191 DRILLING 2019-07-31 22:25:20 2019-07-31 22:25:581 TRANSITIONAL_DELAY 2019-07-31 22:25:59 2019-07-31 22:25:591 ANCHORING 2019-07-31 22:26:00 2019-07-31 22:26:081 TRANSITIONAL_DELAY 2019-07-31 22:26:09 2019-07-31 22:26:111 HOLE_SETUP 2019-07-31 22:26:12 2019-07-31 22:26:13. . . . . . . . . . . .
The analyzed event log contains a history of 34 shifts from a period of one month. The results ofour PM analysis are presented in the next section.
3.2. Process Modeling and Analysis with Process Mining
In event log, 34 cases (each case is defined as different instance of the analyzed process) and58021 events are recorded with the relative frequency, as follows: “transitional delay”—44.4%,“hole setup”—28.61%, “drilling”—9.3%, “anchoring”—8.33%, “idle”—4.06%, “traveling”—3.17%, and“machine off”—2.13%.
Figure 10 shows the general view of the analyzed process (process map developed in Discosoftware [60,61]).
Resources 2020, 9, 17 11 of 17Resources 2019, 8, x FOR PEER REVIEW 11 of 17
Figure 10. General process model of the roof bolter operation with absolute frequencies of activities.
This visualization identifies the most dominant paths in the process. The frequencies of the activities are displayed at the arcs as well as in the activities themselves. The process most frequently started with "traveling", so the machine has moved to the place where work is carried out. The start frequency for this activity equates to 15 cases. The most frequent end activity in the process is "idle" (15 cases).
By analyzing case duration in the process, the following findings can be confirmed: the longest-running case was performing for 7 h 29 min. The shortest duration is 5 h 34 min. The median execution time for cases in the data set is 6.8 h. In the analyzed dataset within the existing variants, three specific times of day when cases started could be identified: 5:00 am, 1:00 pm, and 9:00 pm, which correspond to the times of the shifts beginning in the flexible shift system.
To make the analysis more accurate, all of the paths of the workflow have been revealed, and the result is presented in Figure 11.
Figure 10. General process model of the roof bolter operation with absolute frequencies of activities.
This visualization identifies the most dominant paths in the process. The frequencies of theactivities are displayed at the arcs as well as in the activities themselves. The process most frequentlystarted with “traveling”, so the machine has moved to the place where work is carried out. The startfrequency for this activity equates to 15 cases. The most frequent end activity in the process is “idle”(15 cases).
By analyzing case duration in the process, the following findings can be confirmed: the longest-runningcase was performing for 7 h 29 min. The shortest duration is 5 h 34 min. The median execution timefor cases in the data set is 6.8 h. In the analyzed dataset within the existing variants, three specifictimes of day when cases started could be identified: 5:00 am, 1:00 pm, and 9:00 pm, which correspondto the times of the shifts beginning in the flexible shift system.
To make the analysis more accurate, all of the paths of the workflow have been revealed, and theresult is presented in Figure 11.
In total, the most frequent activities in the process are “hole setup” and “transitional delay”.Attention should be paid to the second of the mentioned activities, which is executed most often inthe analyzed process, whereas, in terms of efficiency, it is unfavorable, because it does not provideany added value in the process. In the process map, the most frequent paths in the process between“transitional delay” and “hole setup”, as well as the loop with these activities are to be pointed out.
Based on detailed process visualization, some exceptions to the standard/regular process workflowsequence could be identified. In Figure 11, three shifts in the dataset are shown that started with the“hole setup” activity. These examples may be considered as peculiar in the usual process.
Additionally, the analysis was carried out from a performance point of view to gain detailedknowledge regarding process execution. The performance metrics of the process consider cumulatedduration for performing each activity as well as total delays on each path. Visualization of the processperformance enables an analysis of parameters such as, e.g., minimum, maximum, or mean values ofduration between activities, which are marked as red arrows. In the process map, the most intensecoloring has highlighted the longest durations. As could be noticed based on the total duration of
Resources 2020, 9, 17 12 of 17
activities (Figure 12), the most time-consuming activities in the process are “drilling” and “traveling”,for which the accumulated durations over all cases in the concerned period are about 54 and 46 h,respectively. The shortest duration is determined for activity “anchoring”, for which the aggregatedduration equals 15.8 h.
Resources 2019, 8, x FOR PEER REVIEW 11 of 17
Figure 10. General process model of the roof bolter operation with absolute frequencies of activities.
This visualization identifies the most dominant paths in the process. The frequencies of the activities are displayed at the arcs as well as in the activities themselves. The process most frequently started with "traveling", so the machine has moved to the place where work is carried out. The start frequency for this activity equates to 15 cases. The most frequent end activity in the process is "idle" (15 cases).
By analyzing case duration in the process, the following findings can be confirmed: the longest-running case was performing for 7 h 29 min. The shortest duration is 5 h 34 min. The median execution time for cases in the data set is 6.8 h. In the analyzed dataset within the existing variants, three specific times of day when cases started could be identified: 5:00 am, 1:00 pm, and 9:00 pm, which correspond to the times of the shifts beginning in the flexible shift system.
To make the analysis more accurate, all of the paths of the workflow have been revealed, and the result is presented in Figure 11.
Figure 11. Detailed process map of the roof bolter operation with absolute frequencies of activities (inDisco software).
Resources 2019, 8, x FOR PEER REVIEW 12 of 17
Figure 11. Detailed process map of the roof bolter operation with absolute frequencies of activities (in Disco software).
In total, the most frequent activities in the process are "hole setup" and "transitional delay". Attention should be paid to the second of the mentioned activities, which is executed most often in the analyzed process, whereas, in terms of efficiency, it is unfavorable, because it does not provide any added value in the process. In the process map, the most frequent paths in the process between "transitional delay" and "hole setup", as well as the loop with these activities are to be pointed out.
Based on detailed process visualization, some exceptions to the standard/regular process workflow sequence could be identified. In Figure 11, three shifts in the dataset are shown that started with the "hole setup" activity. These examples may be considered as peculiar in the usual process.
Additionally, the analysis was carried out from a performance point of view to gain detailed knowledge regarding process execution. The performance metrics of the process consider cumulated duration for performing each activity as well as total delays on each path. Visualization of the process performance enables an analysis of parameters such as, e.g., minimum, maximum, or mean values of duration between activities, which are marked as red arrows. In the process map, the most intense coloring has highlighted the longest durations. As could be noticed based on the total duration of activities (Figure 12), the most time-consuming activities in the process are "drilling" and "traveling", for which the accumulated durations over all cases in the concerned period are about 54 and 46 h, respectively. The shortest duration is determined for activity "anchoring", for which the aggregated duration equals 15.8 h.
Figure 12. Process model of the roof bolter operation with total duration metric (in Disco software).
Activities "drilling" and "anchoring", as well as "hole setup", are the main activities in the roof bolter operation. Their existence, frequency, and duration are understandable. However, the analysis of the performance process map found that the high-impact area in a process are paths connected with step "transitional delay", which takes around 29 h in total. This delay is related to manual operations in the process, which cannot be classified by machine data. However, the necessity of changing drill bits and re-charging bolts for a steady process is evident. The time that is spent in "transitional delay" does not contain any type of idling during the working state of the machine. Regarding the efficiency increase, the reduced share of transitional delay with respect to total working time towards a potential minimum should be taken into consideration.
Figure 12. Process model of the roof bolter operation with total duration metric (in Disco software).
Activities “drilling” and “anchoring”, as well as “hole setup”, are the main activities in the roofbolter operation. Their existence, frequency, and duration are understandable. However, the analysisof the performance process map found that the high-impact area in a process are paths connected withstep “transitional delay”, which takes around 29 h in total. This delay is related to manual operationsin the process, which cannot be classified by machine data. However, the necessity of changing drillbits and re-charging bolts for a steady process is evident. The time that is spent in “transitional delay”does not contain any type of idling during the working state of the machine. Regarding the efficiencyincrease, the reduced share of transitional delay with respect to total working time towards a potentialminimum should be taken into consideration.
Resources 2020, 9, 17 13 of 17
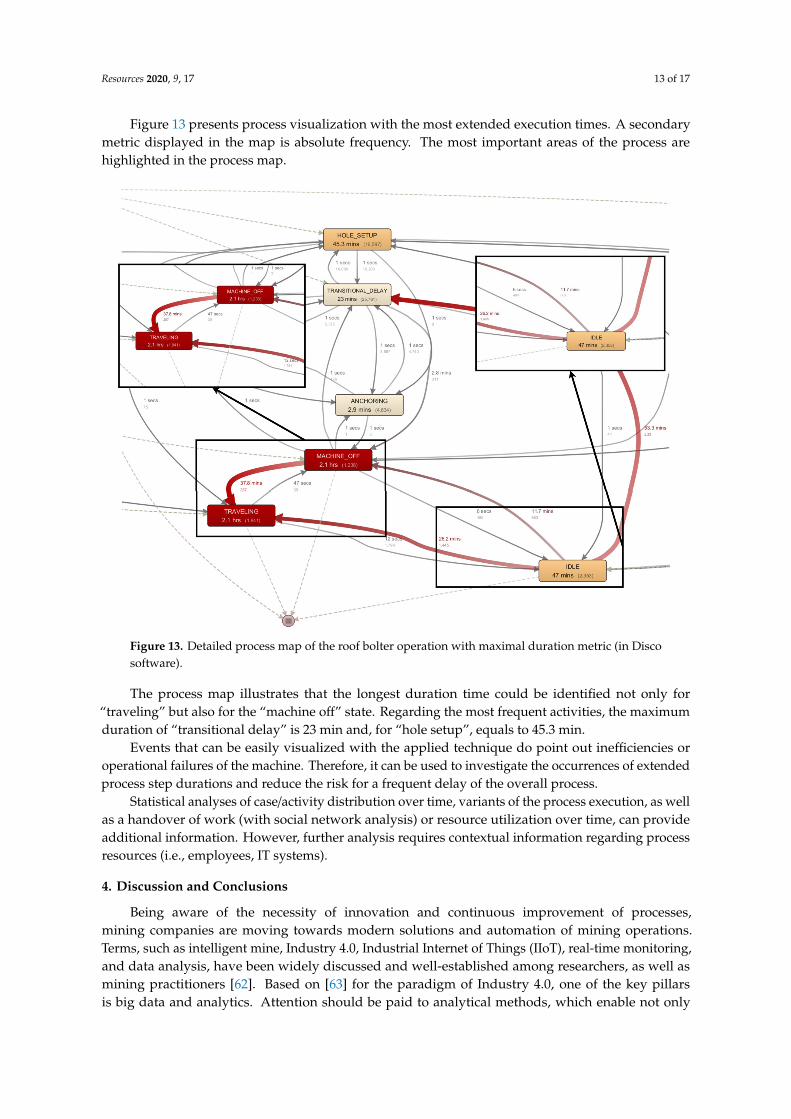
Figure 13 presents process visualization with the most extended execution times. A secondarymetric displayed in the map is absolute frequency. The most important areas of the process arehighlighted in the process map.
Resources 2019, 8, x FOR PEER REVIEW 13 of 17
Figure 13 presents process visualization with the most extended execution times. A secondary metric displayed in the map is absolute frequency. The most important areas of the process are highlighted in the process map.
Figure 13. Detailed process map of the roof bolter operation with maximal duration metric (in Disco software).
The process map illustrates that the longest duration time could be identified not only for "traveling" but also for the "machine off" state. Regarding the most frequent activities, the maximum duration of "transitional delay" is 23 min and, for "hole setup", equals to 45.3 min.
Events that can be easily visualized with the applied technique do point out inefficiencies or operational failures of the machine. Therefore, it can be used to investigate the occurrences of extended process step durations and reduce the risk for a frequent delay of the overall process.
Statistical analyses of case/activity distribution over time, variants of the process execution, as well as a handover of work (with social network analysis) or resource utilization over time, can provide additional information. However, further analysis requires contextual information regarding process resources (i.e., employees, IT systems).
4. Discussion and Conclusions
Being aware of the necessity of innovation and continuous improvement of processes, mining companies are moving towards modern solutions and automation of mining operations. Terms, such as intelligent mine, Industry 4.0, Industrial Internet of Things (IIoT), real-time monitoring, and data analysis, have been widely discussed and well-established among researchers, as well as mining practitioners [62]. Based on [63] for the paradigm of Industry 4.0, one of the key pillars is big data and
Figure 13. Detailed process map of the roof bolter operation with maximal duration metric (in Discosoftware).
The process map illustrates that the longest duration time could be identified not only for“traveling” but also for the “machine off” state. Regarding the most frequent activities, the maximumduration of “transitional delay” is 23 min and, for “hole setup”, equals to 45.3 min.
Events that can be easily visualized with the applied technique do point out inefficiencies oroperational failures of the machine. Therefore, it can be used to investigate the occurrences of extendedprocess step durations and reduce the risk for a frequent delay of the overall process.
Statistical analyses of case/activity distribution over time, variants of the process execution, as wellas a handover of work (with social network analysis) or resource utilization over time, can provideadditional information. However, further analysis requires contextual information regarding processresources (i.e., employees, IT systems).
4. Discussion and Conclusions
Being aware of the necessity of innovation and continuous improvement of processes,mining companies are moving towards modern solutions and automation of mining operations.Terms, such as intelligent mine, Industry 4.0, Industrial Internet of Things (IIoT), real-time monitoring,and data analysis, have been widely discussed and well-established among researchers, as well asmining practitioners [62]. Based on [63] for the paradigm of Industry 4.0, one of the key pillarsis big data and analytics. Attention should be paid to analytical methods, which enable not only
Resources 2020, 9, 17 14 of 17
data-oriented analysis, but primarily the possibility to have insight into processes and turn gatheredinformation into valuable knowledge by identifying process inefficiencies and deviations.
The necessary steps for identifying inefficiencies in processes, according to the BPM cycle,are process modeling and its analysis. In these stages, a wide range of supporting techniques canbe applied. For these purposes, we presented PM as a new analytic approach in the mining domain.The application of PM in mining operations, especially in machine-driven processes, extends thepossibility of sensor data usage, aiming for better process understanding and identification of processinefficiencies. Once inefficiencies are identified, they should be subject to further investigation, whichresults in operational changes, according to the BPM cycle (process redesign and implementation).
We presented an analysis of an example mining process as a case study with selected PMtechniques. Analysis performed on roof bolter operation has enabled:
• identification of possible non-compliant behavior during process execution (i.e., shifts startedwith unusual activities);
• identification of high impacts area in process execution (repetitions and loops betweenactivities—i.e., “transitional delay”—“hole setup”); and,
• identification of time lost in the process (based on activity duration statistics, duration of timebetween activities, especially in working operation time).
The presented results have initially shown the potential of process-oriented analytics in this area.The identified cases supported by contextual information provide decision-makers with opportunitiesto apply changes for improving efficiency (e.g., organizational changes, like work standardization;technological changes, like loop or repetition limitation).
The increase in efficiency and competitiveness of mining companies with PM analysis will probablybe advantageous. With a process-centric approach, mining companies can identify process deviations,and bottlenecks, which are based on event logs from system databases. Using specialized, industrialknowledge, companies can interpret process models and maximize productivity and performanceproperly. Once sufficient activity log data has been evaluated and the PM technique is applied in anautomated manner, notifications on inefficiencies or delays in process chains can be generated withoutmanually setting normal ranges.
The power of PM techniques lays in the reflection of real process behavior recorded in IT systems.Thus, the obtained process models can be treated as more reliable than process observations andcomplementary to other manual process documentation sources.
The mining community has still not discovered PM. Despite raised challenges related to thecreation of relevant event logs in the mining domain, PM might become a new useful analytic foraccelerating process improvement and efficiency. Further, it could play an important role in automatednotification schemes for process and performance monitoring without applying expert knowledge ormanual input. Thus, informing relevant stakeholders on irregularities, failures, and delays, enablingthem to react on identified problems, giving the inputs to increase efficiency of production processes.
As for our future research, the PM application to activity logs of less complex processes, such asloading-hauling-dumping of dump trucks or LHDs/wheel loaders, will most certainly result in an evenmore in-depth understanding and faster identification of inefficiencies.
Author Contributions: Conceptualization, E.B. and M.L.; methodology, E.B.; formal analysis, E.B. and P.G.; datacuration, M.L.; writing—original draft preparation, E.B. and P.G.; writing—review and editing, E.B. and M.L.;visualization, P.G.; supervision, E.B.; project administration, M.L.; funding acquisition, E.B., M.L. All authors haveread and agreed to the published version of the manuscript.
Funding: This research was funded by EIT Raw Materials, grant number 18327—project SmartHUB – smart courier
field data IoT radio network & big data analytics.
Resources 2019, 8, x FOR PEER REVIEW 14 of 17
analytics. Attention should be paid to analytical methods, which enable not only data-oriented analysis, but primarily the possibility to have insight into processes and turn gathered information into valuable knowledge by identifying process inefficiencies and deviations.
The necessary steps for identifying inefficiencies in processes, according to the BPM cycle, are process modeling and its analysis. In these stages, a wide range of supporting techniques can be applied. For these purposes, we presented PM as a new analytic approach in the mining domain. The application of PM in mining operations, especially in machine-driven processes, extends the possibility of sensor data usage, aiming for better process understanding and identification of process inefficiencies. Once inefficiencies are identified, they should be subject to further investigation, which results in operational changes, according to the BPM cycle (process redesign and implementation).
We presented an analysis of an example mining process as a case study with selected PM techniques. Analysis performed on roof bolter operation has enabled:
• identification of possible non-compliant behavior during process execution (i.e., shifts started with unusual activities);
• identification of high impacts area in process execution (repetitions and loops between activities – i.e., "transitional delay" – "hole setup"); and,
• identification of time lost in the process (based on activity duration statistics, duration of time between activities, especially in working operation time).
The presented results have initially shown the potential of process-oriented analytics in this area. The identified cases supported by contextual information provide decision-makers with opportunities to apply changes for improving efficiency (e.g., organizational changes, like work standardization; technological changes, like loop or repetition limitation).
The increase in efficiency and competitiveness of mining companies with PM analysis will probably be advantageous. With a process-centric approach, mining companies can identify process deviations, and bottlenecks, which are based on event logs from system databases. Using specialized, industrial knowledge, companies can interpret process models and maximize productivity and performance properly. Once sufficient activity log data has been evaluated and the PM technique is applied in an automated manner, notifications on inefficiencies or delays in process chains can be generated without manually setting normal ranges.
The power of PM techniques lays in the reflection of real process behavior recorded in IT systems. Thus, the obtained process models can be treated as more reliable than process observations and complementary to other manual process documentation sources.
The mining community has still not discovered PM. Despite raised challenges related to the creation of relevant event logs in the mining domain, PM might become a new useful analytic for accelerating process improvement and efficiency. Further, it could play an important role in automated notification schemes for process and performance monitoring without applying expert knowledge or manual input. Thus, informing relevant stakeholders on irregularities, failures, and delays, enabling them to react on identified problems, giving the inputs to increase efficiency of production processes.
As for our future research, the PM application to activity logs of less complex processes, such as loading-hauling-dumping of dump trucks or LHDs/wheel loaders, will most certainly result in an even more in-depth understanding and faster identification of inefficiencies.
Author Contributions: Conceptualization, E.B. and M.L.; methodology, E.B.; formal analysis, E.B. and P.G.; data curation, M.L.; writing—original draft preparation, E.B. and P.G.; writing—review and editing, E.B. and M.L.; visualization, P.G.; supervision, E.B.; project administration, M.L.; funding acquisition, E.B., M.L.
Funding: This research was funded by EIT Raw Materials, grant number 18327—project SmartHUB – smart
courier field data IoT radio network & big data analytics. .
Acknowledgments: Authors would like to thank kindly Lee Bailey, Charlotte Schmitz, Ayoub Essourni, JensWinkelman, and Timo Boße of talpasolutions GmbH for their work on event logs, data mining and data provision.
Resources 2020, 9, 17 15 of 17
Conflicts of Interest: The authors declare no conflict of interest.
References
1. Lööw, J.; Abrahamsson, L.; Johansson, J. Mining 4.0—The Impact of New Technology from a Work PlacePerspective. Mining Metall. Explor. 2019, 36, 701–707. [CrossRef]
2. Ghattas, J.; Soffer, P.; Peleg, M. Improving business process decision making based on past experience.Decision Support Syst. 2014, 59, 93–107. [CrossRef]
3. Lööw, J.; Nygren, M. Initiatives for increased safety in the Swedish mining industry: Studying 30 years ofimproved accident rates. Saf. Sci. 2019, 117, 437–446. [CrossRef]
4. Wojaczek, A.; Wojaczek, A.K. Monitoring the environment and machines in underground mine. Zesz. Nauk.Inst. Gosp. Sur. Miner. Energ. PAN. 2017, 99, 57–70.
5. Wojaczek, A.; Wojaczek, A.K. Systemy monitoringu w kopalni podziemnej. Syst. Support. Prod. Eng. 2016, 1,526–536.
6. Jonek-Kowalska, I.; Turek, M. Dependence of total production costs on production and infrastructureparameters in the polish hard coal mining industry. Energies 2017, 10, 1480. [CrossRef]
7. Qiao, W.; Liu, Q.; Li, X.; Luo, X.; Wan, Y.L. Using data mining techniques to analyze the influencing factor ofunsafe behaviors in Chinese underground coal mines. Resour. Policy 2018, 59, 210–216. [CrossRef]
8. Kopacz, M. The impact assessment of quality parameters of coal and waste rock on the value of mininginvestment projects - hard coal deposits. Miner. Resour. Manag. 2015, 31, 161–188. [CrossRef]
9. Bongers, D.R.; Gurgenci, H. Fault Detection and Identification for Longwall Machinery Using SCADA Data.In Complex System Maintenance Handbook. Springer Series in Reliability Engineering; Springer: London, UK,2008; Volume 8, pp. 611–641.
10. Elsayed, E.A. Reliability Prediction and Accelerated Testing; In Complex System Maintenance Handbook.Springer Series in Reliability Engineering; Springer: London, UK, 2008; Volume 8.
11. Al-Chalabi, H.; Ahmadzadeh, F.; Lundberg, J.; Ghodrati, B. Economic lifetime prediction of a mining drillingmachine using an artificial neural network. Int. J. Mining Reclam. Environ. 2014, 28, 311–322. [CrossRef]
12. Bodlak, M.; Kudełko, J.; Zibrow, A. Machine Learning in predicting the extent of gas and rock outburst.E3S Web Conf. 2018, 71. [CrossRef]
13. Moczulski, W. A new decision support tool for fault diagnosis, hazard prediction and analysis in miningindustry—a case study. In Proceedings of the 24th World Mining Congress, Rio de Janeiro, Brazil, 18–21October 2016; pp. 38–48.
14. Mahdevari, S.; Shahriar, K.; Sharifzadeh, M.; Tannant, D.D. Stability prediction of gate roadways in longwallmining using artificial neural networks. Neural Comput. Appl. 2017, 28, 3537–3555. [CrossRef]
15. Boullé, M. Predicting dangerous seismic events in coal mines under distribution drift. In Proceedings ofthe 2016 Federated Conference on Computer Science and Information Systems (FedCSIS), Gdansk, Poland,11–14 September 2016; pp. 221–224.
16. Deb, D.; Kumar, A.; Rosha, R.P.S. Forecasting shield pressures at a longwall face using artificial neuralnetworks. Geotech. Geol. Eng. 2006, 24, 1021–1037. [CrossRef]
17. Verma, A.K.; Kishore, K.; Chatterjee, S. Prediction Model of Longwall Powered Support Capacity UsingField Monitored Data of a Longwall Panel and Uncertainty-Based Neural Network. Geotech. Geol. Eng. 2016,34, 2033–2052. [CrossRef]
18. Gernand, J. Machine Learning Classification Models for More Effective Mine Safety Inspections.In Proceedings of the ASME 2014 International Mechanical Engineering Congress and Exposition, Montreal,QC, Canada, 14–20 November 2014; Volume 14.
19. Hargrave, C.O.; James, C.A.; Ralston, J.C. Infrastructure-based localisation of automated coal miningequipment. Int. J. Coal Sci. Technol. 2017, 4, 252–261. [CrossRef]
20. Jamróz, D.; Niedoba, T. Application of multidimensional data visualization by means of self-organizingKohonen maps to evaluate classification possibilities of various coal types. Arch. Min. Sci. 2015, 60, 39–50.
21. Jedlinski, Ł.; Gajewski, J. Optimal selection of signal features in the diagnostics of mining head tools condition.Tunn. Undergr. Sp. Technol. 2019, 84, 451–460. [CrossRef]

Resources 2020, 9, 17 16 of 17
22. Zhou, J.; Li, X.; Mitri, H.S.; Wang, S.; Wei, W. Identification of large-scale goaf instability in undergroundmine using particle swarm optimization and support vector machine. Int. J. Min. Sci. Technol. 2013, 23,701–707. [CrossRef]
23. van der Aalst, W. Process Mining: Overview and Opportunities. ACM Trans. Manag. Inf. Syst. 2012, 3,7:1–7:17. [CrossRef]
24. van der Aalst, W.M.P. Process mining in the large: A tutorial. Lect. Notes Bus. Inf. Process. 2014, 172, 33–76.25. He, Z.; Wu, Q.; Wen, L.; Fu, G. A process mining approach to improve emergency rescue processes of fatal
gas explosion accidents in Chinese coal mines. Saf. Sci. 2019, 111, 154–166. [CrossRef]26. Brzychczy, E.; Trzcionkowska, A. Creation of an event log from a low-level machinery monitoring system
for process mining purposes. In Intelligent Data Engineering and Automated Learning—IDEAL 2018; Yin, H.,Camacho, D., Novais, P., Tallón-Ballesteros, A.J., Eds.; Springer Nature: Cham, Switzerland, 2018; pp. 54–63.
27. Brzychczy, E.; Trzcionkowska, A. Process-Oriented Approach for Analysis of Sensor Data from LongwallMonitoring System. In Intelligent Systems in Production Engineering and Maintenance; Burduk, A., Chlebus, E.,Nowakowski, T., Tubis, A., Eds.; Springer International Publishing: Cham, Switzerland, 2019; pp. 611–621.
28. David McHutchon, Industry 4.0 in Mining—Challenges and Opportunities. Available online: https://www.minexforum.com/en/industry-4-0-in-mining-challenges-and-opportunities/ (accessed on 25 September 2019).
29. van der Aalst, W.; Zhao, J.L.; Wang, H. Editorial: Business Process Intelligence: Connecting Data andProcesses. ACM Trans. Manag. Inf. Syst. 2015, 5. [CrossRef]
30. Maita, A.R.C.; Martins, L.C.; López Paz, C.R.; Rafferty, L.; Hung, P.C.K.; Peres, S.M.; Fantinato, M. A systematicmapping study of process mining. Enterp. Inf. Syst. 2018, 12, 505–549. [CrossRef]
31. Dumas, M.; La Rosa, M.; Mendling, J.; Reijers, H.A. Fundamentals of Business Process Management; Springer:Berlin/Heidelberg, Germany, 2013; ISBN 9783642331428.
32. Pujari, A.K. Data Mining Techniques; Universities Press: Hyderguda, India, 2001; ISBN 8173713804.33. Azevedo, A. Data Mining and Knowledge Discovery in Databases. In Advanced Methodologies and Technologies
in Network Architecture, Mobile Computing, and Data Analytics; M. Khosrow-Pour, D.B.A., Ed.; IGI Global:Hershey, PA, USA, 2019; pp. 502–514.
34. Larose, D.T.; Larose, C.D. Discovering Knowledge In Data: An Introduction to Data Mining, 2nd ed.; Wiley:Hoboken, NJ, USA, 2014; ISBN 9780470908747.
35. zur Muehlen, M.; Shapiro, R. Business Process Analytics. In Handbook on Business Process Management2: Strategic Alignment, Governance, People and Culture; vom Brocke, J., Rosemann, M., Eds.; Springer:Berlin/Heidelberg, Germany, 2015; pp. 243–263.
36. Internal Documentation of Talpasolutions GmbH. Talpasolutions GmbH; Essen, Germany, Unpublished work; 2018.37. Krot, P.; Sliwinski, P.; Zimroz, R.; Gomolla, N. The identification of operational cycles in the monitoring
systems of underground vehicles. Measurement 2020, 151, 107–111. [CrossRef]38. van der Aalst, W. Process Mining: Data Science in Action; Springer-Verlag: Berlin/Heidelberg, Germany, 2016;
ISBN 9783662498514.39. van der Aalst, W.; Adriansyah, A.; de Medeiros, A.K.A.; Arcieri, F.; Baier, T.; Blickle, T.; Bose, J.C.; van den
Brand, P.; Brandtjen, R.; Buijs, J.; et al. Process Mining Manifesto. Business Process Management Workshops;Daniel, F., Barkaoui, K., Dustdar, S., Eds.; Springer: Berlin/Heidelberg, Germany, 2012; pp. 169–194.
40. van der Aalst, W.M.P. Process-Aware Information Systems: Lessons to Be Learned from Process Mining.In Transactions on Petri Nets and Other Models of Concurrency II: Special Issue on Concurrency in Process-AwareInformation Systems; Jensen, K., van der Aalst, W.M.P., Eds.; Springer: Berlin/Heidelberg, Germany, 2009;pp. 1–26.
41. Leemans, S.J.J.; Poppe, E.; Wynn, M.T. Directly Follows-Based Process Mining: Exploration & a Case Study.In Proceedings of the 2019 International Conference on Process Mining (ICPM), Aachen, Germany, 24–26June 2019; pp. 25–32.
42. van der Aalst, W.M.P. Decomposing Petri Nets for Process Mining: A Generic Approach. Distrib. ParallelDatabases 2013, 31, 471–507. [CrossRef]
43. van Der Aalst, W.M.P.; Van Hee, K.M.; Ter Hofstede, A.H.M.; Sidorova, N.; Verbeek, H.M.W.; Voorhoeve, M.;Wynn, M.T. Soundness of workflow nets: Classification, decidability, and analysis. Form. Asp. Comput. 2011,23, 333–363. [CrossRef]
Resources 2020, 9, 17 17 of 17
44. Bauer, M.; Senderovich, A.; Gal, A.; Grunske, L.; Weidlich, M. How Much Event Data Is Enough? A StatisticalFramework for Process Discovery. In Advanced Information Systems Engineering. CAiSE 2018; Krogstie, J.,Reijers, H., Eds.; Springer: Cham, Switzerland, 2018; pp. 239–256.
45. Kerremans, M. Market Guide for Process Mining. Gartner 2019, 1–33.46. Bru, F.; Claes, J. The perceived quality of process discovery tools. arXiv 2018, arXiv:1808.06475. Available
online: https://arxiv.org/ftp/arxiv/papers/1808/1808.06475.pdf (accessed on 1 February 2020).47. Claes, J.; Poels, G. Process Mining and the ProM Framework: An Exploratory Survey. In Proceedings of the
Business Process Management Workshops; La Rosa, M., Soffer, P., Eds.; Springer: Berlin/Heidelberg, Germany,2013; pp. 187–198.
48. La Rosa, M.; Reijers, H.A.; Van Der Aalst, W.M.P.; Dijkman, R.M.; Mendling, J.; Dumas, M.; García-Bañuelos, L.APROMORE: An advanced process model repository. Expert Syst. Appl. 2011, 38, 7029–7040. [CrossRef]
49. Nguyen, H.; Dumas, M.; ter Hofstede, A.H.M.; La Rosa, M.; Maggi, F.M. Business Process PerformanceMining with Staged Process Flows. In Advanced Information Systems Engineering; Nurcan, S., Soffer, P.,Bajec, M., Eder, J., Eds.; Springer International Publishing: Cham, Switzerland, 2016; pp. 167–185.
50. Dees, M.; de Leoni, M.; Mannhardt, F. Enhancing Process Models to Improve Business Performance:A Methodology and Case Studies. In On the Move to Meaningful Internet Systems. OTM 2017 Conferences;Panetto, H., Debruyne, C., Gaaloul, W., Papazoglou, M., Paschke, A., Ardagna, C.A., Meersman, R., Eds.;Springer International Publishing: Cham, Switzerland, 2017; pp. 232–251.
51. dos Santos Garcia, C.; Meincheim, A.; Faria Junior, E.R.; Dallagassa, M.R.; Sato, D.M.V.; Carvalho, D.R.;Santos, E.A.P.; Scalabrin, E.E. Process mining techniques and applications—A systematic mapping study.Expert Syst. Appl. 2019, 133, 260–295. [CrossRef]
52. Rozinat, A.; de Jong, I.S.M.; Günther, C.W.; van der Aalst, W.M.P. Process mining applied to the test processof wafer scanners in ASML. IEEE Trans. Syst. Man Cybern. Part C Appl. Rev. 2009, 39, 474–479. [CrossRef]
53. Liu, T.; Yi, H.; Ni, Z.; Liu, X. A closed-loop workflow management technique based on process mining.In Proceedings of the 15th International Conference on Mechatronics and Machine Vision in Practice,Auckland, New Zealand, 2–4 December 2008; pp. 435–440.
54. Ho, G.T.S.; Lau, H.C.W. Development of an olap–fuzzy based process mining system for quality improvement.IFIP Int. Fed. Inf. Process. 2006, 228, 243–258.
55. Lee, S.K.; Kim, B.; Huh, M.; Cho, S.; Park, S.; Lee, D. Mining transportation logs for understanding theafter-assembly block manufacturing process in the shipbuilding industry. Expert Syst. Appl. 2013, 40, 83–95.[CrossRef]
56. Myers, D.; Suriadi, S.; Radke, K.; Foo, E. Anomaly detection for industrial control systems using processmining. Comput. Secur. 2018, 78, 103–125. [CrossRef]
57. Cleveland, W.S. Robust Locally Weighted Regression and Smoothing Scatterplots. J. Am. Stat. Assoc. 1979,74, 829–836. [CrossRef]
58. Diba, K.; Batoulis, K.; Weidlich, M.; Weske, M. Extraction, correlation, and abstraction of event data forprocess mining. WIREs Data Mining Knowl Discov. 2019, e1346. [CrossRef]
59. Riboni, D.; Murtas, M. Sensor-based activity recognition: One picture is worth a thousand words. Future Gen.Computer Syst. 2019, 101, 709–722. [CrossRef]
60. Günther, C.W.; Rozinat, A. Disco: Discover your processes. In Proceedings of the Demonstration Track ofthe 10th International Conference on Business Process Management, BPM Demos 2012, Tallinn, Estonia,4 September 2012; pp. 40–44.
61. Disco User Guide. Available online: https://fluxicon.com/book/read/reference/ (accessed on 15 October 2019).62. Zyrek, L.; Zasadni, W.; Lubryka, J.; Szołtysik, R. ENDIS 4.0 as replay on requirements of Industry 4.0 in
field of power supply and automation for mining. Min. – Informatics, Autom. Electr. Eng. 2018, 533, 95–100.[CrossRef]
63. Vaidya, S.; Ambad, P.; Bhosle, S. Industry 4.0—A Glimpse. Procedia Manuf. 2018, 20, 233–238. [CrossRef]
© 2020 by the authors. Licensee MDPI, Basel, Switzerland. This article is an open accessarticle distributed under the terms and conditions of the Creative Commons Attribution(CC BY) license (http://creativecommons.org/licenses/by/4.0/).