Embed Size (px)
Citation preview
Data assimilation in land surface schemes
Mathew WilliamsUniversity of Edinburgh
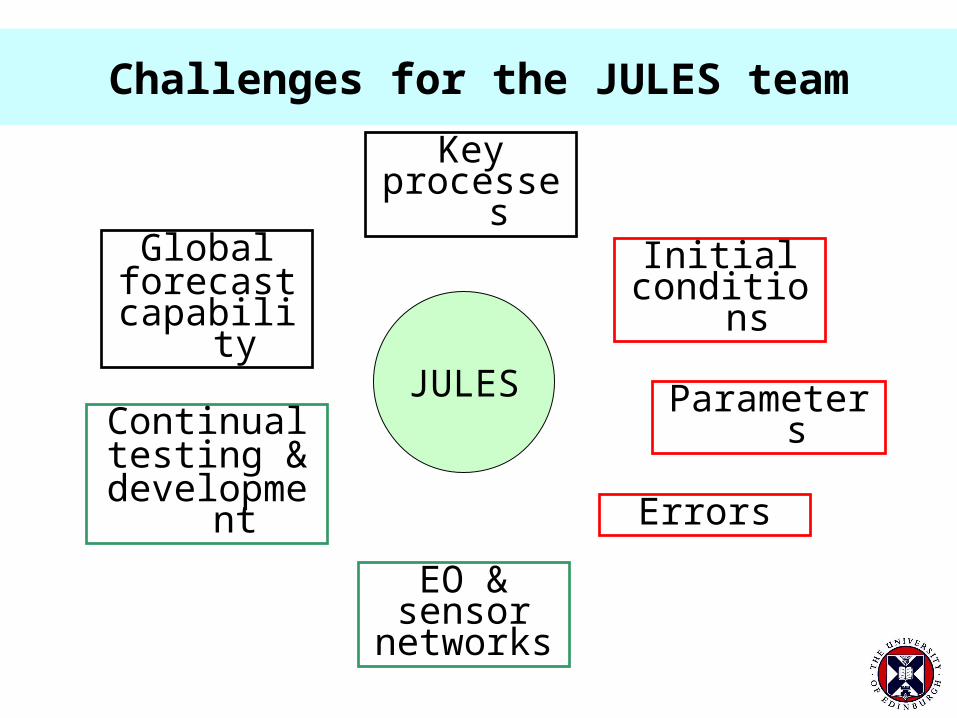
Globalforecast
capability
Keyprocesses
Challenges for the JULES team
Initialconditions
Parameters
Errors
EO &sensor
networks
Continualtesting &
development
JULES
The philosophy of data assimilation
• Observations and models contain useful information about the target system
• But ALL observations and models are subject to error - and may be subject to bias
• Models and observations can be combined to optimise information
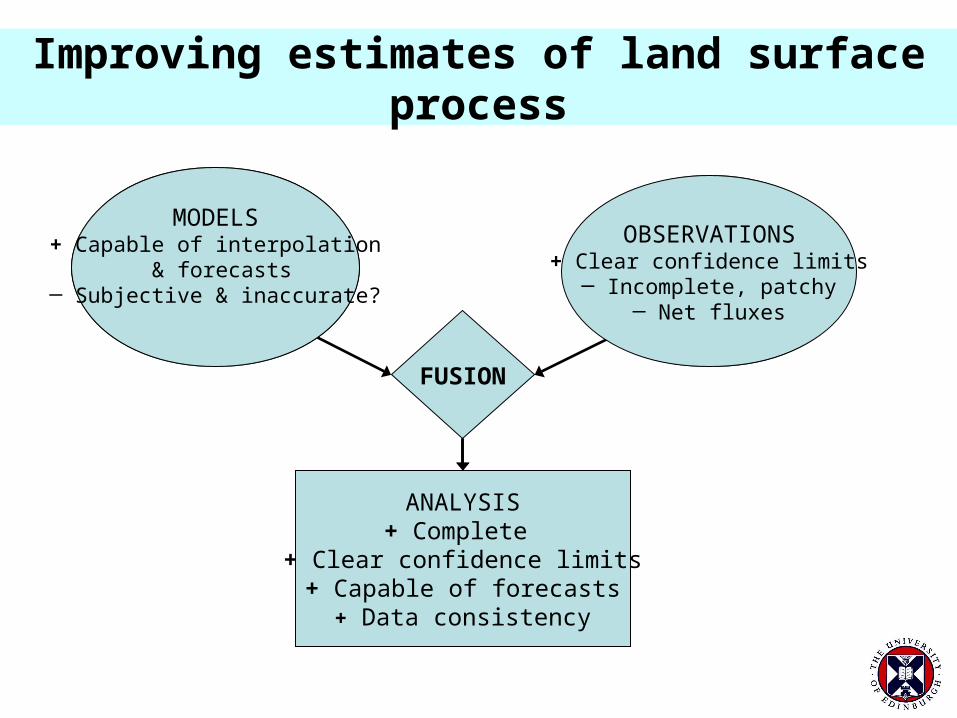
Improving estimates of land surface process
MODELS OBSERVATIONS
FUSION
ANALYSIS
MODELS+ Capable of interpolation
& forecasts─ Subjective & inaccurate?
OBSERVATIONS+ Clear confidence limits
─ Incomplete, patchy─ Net fluxes
ANALYSIS+ Complete
+ Clear confidence limits+ Capable of forecasts
+ Data consistency
Approaches to data assimilation
• Sequential (predictor-corrector)
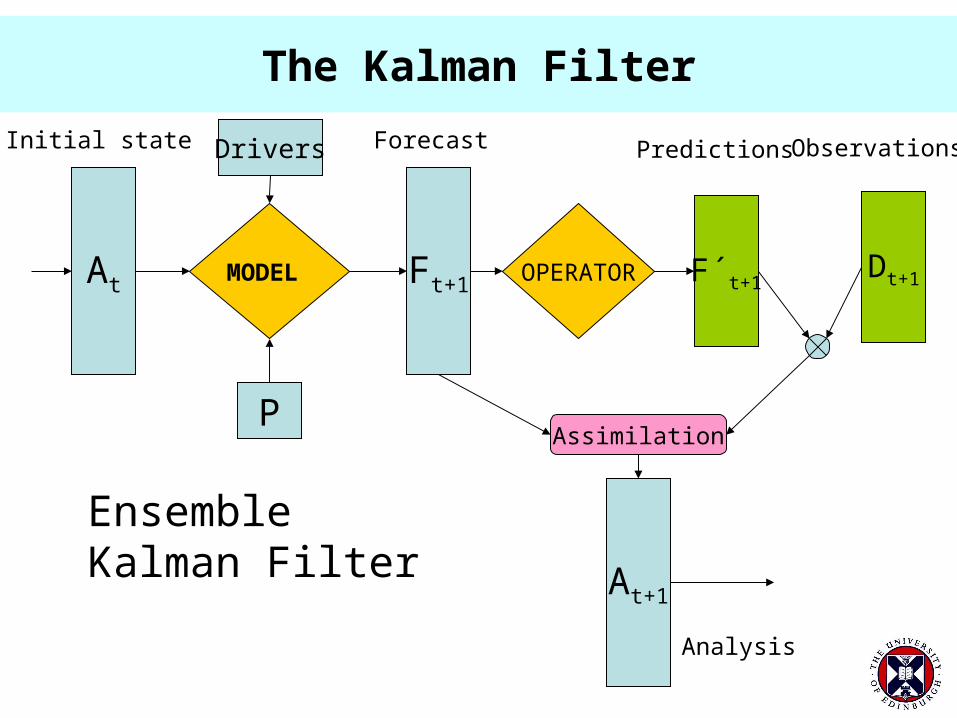
The Kalman Filter
MODEL At Ft+1 F´t+1OPERATOR
At+1
Dt+1
Assimilation
Initial state Forecast ObservationsPredictions
Analysis
P
Ensemble Kalman Filter
Drivers
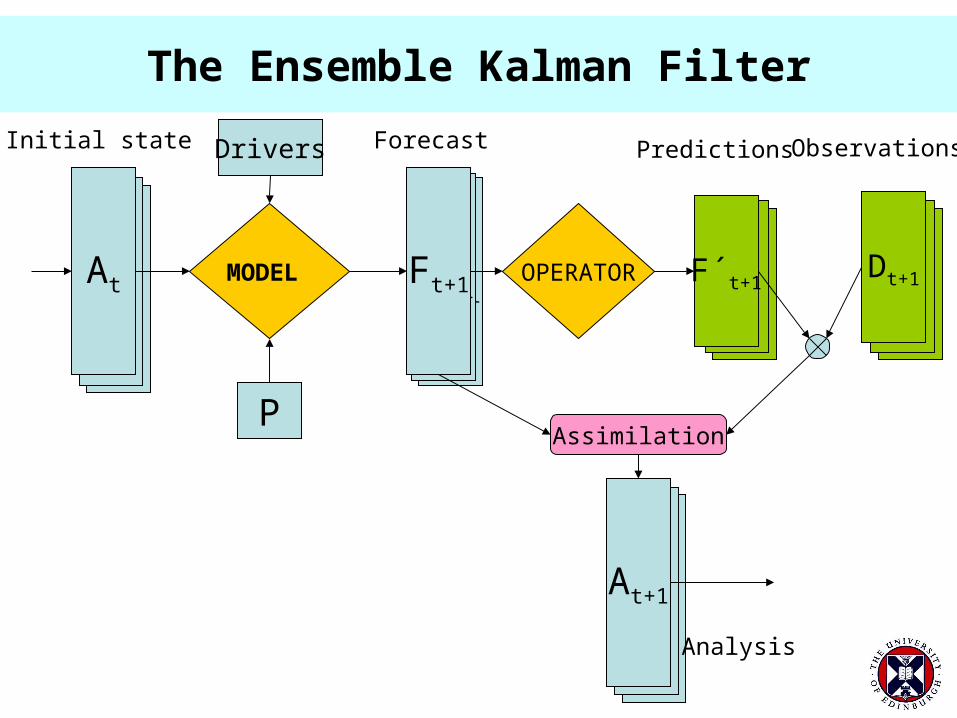
Ft+1Ft+1At
At
The Ensemble Kalman Filter
MODEL At Ft+1 OPERATOR F´t+1
At+1
Dt+1
Assimilation
Initial state Forecast ObservationsPredictions
Analysis
P
Drivers
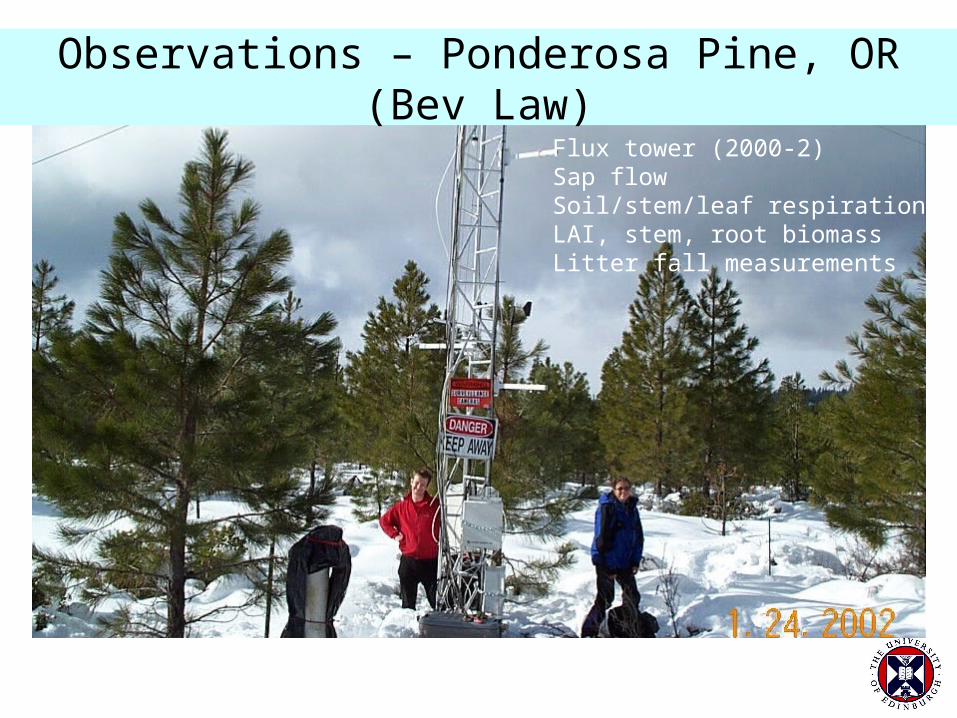
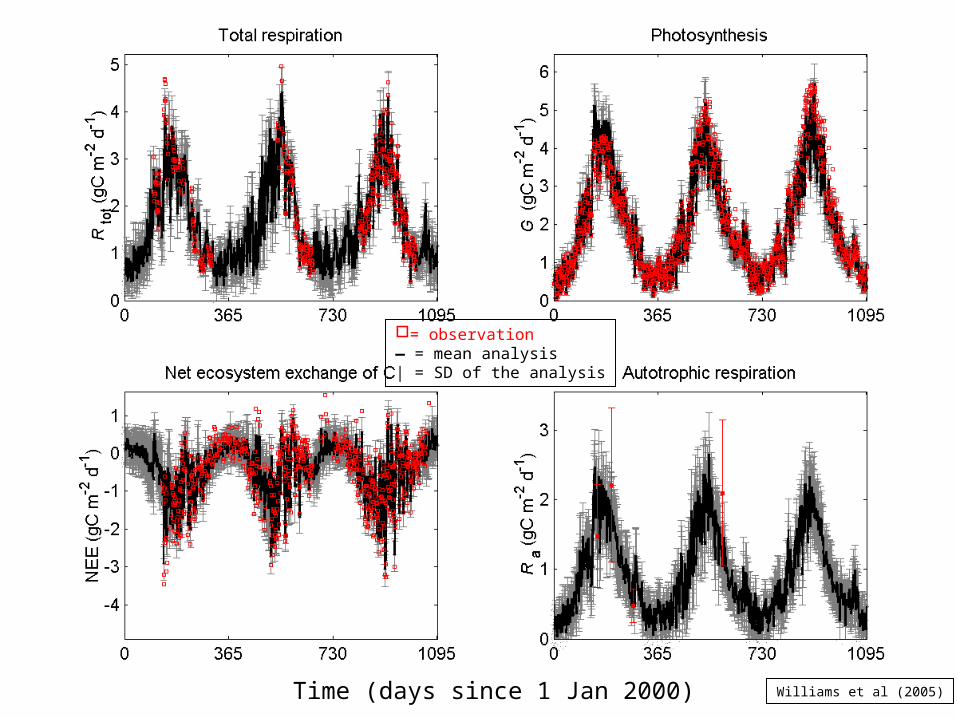
Observations – Ponderosa Pine, OR (Bev Law)
Flux tower (2000-2)Sap flowSoil/stem/leaf respirationLAI, stem, root biomassLitter fall measurements
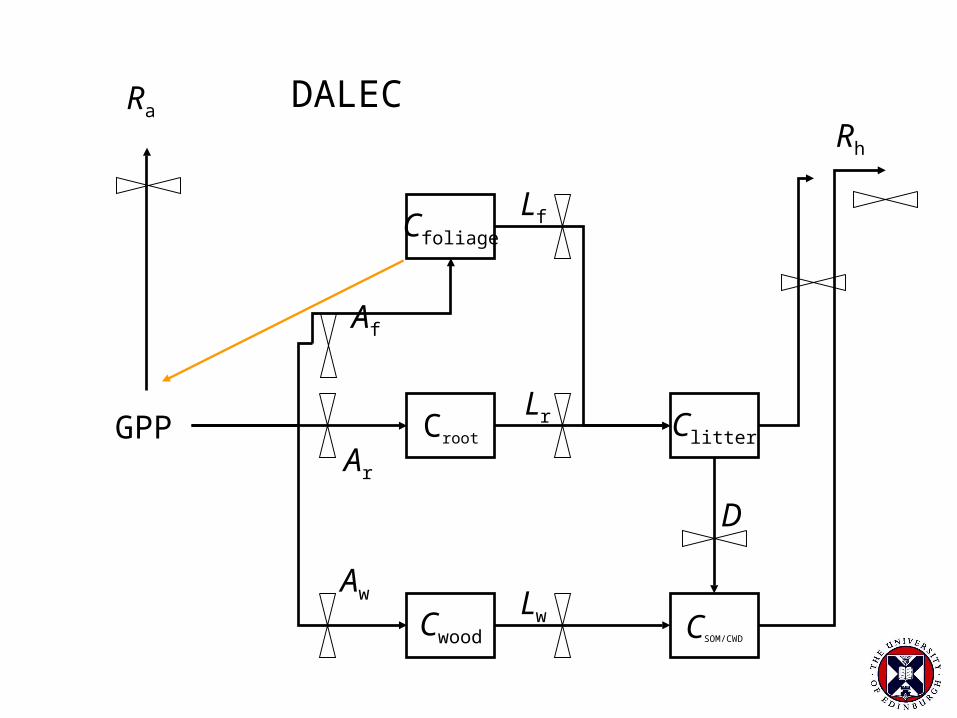
GPP Croot
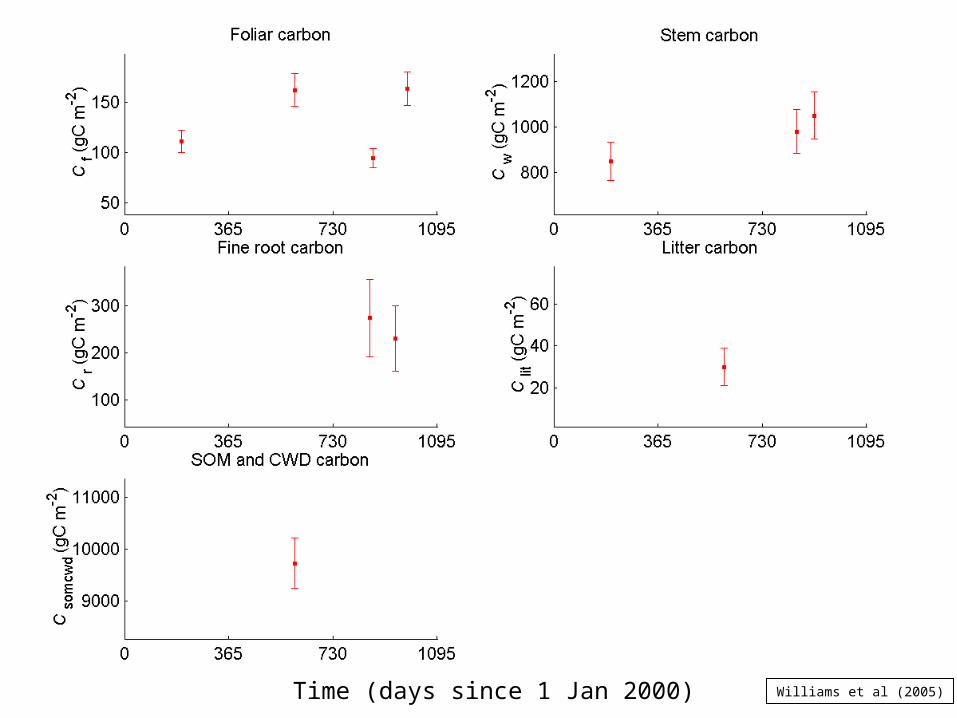
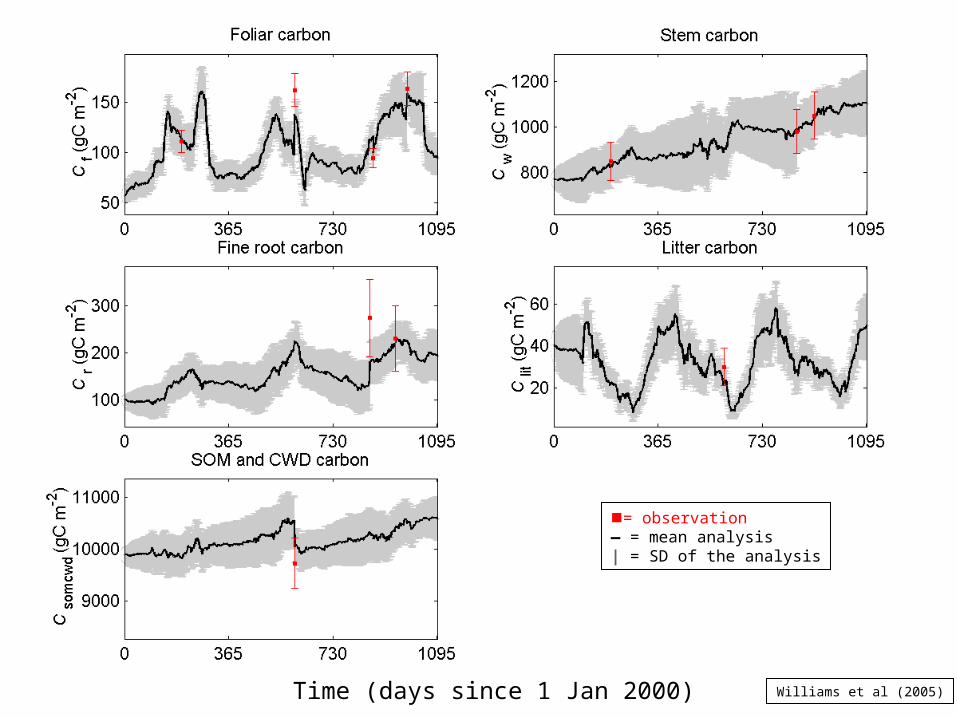
Cwood
Cfoliage
Clitter
CSOM/CWD
Ra
Af
Ar
Aw
Lf
Lr
Lw
Rh
D
DALEC
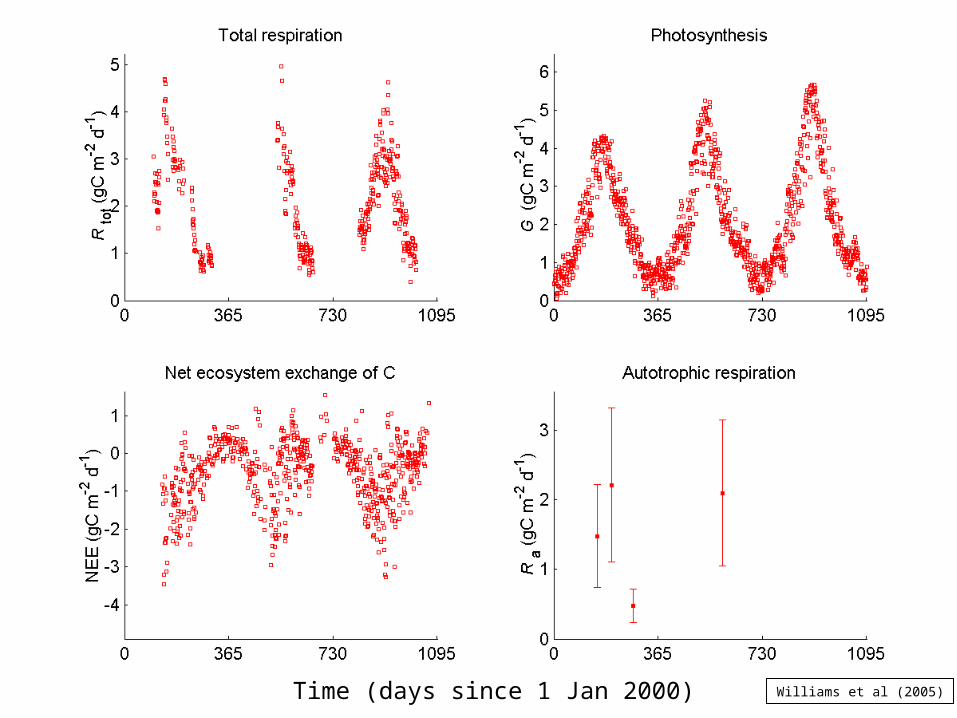
Time (days since 1 Jan 2000) Williams et al (2005)
Time (days since 1 Jan 2000) Williams et al (2005)
= observation— = mean analysis| = SD of the analysis
Time (days since 1 Jan 2000) Williams et al (2005)
Time (days since 1 Jan 2000) Williams et al (2005)
= observation— = mean analysis| = SD of the analysis
0 365 730 1095-4
-3
-2
-1
0
1
2
0 365 730 1095-4
-2
0
2
Time (days, 1= 1 Jan 2000)
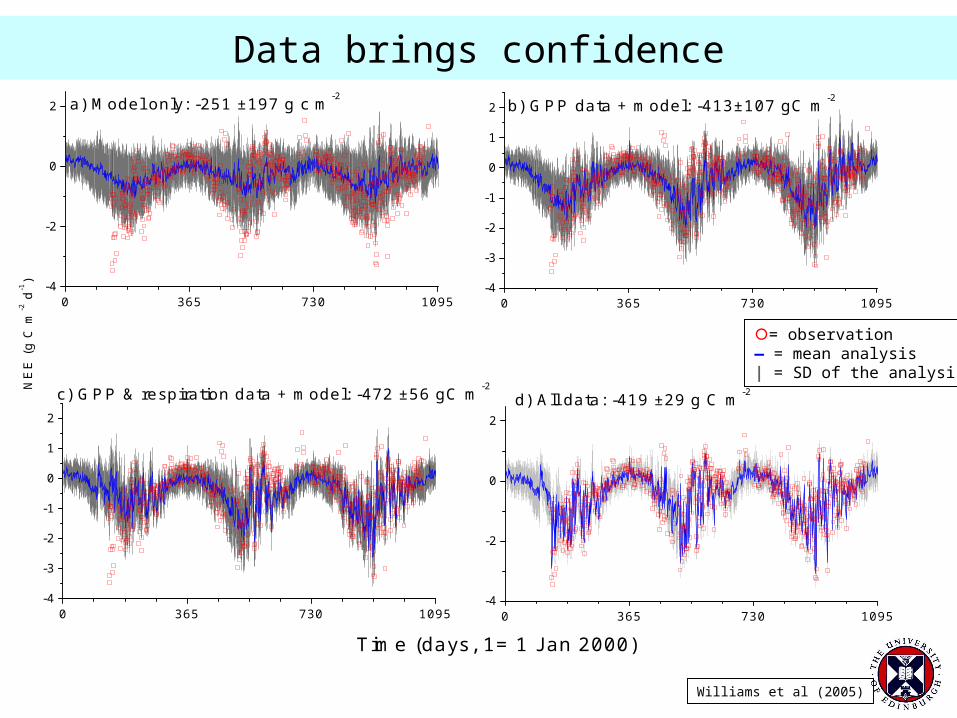
b) GPP data + model: -413±107 gC m-2
0 365 730 1095-4
-3
-2
-1
0
1
2
c) GPP & respiration data + model: -472 ±56 gC m-2NE
E (
g C
m-2 d
-1)
0 365 730 1095-4
-2
0
2
a) Model only: -251 ±197 g c m-2
d) All data: -419 ±29 g C m-2
Data brings confidence
Williams et al (2005)
= observation— = mean analysis| = SD of the analysis
Approaches to data assimilation
• Sequential (predictor-corrector)• Inversion techniques
– Monte Carlo – Adjoint
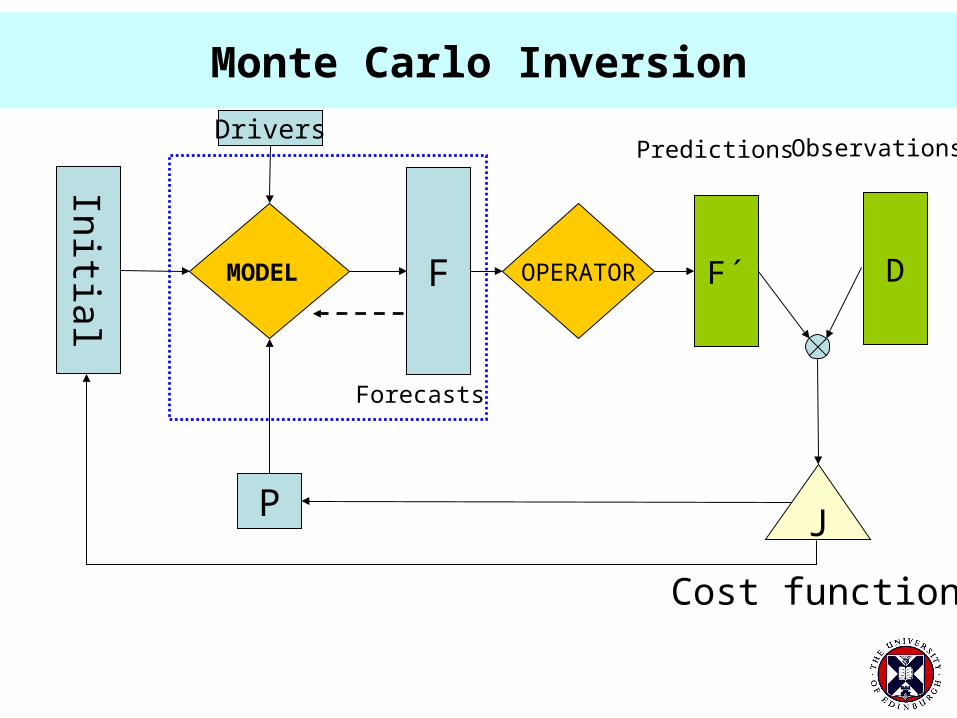
Monte Carlo Inversion
MODEL F F´OPERATOR
Forecasts
ObservationsPredictions
P
Drivers
Initial
J
D
Cost function
REgional Flux Estimation eXperiment (REFLEX)
• To compare the strengths and weaknesses of various MDF/DA techniques
• To quantify errors and biases introduced when extrapolating fluxes
• www.carbonfusion.org
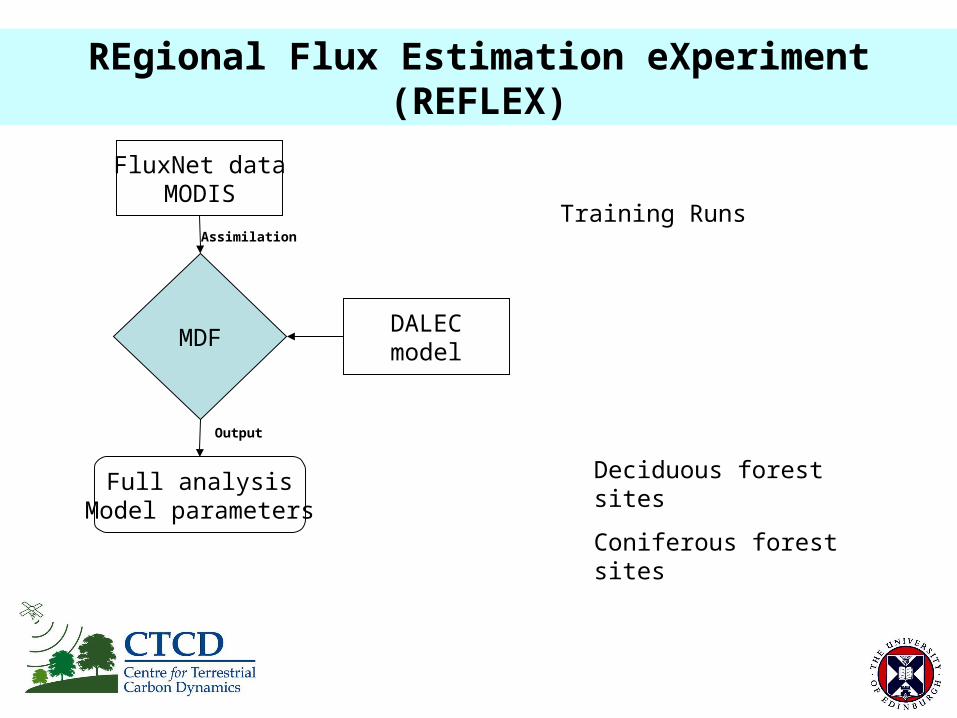
REgional Flux Estimation eXperiment (REFLEX)
FluxNet dataMODIS
MDF
Full analysisModel parameters
DALECmodel
Training Runs
Deciduous forest sites
Coniferous forest sites
Assimilation
Output
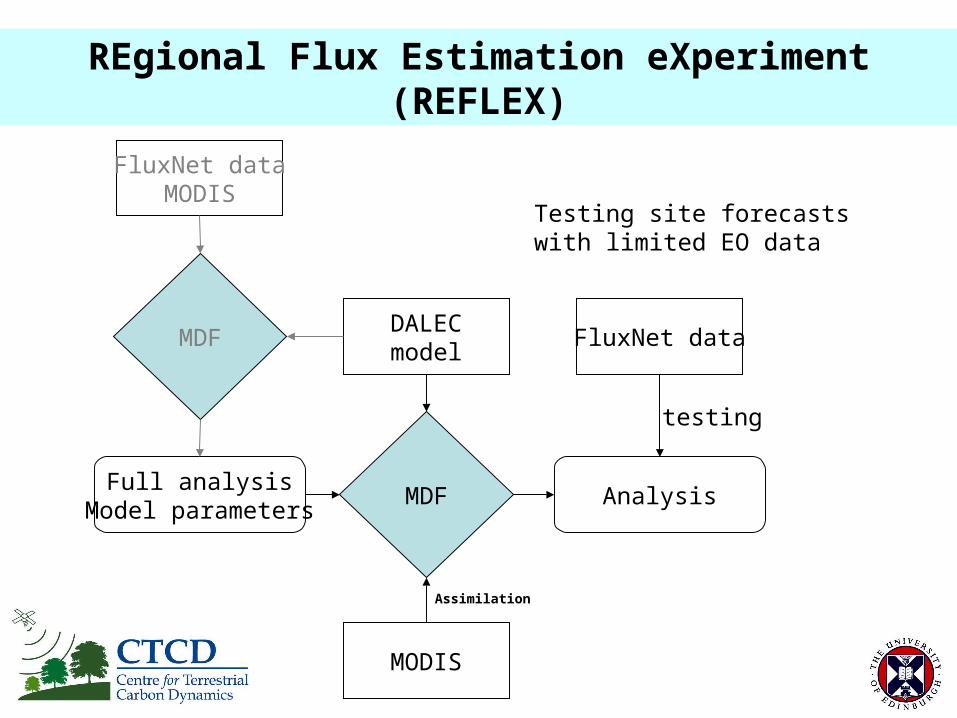
REgional Flux Estimation eXperiment (REFLEX)
FluxNet dataMODIS
MDF
Full analysisModel parameters
DALECmodel
Testing site forecastswith limited EO data
MDF
MODIS
Analysis
FluxNet data
testing
Assimilation
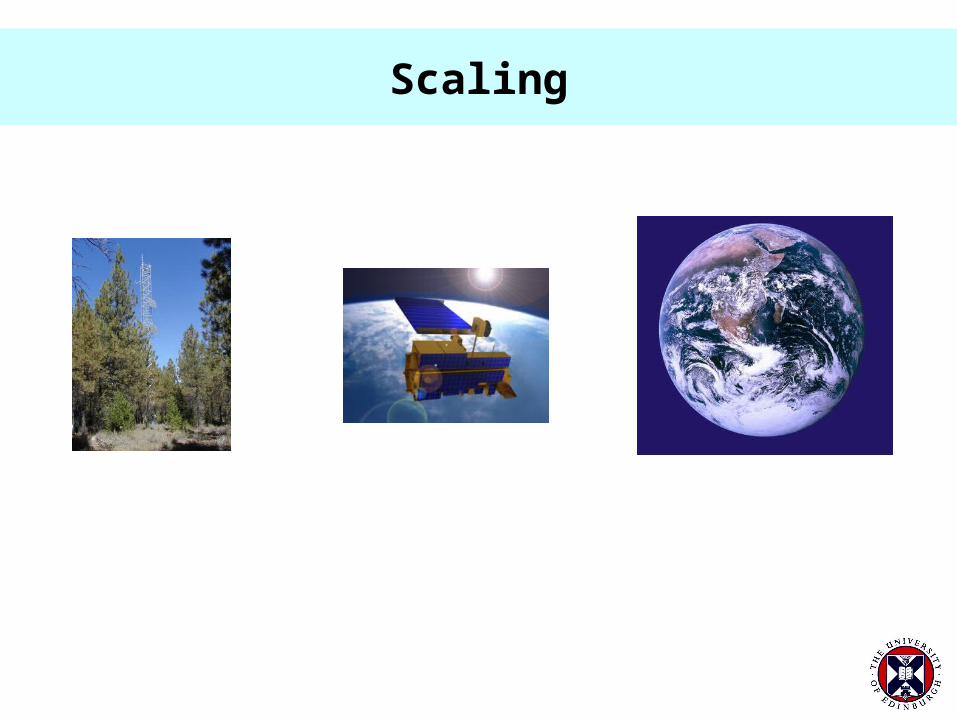
Scaling
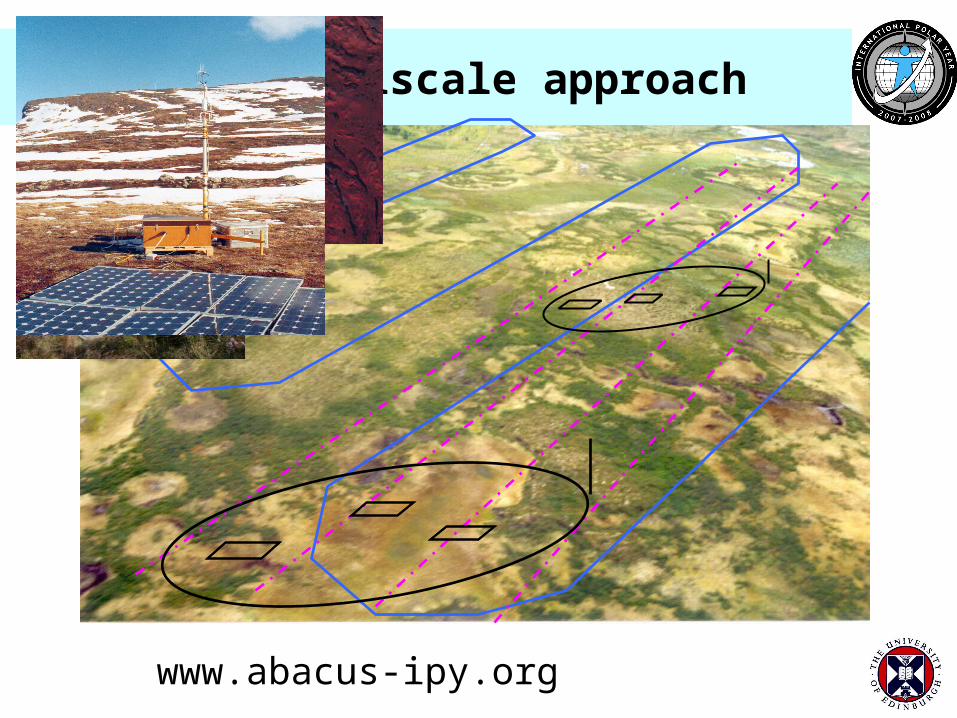
A multiscale approach
www.abacus-ipy.org
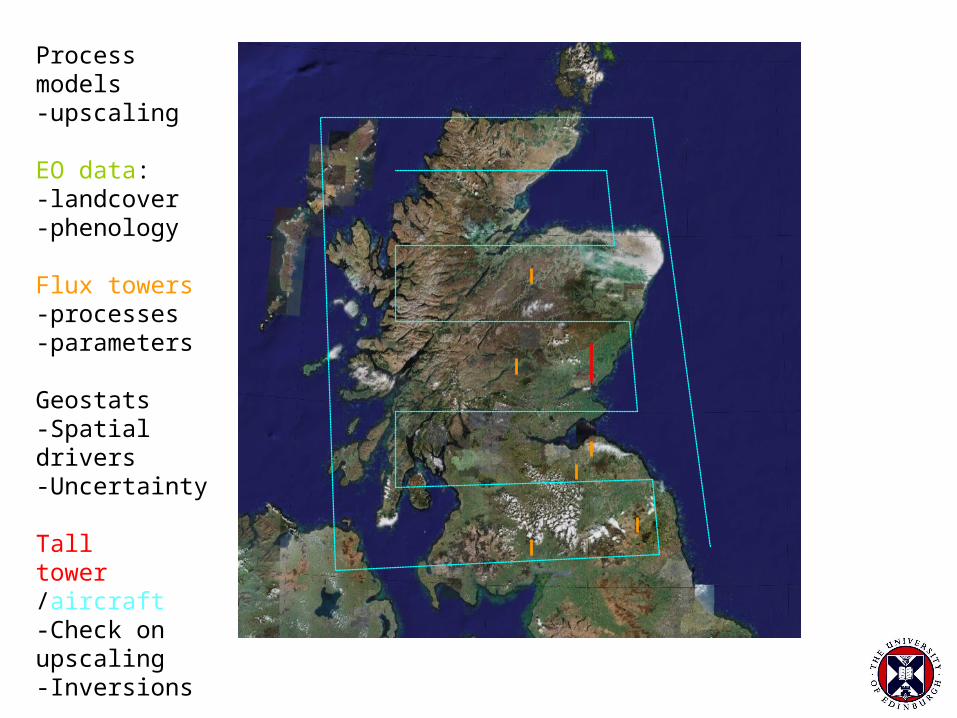
Process models-upscaling
EO data:-landcover-phenology
Flux towers-processes-parameters
Geostats-Spatial drivers-Uncertainty
Tall tower /aircraft-Check on upscaling-Inversions
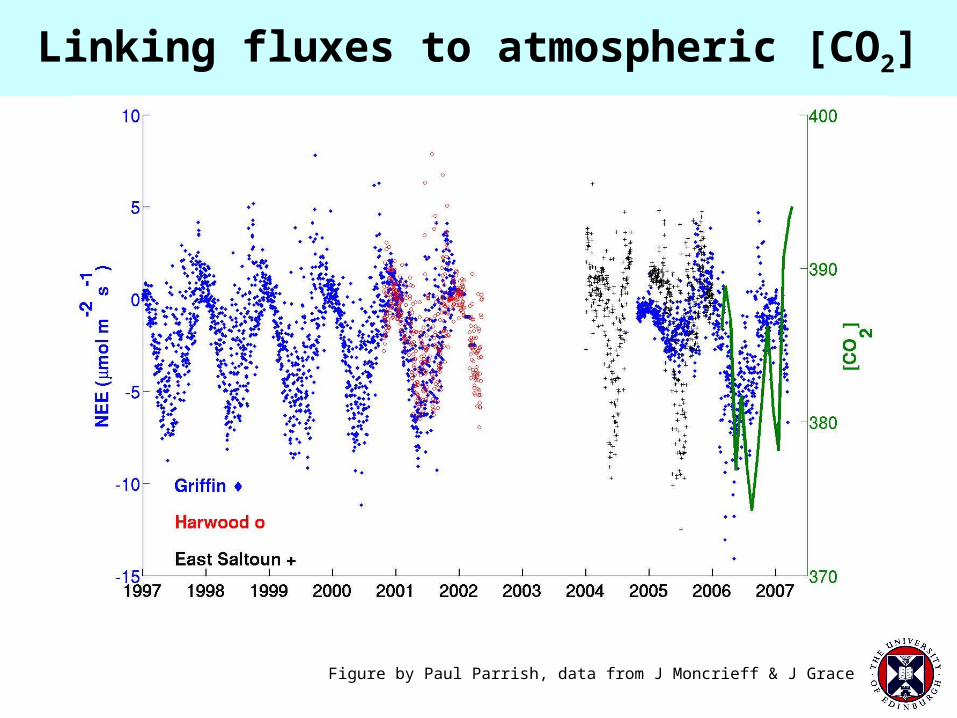
Linking fluxes to atmospheric [CO2]
Figure by Paul Parrish, data from J Moncrieff & J Grace

The Orbiting Carbon Observatory (OCO)
Approach: • Collect spatially resolved, high resolution
spectroscopic observations of CO2 and O2 absorption in reflected sunlight
• Use these data to resolve spatial and temporal variations in the column averaged CO2 dry air mole fraction, XCO2 over the sunlit hemisphere
• Employ independent calibration and validation approaches to produce XCO2 estimates with random errors and biases no larger than 1 - 2 ppm (0.3 - 0.5%) on regional scales at monthly intervals
OCO will acquire the space-based data needed to identify CO2 sources and sinks and quantify their variability over the seasonal cycle
Source: David Crisp, JPL
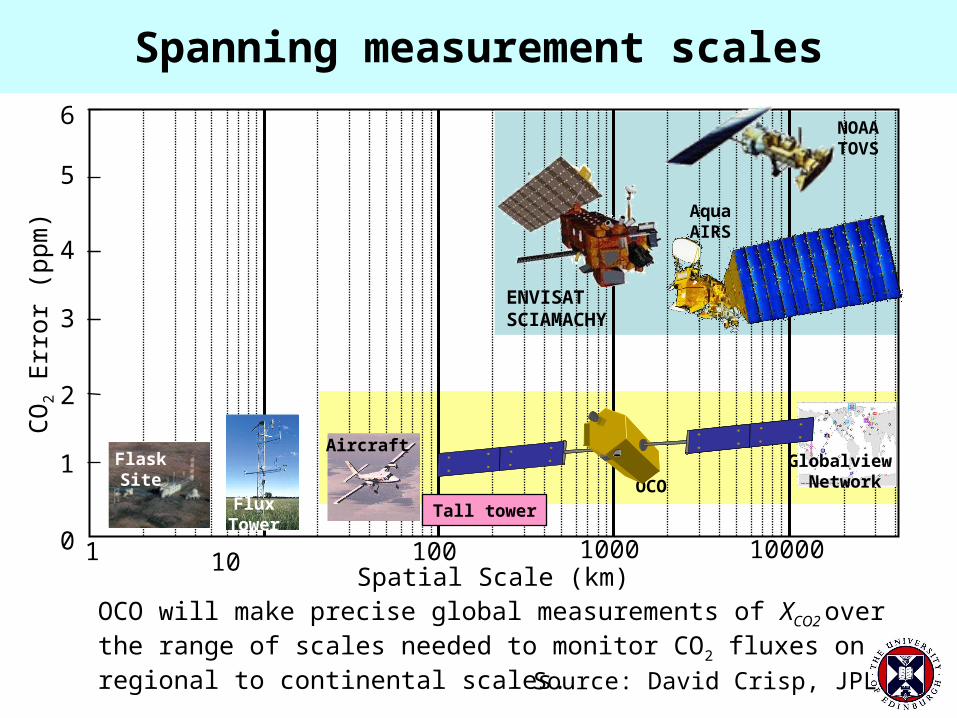
Spanning measurement scales
OCO will make precise global measurements of XCO2 over the range of scales needed to monitor CO2 fluxes on regional to continental scales.
Spatial Scale (km)
1
2
3
4
5
6
CO
2 E
rror
(pp
m)
1 10 100 1000 10000
OCO
FlaskSite
AquaAIRS
Aircraft
0
FluxTower
Globalview Network
NOAATOVS
ENVISATSCIAMACHY
Tall tower
Source: David Crisp, JPL
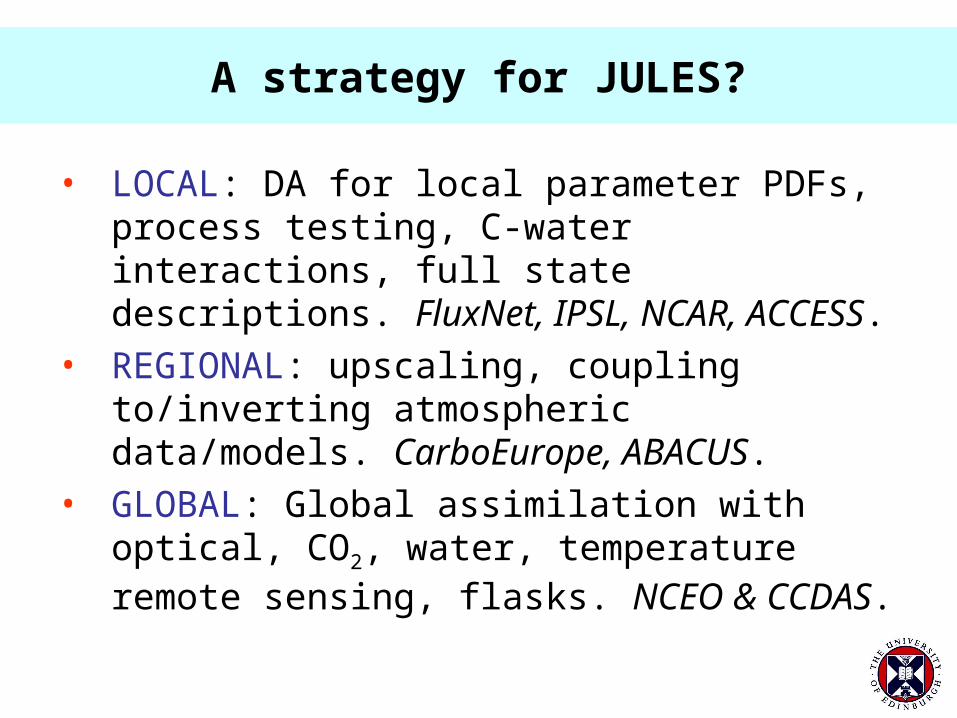
A strategy for JULES?
• LOCAL: DA for local parameter PDFs, process testing, C-water interactions, full state descriptions. FluxNet, IPSL, NCAR, ACCESS.
• REGIONAL: upscaling, coupling to/inverting atmospheric data/models. CarboEurope, ABACUS.
• GLOBAL: Global assimilation with optical, CO2, water, temperature remote sensing, flasks. NCEO & CCDAS.
THANKS!
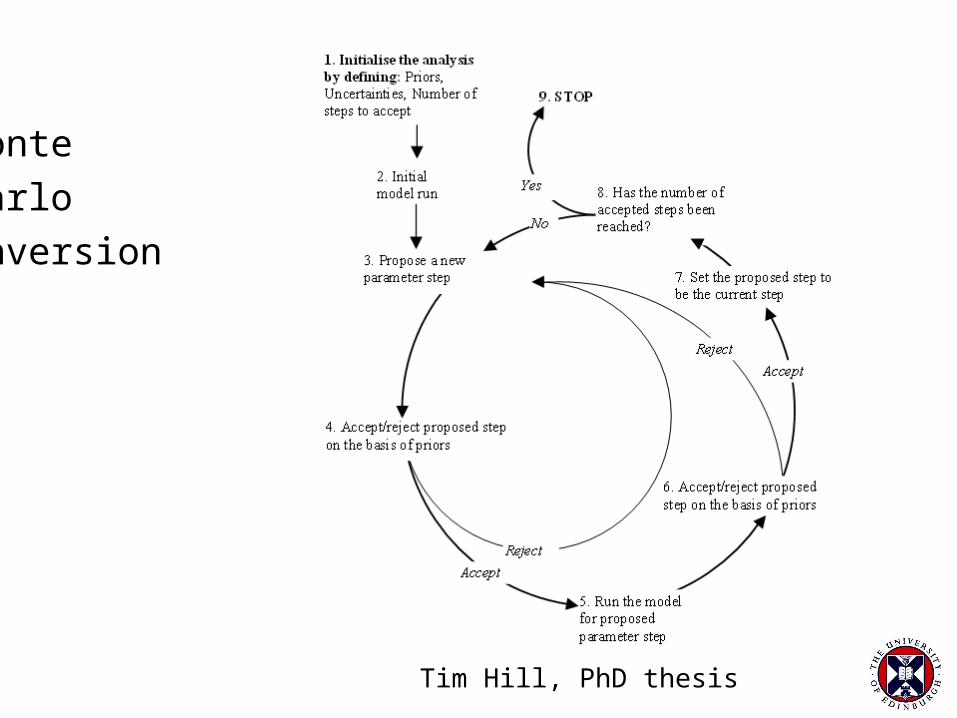
Tim Hill, PhD thesis
Monte
Carlo
Inversion