Embed Size (px)
Citation preview

Data-Based Decision Making
projectDATAAssessment Module

www.uoregon.edu/~projdata
Agenda
• Project map • Data-based Decision Making
– Stiggins (2006) article– Decision Rules
• Review AIMSweb data• Intervention overview• Intervention tracker• Closing activities• Questions?
www.uoregon.edu/~projdata
projectDATA Map

Instructional Survey

Data-Based Decisions

www.uoregon.edu/~projdata
Decisions from Assessments
• Demand for varied assessments to support all students as lifelong learners:– Criterion-referenced assessments in addition to
norm-referenced assessments– Balance of summative with formative assessments– Balance of large scale and classroom based
assessments• Assessment should be linked to a purpose
– Varies based on user, questions to answer
• No single assessment is capable of meeting the information needs of all of these various users. A productive, multi-level assessment system is needed to be sure that all instructional decisions are informed and made well (p. 12).
Stiggins (2006)

www.uoregon.edu/~projdata
Table 1: Users and Uses

www.uoregon.edu/~projdata
Table 2: Assessment Competencies

Using Decision Rules

www.uoregon.edu/~projdata
•To determine if students are making adequate progress, consider the following…
– Is the student improving at the rate expected?
– Are interventions needed to support student in reaching goal?
– Has student had enough exposure to intervention to demonstrate success?
– Should instruction or intervention be modified (i.e., using intervention tracker)?
Decision Rules for Progress Monitoring

www.uoregon.edu/~projdata
• Allow for 4-5 data points to orient student to new instructional program•Allow and additional 2-3 data points to examine efficacy of instruction •Intervene after 3-4 data points in a downward or flat trend•Intervention/instructional change should support individual or group need
Graphed Data Rules

www.uoregon.edu/~projdata
Examine the slope of the trendline and the number of data points above/below aimline.
Using the 3-Point Rule
www.uoregon.edu/~projdata
The student is exceeding the goal if...
Three (3) consecutive data points are above aimline:
Consider increasingthe goal.
Callender & Smith (2006)
Data Decision Rules: Adequate Progress

www.uoregon.edu/~projdata
The student is making adequate progress towards the goal if...
The data points align with the aimline.
Continue withcurrent practice.
Callender & Smith (2006)
Data Decision Rules: Stay the Course!

www.uoregon.edu/~projdata
The student may not be making adequate progress towards the goal if...
Three (3) consecutive data points are below aimline
Intervene to addressstudent needs
Callender & Smith (2006)
Data Decision Rules: Inadequate Progress

www.uoregon.edu/~projdata
Evaluating Progress: Modify Instruction for Allison?

www.uoregon.edu/~projdata
Evaluating Progress: Modify Instruction for Ben?

www.uoregon.edu/~projdata
Evaluating Progress: Modify Instruction for Carrie?

www.uoregon.edu/~projdata
• Focus on the question: – “Will the individual reach his/her goal by the end of the goal period?”
• Decide to change the intervention whenever the rate of progress falls below the expectation– Use the 3-point rule
• Changes to goal/instruction are fine tuning rather than major adjustments– Think about alterable variables
Callender & Smith (2006)
Things to Consider

www.uoregon.edu/~projdata
Progress Monitoring Data
www.uoregon.edu/~projdata
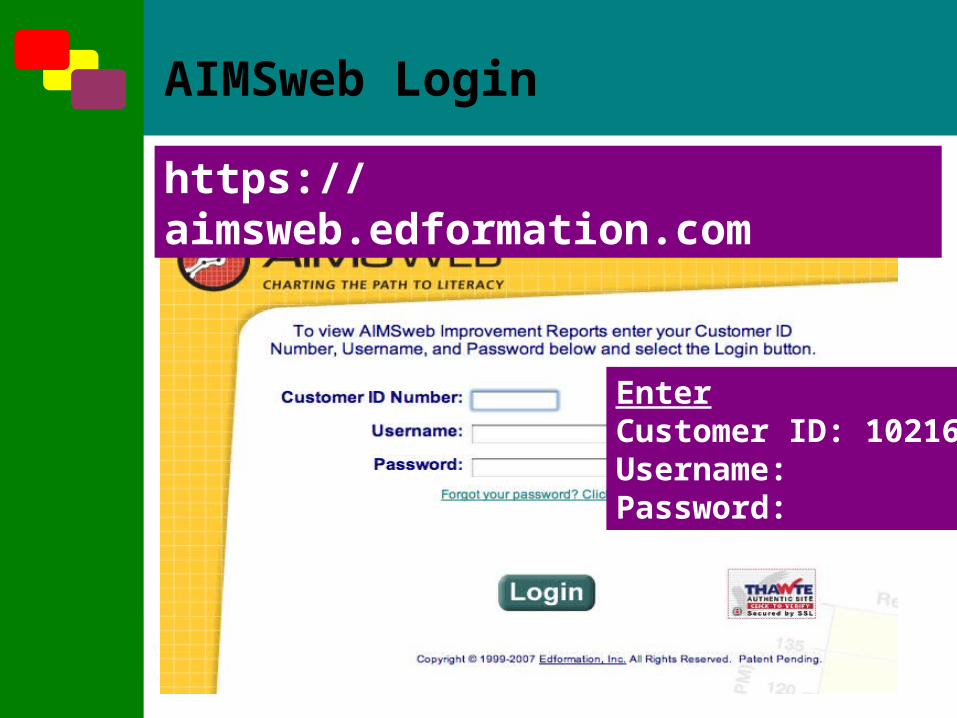
EnterCustomer ID: 10216Username:Password:
https://aimsweb.edformation.com
AIMSweb Login

www.uoregon.edu/~projdata
Your name (user name)
Navigation Tabs
Click on link under Progress Report to view student progress graph
StudentList
AIMSweb – Progress Monitor

www.uoregon.edu/~projdata
AIMSweb – Student Graph

www.uoregon.edu/~projdata
AIMSweb – Return to Roster
Click ‘Back’ to return to student roster
Click ‘PDF’ to generate a printable document

www.uoregon.edu/~projdata
Navigation Tabs
To generate a class set of student progress graphs:
1.Click the box to the right of ‘Progress Report’ to select all students.
2.Scroll to the bottom of the page, and click ‘View Selected’
StudentList
AIMSweb – Progress Monitor

www.uoregon.edu/~projdata
Review Class Data
• What do you notice about student graphs?
• Are students making progress?
• Do you see any trends in performance?
• Which students might you want to monitor more closely?

www.uoregon.edu/~projdata
AIMSweb – Return to Roster
Click ‘Back’ to return to student roster
Click ‘PDF’ to generate printable documents. Each student graph and goal/score summary is 2 pages long.

www.uoregon.edu/~projdata
Don’t Forget to Logout!

Break

Intervention Overview

www.uoregon.edu/~projdata
Research on Effective Practices for Teaching
Math• Explicit, teacher directed instruction
• Student think alouds
• Visual and graphic depictions of problems
• Peer-assisted learning
• Formative assessment
Gersten, Baker, Chard, 2006

www.uoregon.edu/~projdata
Explicit, Systematic Instruction
• Clear models and demonstrations
• Range of instructional examples (positive and negative)
• Extensive and supported practice in newly learned skills and strategies
• Extensive feedback provided to students (specific positive and corrective)
www.uoregon.edu/~projdata
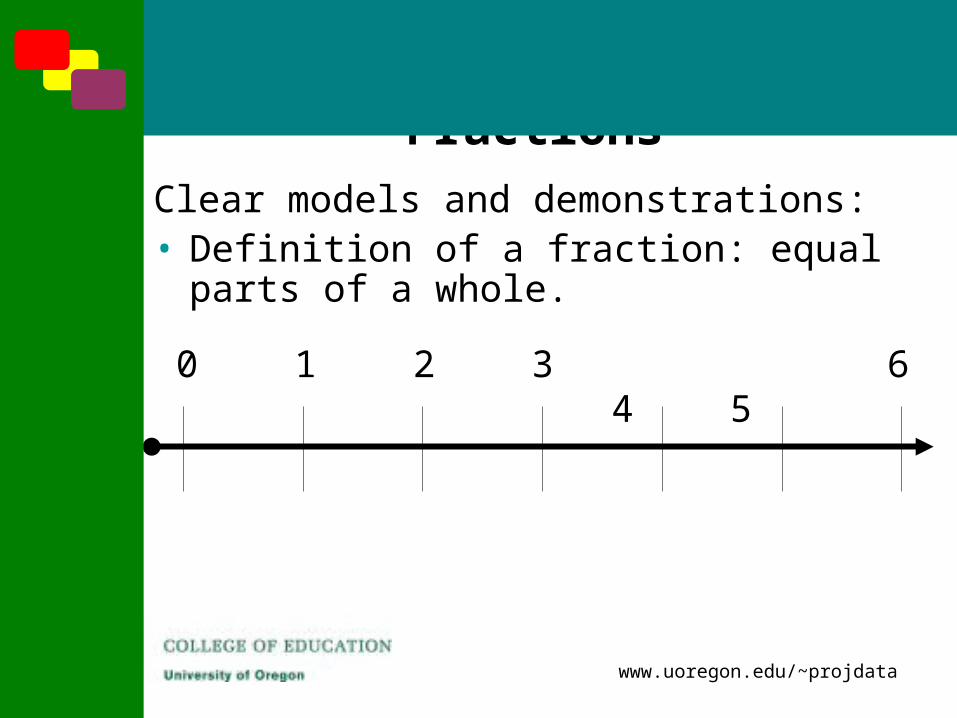
Example of Explicit, Systematic Instruction:
Fractions Clear models and demonstrations: • Definition of a fraction: equal parts of a whole.
0 1 2 3 4
5
6

www.uoregon.edu/~projdata
Example of Explicit, Systematic Instruction:
Fractions Clear models and demonstrations: • Definition of a fraction: equal parts of a whole.
0 1 2

www.uoregon.edu/~projdata
Example of Explicit, Systematic Instruction:
Fractions • Range of instructional positive and negative examples (proper, improper and fractions equal 1)
0 1 2
03
13
23
33
43
53
63

www.uoregon.edu/~projdata
Example of Explicit, Systematic Instruction:
Fractions • Extensive and supported
practice in newly learned skills and strategies and
• Extensive feedback provided to students (specific positive and corrective)0 1 2
14
?4
3?
44
5?
??
??
?4
04

www.uoregon.edu/~projdata
Student think-alouds
• Encouraging students to verbalize their thinking - talk about the steps they used in solving a problem or strategic decisions
• Verbalizing was most effective when multiple approaches to solving problems were demonstrated and students were encouraged to think-aloud as they solved multiple practice problems.

www.uoregon.edu/~projdata
Example: Student think-alouds
• Why is it true that 1/2 = 3/6?
• How would you find the GCF of 6 and 8?
• Why can’t you add 1/3 and 6/5? What do you have to do so you can add them?

www.uoregon.edu/~projdata
Visual and Graphic Depictionsof Problems
• Visuals are helpful IF students are provided opportunities to learn to use them and practice using them.• Number line and area models for fractions are highly recommended over the “pie” model

www.uoregon.edu/~projdata
Visual and Graphic Depictionsof Problems
• Concrete-Representational-Abstract (CRA) approach seems promising.• Concrete: Making equivalent fractions by folding strips of paper
• Representational: Making equivalent fractions by segmenting a number line
• Abstract: Making equivalent fractions by rewriting fractions with a common denominator

www.uoregon.edu/~projdata
Peer Assisted Learning
• Increased opportunities to practice problem solving and interact with peers about mathematics
• Results have been consistently positive if…• Provided by a proficient, trained peer.
• Students work in pairs, activities have a clear structure.
• Pairs include students at differing ability levels.
• Both students play the role of tutor.• Students are trained in to assume the role of tutor.

www.uoregon.edu/~projdata
Formative Assessment to Teachers
•Superior to typical weekly or biweekly unit tests

www.uoregon.edu/~projdata
Formative Assessment to Students
• More effective when feedback to students was provided coupled with specific suggestions for intervention strategies (practice problems, alternate ways to explain a concept)
Tracking Interventions

www.uoregon.edu/~projdata
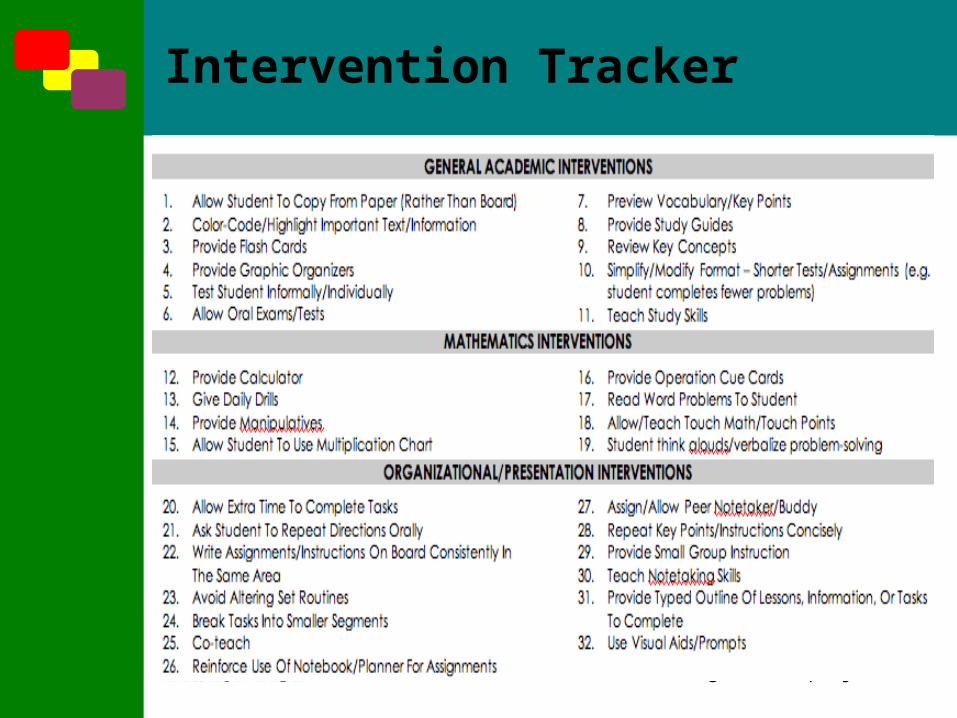
Intervention Tracker
• Use intervention tracker to:– Identify intervention logistics– Record interventions for individual students or groups of students
– Document instructional decisions made as a result of student progress
• Interventions can be documented on AIMSweb graphs
www.uoregon.edu/~projdata
Intervention Tracker
www.uoregon.edu/~projdata
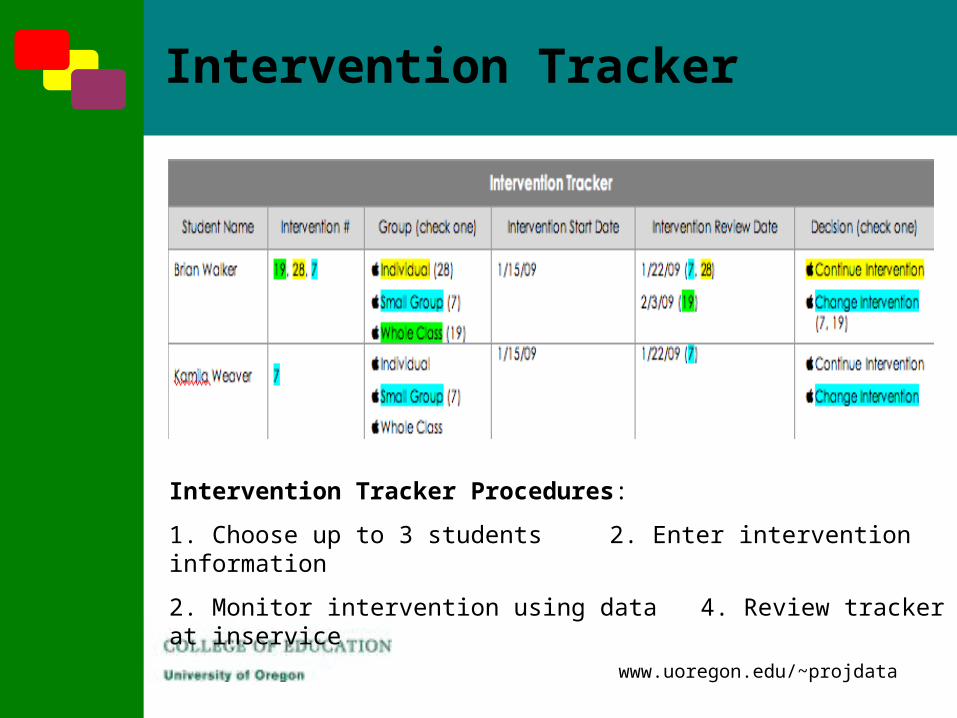
Intervention Tracker
Intervention Tracker Procedures:
1. Choose up to 3 students 2. Enter intervention information
2. Monitor intervention using data 4. Review tracker at inservice
www.uoregon.edu/~projdata
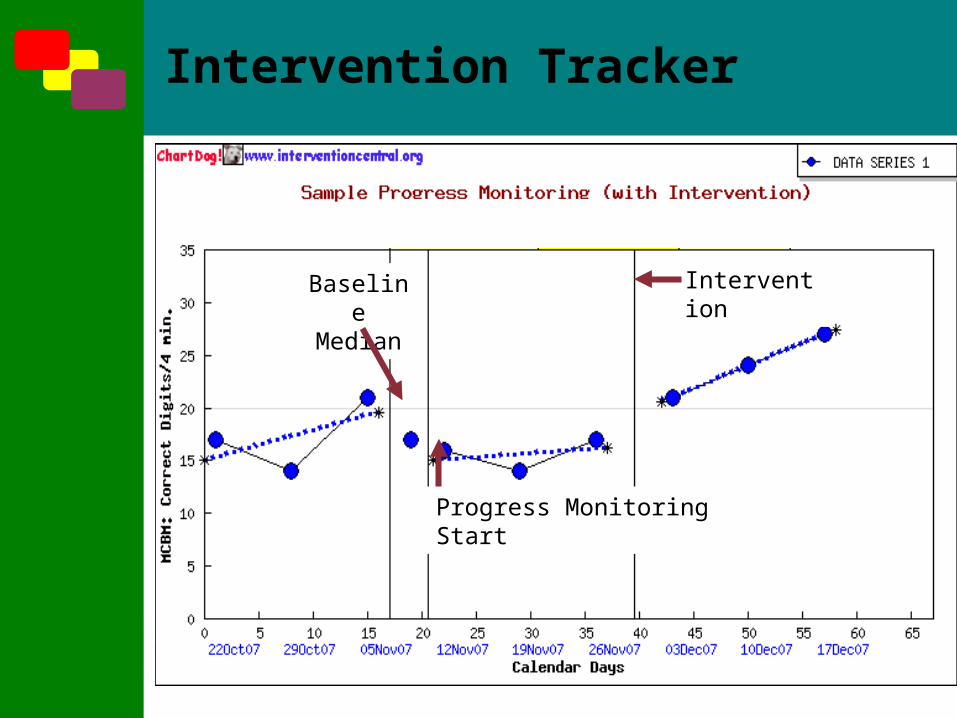
Baseline
Median
Progress Monitoring Start
Intervention
Intervention Tracker

www.uoregon.edu/~projdata
Closing Activities
• New progress monitoring schedule:– Will receive sets of probes at each
inservice
– Administer one set of probes each week
– Mail probes to Lori Wollenweber (at Lane ESD) on Wednesday/Thursday of each week
• Use school provided envelopes and UO provided labels
– UO will score probes and update AIMSweb
– Probes will be returned once each week in your envelopes

www.uoregon.edu/~projdata
Closing Activities
• Questions?• Mathematicians Workshop Series
– Turn in registration form if you have it– Can also return with weekly probes
• Next meeting– February 12– Benchmark students on EasyCBM
• Email Elisa with questions• Bring log-in information if we didn’t set up
account• Bring triangle activity from October for
comparison
• Evaluation

www.uoregon.edu/~projdata
Before you leave…
1. Turn in evaluation, instructional survey, and name tent
2. Pick up:
• New sets of probes
• Mailing labels for returning envelopes
• CDs of probes/scoring keys
• Completed, scored probes
3. Return MWS registration form, if applicable
4. Pick up algebra probes and administration directions, if applicable