Embed Size (px)
Citation preview

DATA BOOK COVER SHEET
1

State Aid
2

$2,035,970,233
$1,977,049,484
$1,894,269,216
$1,816,091,355 $1,816,091,355
$1,837,570,779
FY2009 FY2010 FY2011 FY2012 FY2013 FY2014
Total State Appropriations for Financial Support of Schools
(Formula) FY2009-FY2014
3

654,511
681,578
640,000
645,000
650,000
655,000
660,000
665,000
670,000
675,000
680,000
685,000
2009 2013
Num
ber o
f Stu
dent
s Statewide Student Enrollment
2009 and 2013
Source: Office of Accreditation Annual Student Count.
4

Hispanic 15%
American Indian 15%
Asian 2%
Black 9% Hawaiian or
Pacific Islander 0.28%
White 52%
Two or More Races
7%
Student Demographics by Race 2013
5

PERCENTAGE OF STUDENTS IN POVERTY
41%
59%
2009 Above Poverty Line Below Poverty Line
38%
62%
2013 Above Poverty Line Below Poverty Line
6

Revenues and Expenditures
7

$3,275.60
$3,210.05
$3,113.40
$3,040.20 $3,035.00
$2,850.00
$2,900.00
$2,950.00
$3,000.00
$3,050.00
$3,100.00
$3,150.00
$3,200.00
$3,250.00
$3,300.00
$3,350.00
FY2009 FY2010 FY2011 FY2012 FY2013
Per Pupil Funding
8

$7.11
$7.61
$7.80 $7.93
$8.11 $8.22
$6.40
$6.60
$6.80
$7.00
$7.20
$7.40
$7.60
$7.80
$8.00
$8.20
$8.40
FY 2008 FY 2009 FY 2010 FY 2011 FY 2012 FY 2013
Billi
ons
Statewide Revenue All Funds to Schools FY2008-FY2013
Revenue All FundsSource: Districts' OCAS expenditures and revenue submission. 9

$480.6 $527.3
$638.4
$565.1
$729.0 $769.2
$-
$100
$200
$300
$400
$500
$600
$700
$800
$900
FY 2008 FY 2009 FY 2010 FY 2011 FY 2012 FY 2013
Mill
ions
School District Carryover Funds
FY2008-FY2013 Reported by districts through OCAS
10

$7.1 $7.6 $7.8 $7.9 $8.1 $8.2
$5.7 $5.9 $6.0 $6.0 $6.2 $6.3
$-
$1.00
$2.00
$3.00
$4.00
$5.00
$6.00
$7.00
$8.00
$9.00
FY 2008 FY 2009 FY 2010 FY 2011 FY 2012 FY 2013
Billi
ons
Statewide Revenue and Expenditures All Funds
Reported by districts through OCAS
Revenue All Funds Expenditures All Funds 11

Local 25%
Intermediate 2%
State 33%
Federal 9%
Cash forward and other
miscellaneous revenue
31%
Statewide Revenue by Category FY2013
*Miscellaneous revenues include estopped warrants, prior year lapsed appropriations, and non-revenue receipts such as return of assets, transfers and correcting entries
Source: Districts' OCAS expenditures and revenue submission.
$ 8,217,453,398.53
12

Instruction 44%
Support Services
28%
Administration 10%
Other** 18%
Statewide District Expenditures by Category FY2013
** Other expenditures include facilities acquisition and construction, fund transfers and reimbursements, debt service and indirect cost
Source: Districts' OCAS expenditures and revenue submission. 13

Public School Activities
14

ACTIVITY FY 14 appropriation - program detail
FY 2014 Appropriation Total
FY 15 budget request program detail (funding
increases in bold)
FY 15 budget request Total (funding increases
in red)
Alternative Education 14,027,366 17,677,366
Oklahoma Technical Assistance Center 300,000 300,000
Alt Center ( Moved under School Reforms Competitive Grants Pool) 350,000
Statewide school programs 14,677,366 17,377,366
ALTERNATIVE EDUCATION
15

ACTIVITY FY 14 appropriation - program detail
FY 2014 Appropriation Total
FY 15 budget request program
detail (funding increases in
bold)
FY 15 budget request Total
(funding increases in
red)
Education Leadership Oklahoma 14,942,350 14,942,350
National Board Teacher Bonus 11,695,000 11,695,000
*Speech Pathologists and Audiologists 3,247,350 3,247,350
NATIONAL BOARD CERTIFICATION
Attorney General Opinion *
16

FLEXIBLE BENEFIT ALLOWANCE
ACTIVITY FY 14 appropriation - program detail
FY 2014 Appropriation Total
FY 15 budget request program
detail (funding increases in bold)
FY 15 budget request Total
(funding increases in red)
Flexible Benefit Allowance 367,780,862 426,943,017
Certified Personnel 244,347,203 275,423,849
Support Personnel 123,433,659 151,519,168
17

$281,080,625
$297,500,348 $290,557,603
$299,752,899
$340,808,117 $353,012,487
$371,911,268
$435,226,344
2008 2009 2010 2011 2012 2013 2014 2015
Flexible Benefit Allowance: FY08-14 Actual and FY15 Allocation (District Certified and Support Staff) $426,943,017
18

ACTIVITY FY 2014 Appropriation Total FY 15 budget request Total (funding increases in red)
Teachers Retirement System 35,311,375
35,311,375
School Lunch Matching & MOE 4,960,288
5,074,365
Oklahoma Arts Institute 350,000
350,000
Personal Financial Literacy 150,000
150,000
AG in the Classroom 38,675
39,000
PASS-THROUGH FUNDS
19

IMPLEMENTATION OF REFORMS
• Reading Sufficiency
• Achieving Classroom Excellence
• Teacher & Leader Effectiveness
• School Turnaround
20

Line Item
FY 14 appropriation - program detail
FY 15 budget request for
program
Reading Sufficiency 6,500,000
16,091,550
3rd Grade Reading Readiness Support Teams 500,000
500,000
REAC3H Coaches 4,250,000
5,000,000
21

$6.33
$7.36
$4.71
$1.83
$4.92
$7.44 $7.04
$2.69
$3.99 $3.37
$-
$1.00
$2.00
$3.00
$4.00
$5.00
$6.00
$7.00
$8.00
2009 2010 2011 2012 2013
Mill
ions
Reading Sufficiency Programs:
State Budget and District Expenditures 2009-2013
State Budget (Revenue) District ExpendituresSource: Districts' OCAS expenditures and revenue submission. 22

FILLING IN THE MISSING PIECES WITH EARLY INTERVENTION IS CRITICAL.
Children who have reading problems in 3rd grade have reading problems in later grades. They fall further
behind each year they do not receive support.
More than 1/3 of poor children enter formal
kindergarten classes already behind their peers…
By 4thgrade, more than
50% of these children will not meet the standard for
reading proficiency. 23

THE DOUBLE JEOPARDY OF STRUGGLING READERS
Children who are not reading proficiently in 3rd grade are 4 times more likely to not graduate high school
Below basic readers are almost 6 times more likely than proficient readers to not finish high school on time
Poor Black and Hispanic students who are struggling readers are about 8 times more likely than proficient readers to drop out of high school
-- The Annie E. Casey Foundation 24

25

26

REAC3H COACHES
27

0%10%20%30%40%50%60%70%
Which of the following activities did your Coach offer?
Superintendents Princpals TeachersPrincipals
Coaches Offered a Wide Variety of Activities
28

Many Respondents Thought Coaches Will Help Improve Literacy Rates
0%
10%
20%
30%
40%
50%
60%
Yes Maybe No Not sure
Do you think that information and PD your Coach provided will help you to improve literacy rates?
Superintendents Principals Teachers
29
Overall Satisfaction with the Coaches was Extremely High
0.0%
10.0%
20.0%
30.0%
40.0%
50.0%
60.0%
Better thanexpected
As expected Worse thanexpected
How would you rate your overall satisfaction with your REAC3H Coach?
Superintendents Principals Teachers
30

COLLEGE AND CAREER READINESS
Line Item FY 14 appropriation FY 15 budget request
ACE Remediation 8,000,000 21,795,840 AP Teacher training and Test Fee Assistance,
AVID & NMSI 4,150,000 5,743,600
Oklahoma Academic Standards Implementation 564,000 564,000
STEM Ready Elem Schools 300,000 300,000
Think Through Math 1,800,000 2,400,000
Achieving Classroom Excellence

$7.30
$8.45 $8.80
$7.73
$6.79 $5.86
$6.43 $6.85
$2.80 $3.00
$-
$1.00
$2.00
$3.00
$4.00
$5.00
$6.00
$7.00
$8.00
$9.00
$10.00
2009 2010 2011 2012 2013
Mill
ions
ACE Remediation:
State Budget and District Expenditures 2009-2013
State Budget (Revenue) District ExpendituresSource: Districts' OCAS expenditures and revenue submission. 32

0
1
2
3
4
5
6
7
8
9
FY2012 FY2013 FY2014
Number of Schools Participating in the National Math and Science Initiative
(NMSI) 65% increase in enrollment from FY13 to FY14
33

AP AND AVID
19 AP trainings were held in 6 regions across the state this fall 2 Summer Advanced Placement Institutes will be held this summer for Oklahoma educators.
34

AP & AVID DATA
14,443 students are taking AP exams with 11, 436 passing exams with a score 3, 4, or 5 40 schools in the state now offer AVID--Advancement Via Individual Determination, a proven program for increasing College and Career Readiness
35

THINK THROUGH MATH
IMPLEMENTATION METRICS
COUNT
Districts
282
Schools 672 Student Accounts 50,244
Lessons Completed 435,472 Problems
Completed 8,491,702
36
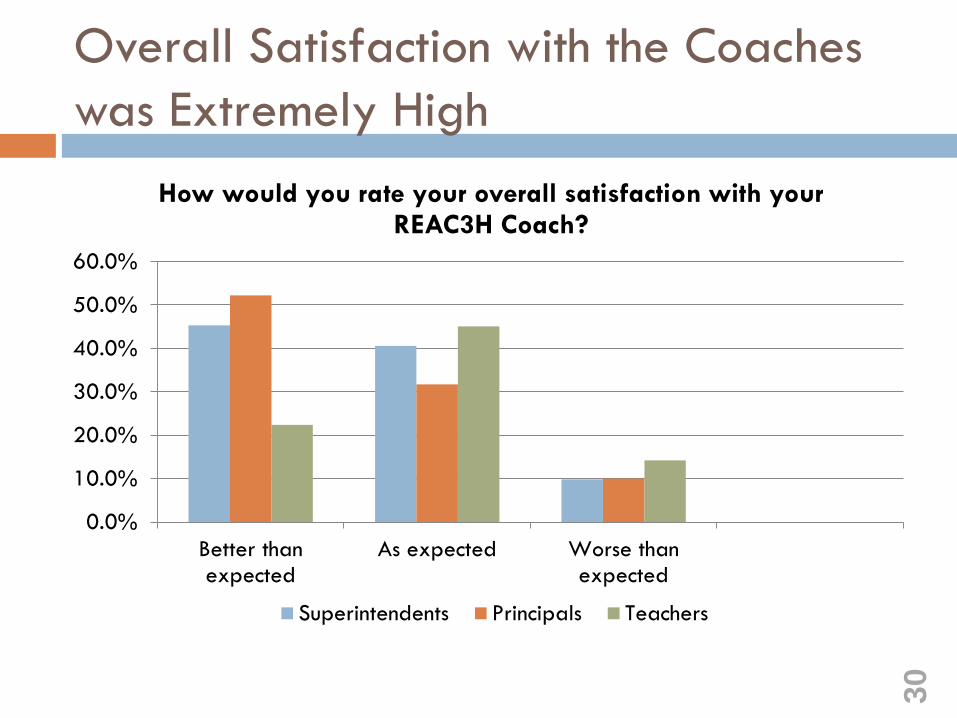
2012–2013 OCCT ACE END-OF-INSTRUCTION RESULTS
Subject % Proficient
2013
Change in % Proficient from 2012
Algebra I 84 +2%
Algebra II 77 +3%
Geometry 83 +1% English II 88 +2% English III 90 +5%
37

OKLAHOMA ACADEMIC STANDARDS
38

PARTICIPATION BY REAC3H REGION
Prepared by the Office of Policy Implementation
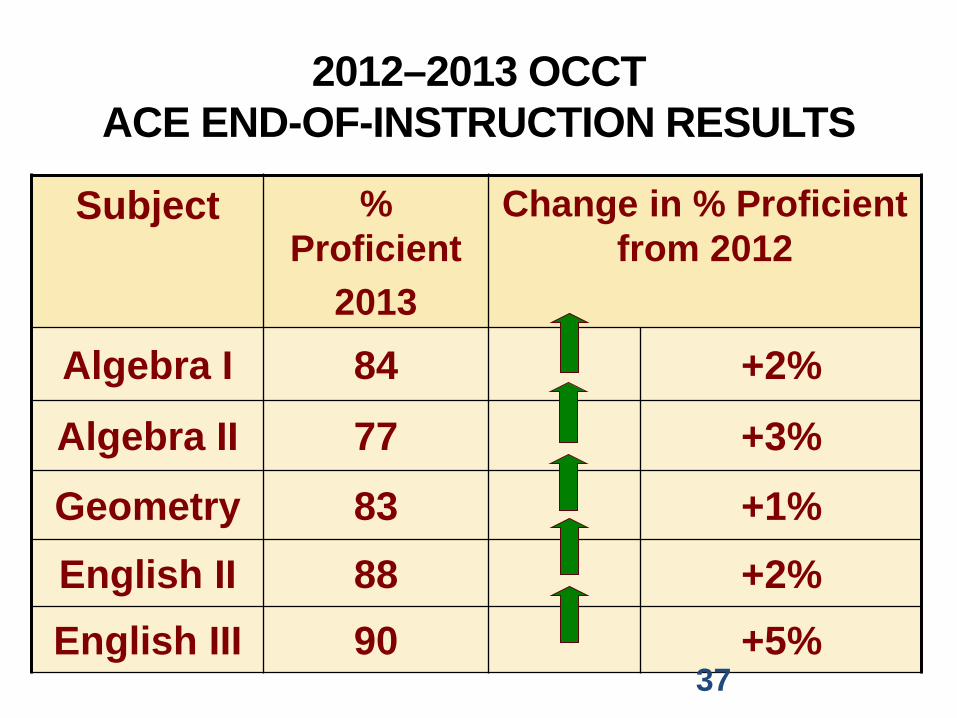
DISTRICT ATTENDANCE Overall Percentage of Districts with at Least One Representative in Attendance (Fall 2013)
*545 Local Education Agencies were represented including districts and charters
224 (41%)
321 (59%)
AttendeesNo Attendees
Prepared by the Office of Policy Implementation
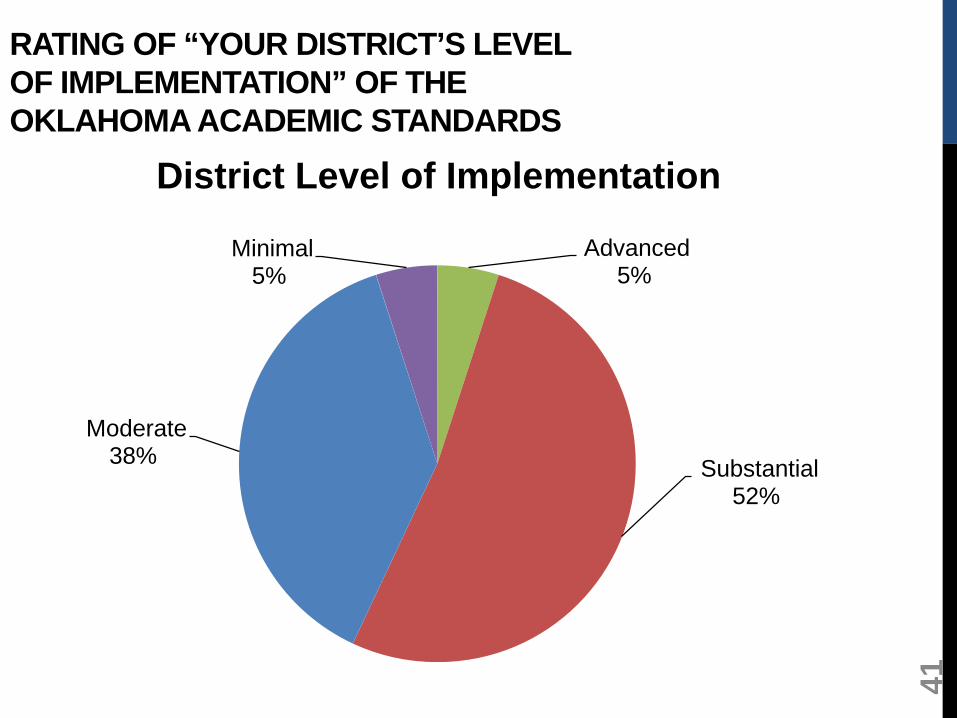
RATING OF “YOUR DISTRICT’S LEVEL OF IMPLEMENTATION” OF THE OKLAHOMA ACADEMIC STANDARDS
Advanced 5%
Substantial 52%
Moderate 38%
Minimal 5%
District Level of Implementation
41

TEACHER AND LEADER
EFFECTIVENESS
42

TEACHER AND LEADER EFFECTIVENESS Line Item
FY 14 appropriation - program detail
FY 15 budget request program detail (funding increases in
bold)
TLE Development of Value Added Component 2,000,000
2,000,000
Staff Development for Schools 4,250,000
4,250,000
Teach for America 2,500,000
2,500,000
43

HOW FAR HAVE WE COME? (2013) 1. Qualitative Model Operational (50%)
2. Roster Verification training sessions; 18 districts fully
participated in voluntary pilot; 52 districts partially participated in voluntary pilot
3. Implemented OAM Pilot (Other Academic Measure)
4. Collected input from Educators on Value Added Models and Non-Tested Grades and Subjects
44

HOW FAR HAVE WE COME? (2013)
5. Continued TLE professional development
• REAC3H Summit, REAC3H Regionals, Vision 2020
• Videoconferences and webinars • Site visits at request of districts, county
cooperatives, and other collaborative organizations
6. Finalized majority of decisions for Value-Added Model
45

WHAT ARE THE NEXT STEPS FOR 2014?
1.Finalize decisions for Student Academic Growth/Teachers of Non-Tested Grades and Subjects
2.Finalize additional decisions for Value-Added Model
3.Collect data from 2012-2013 Observational Frameworks (50%)
4.Continue implementation and monitoring of Roster Verification to collect VAM/SAG data (35%)
46

WHAT ARE THE NEXT STEPS FOR 2014?
5. Collect data from Other Academic Measure pilot year (15%)
6. Create TLE Dashboard and begin implementation with pilot districts
7. Develop and distribute TLE Implementation handbook
8. Continue providing differentiated professional learning opportunities for teachers and leaders
47

School Turnaround
48

SCHOOL IMPROVEMENT FROM FY2013-FY2014
Priority • 12 schools came off the list • Of this, 4 are now Reward
Schools
C3 Schools (lowest performing of the bottom 5%)
• 4 out of 11 now have an A, B, or C
Targeted Intervention
• 17 schools came off the list
• Of this, 5 are now Reward Schools
Focus • 10 schools originally
designated Focus due to low performance in student sub-groups are now Reward Schools
49

ACCOUNTABILITY
50

TESTING
Line Item
FY 14 appropriation - program detail
FY 15 budget request program detail
(funding increases in bold)
Testing 3,000,000
3,000,000
51
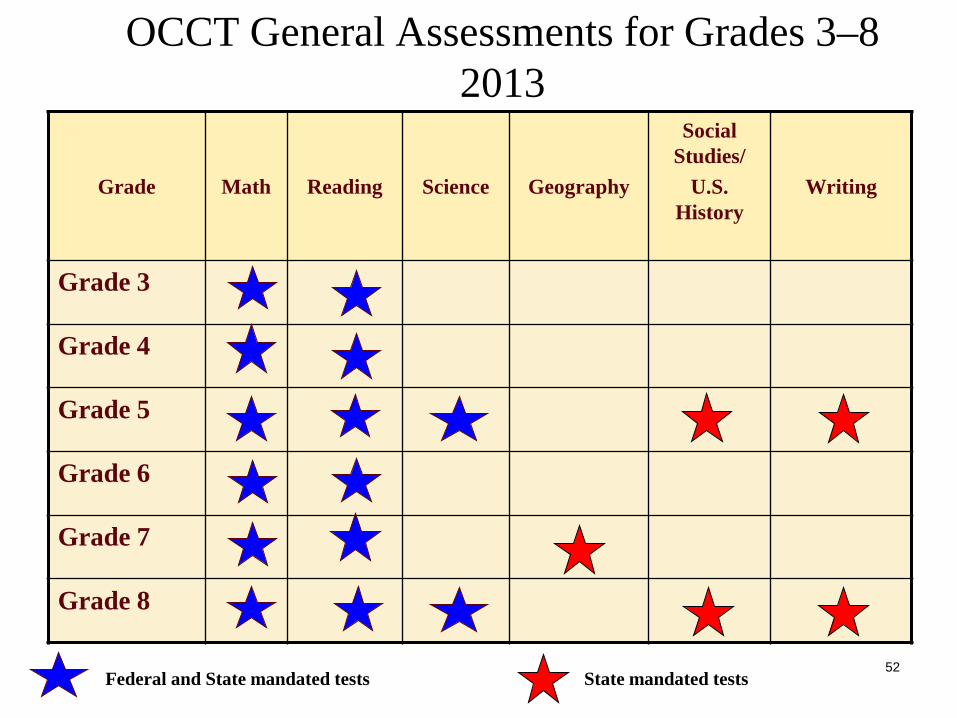
OCCT General Assessments for Grades 3–8 2013
Grade Math Reading Science Geography
Social Studies/
U.S. History
Writing
Grade 3
Grade 4
Grade 5
Grade 6
Grade 7
Grade 8
Federal and State mandated tests State mandated tests 52

OCCT General Assessments End-of-Instruction
2012 – 2013
ACE Algebra I
ACE English
II
ACE Biology I
ACE U.S.
History
ACE Algebra
II
ACE Geometry
ACE English III
Federal and State mandated tests 53

Preparation for Assessments
Surveys to determine Hardware and Bandwidth Speed Test to identify district capabilities and deficits' Partnership with OMES to find solutions Weekly phone calls with vendors Trainings being offered both in person and webinars
54

OKLAHOMA STUDENT INFORMATION SYSTEM
Line Item
FY 14 appropriation - program detail
FY 15 budget request program detail (funding
increases in bold)
Oklahoma Student Information System 2,000,000
2,000,000
55

THE “WAVE” (JULY 2011)
56
“We were not permitted to use WAVE data in the prior administration.
-SDE Employee

1/22/2014 57
Oklahoma Office of Management and Enterprise Services
The Wave Now

MORE DISTRICTS ARE USING WAVE SYSTEM*
15.0%
23.7%
56.8%
4.1% 0.4%
October 2012
All 14
Missing1Missing2-5Missing6-10MissingAll
83.0%
12.4%
4.5% 0.2%
June 2013
All 14
Missing1Missing2-5MissingAll
* There are 20 Wave Objects (data groups) that districts submit to the SDE. Of these 20, 14 are critical as they are required to populate the Early Warning Indicators System – a tool that identifies students who are at risk of dropping out of school. The SDE monitors Wave communications from districts and has worked with districts and their vendors to improve communications and increase the number of districts sending data to
the SDE through the Wave. 58

SCHOOL REFORMS COMPETITIVE GRANT FUNDS
Line Item
FY 14 appropriation
- program detail
FY 15 budget request program
detail (funding increases in bold)
School Reforms Competitive Grants Pool 3,150,000 3,150,000
Robotics: Kiss (Botball) $75,000
Robotics: First $70,000
OK A+ Schools $275,000
Payne Ed. Center: PK-3 $175,000
Great Expectation $1,050,000
Science Fair: ECU $50,000
OKAGE (Social Studies) $200,000
Catapult Learning (Literacy First) $445,000
Street School $185,000
OSU: Rural Oklahoma $86,000
Oklahoma Council on Economic Ed $75,000
$2,800,000 59

AGENCY SAVINGS
60

$1,991,665
$1,789,966
$1,400,000
$1,500,000
$1,600,000
$1,700,000
$1,800,000
$1,900,000
$2,000,000
$2,100,000
Dec
-10
Mar
-11
Jun-
11
Sep-
11
Dec
-11
Mar
-12
Jun-
12
Sep-
12
Dec
-12
Mar
-13
Jun-
13
Sep-
13
Dec
-13
SDE Payroll Per Month 2010-Present
61

343
294
200220240260280300320340360380400
Dec
-10
Feb-
11
Apr
-11
Jun-
11
Aug
-11
Oct
-11
Dec
-11
Feb-
12
Apr
-12
Jun-
12
Aug
-12
Oct
-12
Dec
-12
Feb-
13
Apr
-13
Jun-
13
Aug
-13
Oct
-13
Dec
-13
Number of State Department of Education
Employees 2010-Present
62

State Programs Funded with Carryover from FY 2012 and FY 2013
TLE $1,430,825.00 Special Audits $89,745.00
Think Through Math (Year 1) $428,204.00 K20 Alt Ed (OU) - FY 2012 $91,462.00
Security System in Hodge Building $124,723.00 FY 2012 OMES Contract $550,000.00
Vision 2020 $704,705.00 REAC3H Network (District Outreach) $46,000.00
C3 Schools $47,190.00 REAC3H Coaches $230,000.00
Payne Education Center $334,000.00 Reward Schools $400,000.00 AP Scholarships $624,281.00
AP AVID $52,000.00 Education Delivery Institute $67,286.00
Bill Daggett Center for Educational Leadership $283,880.00 UVA Leadership Program for School Turnaround $108,000.00
Professional Development (Master Teachers) $24,750.00
TOTAL $5,637,051.00 63