Embed Size (px)
Citation preview
Data Center Energy Efficiency, Renewable Energy and Carbon Offset Investment Best Practices
A Guide to Greening Your Organization’s Energy Consumption
Patrick Costello and Roshni Rathi January 2012
RealEnergyWriters.com
© 2012 Patrick Costello and Roshni Rathi
Data Center Energy Efficiency, Renewable Energy and Carbon Offset Investment Best Practices
© 2012 Patrick Costello and Roshni Rathi iii
About the Authors
Patrick Costello is an Associate at ICF International where he works in the Environmental
Markets Group. There he provides a range of renewable energy market analyses, from project-
level strategic support to broad market studies, for project developers, utilities, financial entities,
and industry groups. Patrick regularly models renewable energy supply and demand in markets
across the U.S. as part of a larger exercise in projecting long-term renewable generation
development and renewable energy certificate prices under different market scenarios. Prior to
joining ICF, Patrick served as a Development Associate at BP Alternative Energy, Wind Power
Americas, where he provided market research and geographic siting analysis in support of BP‘s
wind development efforts.
Patrick has authored and coauthored a number of publications that explore policy, technology,
and market dynamics related to renewable energy generation, conventional energy generation,
and energy efficiency investment strategy. Works that Patrick recently coauthored include the
quarterly Integrated Energy Outlook (ICF International, 2011-2012), Firming Renewable
Electric Power Generators: Opportunities and Challenges for Natural Gas Pipelines (Interstate
Natural Gas Association of America, 2011), The Future of Energy Efficiency: Technology and
Strategies to Improve Energy Efficiency (Business Insights, 2010), Investment Decisions for
Baseload Power Plants (U.S. Department of Energy, 2010). Patrick has also contributed to the
Energy Efficiency Markets Newsletter on several occasions.
LinkedIn Profile: http://www.linkedin.com/in/costellopj
Roshni Rathi is an Analyst in the Energy, Natural Resources and Utilities (ENU) group at
Wipro Technologies, where she provides strategic consulting and innovative solutions to help
companies achieve their environmental compliance and sustainability goals. She has broad
experience delivering targeted energy and climate change knowledge products to public- and
private-sector clients. Prior to joining Wipro, Roshni worked as a climate change and
sustainability analyst at ICF International.
Roshni has conducted diverse analyses, such as estimating industrial and lifecycle greenhouse
gas emissions, evaluating abatement costs for low-carbon technology options, and projecting the
impacts of energy-efficiency policies. She has helped develop energy tracking and peer
benchmarking tools, and has led corporate initiatives for employee engagement in sustainability.
For the past three years, Roshni has assessed quantitative uncertainty in greenhouse gas
emissions reported for various source categories in the U.S. Environmental Protection Agency‘s
U.S. Greenhouse Gas Inventory Report.
LinkedIn Profile: http://in.linkedin.com/in/roshnirathi
Data Center Energy Efficiency, Renewable Energy and Carbon Offset Investment Best Practices
© 2012 Patrick Costello and Roshni Rathi iv
Companies and organizations named in this report include:
Facebook, Greenpeace, Uptime Institute, ICF International, The Green Grid, U.S. Environmental
Protection Agency, Digital Realty Trust, U.S. Department of Energy, Lawrence Berkeley
National Laboratory, Onset Computer, Schneider Electric, Power Assure, Intel, AMD, Oracle,
IBM, HP, Cisco, VMWare, CA Technologies, Citrix, Dell, Microsoft, Symantec, IDC, National
Institute of Standards and Technology (NIST), Accenture, WSP Environment & Energy, Google,
Amazon, SalesForce.com, Sun Microsystems, Syracuse University, Qualcomm, Database of
State Incentives for Renewable and Efficiency (DSIRE), OpenEnergyInfo, Neuwing Energy
Ventures, Nexant, Sterling Planet, FuelCell Energy, UTC Power, Bloom Energy, Lazard Ltd.,
Connecticut Department of Public Utility Control, American College Testing, American Council
for an Energy Efficient Economy (ACEEE), U.S. Green Building Council, eBay,42U, Cadmus,
Raritan, Emerson Network Power, AccelOps, Wright Line, Skanska, Lee Technologies,
Cummins, Caterpillar, GE, Ameresco, National Renewable Energy Laboratory (NREL), National
Energy Regulatory Commission (NERC), Federal Trade Commission (FTC), Green-e, Center for
Resource Solutions, SolarBuzz, SunPower, FirstSolar, Sharp, Kyocera Solar, Suntech Power,
Yingli Green Energy, Enphase Energy, SMA America, Fronius USA, Wesco Distribution,
California Solar Center, Electricity Storage Association, BendBroadband Vault, Sonoma
Mountain Data Center, Federal Energy Regulatory Commission (FERC), Nike, European Union
Emissions Trading System (EU ETS), Regional Greenhouse Gas Initiative (RGGI), Yahoo!,
World Resources Institute (WRI), Chicago Climate Exchange, Ecosystem Marketplace and
Bloomberg New Energy Finance, Stockholm Environment Institute, The World Bank, The
Carbon Neutral Company, Carbon Disclosure Project, Haworth
DISCLAIMERS:
The views expressed in this report are those of the authors and do not reflect the views of ICF
International, Wipro Technologies, RealEnergyWriters.com, or any report retailer. While the
authors of this report reference numerous companies and products, the inclusion of those
companies and products does not represent an endorsement by the authors. This report seeks to
identify a sample, not an exhaustive list, of relevant companies and products.
The authors have striven to ensure that all information provided is as accurate as possible;
however, the authors make no warranty or guarantee regarding the accuracy of the information
contained herein. The authors are not liable for any damages of any kind attributable to the use of
this report.
COPYRIGHT AND HOW TO USE THIS REPORT:
The authors hold all rights to this report. They grant those who purchase the report a non-
exclusive, non-transferable, perpetual license to use, print and distribute paper copies of the
report for internal business purposes only. The report may not be distributed in any electronic
manner, including posting on web sites or social networks, or sent via email without written
permission of the authors. For questions, please contact the authors at
Data Center Energy Efficiency, Renewable Energy and Carbon Offset Investment Best Practices
© 2012 Patrick Costello and Roshni Rathi v
Table of Contents
Executive Summary ......................................................................................................................... i
Chapter 1 Introduction .................................................................................................................... 1
Chapter 2 Energy Efficiency ........................................................................................................... 3
Introduction ............................................................................................................................... 3
Efficiency and Sustainability Metrics ....................................................................................... 5
Identifying Appropriate Efficiency Solutions ........................................................................... 6
Energy Efficiency Solutions – Best Practices and Innovative Strategies ............................... 10
Demand-Side Energy Efficiency Solutions ............................................................................ 11
Server Processors .............................................................................................................. 11
Server Virtualization ......................................................................................................... 13
Cloud Computing .............................................................................................................. 15
Supply-Side Energy Efficiency Solutions .............................................................................. 16
Power Supply .................................................................................................................... 16
Cooling and Airflow Management ................................................................................... 17
Cooling Systems and Potential Improvements ........................................................... 18
Improvements in Airflow ............................................................................................ 21
General Improvements ................................................................................................ 26
Cogeneration ..................................................................................................................... 27
Hydrogen Fuel Cells ......................................................................................................... 32
Communicating Energy Efficiency Improvements ................................................................ 38
Chapter 3 Renewable Energy........................................................................................................ 40
Introduction ............................................................................................................................. 40
Key Background Information ................................................................................................. 41
Influence of Renewable Energy on PUE and CUE .......................................................... 41
Overview of Renewable Energy Certificates (RECs) ....................................................... 42
Basics of REC Accounting ............................................................................................... 43
Develop On-site Renewable Energy ....................................................................................... 44
Benefits ............................................................................................................................. 45
Cost and Performance Considerations .............................................................................. 46
Data Center Energy Efficiency, Renewable Energy and Carbon Offset Investment Best Practices
© 2012 Patrick Costello and Roshni Rathi vi
Integration Considerations ................................................................................................ 51
Scope of On-site Solar PV System Development ............................................................. 53
Contract or Partner with a Project Developer ......................................................................... 55
Purchase Voluntary Renewable Energy Market Products ...................................................... 57
Issues Associated with RECs .................................................................................................. 61
Risk of Double-Counting RECs and Associated Environmental Benefits ....................... 62
Limits of Voluntary REC Investments ............................................................................. 63
Communicating Renewable Energy Investments ................................................................... 66
Chapter 4 Carbon Offsets.............................................................................................................. 69
Introduction ............................................................................................................................. 69
Overview of Offset Markets ................................................................................................... 72
Purchasing Offsets .................................................................................................................. 72
Key Criteria to Ensure the Environmental Integrity of Offsets ........................................ 73
Third-Party Standards ....................................................................................................... 74
Types of Offset Projects.................................................................................................... 76
Location and Vintage ........................................................................................................ 78
Risks and Controversies .......................................................................................................... 79
Communicating Carbon Offset Purchases .............................................................................. 82
Chapter 5 Report Conclusion ........................................................................................................ 84
Appendix – Assumptions Used in Exhibit 45 ............................................................................... 89
Works Cited .................................................................................................................................. 92
Data Center Energy Efficiency, Renewable Energy and Carbon Offset Investment Best Practices
© 2012 Patrick Costello and Roshni Rathi vii
Table of Figures
Exhibit 1: Data Center Tiers and Associated Characteristics ......................................................... 4
Exhibit 2: Data Center Electricity Flow .......................................................................................... 5
Exhibit 3: Onset HOBO Data Logger ............................................................................................. 8
Exhibit 4: Sample Computer Room CFD Model Output ............................................................... 9
Exhibit 5: Overview of Data Center Energy Consumption .......................................................... 10
Exhibit 6: The Cascade Effect ...................................................................................................... 11
Exhibit 7: Blade Server ................................................................................................................. 13
Exhibit 8: Illustrative Server Virtualization .................................................................................. 14
Exhibit 9: Effect of Utilization on UPS Efficiency ...................................................................... 17
Exhibit 10: Effect of Blanking Panels on Rack Airflow............................................................... 23
Exhibit 11: Hot Aisle/Cold Aisle Rack Arrangement................................................................... 23
Exhibit 12: Front-view Perspective of Side-to-side Airflow with In-rack Air Distribution
Equipment ..................................................................................................................................... 24
Exhibit 13: CRAC Electrical Costs as a Function of Average Rack Power Density ................... 26
Exhibit 14: EPA eGrid Subregion Map ........................................................................................ 28
Exhibit 15: Schematic of Cogeneration Integrated with Data Center Power System................... 30
Exhibit 16: States that Include Cogeneration as an RPS Eligible Technology ............................. 31
Exhibit 17: Fuel Cell Electricity Generation Overview ................................................................ 33
Exhibit 18: Illustrative Comparison of Power Generation and Electric Grid CO2 Emission Rates
....................................................................................................................................................... 34
Exhibit 19: Fuel Cell Generation CO2 Emissions Rate vs. Electric Grid CO2 Intensity by EPA
eGrid Subregion ............................................................................................................................ 35
Exhibit 20: Total Cost of Ownership Comparison between On-site Generation Systems ........... 37
Exhibit 21: Sample Energy Efficiency Solution Providers ........................................................... 39
Exhibit 22: Range of Renewable Energy Investment Options ..................................................... 41
Exhibit 23: Categories of Emissions ............................................................................................. 43
Exhibit 24: Installed Cost Trends over Time by PV System Size ................................................ 47
Exhibit 25: Incentive Levels and Net Installed Costs across States for Commercial PV Systems
Installed in 2009 ............................................................................................................................ 48
Exhibit 26: Illustrative Capacity Factor-Driven Variation in LCOE ............................................ 50
Exhibit 27: Sample Solar PV Generation Profile by Hour of Day and Month of Year ................ 51
Exhibit 28: Overview of Available Net Metering Policies and Capacity Limits (kW) by State .. 52
Exhibit 29: Capital Cost Estimates for Energy Storage Technologies ......................................... 53
Exhibit 30: Overview of Commercial, Government, and Non-Profit On-Site Solar PV
Installations in California .............................................................................................................. 54
Exhibit 31: Sample List of Data Centers with On-Site Solar PV Systems ................................... 55
Exhibit 32: States with Green-e Certified Green Power Purchase Program Products .................. 58
Exhibit 33: NERC Regions ........................................................................................................... 58
Exhibit 34: Estimated Annual Green Power Sales by Market Sector, 2005-2009 ....................... 60
Data Center Energy Efficiency, Renewable Energy and Carbon Offset Investment Best Practices
© 2012 Patrick Costello and Roshni Rathi viii
Exhibit 35: Estimated Annual Green Power Sales by Customer Segment and Market Sector,
2009 (Millions of MWh) ............................................................................................................... 61
Exhibit 36: Historical Wholesale U.S. Voluntary REC Prices ..................................................... 64
Exhibit 37: GHG Offset Transaction ............................................................................................ 70
Exhibit 38: Carbon Offset Transaction Volume by Standard, OTC 2009 .................................... 75
Exhibit 39: Average Carbon Offset Price by Standard, OTC 2009 ($/tCO2e) ............................. 76
Exhibit 40: Average Carbon Offset Price and Price Range by Project Type, OTC 2009 ($/tCO2e)
....................................................................................................................................................... 77
Exhibit 41: Carbon Offset Transaction Volume by Project Type, OTC 2009.............................. 78
Exhibit 42: Average Carbon Offset by Region, OTC 2008 vs. 2009 ($/tCO2e) ........................... 79
Exhibit 43: Chicago Climate Exchange Certified Emission Reduction Average Historical Closing
Price .............................................................................................................................................. 81
Exhibit 44: Range of Energy-Related Sustainability Improvement Options – Recommended
Order of Investment ...................................................................................................................... 84
Exhibit 45: Comparison of Effective Cost of CO2 Emission reductions Sourced from Carbon
Offsets, Unbundled RECs, Bundled RECs, and Illustrative On-site Solar PV and Fuel Cell
Generation ..................................................................................................................................... 86
Exhibit 46: Assumptions for the Comparison of Effective Cost of CO2 Emission Reductions
from RECs, Offsets an On-site Renewable Generation ................................................................ 89
Exhibit 47: Assumptions for Estimation of Levelized Costs of Electricity (LCOE) for On-site
Generation ..................................................................................................................................... 91
Exhibit 48: Fuel Cell Emission Assumption ................................................................................. 91
Data Center Energy Efficiency, Renewable Energy and Carbon Offset Investment Best Practices
© 2012 Patrick Costello and Roshni Rathi 1
Chapter 1 Introduction
Public concern about environmental sustainability and corporate stewardship has grown steadily
in recent years. In particular, the impact of greenhouse gas (GHG) emissions on climate change
and the role of fossil fuel electricity generation as the largest source of GHG emissions in the
U.S. have attracted substantial attention. Emissions associated with electricity consumption are
often a significant barrier to improving the environmental profile of many organizations because
the average amount of CO2 emitted per unit of electricity consumed is very high.
IT and telecom firms, many known for their progressive, game-changing strategies, have led the
charge in reducing energy use and associated emissions. Several of these companies have
focused their efforts on data centers, which contribute significantly to the companies‘ total
environmental footprints. Data centers are facilities that house equipment to store, manage, and
distribute digital information. They already make up about 1.5%1 of national electricity use in the
U.S. and account for an annual GHG impact of at least 76 million metric tons of CO2e
(MtCO2e).2,3
The energy and GHG impacts of data centers are expected to more than double by
2020.4
Many highly visible IT and telecom companies reap public relations and environmental benefits
by following industry best-practices and implementing data center energy efficiency, renewable
energy, and carbon offset investment strategies. Organizations across sectors can learn from and
adopt these strategies to improve their own environmental sustainability.
This year, seven of the top ten organizations in Newsweek’s Green Rankings were IT and
telecom companies, with IBM, HP and Sprint Nextel in the lead.5 Not to be outdone, Intel ranked
1st in the U.S. Environmental Protection Agency‘s list of top green power purchasers.
6 And like
many other companies that have invested heavily in data center efficiency, Facebook announced
the construction of two of the most energy-efficient data centers in the world in Prineville,
Oregon and Forest City, North Carolina.7
Investing in green products and solutions, however, does not always translate into positive PR.
Organizations should be careful about how they communicate their efforts and be aware of how
the investments of other organizations have been praised or criticized by the press. .
1 U.S. EPA 2007b
2 Greenhouse gases vary in their contribution to climate change, with small concentrations of some gases being far
more potent than others. Global Warming Potential (GWP) is a measure of the global warming impact of a gas as
compared to that of carbon dioxide. GHG quantities are converted to carbon dioxide ―equivalents‖ by multiplying
the amount of each gas with its Global Warming Potential (GWP). This enables comparisons of the impacts of
different types of GHGs. 3 The Climate Group 2008
4 The Climate Group 2008
5 Newsweek 2011
6 U.S. EPA 2011p
7 Rusli 2010
Data Center Energy Efficiency, Renewable Energy and Carbon Offset Investment Best Practices
© 2012 Patrick Costello and Roshni Rathi 2
For example, Dell, the leader of Newsweek’s Green Rankings in 2010, was criticized by The
Wall Street Journal only a few years ago. Responding to the IT company‘s announcement that it
had become ‗carbon neutral‘ in 2008, the newspaper suggested that Dell may have misled the
public about the extent of its achievement. The WSJ also questioned the incremental
environmental benefits of the Renewable Energy Credits (RECs) that Dell purchased to offset its
carbon emissions.8 Earlier that same year, The Inquirer criticized Intel‘s REC purchases on
similar grounds.9 And despite Facebook‘s development of extremely high-efficiency data
centers, Greenpeace launched a campaign to ―unfriend‖ Facebook CEO Mark Zuckerburg as
long as Facebook continues to build its data centers in utility regions, like that of Pacific Power
in Oregon, that Greenpeace asserts are disproportionally powered by coal generation relative to
the national average level.10
At a time when the label ‗green‘ can be ambiguous due to misuse and overuse, GHG-reduction
and energy-efficiency strategies are sparking debate over, and redefining public expectations
about what it means to be ‗green‘. Increasingly savvy consumers, skeptical industry watchdogs,
and agile reporters are quick to distinguish between genuine environmental commitments and so
called ―greenwashing.‖ For this reason, it‘s critical that organizations seeking PR benefits from
green investments use transparent and accurate communication.
This guide offers an overview of best-practice and innovative energy and emission reduction
strategies implemented by IT and telecom companies to reduce emissions associated with energy
consumption. It provides information about:
Available data center energy efficiency, renewable energy, and carbon offset investment
options
The financial and environmental costs and benefits associated with these options
Potential risks and criticisms associated with green investments
Suggested ways to communicate green investments to stakeholders
The first step in building an effective greening strategy is to conduct an energy assessment and a
greenhouse gas inventory to establish a baseline against which success can be measured. Once
the baseline has been established, organizations should set aggressive yet reasonable goals to
reduce energy consumption and emissions below the baseline. Organizations can use the
information in this guide to assess pros, cons and trade-offs of available options and develop a
tailored integrated greening and communications strategy.
8 Ball 2008
9 Harding 2008
10 Greenpeace 2010b

Data Center Energy Efficiency, Renewable Energy and Carbon Offset Investment Best Practices
© 2012 Patrick Costello and Roshni Rathi 3
Chapter 2 Energy Efficiency
Introduction
An increasing number of commercial, government, and non-profit organizations are cutting their
energy use and associated carbon footprints by improving the energy efficiency of their data
centers. Organizations that reduce their carbon emissions by improving efficiency, rather than by
purchasing RECs or carbon offsets, are often perceived as taking more direct responsibility for
their environmental impact. Google and Yahoo!, two leaders in green IT, have both shifted to
this efficiency-focused approach, prompting many other organizations to also invest in energy
efficiency solutions for their data center operations.
Data center electricity consumption represents about 1.5% of total U.S. electricity load, and this
share is growing quickly. The U.S. Environmental Protection Agency (EPA) estimates that U.S.
data center energy consumption doubled between 2000 and 2006, and it projects that
consumption has since doubled again.11
Emissions will rise in step with consumption, and one
estimate projects that global data center emissions will quadruple from 2007 levels by 2020.12
Energy-intensive data centers can be a substantial barrier to achieving green operations at many
companies. Implementing data center efficiency solutions can protect and sometimes enhance an
organization‘s image. However, improving data center efficiency is now more commonly
perceived as a ―must-do‖ rather than as an admirable goal. Greenpeace recently voiced this view
in its criticism of Facebook‘s new ultra-efficient data center in Oregon. The environmental
organization wrote a letter to Facebook saying, ―Efficiency is certainly important, but is only the
beginning of taking responsibility for your rapidly growing energy and environmental
footprint.‖13
Decreasing data center energy consumption is not only a PR opportunity, but also a financial
opportunity. On average, data centers experience energy costs per square foot that are 10 to 30
times those of office buildings.14
Data center efficiency solutions yield immediate, permanent
reductions in energy costs and decrease exposure to power market volatility. Efficiency solutions
also reduce exposure to potential federal greenhouse gas regulations, which are unlikely to be
passed in the next few years but could still impact large-scale, long-term data center investments.
In many cases the most cost-effective greening approach for organizations with medium to large
data center operations is to implement data center efficiency solutions.
Data centers typically fall within one of the following categories: traditional enterprise, on-
demand enterprise, telecom, high performance computing (scientific), hosting, internet, and
hybrid.15
The data center classes across these categories range from small server closets with a
handful of servers to enterprise-class systems with thousands of servers. The Uptime InstituteTM
provides data center design standards that are used to assign new or upgraded data centers to tiers
11
U.S. EPA 2007b 12
Kamplam et al. 2008 13
Greenpeace 2010a 14
LBNL 2006 15
7X24 et al. 2010a
Data Center Energy Efficiency, Renewable Energy and Carbon Offset Investment Best Practices
© 2012 Patrick Costello and Roshni Rathi 4
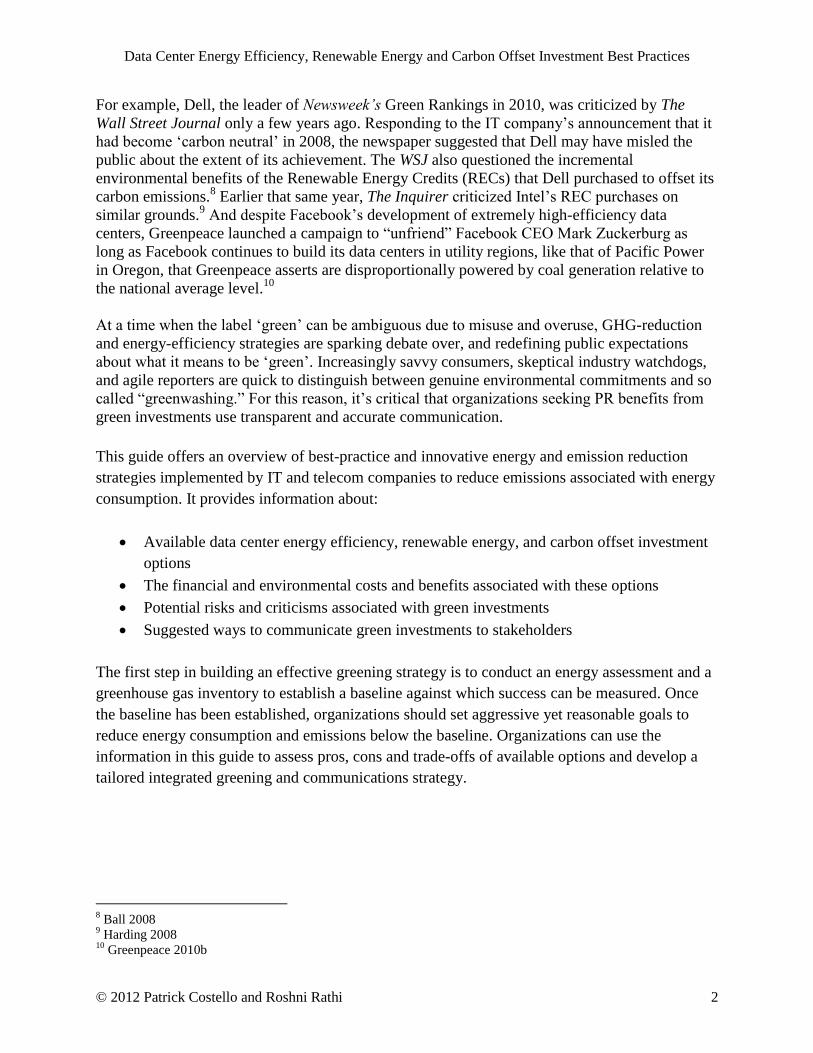
or classes based on their availability, downtime and power supply redundancy.16
Exhibit 1 below
provides a basic overview of data center tiers as defined by the Uptime Institute standard.
Exhibit 1: Data Center Tiers and Associated Characteristics
Sources: Turner et al. 2005 and EdgeBCC 2009
While the majority of U.S. data centers are relatively small and have less than a few dozen
servers, mid-tier and enterprise-class data centers collectively consume more energy.17
This
report explores efficiency solutions appropriate for a broad range of data centers.
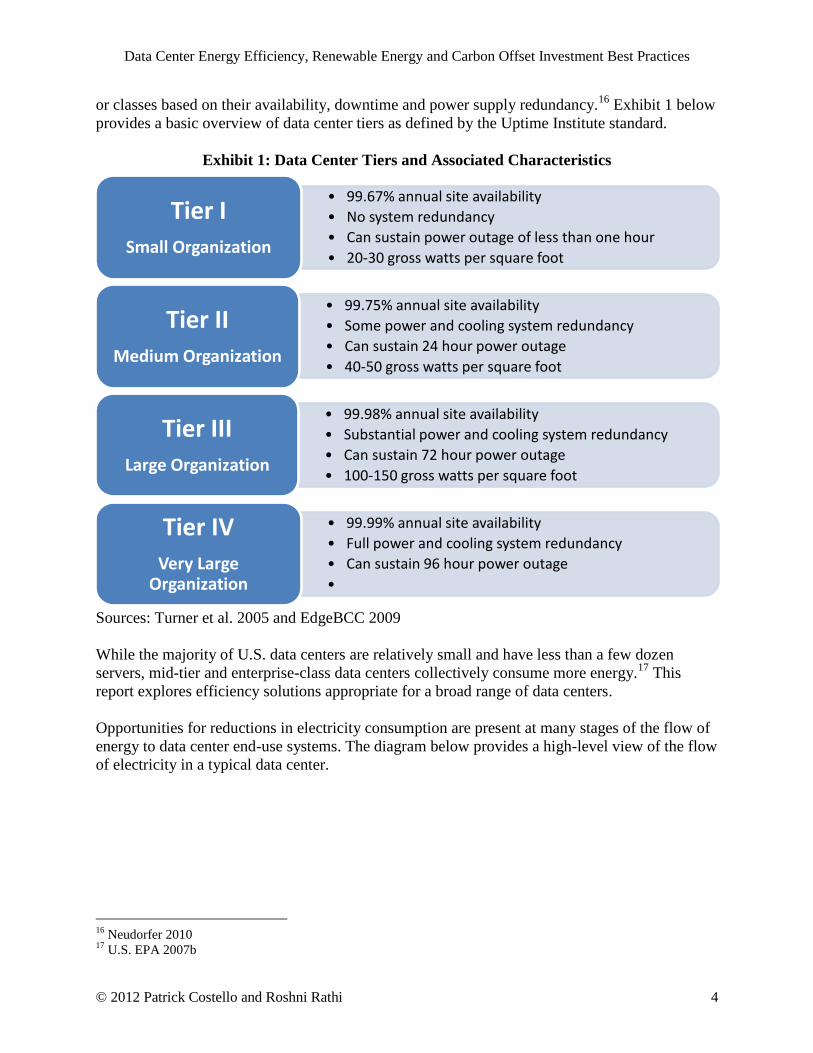
Opportunities for reductions in electricity consumption are present at many stages of the flow of
energy to data center end-use systems. The diagram below provides a high-level view of the flow
of electricity in a typical data center.
16
Neudorfer 2010 17
U.S. EPA 2007b
• 99.67% annual site availability
• No system redundancy
• Can sustain power outage of less than one hour
• 20-30 gross watts per square foot
Tier I
Small Organization
• 99.75% annual site availability
• Some power and cooling system redundancy
• Can sustain 24 hour power outage
• 40-50 gross watts per square foot
Tier II
Medium Organization
• 99.98% annual site availability
• Substantial power and cooling system redundancy
• Can sustain 72 hour power outage
• 100-150 gross watts per square foot
Tier III
Large Organization
• 99.99% annual site availability
• Full power and cooling system redundancy
• Can sustain 96 hour power outage
•
Tier IV
Very Large Organization
Data Center Energy Efficiency, Renewable Energy and Carbon Offset Investment Best Practices
© 2012 Patrick Costello and Roshni Rathi 5
Exhibit 2: Data Center Electricity Flow
Source: ICF International 2009, Prepared for ORNL
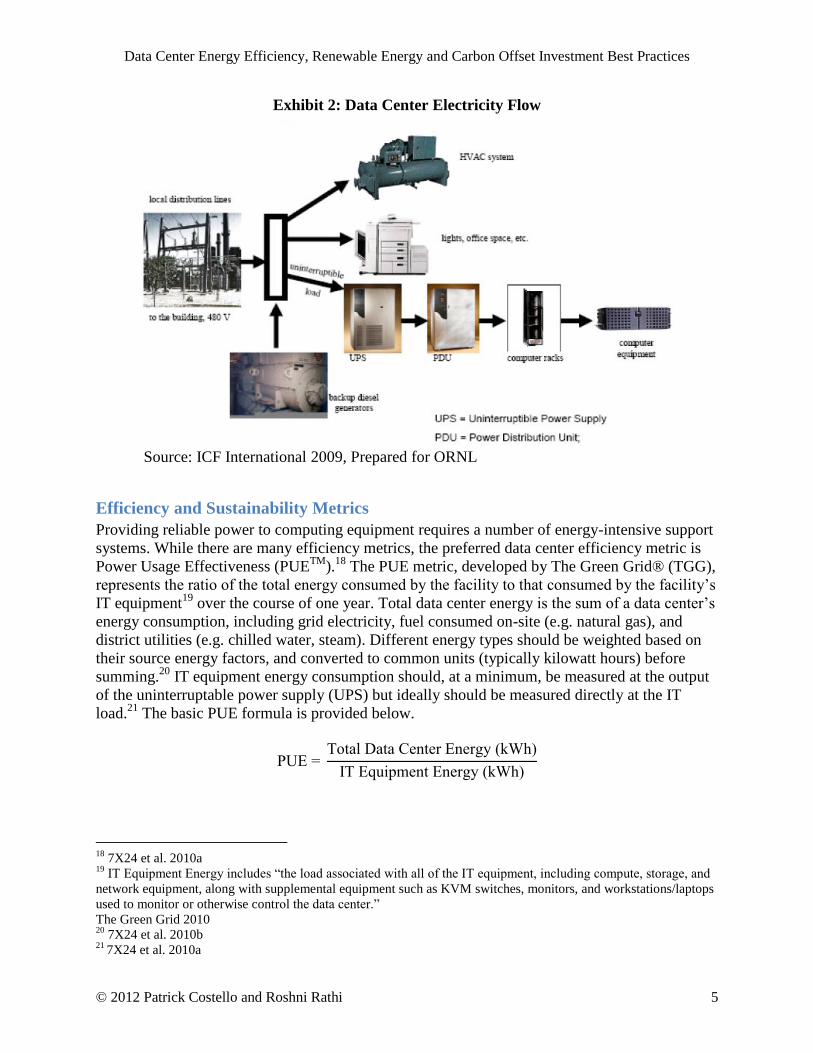
Efficiency and Sustainability Metrics
Providing reliable power to computing equipment requires a number of energy-intensive support
systems. While there are many efficiency metrics, the preferred data center efficiency metric is
Power Usage Effectiveness (PUETM
).18
The PUE metric, developed by The Green Grid® (TGG),
represents the ratio of the total energy consumed by the facility to that consumed by the facility‘s
IT equipment19
over the course of one year. Total data center energy is the sum of a data center‘s
energy consumption, including grid electricity, fuel consumed on-site (e.g. natural gas), and
district utilities (e.g. chilled water, steam). Different energy types should be weighted based on
their source energy factors, and converted to common units (typically kilowatt hours) before
summing.20
IT equipment energy consumption should, at a minimum, be measured at the output
of the uninterruptable power supply (UPS) but ideally should be measured directly at the IT
load.21
The basic PUE formula is provided below.
PUE Total Data Center Energy kWh
IT Equipment Energy kWh
18
7X24 et al. 2010a 19
IT Equipment Energy includes ―the load associated with all of the IT equipment, including compute, storage, and
network equipment, along with supplemental equipment such as KVM switches, monitors, and workstations/laptops
used to monitor or otherwise control the data center.‖
The Green Grid 2010 20
7X24 et al. 2010b 21
7X24 et al. 2010a
Data Center Energy Efficiency, Renewable Energy and Carbon Offset Investment Best Practices
© 2012 Patrick Costello and Roshni Rathi 6
Ideally, a data center would achieve a PUE of 1.0, a level that indicates that every unit of energy
is used to power IT equipment. A recent survey conducted by EPA as part of its ENERGY
STAR® Data Center Initiative found that its representative sample of data centers had a PUE
range of 1.25 to 3.75 and an average PUE of 1.9. This average indicates that the typical data
center expends an additional 0.9 W for every 1 W of energy needed to power computer
equipment.22
While PUE is one of the most commonly used efficiency metrics, it does not reflect all efficiency
characteristics of a data center. In particular, PUE may not adequately capture improvements in
the energy efficiency of IT equipment, because reductions in energy consumed by IT equipment
are reflected both in the numerator and the denominator in the PUE formula. Some metrics that
highlight other aspects of data center energy efficiency include Corporate Average Data Center
Efficiency (CADE), Data Center Infrastructure Efficiency (DCiE), Data Center energy
Productivity (DCeP), and Energy Reuse Effectiveness (ERE).
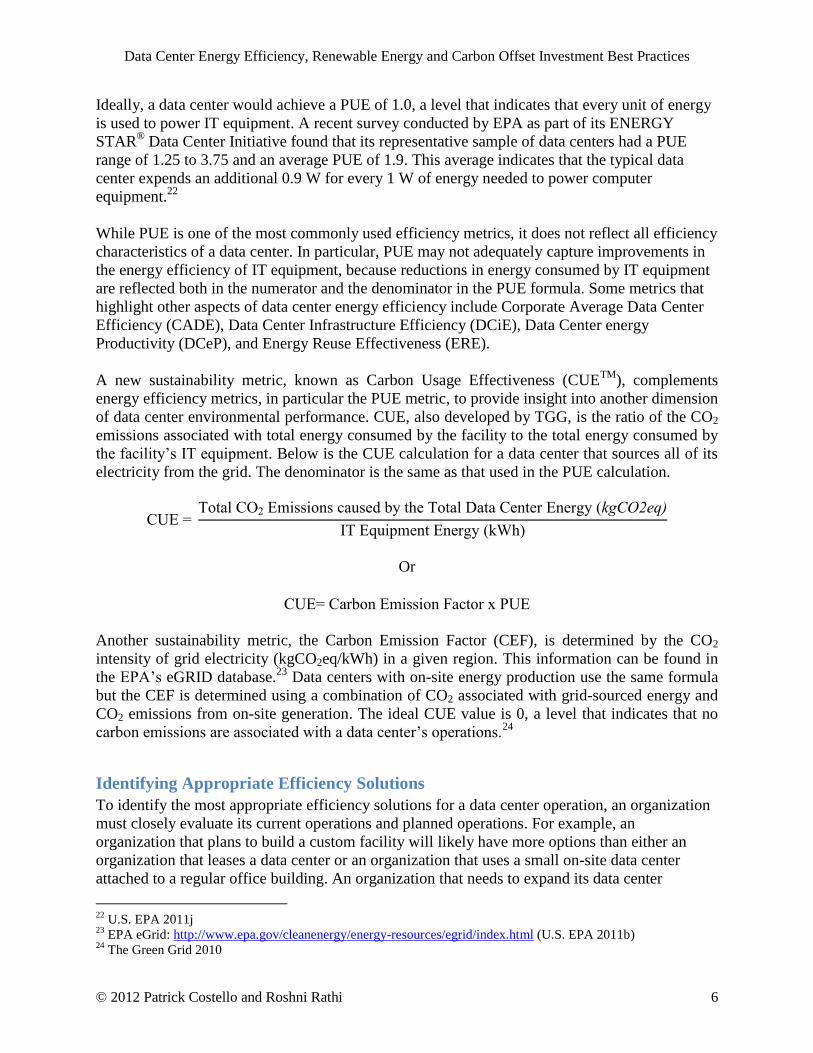
A new sustainability metric, known as Carbon Usage Effectiveness (CUETM
), complements
energy efficiency metrics, in particular the PUE metric, to provide insight into another dimension
of data center environmental performance. CUE, also developed by TGG, is the ratio of the CO2
emissions associated with total energy consumed by the facility to the total energy consumed by
the facility‘s IT equipment. Below is the CUE calculation for a data center that sources all of its
electricity from the grid. The denominator is the same as that used in the PUE calculation.
CUE Total CO2 Emissions caused by the Total Data Center Energy kgCO eq
IT Equipment Energy kWh
Or
CUE Carbon Emission Factor x PUE
Another sustainability metric, the Carbon Emission Factor (CEF), is determined by the CO2
intensity of grid electricity (kgCO2eq/kWh) in a given region. This information can be found in
the EPA‘s eGRID database.23
Data centers with on-site energy production use the same formula
but the CEF is determined using a combination of CO2 associated with grid-sourced energy and
CO2 emissions from on-site generation. The ideal CUE value is 0, a level that indicates that no
carbon emissions are associated with a data center‘s operations.24
Identifying Appropriate Efficiency Solutions
To identify the most appropriate efficiency solutions for a data center operation, an organization
must closely evaluate its current operations and planned operations. For example, an
organization that plans to build a custom facility will likely have more options than either an
organization that leases a data center or an organization that uses a small on-site data center
attached to a regular office building. An organization that needs to expand its data center
22
U.S. EPA 2011j 23
EPA eGrid: http://www.epa.gov/cleanenergy/energy-resources/egrid/index.html (U.S. EPA 2011b) 24
The Green Grid 2010
Data Center Energy Efficiency, Renewable Energy and Carbon Offset Investment Best Practices
© 2012 Patrick Costello and Roshni Rathi 7
operations may choose among options such as a move-in-ready data center, a custom-designed
data center, and an expanded on-site data center. Companies like Digital Reality Trust help
organizations evaluate these options and the array of applicable efficiency solutions.25
The type of efficiency improvements an organization can implement if it has an existing data
center facility and wishes to continue using it will depend on whether the organization is
repurposing some or all of the facility, expanding the facility, or optimizing the facility. There
are a number of key steps that should be undertaken to identify the most appropriate efficiency
solutions:
Develop a component-level and system-level energy baseline (using current and past
energy use) against which efficiency efforts can be measured
Benchmark facility-level energy use and component-level energy use
Project future energy use and needs
Evaluate data trends to identify and prioritize opportunities for efficiency improvement
Several publicly available software tools can help organizations complete these steps, including
the Department of Energy (DOE) Data Center Profiling Tool, Air Management Tool, and
Electrical Systems Tool26
, Lawrence Berkeley National Laboratory (LBNL) Data Center Tools27
,
and Schneider Electric‘s TradeOff ToolsTM
.28
In assessing energy efficiency opportunities, it is important to carefully measure component and
system power consumption by using monitoring equipment as well as computer models. As the
Uptime Institute notes, ―You can‘t manage what you don‘t measure.‖29
Detailed measurements
reveal the extent of potential improvements as well as the potential server capacity that could
become available.30
Such measurement may reveal that system components are:
Not optimized for their locations
Unnecessarily wasting energy by working against one another
Working unnecessarily hard
Consuming an unexpected amount of energy, even while idle.
Some data centers waste a substantial amount of energy through inefficient airflow and by using
more cooling capacity than necessary to achieve optimal equipment performance. An example of
system components working against one another is when computer room air conditioner (CRAC)
units in the same room may not work in unison, sometimes because they are not centrally
25
Digital Realty Trust: www.digitalrealtytrust.com (Digital Realty Trust 2010) 26
U.S. DOE Tools: http://www1.eere.energy.gov/industry/datacenters/software.html (U.S. DOE 2011b) 27
LBNL Tools: http://hightech.lbl.gov/DCTraining/tools.html (LBNL 2011) 28
Schneider Electric Tools: http://www.apc.com/prod_docs/results.cfm?DocType=Trade-
Off%20Tool&Query_Type=10 (Schneider Electric 2011) 29
Raritan 2009 30
Trowbridge 2010
Data Center Energy Efficiency, Renewable Energy and Carbon Offset Investment Best Practices
© 2012 Patrick Costello and Roshni Rathi 8
controlled, with one unit humidifying while the other is dehumidifying.31
Substantial energy
waste can also result from inefficient airflow and heat transfer.
Energy waste can be identified at a data center in just two to four weeks using data logging
instruments that track critical performance measures such as power use, airflow, temperature,
and humidity at key system locations.32
Data measurements outside a data center facility are
useful as well. Organizations have become increasingly interested in obtaining detailed on-site
weather measurements to calibrate the performance of data center components such as the
HVAC system.33
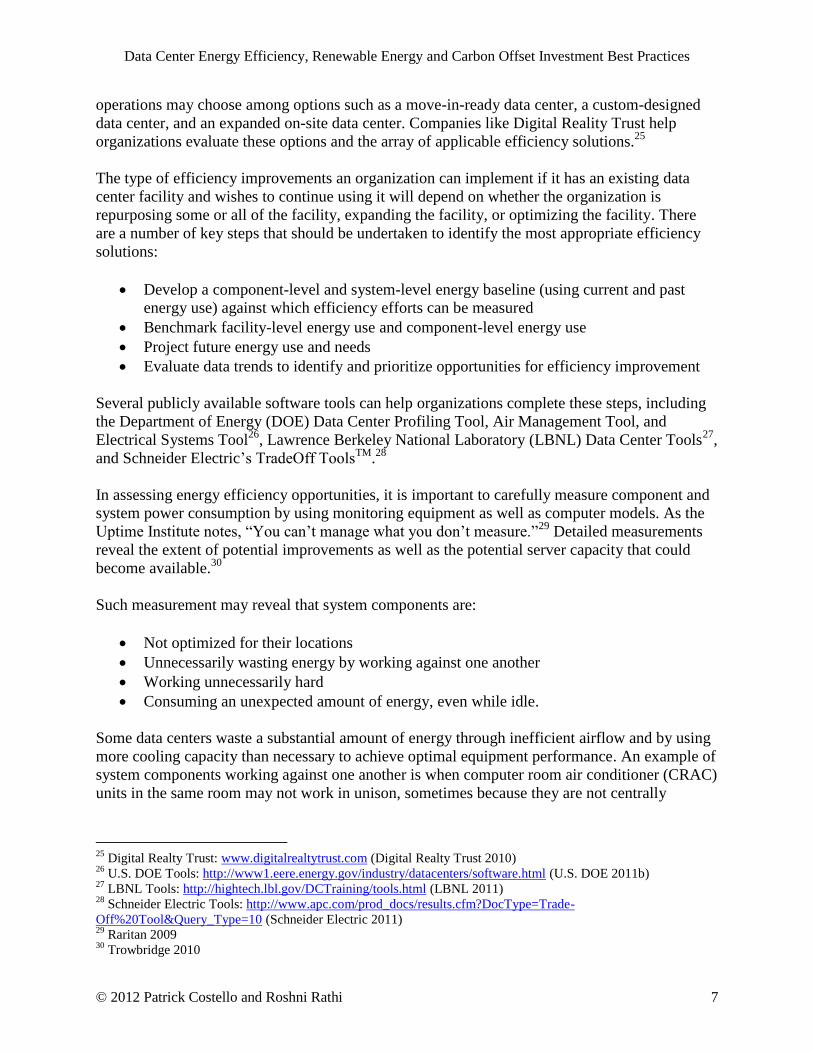
Data logging tools, such as Onset® Computer‘s HOBO® shown in Exhibit 3
below, can be set up quickly for internal and external evaluations and can wirelessly transmit
data that is then aggregated and viewed remotely through an online analysis platform.
Exhibit 3: Onset HOBO Data Logger
Source: Onset Computer 2011
Software-based measurement tools can also be used to identify energy wastes. As highlighted
later in this chapter, servers in idle mode typically use between 70% and 85% of the power
consumed when fully operational, and data centers often have numerous idle servers that are
unnecessary.34
The company 1E® sells server performance management and evaluation software
that measures physical and virtual server-level energy consumption to support server power
management and identify opportunities to decommission unneeded servers.35
Schneider Electric,
an industry leader in energy management services, also provides software monitoring solutions
and identifies the following data center junctures as some of the most important to evaluate for
efficiency losses:
Point of connection between utility and facility
31
Korn 2010 32
Evans 2010a 33
Evans 2010a 34
Emerson Network Power 2009 35
Cohn 2009a and Cohn 2009b
1E NightWatchman® Server Edition: http://www.1e.com/softwareproducts/nightwatchmanserver/index.aspx (1E
2011)
Data Center Energy Efficiency, Renewable Energy and Carbon Offset Investment Best Practices
© 2012 Patrick Costello and Roshni Rathi 9
Between power transfer equipment and ancillary system power distribution equipment
Between on-site generators and power transfer equipment
Between power transfer equipment and cooling distribution equipment
Between essential cooling systems and cooling distribution equipment
Between power transfer equipment and UPS systems/associated switchgear
Between UPS systems/associated switchgear and power distribution units
At the branch circuits between the power distribution units and critical loads36
Another company that offers data center efficiency assessments is PowerAssure®, which
provides Dynamic Power Management (DPM) software that can integrate any device, sensor,
and management system to provide a holistic view of data center performance and identify
efficiency improvement opportunities.37
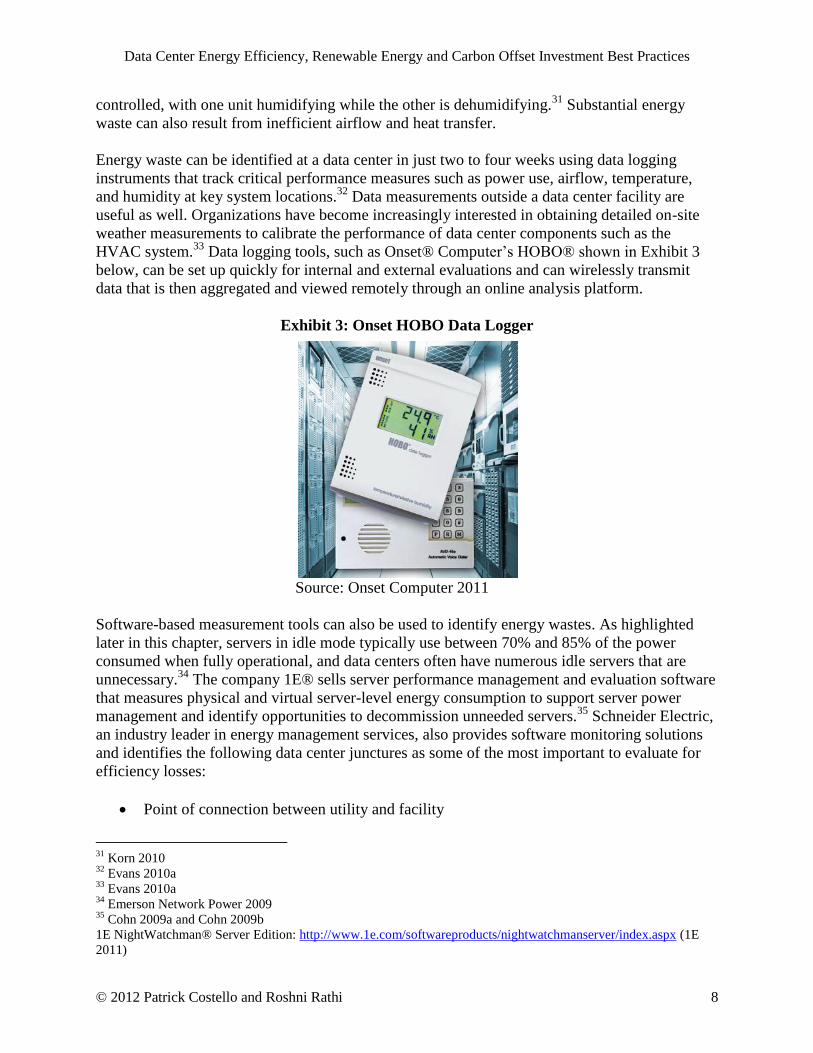
Computer simulation models can supplement hardware and software-based measurement tools.
For example, computational fluid dynamics (CFD) 3-D modeling can provide important
information about how to reconfigure and possibly retrofit server rooms to achieve substantial IT
equipment and upstream efficiency gains.38
Exhibit 4 below is the sample output of a CFD model
of a server room.
Exhibit 4: Sample Computer Room CFD Model Output
Source: Wright Line 2009a
39
Assessing data center performance using hardware and software measurement tools as well as
modeling tools greatly facilitates the process of identifying which system components should be
optimized, upgraded, or replaced.
36
Parker et al. 2007 37
PowerAssure: http://www.powerassure.com/products/dynamic-power-management-software (PowerAssure
2010a) 38
Wright Line 2009a 39
Eaton‘s Wright Line Business, a leader in airflow management solutions for today‘s complex data centers.
Data Center Energy Efficiency, Renewable Energy and Carbon Offset Investment Best Practices
© 2012 Patrick Costello and Roshni Rathi 10
Energy Efficiency Solutions – Best Practices and Innovative Strategies
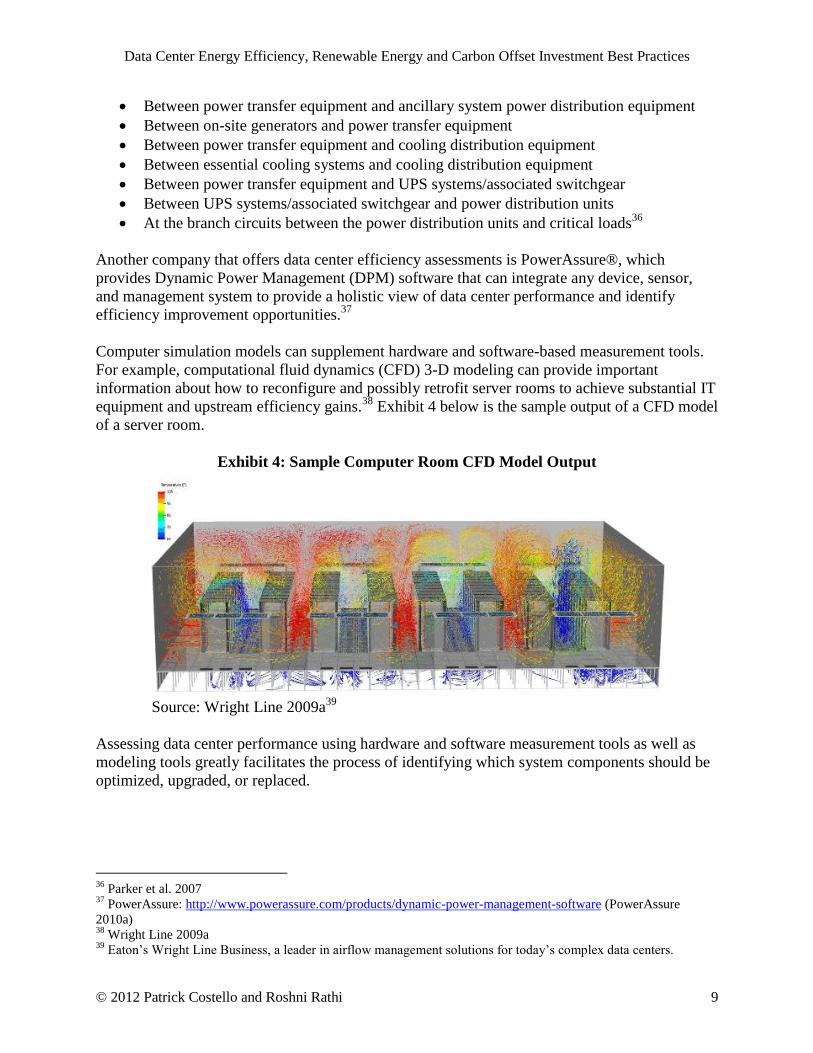
There are a range of best practice efficiency improvements available for both demand-side and
supply-side system components. Demand-side components, which directly support business
activities, consist of processors, server power supply, storage equipment, communication
equipment, and other server components. Supply-side components, which support demand-side
operations, consist of the Uninterruptible Power Supply (UPS), Power Distribution Unit (PDU),
cooling systems, lighting, and building switchgear.40
The exhibit below provides a general
breakdown of these components by power consumption at a typical 5,000 sq. ft data center with
a PUE of 1.9.
Exhibit 5: Overview of Data Center Energy Consumption
Source: Emerson Network Power 2009
41
Supply-side and demand-side energy consumption at a typical data center are comparable,
highlighting the scope of a data center‘s support systems as well as the scope of supply-side
efficiency improvement opportunities. While cooling systems often consume more energy than
any other supply-side or demand-side category, state-of-the art data centers now implement
extremely efficient cooling systems that represent a much smaller share of total energy
consumed.
Optimization of demand-side systems can yield substantial energy savings compared with
optimization of supply-side systems because downstream energy savings at demand-side
components yield cascading upstream supply-side savings. The exhibit below illustrates this
cascade effect at a sample 5,000 sq ft. data center.
40
These system components are addressed later in the report. 41
Emerson Network Power 2009. The Energy Logic approach developed by Emerson Network Power.
Data Center Energy Efficiency, Renewable Energy and Carbon Offset Investment Best Practices
© 2012 Patrick Costello and Roshni Rathi 11
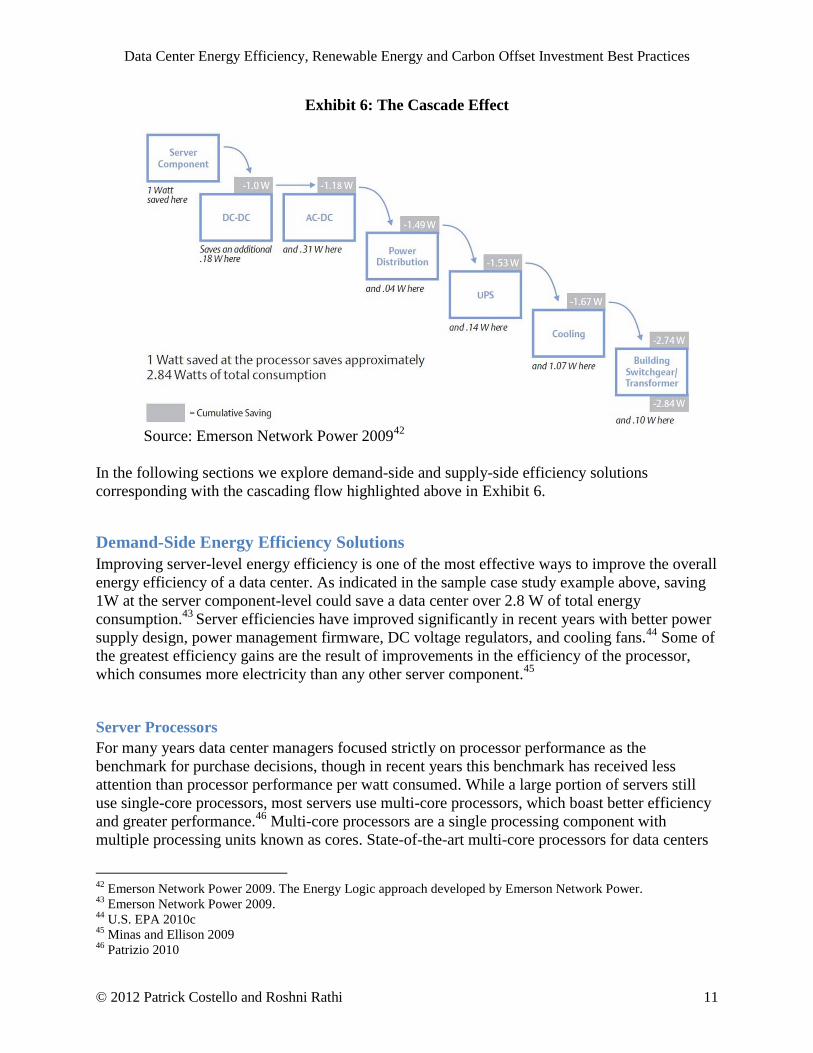
Exhibit 6: The Cascade Effect
Source: Emerson Network Power 2009
42
In the following sections we explore demand-side and supply-side efficiency solutions
corresponding with the cascading flow highlighted above in Exhibit 6.
Demand-Side Energy Efficiency Solutions
Improving server-level energy efficiency is one of the most effective ways to improve the overall
energy efficiency of a data center. As indicated in the sample case study example above, saving
1W at the server component-level could save a data center over 2.8 W of total energy
consumption.43
Server efficiencies have improved significantly in recent years with better power
supply design, power management firmware, DC voltage regulators, and cooling fans.44
Some of
the greatest efficiency gains are the result of improvements in the efficiency of the processor,
which consumes more electricity than any other server component.45
Server Processors
For many years data center managers focused strictly on processor performance as the
benchmark for purchase decisions, though in recent years this benchmark has received less
attention than processor performance per watt consumed. While a large portion of servers still
use single-core processors, most servers use multi-core processors, which boast better efficiency
and greater performance.46
Multi-core processors are a single processing component with
multiple processing units known as cores. State-of-the-art multi-core processors for data centers
42
Emerson Network Power 2009. The Energy Logic approach developed by Emerson Network Power. 43
Emerson Network Power 2009. 44
U.S. EPA 2010c 45
Minas and Ellison 2009 46
Patrizio 2010
Data Center Energy Efficiency, Renewable Energy and Carbon Offset Investment Best Practices
© 2012 Patrick Costello and Roshni Rathi 12
include the six core Intel® Xeon® 5600 series processor, the twelve core AMD® OpteronTM
6000 series processor, and Oracle‘s 16-core SPARC T-Series processors. Many new multi-core
processors offer lower energy consumption when idle and can better support server virtualization
(discussed later), which can yield additional energy savings.
Investing in newer processing technology even after just a short period of time can offer
substantial efficiency improvements. For example, in early 2007, Intel introduced two new 50-
watt quad-core server processors to replace an 85-watt and a 120-watt quad core server processor
introduced in late 2005, respectively delivering a 41% and 58% decrease in power consumption
for comparable performance.47
When Intel introduced this new processor line in 2007 it
estimated that every watt saved in computation would yield one watt of power conversion
savings and one watt of cooling savings. Using this estimate, replacing just one of Intel‘s 85-watt
or 120-watt servers with one of Intel‘s comparable new servers would respectively yield 70 watts
and 140 watts of upstream conversion and cooling savings.48
Significant processor efficiency
gains can also be achieved by investing in higher-end processers even from within the same
processor technology series. For example, the Intel® Xeon® 5600 series processor requires up to
30% less operating power than does the Intel® Xeon® 5500 series processor.49
The processor sector is extremely competitive, with leading manufacturers such as Intel, AMD,
and Oracle regularly introducing new processors to meet evolving ICT needs.50
Likewise, server
manufacturers such as IBM, HP, Cisco, and Oracle regularly introduce new server designs that
complement and enhance processor performance. Improved server architecture and processor
arrangements can also yield substantial efficiency gains. Two common server designs are the
rack server, which is the standard design, and the blade server. Blade servers are compact arrays
of processors that are stripped of many components used by a standard rack server. Multiple
blade servers can share the same power supplies and cooling fans, and current blade servers are
more efficient than standard rack servers. Dell, which sells both blade and rack servers, states
that blade servers offer the same performance as rack servers but consume 20% less energy.51
47
Intel 2007 48
Intel 2007 49
Intel 2011 50
The relative performance of server processor products is typically compared using standards set by the Standard
Performance Evaluation Corporation (SPEC). 51
Dell 2011
Data Center Energy Efficiency, Renewable Energy and Carbon Offset Investment Best Practices
© 2012 Patrick Costello and Roshni Rathi 13
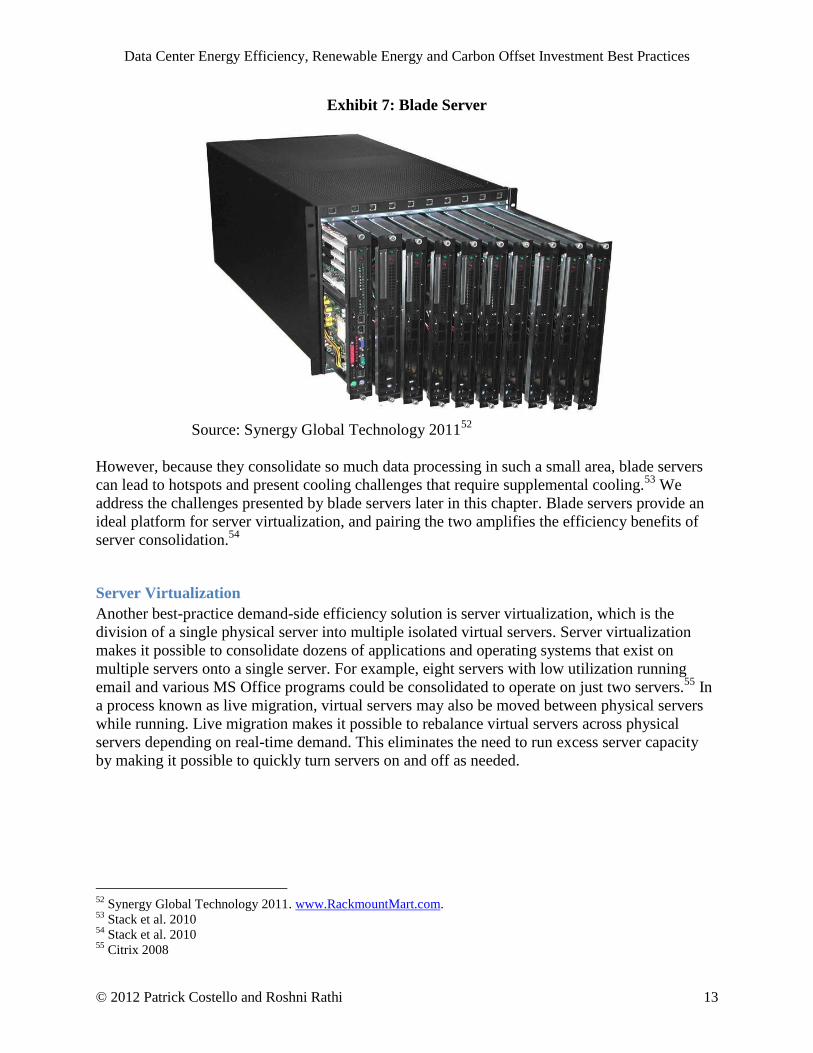
Exhibit 7: Blade Server
Source: Synergy Global Technology 2011
52
However, because they consolidate so much data processing in such a small area, blade servers
can lead to hotspots and present cooling challenges that require supplemental cooling.53
We
address the challenges presented by blade servers later in this chapter. Blade servers provide an
ideal platform for server virtualization, and pairing the two amplifies the efficiency benefits of
server consolidation.54
Server Virtualization
Another best-practice demand-side efficiency solution is server virtualization, which is the
division of a single physical server into multiple isolated virtual servers. Server virtualization
makes it possible to consolidate dozens of applications and operating systems that exist on
multiple servers onto a single server. For example, eight servers with low utilization running
email and various MS Office programs could be consolidated to operate on just two servers.55
In
a process known as live migration, virtual servers may also be moved between physical servers
while running. Live migration makes it possible to rebalance virtual servers across physical
servers depending on real-time demand. This eliminates the need to run excess server capacity
by making it possible to quickly turn servers on and off as needed.
52
Synergy Global Technology 2011. www.RackmountMart.com. 53
Stack et al. 2010 54
Stack et al. 2010 55
Citrix 2008
Data Center Energy Efficiency, Renewable Energy and Carbon Offset Investment Best Practices
© 2012 Patrick Costello and Roshni Rathi 14
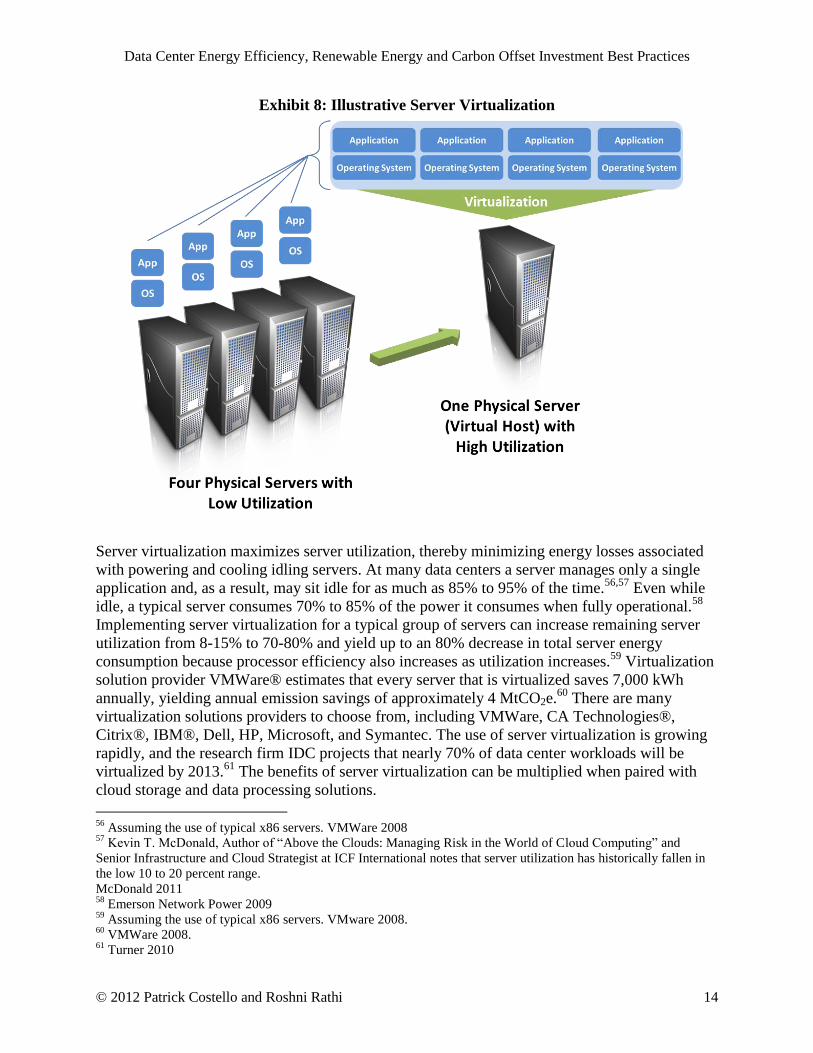
Exhibit 8: Illustrative Server Virtualization
Server virtualization maximizes server utilization, thereby minimizing energy losses associated
with powering and cooling idling servers. At many data centers a server manages only a single
application and, as a result, may sit idle for as much as 85% to 95% of the time.56,57
Even while
idle, a typical server consumes 70% to 85% of the power it consumes when fully operational.58
Implementing server virtualization for a typical group of servers can increase remaining server
utilization from 8-15% to 70-80% and yield up to an 80% decrease in total server energy
consumption because processor efficiency also increases as utilization increases.59
Virtualization
solution provider VMWare® estimates that every server that is virtualized saves 7,000 kWh
annually, yielding annual emission savings of approximately 4 MtCO2e.60
There are many
virtualization solutions providers to choose from, including VMWare, CA Technologies®,
Citrix®, IBM®, Dell, HP, Microsoft, and Symantec. The use of server virtualization is growing
rapidly, and the research firm IDC projects that nearly 70% of data center workloads will be
virtualized by 2013.61
The benefits of server virtualization can be multiplied when paired with
cloud storage and data processing solutions.
56
Assuming the use of typical x86 servers. VMWare 2008 57
Kevin T. McDonald, Author of ―Above the Clouds: Managing Risk in the World of Cloud Computing‖ and
Senior Infrastructure and Cloud Strategist at ICF International notes that server utilization has historically fallen in
the low 10 to 20 percent range.
McDonald 2011 58
Emerson Network Power 2009 59
Assuming the use of typical x86 servers. VMware 2008. 60
VMWare 2008. 61
Turner 2010
Data Center Energy Efficiency, Renewable Energy and Carbon Offset Investment Best Practices
© 2012 Patrick Costello and Roshni Rathi 15
Cloud Computing
Outsourcing server hosting to a network-based cloud computing service is another approach to
achieving significant emission footprint reductions. Cloud computing allows an organization to
share large-scale IT infrastructure over the Internet with other organizations (public cloud), or
over its own network behind a firewall (private cloud).62
By sharing this infrastructure, an
organization can leverage operational efficiencies not possible at most data centers. The primary
difference between a private cloud and other cloud models is that a private cloud is contained
within an enterprise.63
To understand what exactly the ‗cloud‘ means, it is helpful to consider the National Institute of
Standards and Technology‘s concise definition of cloud computing:
Cloud computing is a model for enabling ubiquitous, convenient,
on-demand network access to a shared pool of configurable
computing resources (e.g., networks, servers, storage,
applications, and services) that can be rapidly provisioned and
released with minimal management effort or service provider
interaction.64
Cloud computing can offer substantial energy savings because cloud systems closely match
server demand and capacity, reducing peak loads, boosting server utilization, and taking
advantage of the most efficient state-of-the-art infrastructure designs.65
As a result, the carbon
footprint associated with workloads handled by cloud systems is often significantly smaller than
that associated with workloads handled by most locally operated data centers. A recent study
conducted by Accenture and WSP Environment & Energy on behalf of Microsoft compared the
environmental impacts of providing three of Microsoft‘s major business applications –
Exchange, SharePoint, and Dynamics CRM – through: (1) on-premise-based operations; and (2)
Microsoft‘s cloud-based operations. The Accenture and WSP study found that Microsoft‘s
cloud-based operations offered average carbon emission reductions of
90% or more for small operations (per approximately 100 users)
60 to 90% for medium operations (per approximately 1,000 users)
30 to 60% for large operations (per approximately 10,000 users)66
Dozens of organizations provide cloud solutions, and the carbon emission reductions associated
with each will vary by the location and design of a given cloud operation. Microsoft, Google,
and Amazon are three of the largest cloud computing providers.
The three types of cloud computing services are:
Software as a service
Platform as a service
62
Mell and Grance 2011. 63
Cloud Computing Use Case Discussion Group 2010 64
Mell and Grance 2011. 65
Microsoft et al. 2010 66
Microsoft et al. 2010

Data Center Energy Efficiency, Renewable Energy and Carbon Offset Investment Best Practices
© 2012 Patrick Costello and Roshni Rathi 16
Infrastructure as a service
Cloud software as a service SaaS , or the ―application‖ cloud, enables a consumer to use a
provider‘s specific application through cloud infrastructure e.g. SalesForce.com). Cloud
platform as a service PaaS , or the ―service‖ cloud, enables a consumer to deploy processor-
intense application operations supported by a service provider to the cloud (e.g. Google App
Engine67
). This service model allows consumers to control the deployed applications and
sometimes hosting configurations. Cloud infrastructure as service IaaS , or the ―infrastructure‖
cloud, enables a consumer to deploy nearly any type of software on the cloud and provides a
consumer with access to processing, storage, networks and other computing resources (e.g.
Amazon Elastic Compute Cloud68
). The IaaS model allows a consumer to control the deployed
software (operating systems, applications) and sometimes networking components such as host
firewalls as well.69
The infrastructure cloud offers the greatest flexibility and access to data
center resources without involving the management or control of data center infrastructure.
Security concerns represent one of the largest barriers to more extensive adoption of public cloud
solutions by organizations with sensitive information. Public cloud solution providers typically
keep the location and security measures of their cloud operations secret, and are still working on
technical and contractual solutions to alleviate security concerns without revealing trade secrets
or raising the cost of service. Security concerns aside, cloud services offer organizations a cost-
effective way to dramatically reduce their data center energy consumption and environmental
impact as well as possibly avoid substantial capital investment in infrastructure upgrades or new
data center development.
Supply-Side Energy Efficiency Solutions
Power Supply
There are a variety of supply-side efficiency solutions. One best practice solution is to improve
the efficiency of power delivery components, specifically the uninterruptible power supply
(UPS) system. When electricity enters a data center facility, it is routed through the UPS, which
serves as a battery backup to protect facility operations from electricity fluctuations and outages,
before powering IT equipment.70
The UPS converts incoming AC electricity to DC to charge
batteries (or sometimes a flywheel), after which the DC electricity is converted back to AC
before it is delivered to the Power Distribution Unit (PDU). This double conversion results in
electricity losses and creates significant waste heat that must be offset by a cooling system.
Alternate UPS systems, including line interactive and passive standby systems, operate at higher
efficiencies by avoiding this double conversion process. But they do not fully condition the
electricity, which leaves IT equipment more exposed.71
67
Google App Engine:
http://code.google.com/appengine/docs/whatisgoogleappengine.html (Google 2011a)
http://www.google.com/apps/intl/en/business/index.html (Google 2011b) 68
Amazon Web Services: http://aws.amazon.com/ec2/ (Amazon Web Services 2011) 69
Mell and Grance 2011 70
U.S. EPA 2007b 71
Emerson Network Power 2009

Data Center Energy Efficiency, Renewable Energy and Carbon Offset Investment Best Practices
© 2012 Patrick Costello and Roshni Rathi 17
UPS efficiency primarily varies by UPS design and by UPS utilization. Utilization levels play a
key role in determining UPS efficiency, as highlighted in Exhibit 9 below. On average, medium
to large data centers have load levels that range from 30% to 70%.72
At these load levels,
standard UPS systems achieve efficiencies between approximately 80% and 90% after
accounting for electrical transmission losses.
Exhibit 9: Effect of Utilization on UPS Efficiency
Source: Rasmussen 2007, Schneider Electric
UPS efficiency can be improved by increasing the utilization level and raising the voltage of
UPS delivery to the PDU.73
Another way to reduce central UPS energy losses is to replace an old
UPS with a new UPS as new systems can achieve efficiencies of 92% to 95%.74
Some
organizations have achieved even higher UPS efficiencies through various strategies. Sun
Microsystems (acquired by Oracle) has a data center with three UPS systems that achieve 97%
efficiency75
, while Google has decentralized UPS systems that achieve 99.9% efficiency.76
Google‘s innovative strategy relies on a customized design that shifts the UPS and battery
backup system to the server cabinets. Google supplies AC power directly to server racks and
uses a single AC-to-DC conversion.77
Syracuse University‘s new Green Data Center GDC also
uses a single AC-to-DC conversion system to achieve substantial efficiency improvements. The
GDC uses gas-fired microturbines to serve as the UPS and high-voltage DC power is delivered
directly to servers.78
Cooling and Airflow Management
Data center managers must maintain tight control over temperature and humidity ranges to
ensure maximum equipment performance and efficiency. The ASHRAE TC 9.9-recommended
72
U.S. EPA 2011k 73
Emerson Network Power 2009 74
U.S. EPA 2007b 75
Wirth 2007 76
Miller 2009c 77
Miller 2008 78
Sedore 2010
Data Center Energy Efficiency, Renewable Energy and Carbon Offset Investment Best Practices
© 2012 Patrick Costello and Roshni Rathi 18
operating envelope for IT equipment is 64.4oF to 80.6
oF, with a humidity range of 41.9
oF dew
point to 60% RH and 59oF dew point.
79 Climate control systems consume enormous quantities of
energy to meet these requirements, and their consumption has only grown with the increasing
compaction of IT equipment that has led to higher rack power densities and hotspots. While
energy losses associated with cooling vary by data center facility, Amazon estimates that a
typical data center with a PUE of 1.7 has cooling losses as high as 33%, suggesting that for every
watt used to power a server, 0.56W are used for cooling.80
The power consumed for cooling is
even higher in data centers with a higher PUE.
The basic requirements that must be met to ensure optimum operating conditions for equipment
are that (a) appropriately conditioned air should be presented at equipment air intakes, and (b)
airflow in and out of the equipment should not be restricted.81
There are several cooling system
configurations that can be used to meet these requirements. This section addresses many of the
major strategies used to improve the efficiency of common cooling system configurations
through component optimization, free cooling, variable cooling capacity, airflow management
best practices, and central control of cooling units.
Cooling Systems and Potential Improvements
All cooling systems are based on the refrigeration cycle, which cools an area by using energy to
pump heat away from it. Systems vary based on the cooling medium (refrigerant, water) that is
used to transport heat away from the server room, and the condensing medium (air, glycol,
water) to which heat is rejected before the cooling medium returns to the room. The systems
used in IT environments may be air-cooled, glycol cooled, water-cooled, or chilled water based.
Each type of system has its advantages and disadvantages, and it is important to choose the
appropriate system and configuration based on data center size, availability requirements, and
potential for efficiency improvements.
Air-cooled systems, which use a refrigerant as the cooling medium and air as the condensing
medium, are low cost systems with a moderate cooling capacity used mostly in small-to-medium
size data centers. These systems can either be split systems or self-contained systems, depending
on where the various components of the refrigeration cycle are located. In split systems (also
known as direct expansion, DX, systems), the refrigerant carries heat from the evaporator coil
and compressor that are in the computer room air conditioning (CRAC) unit, to the condenser
coil that is located outside the building. The refrigerant enters the evaporator coil in the server
room CRAC unit as a cold low-pressure gas and absorbs heat from the air that is blown over the
coil. This decreases the temperature of the air so that it can be used for cooling the equipment.
The slightly warmer refrigerant is then compressed in the compressor to further increase its
temperature before it is piped to the condenser coil, where it releases heat to the outside air and
condenses into a cool liquid. The cooled refrigerant is piped back to the server room and cooled
further as it expands as a gas through the expansion valve into the evaporator coil, and the cycle
repeats. In self-contained air-cooled systems, all the components of the refrigeration cycle,
including the condenser, are inside the CRAC unit, and exhaust air is rejected outdoors or to an
79
ASHRAE 2008 80
Hamilton 2009 81
Rasmussen 2011a
Data Center Energy Efficiency, Renewable Energy and Carbon Offset Investment Best Practices
© 2012 Patrick Costello and Roshni Rathi 19
unconditioned space such as above a drop ceiling. Air-cooled split systems are the most
commonly used cooling technology in data centers.82,83
Glycol-cooled systems use glycol (a mixture of water and ethylene glycol) as the condensing
medium and a refrigerant as the cooling medium. All components of the refrigeration cycle are
located in the CRAC unit, and the condenser is replaced with a heat exchanger that enables the
transfer of heat from the refrigerant to the glycol solution. The glycol is then piped to an outdoor
fluid cooler that uses fans to reject heat from the glycol to outside air before the cooled glycol is
returned to the heat exchanger. Since glycol collects and transport heat better than air, glycol-
cooled systems are smaller than air-cooled systems. These systems are also used in small-to-
medium data centers with moderate availability requirements, but are more costly and less
common than air-cooled split systems. Also, data center managers are sometimes hesitant to use
glycol-cooled systems because they introduce a liquid into the IT environment. 84,85
Water-cooled systems have the same configuration as glycol-cooled systems, but they use water
instead of glycol as the working fluid, and use a cooling tower86
instead of a fluid cooler to lower
the temperature of condenser water. These systems are less common than either air- and glycol-
cooled systems, but they have a dual advantage over both systems. The first advantage is that
water as a condensing medium absorbs more heat than either air or glycol, and the second is that
cooling towers use evaporative cooling to allow the cooling of condenser water to the lower
ambient wet-bulb temperature. However, water-cooled systems have high upfront and
maintenance costs and, like glycol-cooled systems, introduce a liquid into the data center. They
are typically used in conjunction with other systems in data centers of varied sizes with medium
to high availability requirements.87,88
Chilled water systems use chilled water as the cooling medium and condenser water as the
condensing medium. All components of the refrigeration cycle are relocated to chillers that
produce chilled water that is pumped to coils in computer room air handlers (CRAHs). CRAHs
draw air over the chilled water coils, which absorb heat and cool the air. The water then returns
to the chiller, where heat is rejected to a condenser loop that transports heat from the chiller to
the atmosphere using the cooling tower. Of all the cooling technologies discussed so far, chilled
water systems have the highest capital cost for smaller systems, but have the lowest cost for
larger installations. The combination of CRAHs and chillers is more efficient than CRACs, so
chilled water systems have the smallest footprint for the same amount of cooling. These systems
82
PTS Data Center Solutions 2011 83
Evans 2010b 84
PTS Data Center Solutions 2011 85
Evans 2010b 86
A cooling tower is a device that rejects heat to the atmosphere through the evaporative cooling of water. Water is
sprayed onto a spongy material (fill) at the top of the tower and, as it drips down toward the collecting basin, some
water evaporates and lowers the temperature of the remaining water. Using a cooling tower, the temperature of
water can be lowered to the wet-bulb temperature of ambient air, which is the lowest temperature that can be
achieved by cooling a wet surface. This temperature is lower than the dry-bulb temperature, which is the lowest
temperature that can be achieved by cooling a dry surface in the same atmospheric conditions. 87
PTS Data Center Solutions 2011 88
Evans 2010b
Data Center Energy Efficiency, Renewable Energy and Carbon Offset Investment Best Practices
© 2012 Patrick Costello and Roshni Rathi 20
are typically used in medium and large data centers with moderate-to-high availability
requirements.89,90
One quick way to improve the efficiency of existing cooling systems is to monitor and optimize
the operation of their various components. For instance, water chillers should be monitored to
ensure that the chilled water that they produce is not below the required temperature of 55oF.
This is because chiller efficiency is impacted negatively when the temperature differential
between the condenser water and chiller water the ―chiller lift‖ increases. Also, over-chilled
water is often below the dew point that corresponds to the optimum humidity level in data
centers and leads to excess condensation and dehumidification in the CRAH units. This
decreases their efficiency and cooling capacity.91
Optimizing the operation of cooling tower fans
can also improve chiller efficiency.92
Cooling tower fans typically circulate to maintain low
basin temperature, which is a set temperature at the bottom of the tower, so that the lift is lower
and the chiller is more efficient. At some point, however, the energy used by the tower fan is
greater than the energy that is saved by further lowering the lift. In such a case, the maximum
savings point should be found by installing variable frequency drives and optimizing fan
operation based on wet-bulb temperature.93
In colder climates, data center managers can take advantage of ―free‖ cooling to decrease the
total energy consumed to meet the cooling needs of IT equipment. Free cooling is the use of the
outside temperature to directly cool the IT room and supplement or even replace mechanical
cooling systems. Building codes in some areas in the Pacific Northwest actually mandate free
cooling for all data centers.94
There are three common strategies for free cooling:
1) In glycol-cooled systems, free cooling can be provided by adding an economizer coil
containing cold circulating glycol alongside the evaporator coil in the CRAC unit.95
2) Water-side economizers, best suited for regions with wet-bulb temperatures lower than
55oF for 3,000 or more hours a year
96, can be retrofit in chilled-water-cooled data centers
to produce chilled water directly from the cooling towers. Water-side economizers can
improve efficiency by up to 75% by pre-cooling chilled water before it enters the chiller
or even eliminating the need for compressor cooling.97
3) Air-side economizers allow cold air from the outside into the data center to directly cool
the inside environment.98
Outside air does not have to be below the data center‘s cooling
set point to improve efficiency; it only needs to be below the exhaust air temperature.99
Though there is some concern regarding air contamination from the direct use of outside
89
PTS Data Center Solutions 2011 90
Evans 2010b 91
Pacific Gas and Electric Company 2006 92
Pacific Gas and Electric Company 2006 93
Parker et al. 2007 94
Evans 2011 95
Evans 2010b 96
LBNL 2006 97
Water-side economizers can also improve reliability of chillers and decrease maintenance requirements by
reducing chiller operation.
LBNL 2006 98
LBNL 2006 99
Pacific Gas and Electric Company 2006
Data Center Energy Efficiency, Renewable Energy and Carbon Offset Investment Best Practices
© 2012 Patrick Costello and Roshni Rathi 21
air, current research suggests that air filtration may be an adequate measure to mitigate
this concern.100
Geothermal free cooling, a more expensive and less widely used strategy, can provide efficiency
benefits at data centers in areas with low geothermal temperatures. It has been implemented
successfully at the American College Testing (ACT) data center in Iowa City, Iowa,101
and is in
planning stages at least two other facilities102
. A geothermal cooling system consists of a closed
loop piping network housed in vertical holes drilled in the earth. The pipes contain either coolant
or water as the cooling medium. Heat is carried away from the data center by the cooling
medium and rejected to the cool earth that surrounds the piping system before the cooling
medium returns to the data center. The ACT data center in Iowa City uses exterior dry coolers as
back up for the geothermal system, and switches cooling load to these units if cooler weather
makes them more efficient than the primary cooling system.103
―Multicool‖ coils that contain chilled water can also be combined with existing air-, glycol- or
water-cooled DX systems to improve their efficiency, especially if the building that houses the
data center also produces chilled water for other HVAC purposes. Since such multicool systems
provide high redundancy, they can be used even if the building chilled water is not available at
all times.104,105
Data center managers can also improve efficiency by replacing or supplementing the traditional
air cooling systems discussed above with direct liquid cooling systems that pipe chilled water to
coils on server racks. The chilled water, which is in very close proximity to equipment exhaust
vents, picks up waste heat and transfers it much more efficiently than the room air. Also, heat
transfer to a cooling medium on the rack is more efficient than heat transfer in the CRAC or
CRAH unit because it takes place at a higher temperature. Direct liquid cooling can also be
combined with a water-side economizer to take advantage of free cooling.106
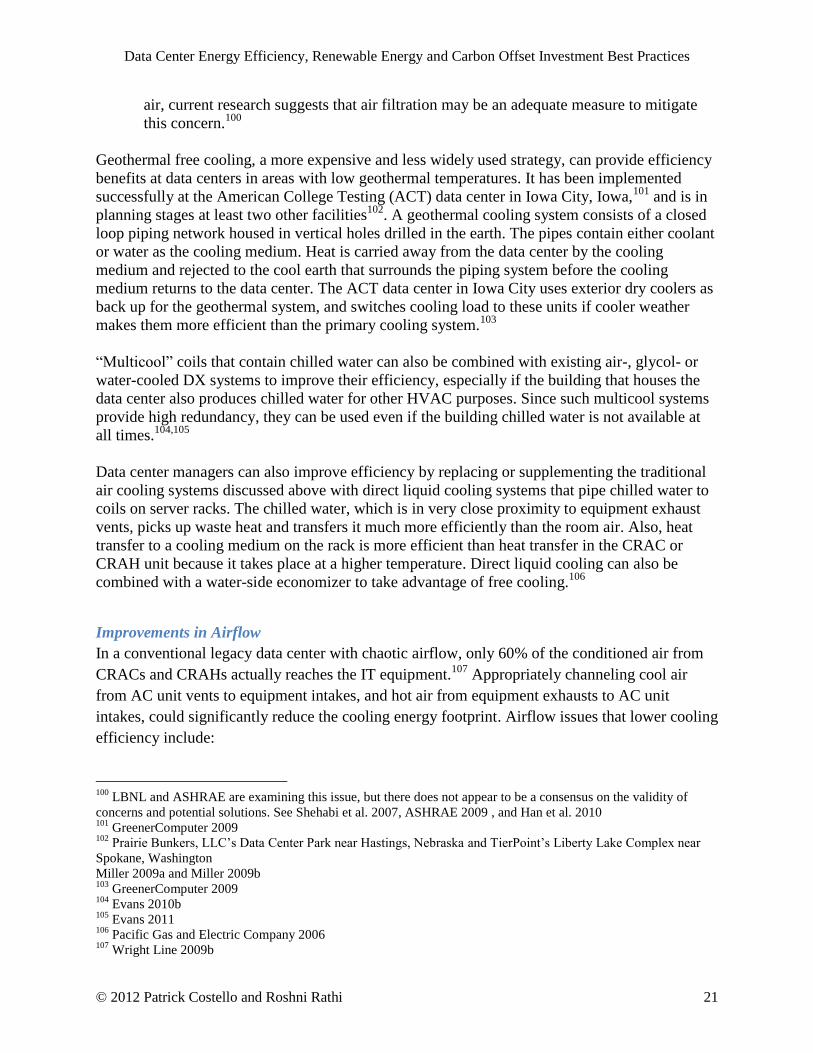
Improvements in Airflow
In a conventional legacy data center with chaotic airflow, only 60% of the conditioned air from
CRACs and CRAHs actually reaches the IT equipment.107
Appropriately channeling cool air
from AC unit vents to equipment intakes, and hot air from equipment exhausts to AC unit
intakes, could significantly reduce the cooling energy footprint. Airflow issues that lower cooling
efficiency include:
100
LBNL and ASHRAE are examining this issue, but there does not appear to be a consensus on the validity of
concerns and potential solutions. See Shehabi et al. 2007, ASHRAE 2009 , and Han et al. 2010 101
GreenerComputer 2009 102
Prairie Bunkers, LLC‘s Data Center Park near Hastings, Nebraska and TierPoint‘s Liberty Lake Complex near
Spokane, Washington
Miller 2009a and Miller 2009b 103
GreenerComputer 2009 104
Evans 2010b 105
Evans 2011 106
Pacific Gas and Electric Company 2006 107
Wright Line 2009b
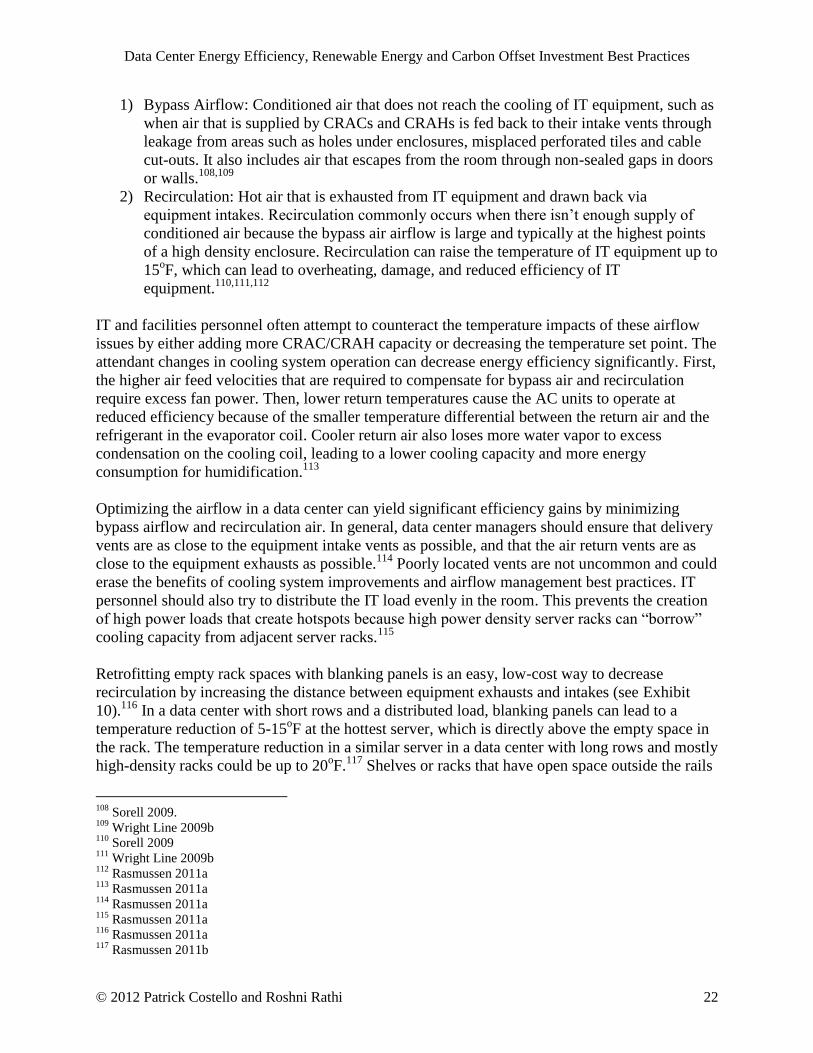
Data Center Energy Efficiency, Renewable Energy and Carbon Offset Investment Best Practices
© 2012 Patrick Costello and Roshni Rathi 22
1) Bypass Airflow: Conditioned air that does not reach the cooling of IT equipment, such as
when air that is supplied by CRACs and CRAHs is fed back to their intake vents through
leakage from areas such as holes under enclosures, misplaced perforated tiles and cable
cut-outs. It also includes air that escapes from the room through non-sealed gaps in doors
or walls.108,109
2) Recirculation: Hot air that is exhausted from IT equipment and drawn back via
equipment intakes. Recirculation commonly occurs when there isn‘t enough supply of
conditioned air because the bypass air airflow is large and typically at the highest points
of a high density enclosure. Recirculation can raise the temperature of IT equipment up to
15oF, which can lead to overheating, damage, and reduced efficiency of IT
equipment.110,111,112
IT and facilities personnel often attempt to counteract the temperature impacts of these airflow
issues by either adding more CRAC/CRAH capacity or decreasing the temperature set point. The
attendant changes in cooling system operation can decrease energy efficiency significantly. First,
the higher air feed velocities that are required to compensate for bypass air and recirculation
require excess fan power. Then, lower return temperatures cause the AC units to operate at
reduced efficiency because of the smaller temperature differential between the return air and the
refrigerant in the evaporator coil. Cooler return air also loses more water vapor to excess
condensation on the cooling coil, leading to a lower cooling capacity and more energy
consumption for humidification.113
Optimizing the airflow in a data center can yield significant efficiency gains by minimizing
bypass airflow and recirculation air. In general, data center managers should ensure that delivery
vents are as close to the equipment intake vents as possible, and that the air return vents are as
close to the equipment exhausts as possible.114
Poorly located vents are not uncommon and could
erase the benefits of cooling system improvements and airflow management best practices. IT
personnel should also try to distribute the IT load evenly in the room. This prevents the creation
of high power loads that create hotspots because high power density server racks can ―borrow‖
cooling capacity from adjacent server racks.115
Retrofitting empty rack spaces with blanking panels is an easy, low-cost way to decrease
recirculation by increasing the distance between equipment exhausts and intakes (see Exhibit
10).116
In a data center with short rows and a distributed load, blanking panels can lead to a
temperature reduction of 5-15oF at the hottest server, which is directly above the empty space in
the rack. The temperature reduction in a similar server in a data center with long rows and mostly
high-density racks could be up to 20oF.
117 Shelves or racks that have open space outside the rails
108
Sorell 2009. 109
Wright Line 2009b 110
Sorell 2009 111
Wright Line 2009b 112
Rasmussen 2011a 113
Rasmussen 2011a 114
Rasmussen 2011a 115
Rasmussen 2011a 116
Rasmussen 2011a 117
Rasmussen 2011b
Data Center Energy Efficiency, Renewable Energy and Carbon Offset Investment Best Practices
© 2012 Patrick Costello and Roshni Rathi 23
should be avoided because they do not present good physical barriers to recirculation and
blanking panels cannot fix this issue.118
Exhibit 10: Effect of Blanking Panels on Rack Airflow
Source: Rasmussen 2011b, Schneider Electric
In new data centers (and, to the extent possible, in existing data centers), racks should be placed
in rows such that each row faces the direction opposite to its adjacent rows (see Exhibit 11). This
creates hot aisles and cold aisles that physically separate the exhaust air from the intake air.
Delivery vents should be placed in aisles where racks face each other (cold aisles) so that
conditioned air is delivered to the equipment intakes on either side. Hot air that is exhausted
from the backs of the servers into the hot aisle should be evacuated before it mixes with the cold
air. This separation between hot and cold air limits bypass air and recirculation.119,120
Exhibit 11: Hot Aisle/Cold Aisle Rack Arrangement
Source: Chatsworth Products 2009, Image courtesy of Chatsworth Products, Inc. (CPI)
121
118
Rasmussen 2011a 119
Michigan Academic Computing Center 2011 120
Rasmussen 2011a 121
Chatsworth Products, Inc. (CPI) is a leading manufacturer of systems designed to optimize, store and secure IT
infrastructure equipment.

Data Center Energy Efficiency, Renewable Energy and Carbon Offset Investment Best Practices
© 2012 Patrick Costello and Roshni Rathi 24
Blanking panels and the hot aisle/cold aisle arrangement are applicable to IT equipment that has
a front-to-back cooling airflow and do not work for equipment with side-to-side airflow.
Equipment that has side-to-side airflow cannot be placed adjacent to similar equipment because
then the intake vent and exhaust vent of the two pieces of equipment will be perfectly aligned
leading to high recirculation. This equipment also cannot be mounted easily in an enclosure
because the walls of the enclosure would encourage recirculation by presenting high resistance to
fresh cold air as well as to exhaust air. Data center managers typically address the cooling needs
of equipment with side-to-side airflow by staggering them vertically to prevent the aligning of
intake and exhaust vents. However, this leads to some amount of recirculation because there is
still dispersion of exhaust air. Supplemental fans could also help with cooling, but they operate
by mixing cool and hot air and are not very efficient. The most efficient solution to decrease
recirculation in this case is to use in-rack air distribution equipment located right above or right
below the side-to-side equipment. The distribution equipment would take in cold air from the
front of the rack and redirect it to the side of the equipment that has intake vents, and take hot
exhaust air from the equipment and redirect it to the back of the enclosure.122
Exhibit 12: Front-view Perspective of Side-to-side Airflow with In-rack Air Distribution
Equipment
Source: Rasmussen 2010b, Schneider Electric
122
Rasmussen 2010b
Data Center Energy Efficiency, Renewable Energy and Carbon Offset Investment Best Practices
© 2012 Patrick Costello and Roshni Rathi 25
The efficiency benefits of hot aisle/cold aisle arrangements can be further enhanced by
retrofitting aisle containment closed loop systems. These systems are designed to maximize the
cold conditioned air that is delivered to equipment intakes and the exhaust air that is delivered to
the air-conditioning intake by separating hot and cold air using physical barriers that completely
enclose at least one type of aisle. Aisle containment can be achieved by physically isolating the
entire aisle from the rest of the room, or by using a ducting channel that directs air from the racks
to appropriate vents. Compared to legacy data centers where the typical supply and return
temperatures are 54oF and 70
oF, data centers with closed-loop aisle containment systems can
support temperatures of 68oF and 95
oF.
There are two modes for implementing closed-loop systems: cold aisle containment, where cold
air is ducted from the precision AC unit to equipment intakes and hot air moves freely through
the room, and hot aisle containment where all exhaust from the racks is captured and directed to
AC intakes while cold air moves freely through the room.123
Hot aisle containment is somewhat
preferable to cold aisle containment because cold aisle containment is more risky in the case of a
power loss and it leads to high ambient temperatures uncomfortable for IT personnel. Hot aisle
containment is also more efficient because it presents intake air to the AC units at higher
temperatures.124
Exhaust air can be evacuated from hot aisles either by passive exhaust or
assisted exhaust using fans.125
Airflow in data centers can also be improved by appropriately designing room-, row- or rack-
oriented configurations of CRAC units to match data center requirements. In a room-oriented
design, an entire room has one or more CRAC units that operate concurrently. Row-oriented
designs assign dedicated CRAC units to each row, and rack-oriented designs place CRAC units
in each rack. The placement of room-oriented CRAC units is typically restricted by the physical
constraints of the room, and the individual CRAC units are difficult to monitor and coordinate to
improve performance unless a central control system is used.126
Row and rack units are less
affected by design constraints or installation variation, and are more efficient because the airflow
path length is much shorter and requires less fan power. The short airflow path also leads to
lower bypass air and recirculation, and cooling capacity can be varied based on the actual needs
of specific rows and racks.127
Exhibit 13 graphs the annual costs of operation for the three types
of designs.
123
Wright Line 2009b 124
Niemann et al. 2010 125 If server exhaust is not strong enough, assisted exhaust risks remixing hot and cold air by drawing in
air from the surrounded plenum into the rear rack. To prevent this, only a slightly negative pressure is
created at the top of the enclosure and zero static pressure is maintained through the rest of the rack. Wright Line 2009b 126
Dunlap and Rasmussen 2010 127
Dunlap and Rasmussen 2010
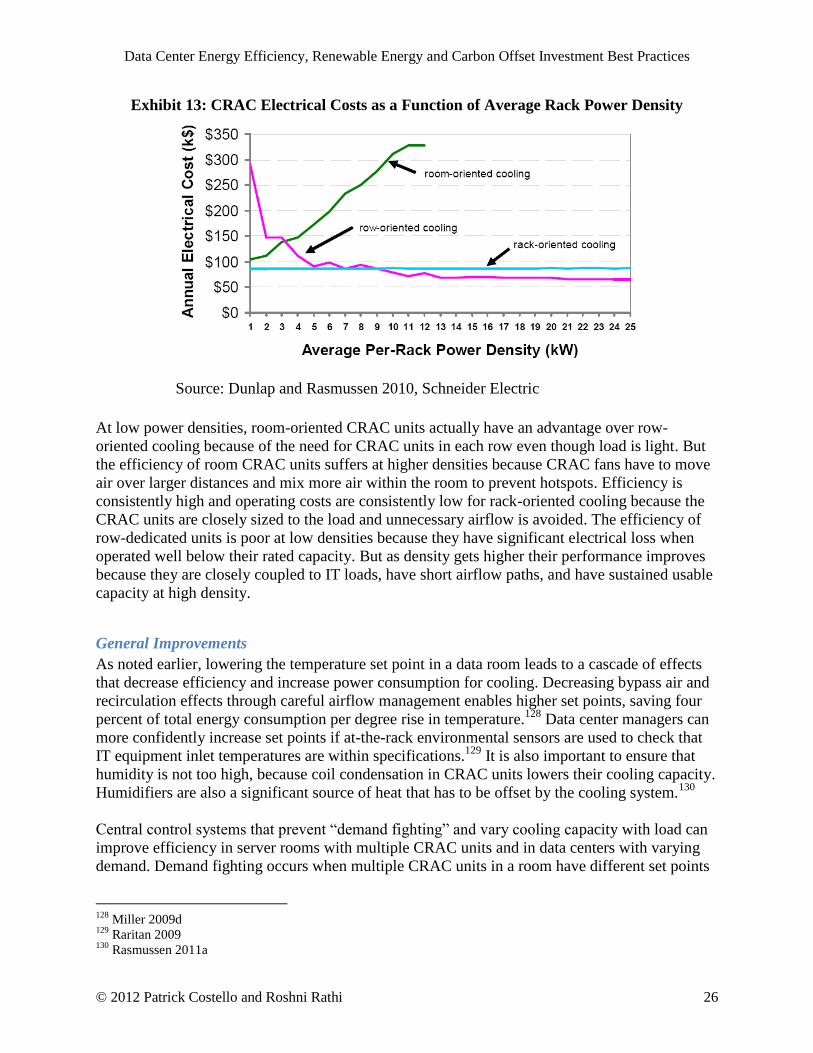
Data Center Energy Efficiency, Renewable Energy and Carbon Offset Investment Best Practices
© 2012 Patrick Costello and Roshni Rathi 26
Exhibit 13: CRAC Electrical Costs as a Function of Average Rack Power Density
Source: Dunlap and Rasmussen 2010, Schneider Electric
At low power densities, room-oriented CRAC units actually have an advantage over row-
oriented cooling because of the need for CRAC units in each row even though load is light. But
the efficiency of room CRAC units suffers at higher densities because CRAC fans have to move
air over larger distances and mix more air within the room to prevent hotspots. Efficiency is
consistently high and operating costs are consistently low for rack-oriented cooling because the
CRAC units are closely sized to the load and unnecessary airflow is avoided. The efficiency of
row-dedicated units is poor at low densities because they have significant electrical loss when
operated well below their rated capacity. But as density gets higher their performance improves
because they are closely coupled to IT loads, have short airflow paths, and have sustained usable
capacity at high density.
General Improvements
As noted earlier, lowering the temperature set point in a data room leads to a cascade of effects
that decrease efficiency and increase power consumption for cooling. Decreasing bypass air and
recirculation effects through careful airflow management enables higher set points, saving four
percent of total energy consumption per degree rise in temperature.128
Data center managers can
more confidently increase set points if at-the-rack environmental sensors are used to check that
IT equipment inlet temperatures are within specifications.129
It is also important to ensure that
humidity is not too high, because coil condensation in CRAC units lowers their cooling capacity.
Humidifiers are also a significant source of heat that has to be offset by the cooling system.130
Central control systems that prevent ―demand fighting‖ and vary cooling capacity with load can
improve efficiency in server rooms with multiple CRAC units and in data centers with varying
demand. Demand fighting occurs when multiple CRAC units in a room have different set points
128
Miller 2009d 129
Raritan 2009 130
Rasmussen 2011a
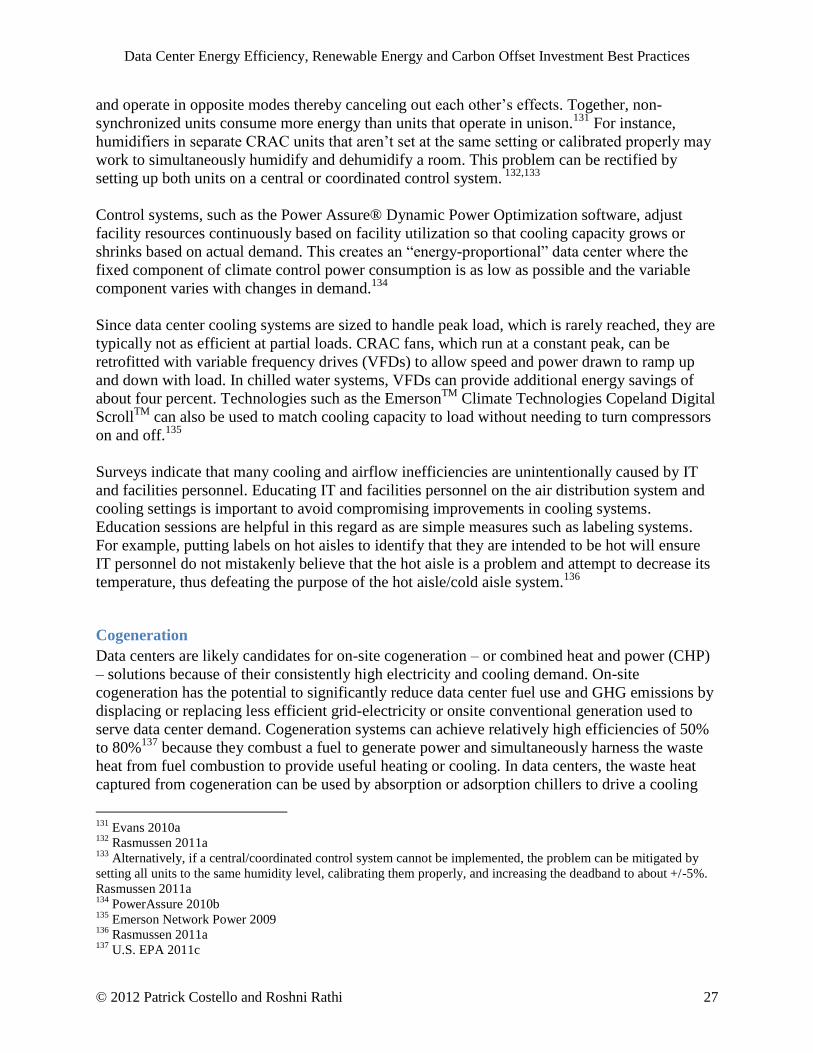
Data Center Energy Efficiency, Renewable Energy and Carbon Offset Investment Best Practices
© 2012 Patrick Costello and Roshni Rathi 27
and operate in opposite modes thereby canceling out each other‘s effects. Together, non-
synchronized units consume more energy than units that operate in unison.131
For instance,
humidifiers in separate CRAC units that aren‘t set at the same setting or calibrated properly may
work to simultaneously humidify and dehumidify a room. This problem can be rectified by
setting up both units on a central or coordinated control system. 132,133
Control systems, such as the Power Assure® Dynamic Power Optimization software, adjust
facility resources continuously based on facility utilization so that cooling capacity grows or
shrinks based on actual demand. This creates an ―energy-proportional‖ data center where the
fixed component of climate control power consumption is as low as possible and the variable
component varies with changes in demand.134
Since data center cooling systems are sized to handle peak load, which is rarely reached, they are
typically not as efficient at partial loads. CRAC fans, which run at a constant peak, can be
retrofitted with variable frequency drives (VFDs) to allow speed and power drawn to ramp up
and down with load. In chilled water systems, VFDs can provide additional energy savings of
about four percent. Technologies such as the EmersonTM
Climate Technologies Copeland Digital
ScrollTM
can also be used to match cooling capacity to load without needing to turn compressors
on and off.135
Surveys indicate that many cooling and airflow inefficiencies are unintentionally caused by IT
and facilities personnel. Educating IT and facilities personnel on the air distribution system and
cooling settings is important to avoid compromising improvements in cooling systems.
Education sessions are helpful in this regard as are simple measures such as labeling systems.
For example, putting labels on hot aisles to identify that they are intended to be hot will ensure
IT personnel do not mistakenly believe that the hot aisle is a problem and attempt to decrease its
temperature, thus defeating the purpose of the hot aisle/cold aisle system.136
Cogeneration
Data centers are likely candidates for on-site cogeneration – or combined heat and power (CHP)
– solutions because of their consistently high electricity and cooling demand. On-site
cogeneration has the potential to significantly reduce data center fuel use and GHG emissions by
displacing or replacing less efficient grid-electricity or onsite conventional generation used to
serve data center demand. Cogeneration systems can achieve relatively high efficiencies of 50%
to 80%137
because they combust a fuel to generate power and simultaneously harness the waste
heat from fuel combustion to provide useful heating or cooling. In data centers, the waste heat
captured from cogeneration can be used by absorption or adsorption chillers to drive a cooling
131
Evans 2010a 132
Rasmussen 2011a 133
Alternatively, if a central/coordinated control system cannot be implemented, the problem can be mitigated by
setting all units to the same humidity level, calibrating them properly, and increasing the deadband to about +/-5%.
Rasmussen 2011a 134
PowerAssure 2010b 135
Emerson Network Power 2009 136
Rasmussen 2011a 137
U.S. EPA 2011c
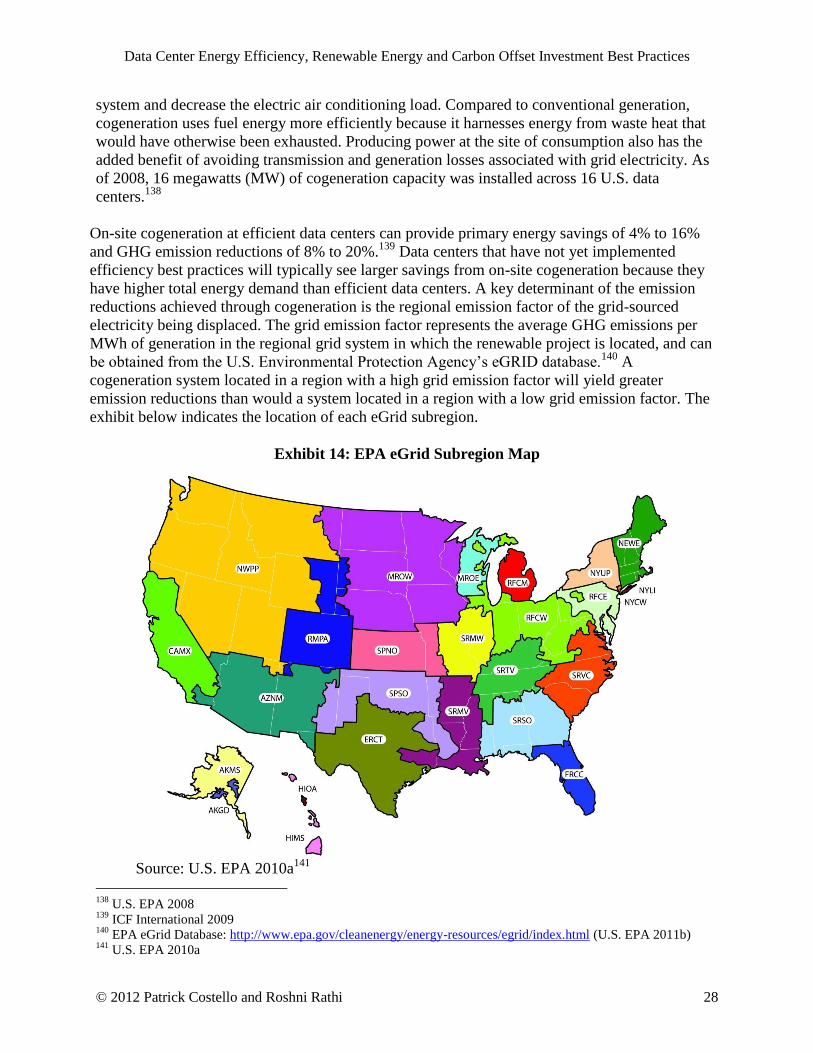
Data Center Energy Efficiency, Renewable Energy and Carbon Offset Investment Best Practices
© 2012 Patrick Costello and Roshni Rathi 28
system and decrease the electric air conditioning load. Compared to conventional generation,
cogeneration uses fuel energy more efficiently because it harnesses energy from waste heat that
would have otherwise been exhausted. Producing power at the site of consumption also has the
added benefit of avoiding transmission and generation losses associated with grid electricity. As
of 2008, 16 megawatts (MW) of cogeneration capacity was installed across 16 U.S. data
centers.138
On-site cogeneration at efficient data centers can provide primary energy savings of 4% to 16%
and GHG emission reductions of 8% to 20%.139
Data centers that have not yet implemented
efficiency best practices will typically see larger savings from on-site cogeneration because they
have higher total energy demand than efficient data centers. A key determinant of the emission
reductions achieved through cogeneration is the regional emission factor of the grid-sourced
electricity being displaced. The grid emission factor represents the average GHG emissions per
MWh of generation in the regional grid system in which the renewable project is located, and can
be obtained from the U.S. Environmental Protection Agency‘s eGRID database.140
A
cogeneration system located in a region with a high grid emission factor will yield greater
emission reductions than would a system located in a region with a low grid emission factor. The
exhibit below indicates the location of each eGrid subregion.
Exhibit 14: EPA eGrid Subregion Map
Source: U.S. EPA 2010a
141
138
U.S. EPA 2008 139
ICF International 2009 140
EPA eGrid Database: http://www.epa.gov/cleanenergy/energy-resources/egrid/index.html (U.S. EPA 2011b) 141
U.S. EPA 2010a

Data Center Energy Efficiency, Renewable Energy and Carbon Offset Investment Best Practices
© 2012 Patrick Costello and Roshni Rathi 29
Since cogeneration is an efficiency measure, it tends to lower data center PUE and CUE.142,143
Qualcomm, a wireless telecommunications R&D company that has installed two cogeneration
systems with a combined capacity of 6.9 MW at its facility in San Diego, California, estimates
that the systems reduce demand for grid electricity by 14 million kWh per year and decrease the
company‘s overall carbon emissions by 12%.144
Integrated cogeneration systems include a prime mover (heat engine), generator, heat recovery,
and electrical interconnection. The entire system is typically identified by the prime mover,
which could be a high-volume technology such as a reciprocating engine, combustion or gas
turbine, or a lower-volume technology such as fuel cells or microturbines. Larger-volume prime
movers are more economic for cogeneration systems that are over 5 MW. Lower-volume
technologies are more appropriate for loads below 5 MW. Various fuels, including natural gas,
oil, coal and alternative fuels, can be combusted in the heat engine to drive the electric generator.
On-site cogeneration can be classified as a secure source of supply under current data center tier
standards if the facility also has on-site fuel storage.145
Data centers with on-site cogeneration typically use cogeneration as the primary power source
and employ a utility feed through the UPS system as a back-up power source. Standby diesel
generators or a second utility feed can provide secondary back-up for critical applications.146
The
figure below provides a schematic representation of the integration of cogeneration into a data
center power system. The waste heat from fuel combustion is channeled to absorption or
adsorption chillers which convert the thermal energy to provide chilled water to Computer Room
Air Handlers (CRAHs) for computer room cooling. These chillers are backed up by electric
chillers that are run as part of the critical load.147,148
142
7X24 et al. 2010b 143
In PUE accounting, inputs to the CHP system are included in the total energy or power (numerator), but the
outputs are not included. A global taskforce that includes the U.S. Department of Energy‘s Save Energy Now and
Federal Energy Management Programs, U.S. Environmental Protection Agency‘s ENERGY STAR Program,
European Commission Joint Research Center Data Centers Code of Conduct, Japan‘s Ministry of Economy, Trade
and Industry, Japan‘s Green IT Promotion Council, and The Green Grid recommends that, for purposes of PUE
calculation, 67% of input energy to the CHP system should be allocated to primary generation, and 33% to
secondary generation.
U.S. DOE et al. 2011a 144
U.S. EPA 2008 145
ICF International 2009 146
ICF International 2009 147
ICF International 2009 148
U.S. EPA 2008
Data Center Energy Efficiency, Renewable Energy and Carbon Offset Investment Best Practices
© 2012 Patrick Costello and Roshni Rathi 30
Exhibit 15: Schematic of Cogeneration Integrated with Data Center Power System
Source: ICF International 2009, Prepared for ORNL
Further information on the optimal design and implementation of on-site cogeneration systems is
available in the Opportunities for Combined Heat and Power in Data Centers report prepared for
the Oak Ridge National Laboratory by ICF International, published in March 2009. U.S. EPA‘s
CHP Partnership149
also provides technical assistance for the development of cogeneration
projects.
On-site cogeneration systems can yield several benefits in addition to environmental footprint
reduction. On-site cogeneration with absorption cooling can often decrease energy costs by
providing power that is cheaper than grid electricity and displacing electric air conditioning load
for cooling. Qualcomm‘s annual energy cost savings from its cogeneration systems have been as
high as $775,000.150
Continuously operating cogeneration systems can also reduce the amount of
battery backup that is needed to be built in to premium power systems.
On-site cogeneration can improve data center reliability because it acts as an alternate source of
electricity to protect critical functions against longer-term grid outages during which UPS and
battery systems cannot provide sufficient power. Compared to emergency backup generators that
have to be started up in the case of an outage, cogeneration systems provide additional reliability
because they can operate continuously.151
Cogeneration systems can enable rapid facility
upgrades or expansion by supplying higher power demand that cannot be met by local utilities in
the near-term. Reducing external power demand by adding on-site cogeneration also decreases
the additional utility infrastructure and associated costs that may be needed in new or expanded
data centers.152
On-site cogeneration installations, especially those powered by cleaner fuels, may benefit from
cost reductions or revenue streams from state and federal incentives or through the sale of
commoditized environmental benefits.153
The three key types of programs available for
149
U.S. EPA Combined Heat and Power Partnership: www.epa.gov/chp (U.S. EPA 2008) 150
U.S. EPA 2008 151
U.S. EPA 2008 152
U.S. EPA 2008 153
Organizations that sell commoditized environmental benefits cannot claim the green attributes of their CHP
systems, but still receive the cost and reliability benefits.

Data Center Energy Efficiency, Renewable Energy and Carbon Offset Investment Best Practices
© 2012 Patrick Costello and Roshni Rathi 31
monetization of environmental benefits from cogeneration are (i) cap and trade programs, (ii)
offset programs, and (iii) renewable energy certificate (REC) programs (discussed in Chapter 3).
The cap and trade programs that can provide revenue to cogeneration installations in the US
include the Regional Greenhouse Gas Initiative, the Western Climate Initiative, and the NOx
Budget Trading Program. Offset programs154
include the New Source Review program that
applies in all areas of the country that are not in attainment with the National Ambient Air
Quality Standards (NAAQS) and CO2 offset programs in states such as Oregon and Washington.
Depending on their location, facilities can also generate white tags or renewable energy
certificates (RECs) from cogeneration that can be certified for sale in state renewable portfolio
standard (RPS) compliance markets and voluntary renewable energy markets. Compliance
markets generally offer substantially higher prices for the environmental attributes of
cogeneration systems than do voluntary markets. The exhibit below provides a list of the 14
states with renewable portfolio standards that include cogeneration as an eligible technology.
Exhibit 16: States that Include Cogeneration as an RPS Eligible Technology
Arizonaa
Michigan Pennsylvania
Colorado North Carolina South Dakota
Connecticut North Dakotab
Utah
Hawaii Nevada Washington
Massachusetts Ohio
(a) Only CHP systems that use renewable fuels are eligible in Arizona, fossil-fueled CHP
systems are not eligible.
b North Dakota‘s Energy Portfolio Standard is a goal, not a mandatory requirement.
Source: U.S. EPA 2011g
White tags are the energy efficiency equivalent of a REC (also known as a green tag) and
represent 1 megawatt hour of conserved energy, whereas a REC represents 1 megawatt hour of
renewable energy generation. Whether the registered environmental attributes of a cogeneration
system are considered white tags or RECs will depend on the market in which the commodities
are traded, the state in which the system is located, and the generation fuel type (e.g. natural gas
v. biogas). Data center energy efficiency improvements such as installing more efficient
lighting155
, an energy management system, or replacing a chiller may also generate white tags.156
White tags are currently eligible to be sold to utilities and retail suppliers in Connecticut,
Pennsylvania, and Nevada to help them meet the states‘ energy efficiency resource standards.157
Compliance and voluntary market demand for white tags is significantly lower than demand for
compliance and voluntary RECs. Neuwing Energy Ventures, Nexant and Sterling Planet are
among the companies that broker white tags.158
154
Carbon offsets are discussed in further detail in Chapter 4. 155
IBM, for example, has sold white tags generated by installing more efficient lighting at a data center in
Connecticut.
Wood 2008b 156
Sterling Planet 2009 157
Wood 2008a 158
Wood 2008a and Cohn 2008
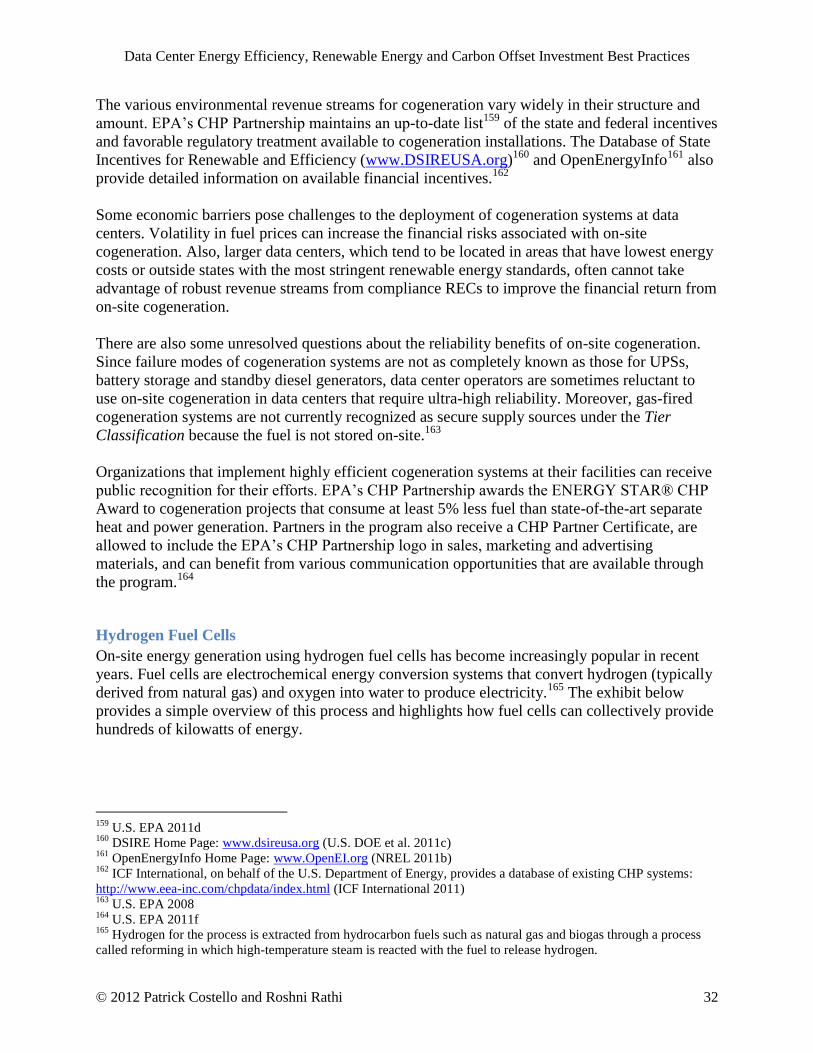
Data Center Energy Efficiency, Renewable Energy and Carbon Offset Investment Best Practices
© 2012 Patrick Costello and Roshni Rathi 32
The various environmental revenue streams for cogeneration vary widely in their structure and
amount. EPA‘s CHP Partnership maintains an up-to-date list159
of the state and federal incentives
and favorable regulatory treatment available to cogeneration installations. The Database of State
Incentives for Renewable and Efficiency (www.DSIREUSA.org)160
and OpenEnergyInfo161
also
provide detailed information on available financial incentives.162
Some economic barriers pose challenges to the deployment of cogeneration systems at data
centers. Volatility in fuel prices can increase the financial risks associated with on-site
cogeneration. Also, larger data centers, which tend to be located in areas that have lowest energy
costs or outside states with the most stringent renewable energy standards, often cannot take
advantage of robust revenue streams from compliance RECs to improve the financial return from
on-site cogeneration.
There are also some unresolved questions about the reliability benefits of on-site cogeneration.
Since failure modes of cogeneration systems are not as completely known as those for UPSs,
battery storage and standby diesel generators, data center operators are sometimes reluctant to
use on-site cogeneration in data centers that require ultra-high reliability. Moreover, gas-fired
cogeneration systems are not currently recognized as secure supply sources under the Tier
Classification because the fuel is not stored on-site.163
Organizations that implement highly efficient cogeneration systems at their facilities can receive
public recognition for their efforts. EPA‘s CHP Partnership awards the ENERGY STAR® CHP
Award to cogeneration projects that consume at least 5% less fuel than state-of-the-art separate
heat and power generation. Partners in the program also receive a CHP Partner Certificate, are
allowed to include the EPA‘s CHP Partnership logo in sales, marketing and advertising
materials, and can benefit from various communication opportunities that are available through
the program.164
Hydrogen Fuel Cells
On-site energy generation using hydrogen fuel cells has become increasingly popular in recent
years. Fuel cells are electrochemical energy conversion systems that convert hydrogen (typically
derived from natural gas) and oxygen into water to produce electricity.165
The exhibit below
provides a simple overview of this process and highlights how fuel cells can collectively provide
hundreds of kilowatts of energy.
159
U.S. EPA 2011d 160
DSIRE Home Page: www.dsireusa.org (U.S. DOE et al. 2011c) 161
OpenEnergyInfo Home Page: www.OpenEI.org (NREL 2011b) 162
ICF International, on behalf of the U.S. Department of Energy, provides a database of existing CHP systems:
http://www.eea-inc.com/chpdata/index.html (ICF International 2011) 163
U.S. EPA 2008 164
U.S. EPA 2011f 165
Hydrogen for the process is extracted from hydrocarbon fuels such as natural gas and biogas through a process
called reforming in which high-temperature steam is reacted with the fuel to release hydrogen.
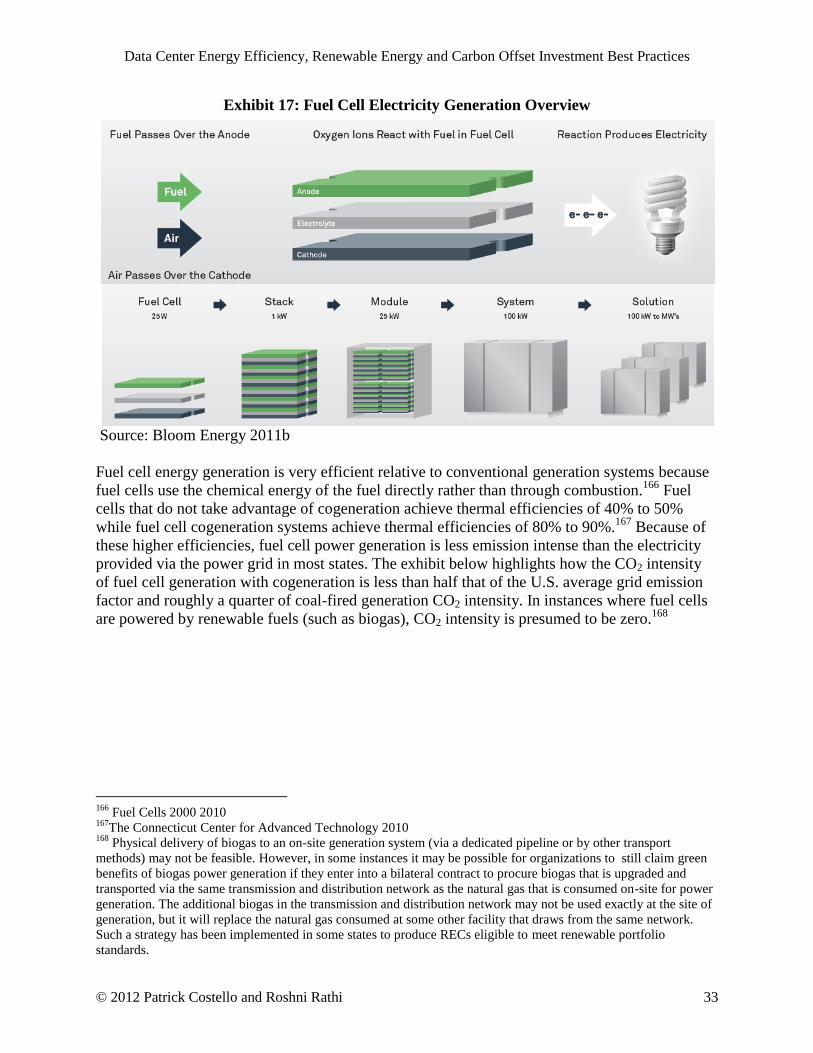
Data Center Energy Efficiency, Renewable Energy and Carbon Offset Investment Best Practices
© 2012 Patrick Costello and Roshni Rathi 33
Exhibit 17: Fuel Cell Electricity Generation Overview
Source: Bloom Energy 2011b
Fuel cell energy generation is very efficient relative to conventional generation systems because
fuel cells use the chemical energy of the fuel directly rather than through combustion.166
Fuel
cells that do not take advantage of cogeneration achieve thermal efficiencies of 40% to 50%
while fuel cell cogeneration systems achieve thermal efficiencies of 80% to 90%.167
Because of
these higher efficiencies, fuel cell power generation is less emission intense than the electricity
provided via the power grid in most states. The exhibit below highlights how the CO2 intensity
of fuel cell generation with cogeneration is less than half that of the U.S. average grid emission
factor and roughly a quarter of coal-fired generation CO2 intensity. In instances where fuel cells
are powered by renewable fuels (such as biogas), CO2 intensity is presumed to be zero.168
166
Fuel Cells 2000 2010 167
The Connecticut Center for Advanced Technology 2010 168
Physical delivery of biogas to an on-site generation system (via a dedicated pipeline or by other transport
methods) may not be feasible. However, in some instances it may be possible for organizations to still claim green
benefits of biogas power generation if they enter into a bilateral contract to procure biogas that is upgraded and
transported via the same transmission and distribution network as the natural gas that is consumed on-site for power
generation. The additional biogas in the transmission and distribution network may not be used exactly at the site of
generation, but it will replace the natural gas consumed at some other facility that draws from the same network.
Such a strategy has been implemented in some states to produce RECs eligible to meet renewable portfolio
standards.
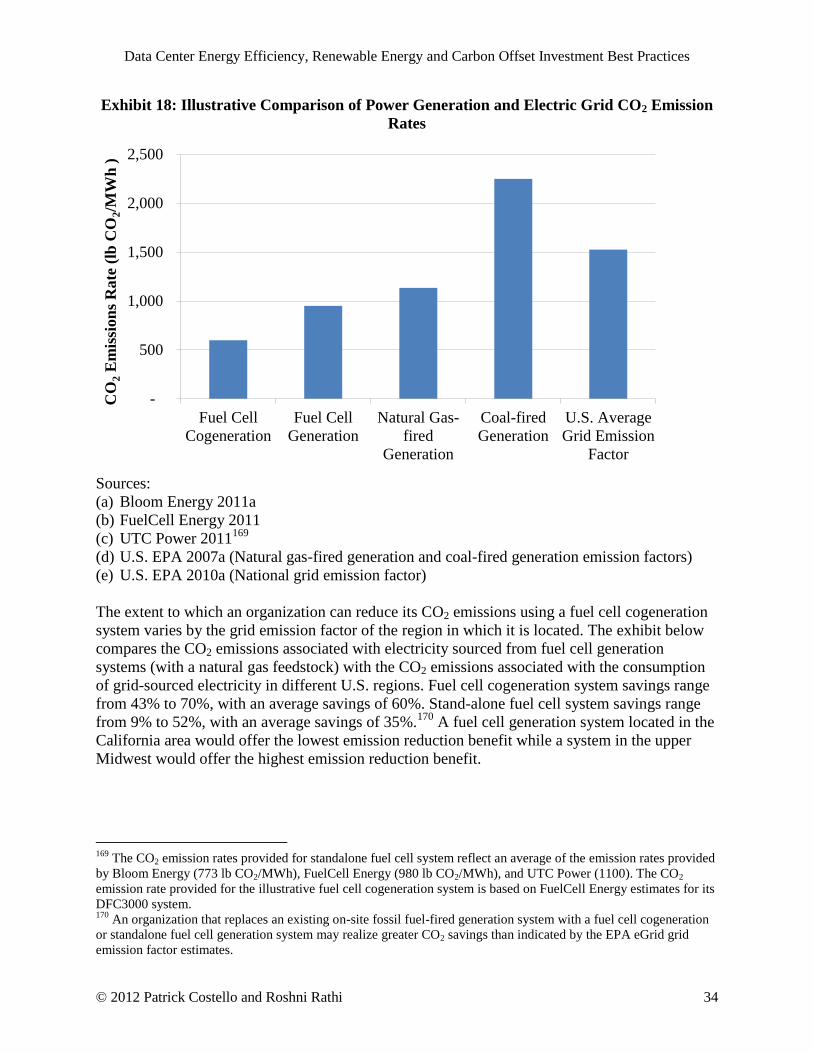
Data Center Energy Efficiency, Renewable Energy and Carbon Offset Investment Best Practices
© 2012 Patrick Costello and Roshni Rathi 34
Exhibit 18: Illustrative Comparison of Power Generation and Electric Grid CO2 Emission
Rates
Sources:
(a) Bloom Energy 2011a
(b) FuelCell Energy 2011
(c) UTC Power 2011169
(d) U.S. EPA 2007a (Natural gas-fired generation and coal-fired generation emission factors)
(e) U.S. EPA 2010a (National grid emission factor)
The extent to which an organization can reduce its CO2 emissions using a fuel cell cogeneration
system varies by the grid emission factor of the region in which it is located. The exhibit below
compares the CO2 emissions associated with electricity sourced from fuel cell generation
systems (with a natural gas feedstock) with the CO2 emissions associated with the consumption
of grid-sourced electricity in different U.S. regions. Fuel cell cogeneration system savings range
from 43% to 70%, with an average savings of 60%. Stand-alone fuel cell system savings range
from 9% to 52%, with an average savings of 35%.170
A fuel cell generation system located in the
California area would offer the lowest emission reduction benefit while a system in the upper
Midwest would offer the highest emission reduction benefit.
169
The CO2 emission rates provided for standalone fuel cell system reflect an average of the emission rates provided
by Bloom Energy (773 lb CO2/MWh), FuelCell Energy (980 lb CO2/MWh), and UTC Power (1100). The CO2
emission rate provided for the illustrative fuel cell cogeneration system is based on FuelCell Energy estimates for its
DFC3000 system. 170
An organization that replaces an existing on-site fossil fuel-fired generation system with a fuel cell cogeneration
or standalone fuel cell generation system may realize greater CO2 savings than indicated by the EPA eGrid grid
emission factor estimates.
-
500
1,000
1,500
2,000
2,500
Fuel Cell
Cogeneration
Fuel Cell
Generation
Natural Gas-
fired
Generation
Coal-fired
Generation
U.S. Average
Grid Emission
Factor
CO
2 E
mis
sion
s R
ate
(lb
CO
2/M
Wh
)
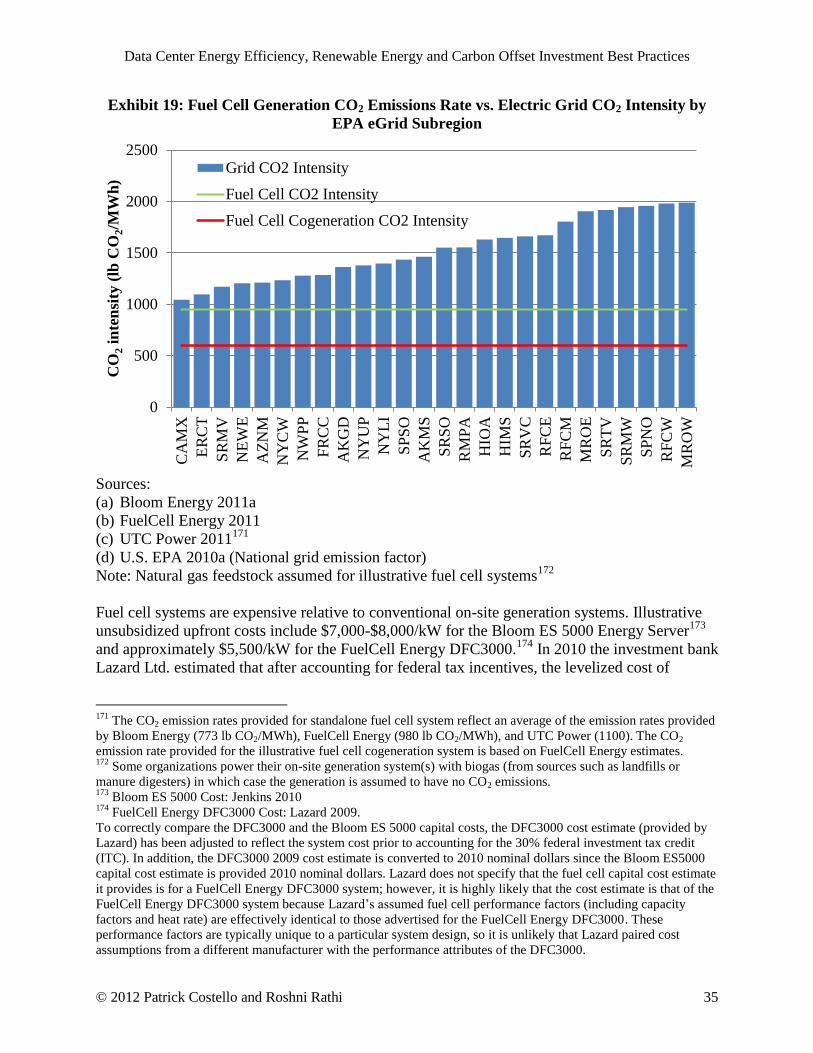
Data Center Energy Efficiency, Renewable Energy and Carbon Offset Investment Best Practices
© 2012 Patrick Costello and Roshni Rathi 35
Exhibit 19: Fuel Cell Generation CO2 Emissions Rate vs. Electric Grid CO2 Intensity by
EPA eGrid Subregion
Sources:
(a) Bloom Energy 2011a
(b) FuelCell Energy 2011
(c) UTC Power 2011171
(d) U.S. EPA 2010a (National grid emission factor)
Note: Natural gas feedstock assumed for illustrative fuel cell systems172
Fuel cell systems are expensive relative to conventional on-site generation systems. Illustrative
unsubsidized upfront costs include $7,000-$8,000/kW for the Bloom ES 5000 Energy Server173
and approximately $5,500/kW for the FuelCell Energy DFC3000.174
In 2010 the investment bank
Lazard Ltd. estimated that after accounting for federal tax incentives, the levelized cost of
171
The CO2 emission rates provided for standalone fuel cell system reflect an average of the emission rates provided
by Bloom Energy (773 lb CO2/MWh), FuelCell Energy (980 lb CO2/MWh), and UTC Power (1100). The CO2
emission rate provided for the illustrative fuel cell cogeneration system is based on FuelCell Energy estimates. 172
Some organizations power their on-site generation system(s) with biogas (from sources such as landfills or
manure digesters) in which case the generation is assumed to have no CO2 emissions. 173
Bloom ES 5000 Cost: Jenkins 2010 174
FuelCell Energy DFC3000 Cost: Lazard 2009.
To correctly compare the DFC3000 and the Bloom ES 5000 capital costs, the DFC3000 cost estimate (provided by
Lazard) has been adjusted to reflect the system cost prior to accounting for the 30% federal investment tax credit
(ITC). In addition, the DFC3000 2009 cost estimate is converted to 2010 nominal dollars since the Bloom ES5000
capital cost estimate is provided 2010 nominal dollars. Lazard does not specify that the fuel cell capital cost estimate
it provides is for a FuelCell Energy DFC3000 system; however, it is highly likely that the cost estimate is that of the
FuelCell Energy DFC3000 system because Lazard‘s assumed fuel cell performance factors (including capacity
factors and heat rate) are effectively identical to those advertised for the FuelCell Energy DFC3000. These
performance factors are typically unique to a particular system design, so it is unlikely that Lazard paired cost
assumptions from a different manufacturer with the performance attributes of the DFC3000.
0
500
1000
1500
2000
2500
CA
MX
ER
CT
SR
MV
NE
WE
AZ
NM
NY
CW
NW
PP
FR
CC
AK
GD
NY
UP
NY
LI
SP
SO
AK
MS
SR
SO
RM
PA
HIO
A
HIM
S
SR
VC
RF
CE
RF
CM
MR
OE
SR
TV
SR
MW
SP
NO
RF
CW
MR
OW
CO
2 i
nte
nsi
ty (
lb C
O2/M
Wh
)
Grid CO2 Intensity
Fuel Cell CO2 Intensity
Fuel Cell Cogeneration CO2 Intensity

Data Center Energy Efficiency, Renewable Energy and Carbon Offset Investment Best Practices
© 2012 Patrick Costello and Roshni Rathi 36
generation from fuel cells ranged from 11¢/kWh to 24¢/kWh.175
Available market information
suggests that the low end of Lazard‘s estimate may still be out of reach.
In 2008 and 2009 the Connecticut Department of Public Utility Control approved several
contracts with proposed fuel cell projects (without cogeneration). These projects ranged in size
from a few megawatts to over a dozen megawatts, and all used the FuelCell Energy DFC 3000
model with natural gas feedstock.176
Only one of these approved projects has been developed to
date, suggesting that the original contract prices are insufficient to attract affordable financing
and advance development.
The primary barriers facing fuel cell development are fuel price fluctuations, potential GHG
regulation, and high upfront costs. Take, for example, the proposed 3.2 MW Cube Fuel Cell
project in Danbury, Connecticut. Raising the assumed cost of natural gas for the project from
$5/MMBtu to $10/MMbtu would raise the implied levelized cost of the system by over
4¢/kWh.177
And if federal GHG regulation that included a $20/Mt tax on CO2 emissions were
passed, the cost of the same project in a given year would rise by an estimated 1¢/kWh, an
amount that seems insignificant but would actually raise annual operating costs by over
$260,000.178
At present, however, neither natural gas price fluctuation nor CO2 policy risks are
major concerns. Natural gas prices are currently very low (around $4/MMBtu) and are expected
to remain reasonably low due to unprecedented growth in shale gas drilling that is dramatically
expanding market supply. In addition, it appears unlikely that Congress will pass federal GHG
policy to tax CO2 emissions in the near to mid-term.
Currently, the greatest discrepancy between fuel cell generation systems and conventional on-site
generation systems is the upfront cost. As shown in Exhibit 20 below, fuel cell systems remain
substantially more expensive than conventional on-site generation technologies.
175
Lazard 2010; for older but more detailed cost estimates see Lazard 2009 176
Projects selected through Connecticut‘s Project 150: CT Energy Info 2011 177
Author analysis. Assuming an average heat rate of 8241 Btu/KWh (Connecticut DPUC 2011b) 178
Assuming an annual average capacity factor of 95% (Lazard 2009) and an average heat rate of 8241 Btu/KWh
(Connecticut DPUC 2011b)
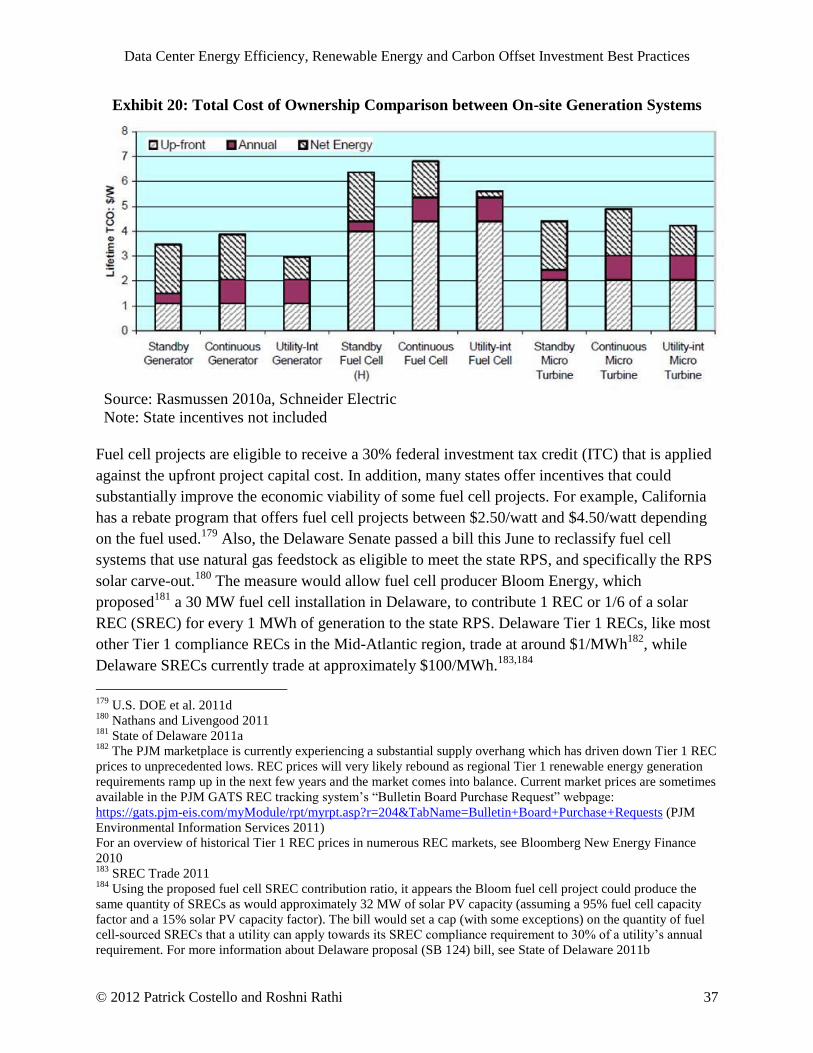
Data Center Energy Efficiency, Renewable Energy and Carbon Offset Investment Best Practices
© 2012 Patrick Costello and Roshni Rathi 37
Exhibit 20: Total Cost of Ownership Comparison between On-site Generation Systems
Source: Rasmussen 2010a, Schneider Electric
Note: State incentives not included
Fuel cell projects are eligible to receive a 30% federal investment tax credit (ITC) that is applied
against the upfront project capital cost. In addition, many states offer incentives that could
substantially improve the economic viability of some fuel cell projects. For example, California
has a rebate program that offers fuel cell projects between $2.50/watt and $4.50/watt depending
on the fuel used.179
Also, the Delaware Senate passed a bill this June to reclassify fuel cell
systems that use natural gas feedstock as eligible to meet the state RPS, and specifically the RPS
solar carve-out.180
The measure would allow fuel cell producer Bloom Energy, which
proposed181
a 30 MW fuel cell installation in Delaware, to contribute 1 REC or 1/6 of a solar
REC (SREC) for every 1 MWh of generation to the state RPS. Delaware Tier 1 RECs, like most
other Tier 1 compliance RECs in the Mid-Atlantic region, trade at around $1/MWh182
, while
Delaware SRECs currently trade at approximately $100/MWh.183,184
179
U.S. DOE et al. 2011d 180
Nathans and Livengood 2011 181
State of Delaware 2011a 182
The PJM marketplace is currently experiencing a substantial supply overhang which has driven down Tier 1 REC
prices to unprecedented lows. REC prices will very likely rebound as regional Tier 1 renewable energy generation
requirements ramp up in the next few years and the market comes into balance. Current market prices are sometimes
available in the PJM GATS REC tracking system‘s ―Bulletin Board Purchase Request‖ webpage:
https://gats.pjm-eis.com/myModule/rpt/myrpt.asp?r=204&TabName=Bulletin+Board+Purchase+Requests (PJM
Environmental Information Services 2011)
For an overview of historical Tier 1 REC prices in numerous REC markets, see Bloomberg New Energy Finance
2010 183
SREC Trade 2011 184
Using the proposed fuel cell SREC contribution ratio, it appears the Bloom fuel cell project could produce the
same quantity of SRECs as would approximately 32 MW of solar PV capacity (assuming a 95% fuel cell capacity
factor and a 15% solar PV capacity factor). The bill would set a cap (with some exceptions) on the quantity of fuel
cell-sourced SRECs that a utility can apply towards its SREC compliance requirement to 30% of a utility‘s annual
requirement. For more information about Delaware proposal (SB 124) bill, see State of Delaware 2011b
Data Center Energy Efficiency, Renewable Energy and Carbon Offset Investment Best Practices
© 2012 Patrick Costello and Roshni Rathi 38
In the past, fuel cell installations have been relatively limited due to high upfront costs, but the
average cost of fuel cell systems dropped nearly 40% between 2002 and 2010.185
Assuming costs
continue to decline, the U.S. could see substantial new fuel cell development. Currently there are
nearly 500 existing and planned U.S. fuel cell installations, roughly two dozen of which are fuel
cell cogeneration systems. Existing fuel cell cogeneration systems are located at sites such as
residential, hospitality, fitness, educational, water treatment, government, and communications
facilities and predominantly found in California and the Northeastern U.S.186
Communicating Energy Efficiency Improvements
Investing in energy efficiency is increasingly seen as the minimum effort that companies with
large energy and carbon footprints should make to decrease their environmental impact. This
perception, combined with concerns regarding the authenticity and public acceptance of many
other greening solutions, has made energy efficiency the logical first step in any organization‘s
greening strategy.
Organizations can pursue several certifications and awards to gain recognition for existing data
centers that have made significant efficiency improvements and new data centers that have been
built to high efficiency standards. These awards are typically be announced in highly publicized
press releases, and several recognition programs also provide marketing and branding materials.
Members of The Green Grid (TGG) that that register their PUE results with TGG can gain
visibility through listings on the website, and those that provide third-party validation of their
PUE are eligible to certify their performance and be considered for future TGG recognition
programs.187
The American Council for an Energy Efficient Economy (ACEEE) awards the
Champion of Energy Efficiency Awards annually to industry leaders for their contributions to
the field of energy efficiency.188
Organizations could also consider becoming ENERGY STAR partners and applying for the
ENERGY STAR label. This label is awarded to standalone data centers or to buildings with large
data centers that perform in the top quartile of their peers.189
Facilities could also take the
ENERGY STAR Challenge to decrease their energy use by 10%.190
The ENERGY STAR label
has been awarded to eight data centers so far. A list of these data centers along with descriptions
of their efficiency strategies is available online at the ENERGY STAR Labeled Building and
Plants Database.191
Several data centers have also applied for and received the U.S. Green Building Council‘s
prestigious LEED certification. The American College Testing (ACT) data center in Iowa City,
Iowa, was the first U.S. data center to be awarded the LEED-Platinum rating, in recognition of
its highly efficient HVAC system with geothermal free cooling and the recycled content that was
185
The Connecticut Center for Advanced Technology 2010 186
Fuel Cells 2000 and U.S. DOE Hydrogen Program 2011
There are nearly 1100 total fuel cell installations worldwide (Fuel Cells 2000 2011) 187
The Green Grid 2011 188
ACEEE 2011 189
U.S. EPA 2011h 190
U.S. EPA 2011l 191
U.S. EPA 2011i
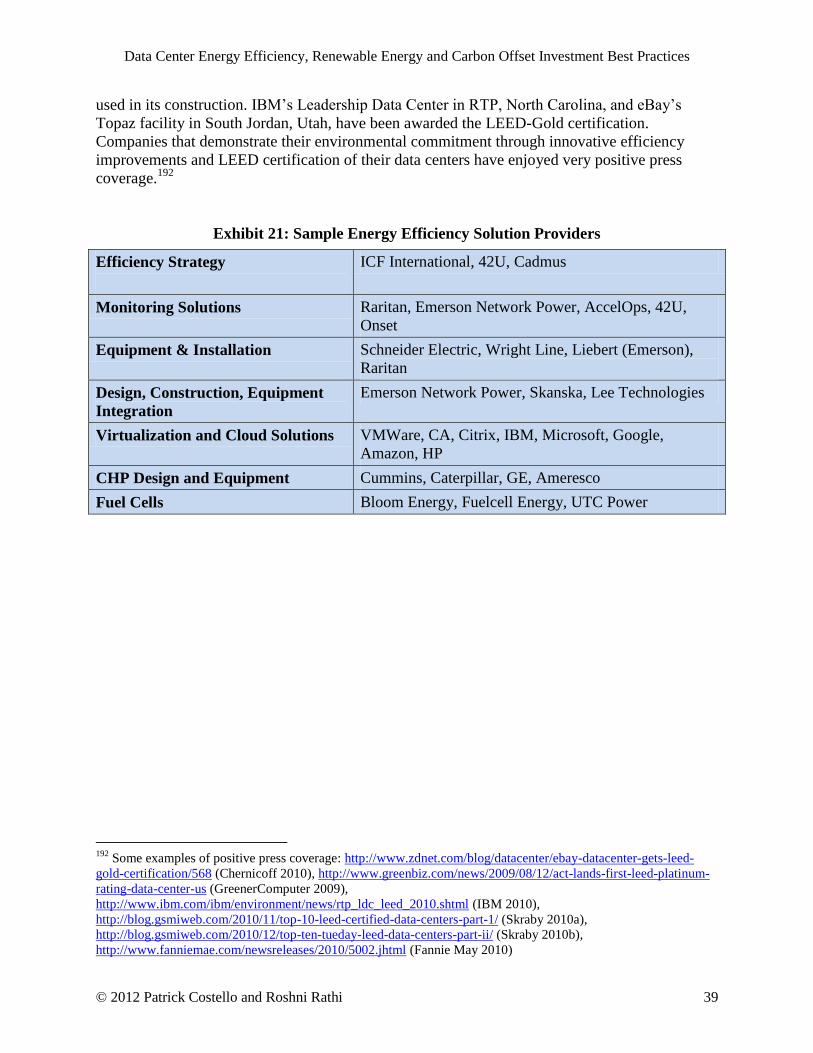
Data Center Energy Efficiency, Renewable Energy and Carbon Offset Investment Best Practices
© 2012 Patrick Costello and Roshni Rathi 39
used in its construction. IBM‘s Leadership Data Center in RTP, North Carolina, and eBay‘s
Topaz facility in South Jordan, Utah, have been awarded the LEED-Gold certification.
Companies that demonstrate their environmental commitment through innovative efficiency
improvements and LEED certification of their data centers have enjoyed very positive press
coverage.192
Exhibit 21: Sample Energy Efficiency Solution Providers
Efficiency Strategy
ICF International, 42U, Cadmus
Monitoring Solutions Raritan, Emerson Network Power, AccelOps, 42U,
Onset
Equipment & Installation Schneider Electric, Wright Line, Liebert (Emerson),
Raritan
Design, Construction, Equipment
Integration
Emerson Network Power, Skanska, Lee Technologies
Virtualization and Cloud Solutions VMWare, CA, Citrix, IBM, Microsoft, Google,
Amazon, HP
CHP Design and Equipment Cummins, Caterpillar, GE, Ameresco
Fuel Cells Bloom Energy, Fuelcell Energy, UTC Power
192
Some examples of positive press coverage: http://www.zdnet.com/blog/datacenter/ebay-datacenter-gets-leed-
gold-certification/568 (Chernicoff 2010), http://www.greenbiz.com/news/2009/08/12/act-lands-first-leed-platinum-
rating-data-center-us (GreenerComputer 2009),
http://www.ibm.com/ibm/environment/news/rtp_ldc_leed_2010.shtml (IBM 2010),
http://blog.gsmiweb.com/2010/11/top-10-leed-certified-data-centers-part-1/ (Skraby 2010a),
http://blog.gsmiweb.com/2010/12/top-ten-tueday-leed-data-centers-part-ii/ (Skraby 2010b),
http://www.fanniemae.com/newsreleases/2010/5002.jhtml (Fannie May 2010)
Data Center Energy Efficiency, Renewable Energy and Carbon Offset Investment Best Practices
© 2012 Patrick Costello and Roshni Rathi 40
Chapter 3 Renewable Energy
Introduction
Investing in renewable energy has become an increasingly popular way for organizations to meet
sustainability goals. Images of wind turbines, solar panels, and other renewable generators are
now closely associated with environmental stewardship. Choosing among the array of renewable
energy investment options, however, can be complicated. Recent criticism of the value and
benefits of renewable energy certificates, the most popular form of investment in renewable
energy, further complicates the selection process. The following sections outline common
renewable energy investment options and explore the advantages and disadvantages of each.
Prospective renewable energy investors should understand the benefits of renewable energy and
how those benefits are quantified. One of the key environmental benefits of renewable energy is
that it decreases the demand for current or new conventional generation and prevents associated
greenhouse gas (GHG) emissions from existing or planned fossil fuel-fired power plants.
Emission reductions, expressed in terms of metric tons of CO2 equivalent (MtCO2e), are a
function of the reduction in output from fossil fuel generators due to an increase in generation
from a renewable energy project connected to the same grid system. Hence, the emission
reduction benefits of renewable energy are ―indirect,‖ because renewable generation occurs at
one place on the grid and emission reductions occur at another.
Renewable energy projects are described as ―additional‖ if they have been determined to be
beyond business-as-usual (BAU), i.e. if the projects are not already planned or in development,
and if they would not have been built if not for expected investment or revenue from the sale of
their green attributes.193
On-site renewable energy installations are regularly accepted to be
additional, but other renewable energy investment options do not always offer clear additionality.
Exhibit 22 provides an overview of the types of renewable energy investment options. The
options vary in cost, complexity, directness of support, clarity of additionality, and PR value.
193
Additionality is also discussed in Chapter 4 as a key criterion for the evaluation of carbon offset projects.
Data Center Energy Efficiency, Renewable Energy and Carbon Offset Investment Best Practices
© 2012 Patrick Costello and Roshni Rathi 92
Works Cited
1E (2011). NightWatchman® Server Edition.
http://www.1e.com/softwareproducts/nightwatchmanserver/index.aspx
3Degrees (2011). Project-Specific RECs. Accessed June 2011.
http://www.3degreesinc.com/node/17
7x24 Exchange, ASHRAE, The Green Grid, Silicon Valley Leadership Group, U.S. Department
of Energy (DOE) Save Energy Now and Federal Energy Management Programs, U.S.
Environmental Protection Agency‘s EPA ENERGY STAR Program, United States
Green Building Council, and Uptime Institute (2010). Data Center Industry Leaders
Reach Agreement on Guiding Principles for Energy Efficiency Metrics. February 2010.
http://www.energystar.gov/ia/partners/prod_development/downloads/DataCenters_Agre
ementGuidingPrinciples.pdf
7x24 Exchange, ASHRAE, The Green Grid, Silicon Valley Leadership Group, U.S. DOE Save
Energy Now Program, U.S. EPA‘s ENERGY STAR Program, United States Green
Building Council, and Uptime Institute (2010). Recommendations for Measuring and
Reporting Overall Data Center Efficiency, Version 1 – Measuring PUE at Dedicated
Data Centers. July 2010.
http://www.thegreengrid.org/~/media/WhitePapers/RecommendationsforMeasuringand
ReportingOverallDataCenterEfficiency2010-07-15.ashx
Amazon Web Services (2011). Amazon Elastic Compute Cloud (Amazon EC2). Accessed May
2011. http://aws.amazon.com/ec2/
American Council for an Energy-Efficient Economy (ACEEE) (2011). ACEEE Awards.
Accessed March 2011.
http://www.aceee.org/about/awards
American Society of Heating, Refrigerating and Air-Conditioning Engineers, Inc (ASHRAE)
(2008). 2008 ASHRAE Environmental Guidelines for Datacom Equipment.
http://tc99.ashraetcs.org/documents/ASHRAE_Extended_Environmental_Envelope_Fin
al_Aug_1_2008.pdf
ASHRAE TC 9.9 (2009). Gaseous and Particulate Contamination Guidelines for Data Centers.
September 2009.
http://www.ashrae.org/File%20Library/docLib/Public/20090915_whitepaperfinal.pdf
Data Center Energy Efficiency, Renewable Energy and Carbon Offset Investment Best Practices
© 2012 Patrick Costello and Roshni Rathi 93
Baliga, Jayant, Robert W. A. Ayre, Kerry Hinton, and Rodney S. Tucker (2011). Green Cloud
Computing: Balancing Energy in Processing, Storage, and Transport. Proceedings of
the IEEE, Vol.99, No. 1. January 2011.
http://home.dei.polimi.it/sami/architetture_avanzate/cloud.pdf
Ball, Jeffrey 2008 . ―Green Goal of 'Carbon Neutrality' Hits Limit." Wall Street Journal.
December 2008.
http://online.wsj.com/article/SB123059880241541259.html?mod=googlenews_wsj
Barbose, Galen, Naim Darghouth and Ryan Wiser (2010). Tracking the Sun III – The Installed
Cost of Photovoltaics in the U.S. from 1998-2009. Lawrence Berkeley Energy
Laboratory. LBNL-4121E. December 2010. http://eetd.lbl.gov/ea/ems/reports/lbnl-
4121e.pdf
BBC News 2007 . ―Carbon offsets 'harm environment'.‖ February 2007.
http://news.bbc.co.uk/2/hi/uk_news/politics/6378471.stm
Bird, Lori (2010a). Status of the Voluntary Renewable Energy Markets. Renewable Energy
Markets 2010 Conference. National Renewable Energy Laboratory. October 2010.
http://www.renewableenergymarkets.com/docs/presentations/2010/Wed_State%20of%2
0the%20Markets_Lori%20Bird.pdf
Bird, Lori (2010b). Voluntary Green Power Market Overview. Renewable Energy Markets
2010: Green Power 101. National Renewable Energy Laboratory. October 2010.
http://www.renewableenergymarkets.com/docs/presentations/2010/Wed_RE%20101_Lo
ri%20Bird.pdf
Bird, Lori and Jenny Sumner (2010). Green Power Marketing in the United States: A Status
Report” ( 009 Data . National Renewable Energy Laboratory. NREL/TP-6A20-49403.
September 2010. http://apps3.eere.energy.gov/greenpower/pdfs/49403.pdf
Bird, Lori, Claire Kreycik, and Barry Friedman (2009). Green Power Marketing in the United
States: A Status Report (2008 Data). National Renewable Energy Laboratory.
NREL/TP-6A2-46581. September 2009. http://www.nrel.gov/docs/fy09osti/46581.pdf
Bird, Lori, Ed Holt, Jenny Sumner and Claire Kreycik (2010). Voluntary Green Power Market
Forecast through 2015. National Renewable Energy Laboratory. NREL/TP-6A2-48158.
May 2010. http://www.nrel.gov/docs/fy10osti/48158.pdf
Bloom Energy (2011a). "ES-5000 Energy Server Data Sheet." Accessed May 2011.
http://www.bloomenergy.com/products/data-sheet/
Data Center Energy Efficiency, Renewable Energy and Carbon Offset Investment Best Practices
© 2012 Patrick Costello and Roshni Rathi 94
Bloom Energy 2011b . ―How Bloom Energy Servers Create Electricity." Accessed May 2011.
http://c0688662.cdn.cloudfiles.rackspacecloud.com/downloads_pdf_How_it_Works.pdf
Bloomberg New Energy Finance (2011). "Wind turbine prices fall to their lowest in recent
years." February 2011. http://bnef.com/PressReleases/view/139
Bollinger, Mark (2009). Financing Non-Residential Photovoltaic Projects: Options and
Implications. Lawrence Berkeley National Laboratory. LBNL-1410E. January 2009.
http://eetd.lbl.gov/ea/EMS/reports/lbnl-1410e.pdf
Burston, Jane 2011 . ―Time to send offsetting into retirement?” Environmental Finance.
January 2011. http://www.environmental-finance.com/features/view/537
California Air Resources Board (CARB) (2010). Volume 1: Proposed Regulation to Implement
the California Cap-and-Trade Program, Appendix A: Proposed Regulation Order.
October 2010. http://www.arb.ca.gov/regact/2010/capandtrade10/capv1appa.pdf
California Energy Commission and California Public Utilities Commission (2010). California
Solar Initiative Database. State of California. Accessed October 2010.
http://www.californiasolarstatistics.ca.gov/current_data_files/
Carbon Disclosure Project (CDP) (2011). Guidance for Responding Companies.
https://www.cdproject.net/Documents/Guidance/CDP2011ReportingGuidance.pdf
Carbon Finance 2008 . ―CCX prices drop to four-year low.‖ November 2008.
http://www.carbon-financeonline.com/
Carbon Finance (2010 . ―Support grows for HFC phase out.‖ November 2010.
http://www.carbon-financeonline.com/
Carbon Neutral Company (2011). Communicating on Carbon. Accessed May 2011.
http://www.carbonneutral.com/our-services/communicate/
Carbon Offset Research and Education (CORE) (2011). Home Page. Accessed March 2011.
http://co2offsetresearch.org/index.html
Carbonfund.org and Responsible Purchasing Network (RPN) (2009). Responsible Purchasing
Guide: Carbon Offsets.
http://www.responsiblepurchasing.org/purchasing_guides/carbon_offsets/purchasing_gu
ide.pdf
Data Center Energy Efficiency, Renewable Energy and Carbon Offset Investment Best Practices
© 2012 Patrick Costello and Roshni Rathi 95
Center for Resource Solutions (CRS) (2010a). 2009 Green-e Verification Report. October 2010.
http://www.green-e.org/docs/2009%20Green-e%20Verification%20Report.pdf
CRS (2010b). "California Energy Commission Rejects Edison Claim to Renewable Energy
Certificates." July 2010. http://www.resource-
solutions.org/pressreleases/2010/072810.htm
CRS (2010c). Best Practices in Public Claims for Green Power Purchases and Sales. October
2010. http://www.green-
e.org/docs/energy/Best%20Practices%20in%20Public%20Claims.pdf
Chatsworth Products, Inc. (2009) Ducted Exhaust Cabinet - Managing Exhaust Airflow Beyond
Hot Aisle/Cold Aisle. March 2009.
http://www.chatsworth.com/uploadedFiles/Files/ducted_exhaust_beyond_hotcold_wp.p
df
Chernicoff, David (2010). "eBay Datacenter gets LEED Gold Certification." ZDNet. December
2010.
http://www.zdnet.com/blog/datacenter/ebay-datacenter-gets-leed-gold-certification/568
Chicago Climate Exchange (2010). CCX Advisory 2010-2013. October 2010.
http://greenhellblog.files.wordpress.com/2010/10/ccx-ends-carbon-trading.pdf
Chicago Climate Exchange (2011). Transaction Data – Historical End of Day Data. Accessed
March 2011.
https://www.theice.com/publicdocs/ccx/CCX_Historical_Price_and_Volume.xls
Citrix (2008). Green IT: Reducing your Carbon Footprint with Citrix. April 2008.
http://www.citrix.com/site/resources/dynamic/additional/green_IT_wp.pdf
Cloud Computing Use Case Discussion Group (2010). Cloud Computing Use Cases White
Paper. Version 4.0. July 2010.
http://opencloudmanifesto.org/Cloud_Computing_Use_Cases_Whitepaper-4_0.pdf
Cohn, Lisa (2008). "Profile of a White Tag Project." Energy Efficiency Newsletter. September
2008.
http://www.realenergywriters.com/ee-blog/2008/09/18/profile-of-a-white-tag-project/
Cohn, Lisa 2009a . ―How Servers Waste Energy 1.‖ Interview with Sumir Karayi, CEO of 1E.
Energy Efficiency Markets Podcast. Podcast 86. October 2009.
http://www.realwriters.net/rew/rtlnkps.htm
Data Center Energy Efficiency, Renewable Energy and Carbon Offset Investment Best Practices
© 2012 Patrick Costello and Roshni Rathi 96
Cohn, Lisa 2009b . ―How Servers Waste Energy 2.‖ Interview with Sumir Karayi, CEO of 1E.
Energy Efficiency Markets Podcast. Podcast 87. November 2009.
http://www.realwriters.net/rew/rtlnkps.htm
Connecticut DPUC (2011a). Docket: Review of Long-Term Renewable Contracts - Round 2
Results [07-04-27]. Accessed May 2011.
http://www.dpuc.state.ct.us/dockhist.nsf/%28Web+Main+View/All+Dockets%29?Open
View&StartKey=07-04-27
Connecticut DPUC (2011b). Docket: Review of Long-Term Renewable Contracts - Round 3
Results [08-03-03]. Accessed May 2011.
http://www.dpuc.state.ct.us/dockhist.nsf/(Web+Main+View/All+Dockets)?OpenView&
StartKey=08-03-03
Cory, Karlynn 2011 . ―Green Power, and RECs, and Marketing, Oh My! FTC Revises Rules.‖
Renewable Energy Project Finance Blog. National Renewable Energy Laboratory.
January 2011. http://financere.nrel.gov/finance/content/green-power-and-recs-and-
marketing-oh-my-ftc-revises-rules
CT Energy Info (2011). Project 150. Connecticut Energy Efficiency Fund. Accessed May 2011.
http://www.ctenergyinfo.com/dpuc_project_150.htm
Dell (2011). The Benefits of Dell Blades. Accessed May 2011.
http://content.dell.com/us/en/enterprise/blade-server-solutions-the-benefits-of-dell-
blades.aspx
Di Capua, Michael (2010). US REC Market - NARUC Annual Conference. Bloomberg New
Energy Finance. November 2010.
http://www.narucmeetings.org/Presentations/mdicapua%20-
%20bloomberg%20new%20energy%20finance.pdf
Digital Realty Trust (2010). Home Page. www.digitalrealtytrust.com
Dominion Virginia Power (2011). Dominion Green Power Frequently Asked Questions.
Accessed May 2011. http://www.dom.com/dominion-virginia-power/customer-
service/energy-conservation/green-power-frequently-asked-questions.jsp
Dunlap, Kevin and Neil Rasmussen. (2010). The Advantages of Row and Rack-oriented Cooling
Architectures for Data Centers. Schneider Electric.
http://www.apcmedia.com/salestools/VAVR-6J5VYJ_R1_EN.pdf
Data Center Energy Efficiency, Renewable Energy and Carbon Offset Investment Best Practices
© 2012 Patrick Costello and Roshni Rathi 97
Ecosystem Marketplace and Bloomberg New Energy Finance (2010). Building Bridges: State of
the Voluntary Carbon Markets 2010. June 2010.
http://www.ecosystemmarketplace.com/pages/dynamic/resources.library.page.php?page
_id=7585§ion=our_publications&eod=1
EdgeBCC (2009). Data Center Tier Levels. Accessed June 2011.
http://edgebcc.com/facility/tier.html
Electricity Storage Association (ESA) (2009). Technologies. Capital Costs. April 2009.
http://www.electricitystorage.org/ESA/technologies/
Elgin, Ben 2010 . ―Energy Credits Prove Inflated with Green Claims Seen as Hot Air.‖
Bloomberg Markets Magazine. December 2010.
http://www.bloomberg.com/news/2010-12-07/renewable-energy-credits-prove-inflated-
with-green-claims-seen-as-hot-air.html
Emerson Network Power (2009). Energy Logic: Reducing Data Center Energy Consumption by
Creating Savings that Cascade Across Systems. http://emersonnetworkpower.com/en-
US/Brands/Liebert/Documents/White%20Papers/Energy%20Logic_Reducing%20Data
%20Center%20Energy%20Consumption%20by%20Creating%20Savings%20that%20C
ascade%20Across%20Systems.pdf
Environmental Protection (2010). "Haworth Achieves LEED-NC Gold Status Using Carbon
Credits." April 2010. http://eponline.com/articles/2010/04/29/haworth-achieves-leednc-
gold-status-using-carbon-credits.aspx
Evans, Tony (2010a). Humidification Strategies for Data Centers and Network Rooms.
Schneider Electric. http://www.apcmedia.com/salestools/NRAN-5TV85S_R2_EN.pdf
Evans, Tony (2010b). The Different Types of Air Conditioning Equipment for IT Environments.
Schneider Electric. http://www.apcmedia.com/salestools/VAVR-5UDTU5_R1_EN.pdf
Evans, Tony (2011). Explanation of Cooling and Air Conditioning Terminology for IT
Professionals. Schneider Electric. http://www.apcmedia.com/salestools/TEVS-
5TXPED_R3_EN.pdf
Fannie Mae (2010). "Nation's First LEED-Certified Data Center Saves $1.7 Million in Energy
Costs." April 2010.
http://www.fanniemae.com/newsreleases/2010/5002.jhtml
Data Center Energy Efficiency, Renewable Energy and Carbon Offset Investment Best Practices
© 2012 Patrick Costello and Roshni Rathi 98
Farrell, John 2011 . ―Distributed Solar Nears Grid Parity with Fair Electricity Pricing."
RenewableEnergyWorld.com. April 2011.
http://www.renewableenergyworld.com/rea/blog/post/2011/04/distributed-solar-nears-
grid-parity-for-some-values-of-parity
Federal Trade Commission (FTC) (2010a). Proposed Revisions to the Green Guides. October
2010. http://www.ftc.gov/os/fedreg/2010/october/101006greenguidesfrn.pdf
Filo, David (2009). "Serving up greener data centers." Yahoo! June 2009.
http://ycorpblog.com/2009/06/30/serving-up-greener-data-centers/
Frackelton, Jessica and Evan Lubofsky (2010). Phone conversation. Onset Computers.
December 2010.
FTC (2010b). Green Guides - Summary of Proposal. October 2010.
http://www.ftc.gov/os/2010/10/101006greenguidesproposal.pdf
Fuel Cells 2000 (2010). The Business Case for Fuel Cells - Why Top Companies are
Purchasing Fuel Cells Today. September 2010.
http://www.fuelcells.org/BusinessCaseforFuelCells.pdf
Fuel Cells 2000 (2011). Worldwide Stationary Fuel Cell Installation Database. Last updated
July 2011. http://www.fuelcells.org/db
Fuel Cells 2000 and U.S. DOE Hydrogen Program (2011). State Fuel Cell and Hydrogen
Database. Last updated July 2011.
FuelCell Energy (2011). DFC3000.
http://www.fuelcellenergy.com/files/FCE3000%20Product%20Design-lo-
rez%20FINAL.pdf
Gillenwater, Michael, Derik Broekhoff, Mark Trexler, Jasmine Hyman and Rob Fowler (2007).
Policing the Voluntary Carbon Market. Nature Reports Climate Change, Vol. 6.
November 2007. http://www.nature.com/climate/2007/0711/pdf/climate.2007.58.pdf
Google (2011a). What is Google App Engine? Accessed June 2011.
http://code.google.com/appengine/docs/whatisgoogleappengine.html
Google (2011b). Google Apps for Business. Accessed June 2011.
http://www.google.com/apps/intl/en/business/index.html
Data Center Energy Efficiency, Renewable Energy and Carbon Offset Investment Best Practices
© 2012 Patrick Costello and Roshni Rathi 99
Green-e (2011b). Frequently Asked Questions: What is the difference between a broker and a
REC marketer? Accessed March 2011.
http://www.green-e.org/learn_re_faq.shtml#q21
Green-e (2011c). Generators that Have Submitted Tracking Attestations. Accessed June 2011.
http://www.green-e.org/tracking_attests_recd.html
Green-e (2011d). Green-e Dictionary. Accessed May 2011. http://www.green-
e.org/learn_dictionary.shtml
GreenerComputing (2009). "ACT Lands First LEED-Platinum Rating for Data Center in U.S."
August 2009. http://www.greenbiz.com/news/2009/08/12/act-lands-first-leed-platinum-
rating-data-center-us
Greenpeace (2010a). "Facebook Responds to Greenpeace Demands." September 2010.
http://www.greenpeace.org/international/en/news/Blogs/Cool-IT/facebook-responds-to-
greenpeace-demands/blog/26341
Greenpeace 2010b . ―Executive Director of Greenpeace to CEO of Facebook: Unfriend Coal!‖
September 2010. http://www.greenpeace.org/international/en/news/Blogs/Cool-
IT/executive-director-of-greenpeace-to-ceo-of-fa/blog/26324
Gronewold, Nathanial (2011). Markets: World Bank and Exchanges Work to Keep CDM Trades
Going After 2012 Deadline. Climatewire - The Politics and Business of Climate Change.
March 2011.
http://siteresources.worldbank.org/INTCARBONFINANCE/Resources/MARKETS_Wo
rld_Bank_and_exchanges_work_to_keep_CDM_trades_going.pdf
Hamilton, James (2009). "Data Center Efficiency Best Practices." Amazon Web Services. Data
Center Efficiency Summit. April 2009.
http://www.google.com/corporate/datacenter/events/dc-summit-2009.html
Han, Taewon, Arman Shehabi, Henry Coles, William Tschudi, Ashok Gadgil and Jeff Stein
(2010). Should Data Center Owners be Afraid of Air-side Economizer Use? – A Review
of ASHRAE TC 9.9 White Paper titled Gaseous and Particulate Contamination
Guidelines for Data Centers. Lawrence Berkeley National Laboratory. September 2010.
http://hightech.lbl.gov/documents/data_centers/review-ashrae-tc9-9.pdf
Harding, Copper (2008). "We take a closer look at Intel's 'green' power." The Inquirer. February
2008.
http://www.theinquirer.net/inquirer/news/1046428/closer-look-intel-green-power
Data Center Energy Efficiency, Renewable Energy and Carbon Offset Investment Best Practices
© 2012 Patrick Costello and Roshni Rathi 100
Herndon, Andrew (2011). "Google Invests $280 Million in SolarCity Project Finance Fund."
Bloomberg. June 2011. http://www.bloomberg.com/news/2011-06-14/google-invests-
280-million-in-solarcity-project-finance-fund.html
IBM (2010). "IBM's First LEED® Gold Certified Data Center." September 2010.
http://www.ibm.com/ibm/environment/news/rtp_ldc_leed_2010.shtml
ICF International (2007). ICF Tender No. 07-02 for Carbon Offsets. March 2007.
http://www.responsiblepurchasing.org/purchasing_guides/carbon_offsets/specs/ICFCarb
onTender07-02.doc
ICF International (2009). Opportunities for Combined Heat and Power in Data Centers.
Prepared for Oak Ridge National Laboratory (ORNL), Subcontract Number:
4000021512. March, 2009.
http://www1.eere.energy.gov/industry/datacenters/pdfs/chp_data_centers.pdf
ICF International (2011). Combined Heat and Power Installation Database. U.S. DOE and
ORNL. May 2010.
http://www.eea-inc.com/chpdata/index.html
ICIS Heren (2010). "Change in DOE liability would push up CER price." October 2010.
http://www.icis.com/heren/articles/2010/10/08/9400014/change-in-doe-liability-would-
push-up-cer-price.html
Intel (2007). Turning Challenges into Opportunities in the Data Center.
http://www.intel.com/technology/eep/data-center-efficiency/dcwhpaper.pdf
Intel (2011). Data Center Efficiency. Accessed May 2011.
http://www.intel.com/technology/eep/data-center-efficiency/
Jenkins, Jesse 2010 . ―Doing The Math On Bloom Energy.‖ Forbes. February 2010.
http://www.forbes.com/2010/02/25/fuel-cell-costs-technology-ecotech-bloom-
energy.html
Kaplam, James M., William Forrest and Noah Kindler (2008). Revolutionizing Data Center
Efficiency. McKinsey and Company. July 2008.
http://www.mckinsey.com/clientservice/bto/pointofview/pdf/Revolutionizing_Data_Cen
ter_Efficiency.pdf

Data Center Energy Efficiency, Renewable Energy and Carbon Offset Investment Best Practices
© 2012 Patrick Costello and Roshni Rathi 101
Kollmuss, Anja, Michael Lazarus, Carrie Lee, Maurice LeFranc and Clifford Polycarp (2010).
Handbook of Carbon Offset Programs – Trading Systems, Funds, Protocols and
Standards. Stockholm Environment Institute. April 2010.
http://www.earthscan.co.uk/?tabid=101804
Korn, David (2010). Phone Conversation. The Cadmus Group. December 2010.
Kwartin, Robert, A. Wolfrum, K. Granfield, A. Kagel and A. Appleton (2008). An Analysis of
the Technical and Econonomic Potential for Mid-Scale Distributed Wind. National
Renewable Energy Laboratory. NREL/SR-500-44280. December 2008.
http://www.nrel.gov/wind/pdfs/midscale_analysis.pdf
Lawrence Berkeley National Laboratory (LBNL) (2006). Measuring and Managing Data-
Center Energy Use. HPAC Engineering. March 2006.
http://hightech.lbl.gov/Documents/DATA_CENTERS/HPAC_DC_BestPrac.pdf
LBNL (2011). Tools. Accessed May 2011. http://hightech.lbl.gov/DCTraining/tools.html
Lazard (2009). Levelized Cost of Energy Analysis – Version 3.0. June 2009.
http://efile.mpsc.state.mi.us/efile/docs/15996/0145.pdf
Lazard (2010). Meeting the Energy Challenges of the Future - A Guide for Policymakers.
National Conference of State Legislatures. The Forum for America's Ideas. July 2010.
http://www.ncsl.org/documents/energy/FutureEnergyChallenges0710.pdf
McDonald, Kevin T. (2011). Phone conversation. Senior Infrastructure and Cloud Strategist,
ICF International. May 2011.
Meier, Peter (2011). Renewable Energy in Developing Countries: Meaningful GHG Emissions
Reductions or Just Another Con? Presentation at the Johns Hopkins School of Advanced
International Studies. March 2011.
http://calendar.jhu.edu/calendar/EventList.aspx?view=EventDetails&eventidn=51448&i
nformation_id=111361&type=
Mell, Peter and Tim Grance (2011). The NIST Definition of Cloud Computing (Draft). National
Institute of Standards and Technology, U.S. Department of Commerce. Special
Publication 800-145. January 2011. http://csrc.nist.gov/publications/drafts/800-
145/Draft-SP-800-145_cloud-definition.pdf
Michigan Academic Computing Center (2011). Vital Statistics. Accessed March 2011.
http://macc.umich.edu/about/vital-statistics.php
Data Center Energy Efficiency, Renewable Energy and Carbon Offset Investment Best Practices
© 2012 Patrick Costello and Roshni Rathi 102
Microsoft, Accenture and WSP Environment and Energy (2010). Cloud Computing and
Sustainability: The Environmental Benefits of Moving to the Cloud. November 2010.
http://www.accenture.com/us-en/Pages/insight-environmental-benefits-moving-
cloud.aspx
Miller, Colleen 2010 . ―Wind-Powered Data Centers." Data Center Knowledge. July 2010.
http://www.datacenterknowledge.com/wind-powered-data-centers/
Miller, Rich (2008). "Google Files Patent on UPS Architecture." Data Center Knowledge.
February 2008. http://www.datacenterknowledge.com/archives/2008/02/15/google-files-
patent-on-ups-architecture/
Miller, Rich (2009a). "Prairie Bunkers Pursues Geothermal Cooling." Data Center Knowledge.
August 2009. http://www.datacenterknowledge.com/archives/2009/08/25/prairie-
bunkers-pursues-geothermal-cooling/
Miller, Rich (2009b). "TierPoint Plans Geothermal Data Center." Data Center Knowledge.
August 2010. http://www.datacenterknowledge.com/archives/2010/08/25/tierpoint-
plans-geothermal-data-center/
Miller, Rich 2009c . ―Efficient UPS Aids Google‘s Extreme PUE." Data Center Knowledge.
April, 2009. http://www.datacenterknowledge.com/archives/2009/04/01/efficient-ups-
aids-googles-extreme-pue/
Miller, Rich 2009d . ―HVAC Group Says Data Centers Can be Warmer.‖ Data Center
Knowledge. January 2009.
http://www.datacenterknowledge.com/archives/2009/01/29/hvac-group-says-data-
centers-can-be-warmer/
Miller, Rich 2010a . ―Google Energy Buys Up Iowa Wind Power." Data Center Knowledge.
July 2010. http://www.datacenterknowledge.com/archives/2010/07/20/google-energy-
buys-up-iowa-wind-power/
Miller, Rich 2010b . ―Greenpeace‘s Hosting: Not ‗Truly Green‘." Data Center Knowledge.
March 2010. http://www.datacenterknowledge.com/archives/2010/03/03/greenpeaces-
hosting-not-truly-green/
Miller, Rich 2011 . ―Solar Power in Data Centers: No Longer A Novelty?‖ Data Center
Knowledge. April 2011.
http://www.datacenterknowledge.com/archives/2011/04/29/solar-in-data-centers-no-
longer-a-novelty/
Data Center Energy Efficiency, Renewable Energy and Carbon Offset Investment Best Practices
© 2012 Patrick Costello and Roshni Rathi 103
Minas, Lauri and Brad Ellison 2009 . ―The Problem of Power Consumption in Servers‖. Intel
Corporation. Dr.Dobb's. March 2009. http://www.drdobbs.com/215800830
Minnesota Department of Commerce, Office of Energy Security (2010). Assessing the
Feasibility of Third Party Owned Solar Photovoltaic Installations in Minnesota Schools.
A Report to the Legislature Prepared by the Minnesota Department of Commerce Office
of Energy Security as required by Minnesota Laws 2009, Chapter 37, Section 12.
December 2010.
http://www.state.mn.us/mn/externalDocs/Commerce/Feasibility_of_Solar_Photovoltaic_
Installations_in_Minnesota_Schoo_122010014226_SolarPVMNSchools.pdf
Nathans, Aaron and Chad Livengood 2011 . ―Delaware Senate panel passes bill to reclassify
fuel cells - Some question use of fossil fuels to feed 'Bloom Boxes'.‖ Delaware Online.
June 2011.
http://www.delawareonline.com/article/20110616/BUSINESS/106160336/Delaware-
Senate-panel-passes-bill-reclassify-fuel-cells
National Association of Attorneys General (1999). Environmental Marketing Guidelines for
Electricity. Environmental Marketing Subcommittee of the Energy Deregulation
Working Group. December 1999.
http://apps3.eere.energy.gov/greenpower/markets/pdfs/naag_0100.pdf
National Renewable Energy Laboratory (NREL) (2010). Energy Technology Cost and
Performance Data - Supporting Data for Energy Technology Costs. July 2010.
http://www.nrel.gov/analysis/docs/re_costs_20100618.xls
NREL (2011a). Open PV State Rankings. Accessed February 2011.
http://openpv.nrel.gov/rankings
NREL (2011b). OpenEnergyInfo.org Home Page. Accessed March 2011.
www.OpenEI.org
NREL (2011c). PV Installations in US: 2000 to Present. The Open PV Project. Accessed March
2011.
http://openpv.nrel.gov/time-mapper
NREL (2011d). PVWatts™ Grid Data Calculator Version 2 . Accessed March 2011.
http://www.nrel.gov/rredc/pvwatts/grid.html
NREL 2011e . PVWatts™ Site Specific Data Calculator Version 1 . Accessed March 2011.
http://www.nrel.gov/rredc/pvwatts/site_specific.html

Data Center Energy Efficiency, Renewable Energy and Carbon Offset Investment Best Practices
© 2012 Patrick Costello and Roshni Rathi 104
NREL (2011f). Simple Cost of Energy Calculator. Accessed March 2011.
http://www.nrel.gov/analysis/tech_lcoe.html
NREL (2011g). System Advisor Model (SAM). Last updated June 2011.
https://www.nrel.gov/analysis/sam/
NREL (2011h). The Open PV Project. Accessed August 2011. http://openpv.nrel.gov/index
NativeEnergy (2011). Frequently Asked Questions: What's the difference between a REC and a
Carbon Offset? Accessed March 2011.
http://www.nativeenergy.com/pages/faq_s/15.php#4
Neudorfer, Julius 2010 . ―Uptime, TIA and BICSI: Who runs the data center design standards
show?‖ SearchDataCenter.com. September 2010.
http://searchdatacenter.techtarget.com/tip/Uptime-TIA-and-BICSI-Who-runs-the-data-
center-design-standards-
show?ShortReg=1&mboxConv=searchDataCenter_RegActivate_Submit&
Newsweek (2011). "Green Rankings: U.S. Companies." October 2011.
http://www.thedailybeast.com/topics/green-rankings.html
Niemann, John, Kevin Brown and Victor Avelar (2010). Hot Aisle vs. Cold Aisle Containment.
Schneider Electric. http://www.apcmedia.com/salestools/DBOY-7EDLE8_R1_EN.pdf
Nike (2010). Corporate Responsibility Report FY07-09. February 2010.
http://www.nikebiz.com/crreport/content/pdf/documents/en-US/full-report.pdf
Northern Power (2011). Northern Power 100 Installed Base. Accessed March 2011.
http://northernpower.com/pdf/northwind100-install-base.pdf
Offset Quality Initiative (2008). Ensuring Offset Quality. July 2008.
http://www.pewclimate.org/docUploads/OQI-Ensuring-Offset-Quality-white-paper.pdf
Pacific Gas and Electric Company (2006). High Performance Data Centers - A Design
Guidelines Sourcebook. January 2006.
http://hightech.lbl.gov/documents/DATA_CENTERS/06_DataCenters-PGE.pdf
Parker, James, Hugh Lindsay, Bill Brown and Square D Critical Power Competency Center
(2007). Tackling Today’s Data Center Efficiency Challenges – A Software Oriented
Approach. http://www2.schneider-electric.com/documents/support/white-
papers/Tackling-Todays-Data-Center-Energy-Efficiency-Challenges.pdf

Data Center Energy Efficiency, Renewable Energy and Carbon Offset Investment Best Practices
© 2012 Patrick Costello and Roshni Rathi 105
Patrizio, Andy (2010). ―AMD Unveils Pricing, Performance for Opteron 6000 Series.‖
Hardware Central. March 2010.
http://www.hardwarecentral.com/news/article.php/3873336/AMD-Unveils-Pricing-
Performance-for-Opteron-6000-Series
PJM Environmental Information Services (2011). Bulletin Board Purchase Requests.
Generation Attribute Tracking System (GATS). Accessed May 2011.
https://gats.pjm-
eis.com/myModule/rpt/myrpt.asp?r=204&TabName=Bulletin+Board+Purchase+Reques
ts
PowerAssure (2010a). Dynamic Power Management. Accessed May 2011.
http://www.powerassure.com/products/dynamic-power-management-software
PowerAssure (2010b). Dynamic Power Optimization. Accessed March 2011.
http://www.powerassure.com/products/dynamic-power-optimization-software
PTS Data Center Solutions (2011). Computer Room Air Conditioning Specialists.
http://www.ptsdcs.com/comproomaircond.asp
Quilter, James (2010). "Google Makes $38m Move into Wind Energy." Windpower Monthly.
May 2010. http://www.windpowermonthly.com/news/1000689/Google-makes-38m-
move-wind-energ
Raritan (2009). Measuring Power in Your Data Center. Uptime Institute Research Underwriter
White Paper. April 2009.
http://www.cnetdirectintl.com/direct/au/2009/raritan/power_book/downloads/Uptime.pd
f
Rasmussen, Neil (2007). Electrical Efficiency Modeling for Data Centers. Schneider Electric.
http://www.apcmedia.com/salestools/NRAN-72754V_R0_EN.pdf
Rasmussen, Neil (2010a). Alternative Power Generation Technologies for Data Centers and
Network Rooms. Schneider Electric. http://www.apcmedia.com/salestools/SADE-
5TNRLJ_R2_EN.pdf
Rasmussen, Neil (2010b). Cooling Solutions for Rack Equipment with Side-to-Side Airflow.
Schneider Electric. http://www.apcmedia.com/salestools/SADE-5TNRKJ_R1_EN.pdf
Rasmussen, Neil (2011a). Avoidable Mistakes that Compromise Cooling Performance.
Schneider Electric. http://www.apcmedia.com/salestools/SADE-5TNRKG_R2_EN.pdf
Data Center Energy Efficiency, Renewable Energy and Carbon Offset Investment Best Practices
© 2012 Patrick Costello and Roshni Rathi 106
Rasmussen, Neil (2011b). Improving Rack Cooling Performance Using Airflow ManagementTM
Blanking Panels. Schneider Electric. http://www.apcmedia.com/salestools/SADE-
5TPLKQ_R4_EN.pdf
Renewable Energy World Magazine (2010). "Google Invests in 6 GW Offshore Wind Farm."
October 2010. http://www.renewableenergyworld.com/rea/news/article/2010/10/google-
invests-in-6-gw-offshore-wind-farm
Richard, Michael Graham (2011). "Google Invests $168 Million in 392MW Mojave Desert
Solar Thermal Plant." TreeHugger. April 2011.
http://www.treehugger.com/files/2011/04/google-invests-168m-mojave-desert-solar-
thermal-power-plant.php
Rocky Mountain Institute (2010). Achieving Low-Cost Solar PV: Industry Workshop
Recommendations for Near-Term Balance of System Cost Reductions. September 2010.
http://www.rmi.org/Content/Files/BOSExecSummary.pdf
Rusli, Evelyn 2010 . "Facebook Claims It‘s All Green Now, Touts Auto-Flush Toilets."
TechCrunch. November 2010. http://techcrunch.com/2010/11/04/facebook-claims-its-
all-green-now-touts-auto-flush-toilets/
Ryan, Alice (2009). "Carbon offsets at Google." Google. December 2009.
http://googleblog.blogspot.com/2009/12/carbon-offsets-at-google.html
Schneider Electric (2011). APC Trade Off Tools. Accessed May 2011.
http://www.apc.com/prod_docs/results.cfm?DocType=Trade-
Off%20Tool&Query_Type=10
Sedore, Christopher M. (2010). Greening the Data Center: A Case Study Based on Syracuse
University's Green Data Center (GDC). June 2010.
http://www.nytechsummit.com/presentations/sedore_ny_tech_summit_presentation_Jun
e_2010.pdf
Shehabi, Arman, William Tschudi and Ashok Gadgil (2007). Data Center Economizer
Contamination and Humidity Study. Lawrence Berkeley National Laboratory. Pacific
Gas and Electric Company Emerging Technologies Program Application Assessment
Report. March 2007.
http://hightech.lbl.gov/documents/data_centers/economizerdemoreport-3-13.pdf
Skraby, Matthew (2010a). "Top 10 LEED Certified Data Centers: Part 1." Global Strategic
Management Institute. November 2010.
http://blog.gsmiweb.com/2010/11/top-10-leed-certified-data-centers-part-1/
Data Center Energy Efficiency, Renewable Energy and Carbon Offset Investment Best Practices
© 2012 Patrick Costello and Roshni Rathi 107
Skraby, Matthew (2010b). "Top Ten Tuesday: LEED Data Centers Part II." Global Strategic
Management Institute. December 2010.
http://blog.gsmiweb.com/2010/12/top-ten-tueday-leed-data-centers-part-ii/
Solarbuzz (2011). Going Solar - Understanding Solar Energy Systems - Technologies. Accessed
May 2011. http://www.solarbuzz.com/going-solar/understanding/technologies
SolarByTheWatt.com 2009 . ―Physical Area Efficiency of Solar Photovoltaic Panels, or Watt
Per Square Foot." April 2009. http://solarbythewatt.com/2009/04/19/physical-area-
efficiency-of-solar-photovoltaic-panels-or-watt-per-square-foot/
Sorell, Vali 2009 . ―Air flow management strategies for efficient data center cooling.‖
SearchDataCenter.com. March 2009. http://searchdatacenter.techtarget.com/tip/Air-
flow-management-strategies-for-efficient-data-center-cooling
SREC Trade (2011). SREC Market Prices. Accessed May 2011.
http://www.srectrade.com/srec_prices.php
Stack, Fred, Vikram Mehta, Arie Brish, Carrie Higbie, and Steve Campbell 2010 . ―At the
Sharp End.‖ Business Management, Issue 10, Data Management. July 2010.
http://www.busmanagement.com/article/At-the-sharp-end/
State of Delaware 2011a . ―Delaware Attracting Bloom Energy for High-Tech Manufacturing
Hub - Company to employ 900 at former Chrysler site." June 2011.
http://governor.delaware.gov/news/2011/1106june/20110609-bloom_energy.shtml
State of Delaware (2011b). Senate Bill # 124 w/SA 1: An Act to Amend Title 26 of the Delaware
Code Relating to Delaware's Renewable Energy Portfolio Standards and Delaware-
Manufactured Fuel Cells. 146th General Assembly. June 2011.
http://legis.delaware.gov/LIS/LIS146.nsf/847c3a968a0768b0882569a5004f37cb/b8aec0
e2053460a4852578af00590fa3?OpenDocument
Sterling Planet (2009). Energy Efficiency. Accessed May 2011.
http://www.sterlingplanet.com/page/energy-efficiency/
Synergy Global Technology (2011). Image of Blade Server. Accessed May 2011.
www.RackmountMart.com; http://www.rackmountmart.com/rm8u/rm8003.htm
The Climate Group (2008). SMART 2020: Enabling the low carbon economy in the information
age. Global eSustainability Initiative. June 2008.
http://www.smart2020.org/_assets/files/03_Smart2020Report_lo_res.pdf
Data Center Energy Efficiency, Renewable Energy and Carbon Offset Investment Best Practices
© 2012 Patrick Costello and Roshni Rathi 108
The Climate Registry (2010). Climate Registered Leadership Program - Draft Accounting and
Reporting Requirements. August 2010.
http://www.theclimateregistry.org/downloads/2010/08/Draft-Climate-Registered-
Leadership-Program-Reporting-Requirements.pdf
The Connecticut Center for Advanced Technology, Inc. (2010). Connecticut Hydrogen Fuel
Cell Industry – Status and Direction 2010 and 2011. September 2010.
http://www.chfcc.org/Publications/reports/PRELIMINARY%20STATUS%20AND%20
DIRECTION%20FC%202010%209-20-2010.pdf
The Green Grid (2010). Carbon Usage Effectiveness (CUE): A Green Grid Data Center
Sustainability Metric.
http://www.thegreengrid.org/~/media/WhitePapers/CarbonUsageEffectivenessWhitePap
er20101202.ashx?lang=en
The Green Grid (2011). Metrics and Measurement Tool - PUE Reporting. Accessed March
2011.
http://www.thegreengrid.org/sitecore/content/Global/Content/Tools/PUEReporting.aspx
The McGraw-Hill Companies 2011 . ―McGraw-Hill and NJR Clean Energy Ventures
Announce Largest Solar Energy Site of its Kind in the Western Hemisphere." June 2011.
http://investor.mcgraw-hill.com/phoenix.zhtml?c=96562&p=irol-
newsArticle_Print&ID=1573196&highlight=
Trowbridge, Dave (2010). ―Green Data Center Best Practices from Deutsche Bank." Cisco.
May 2010. http://newsroom.cisco.com/feature-
content?type=webcontent&articleId=5498820
Turner, Mary 2010 . ―CA Technologies Launches New Virtualization Management Portfolio.‖
IDC Link. May 2010.
http://www.ca.com/~/media/Files/IndustryAnalystReports/catechlaunchnew_236999.pdf
Turner, W. Pitt IV, John H. Seader, and Kenneth G. Brill (2005). Industry Standard Tier
Classifications Define Site Infrastructure Performance. The Uptime Institute.
http://www.dntp.com/news/pdfs/Data%20Center%20Tier_Classification.pdf
U.S. Department of Energy (DOE) (2010a). State-Specific Utility Green Pricing Programs.
Green Power Markets. Energy Efficiency and Renewable Energy. Last updated August
2010. http://apps3.eere.energy.gov/greenpower/markets/pricing.shtml?page=1
Data Center Energy Efficiency, Renewable Energy and Carbon Offset Investment Best Practices
© 2012 Patrick Costello and Roshni Rathi 109
U.S. DOE (2010b). National Retail REC Products. Energy Efficiency and Renewable Energy,
Green Power Markets. Last updated August 2010.
http://apps3.eere.energy.gov/greenpower/buying/buying_power.shtml?state=VA&print
U.S. DOE (2011a). Renewable Energy Certificates (RECs) - REC Marketers. The Green Power
Network. Last updated December 2010.
http://apps3.eere.energy.gov/greenpower/markets/certificates.shtml?page=2
U.S. DOE (2011b). Saving Energy in Data Centers - Software. Last updated in February 2011.
http://www1.eere.energy.gov/industry/datacenters/software.html
U.S. DOE Save Energy Now and Federal Energy Management Programs, U.S. EPA‘s
ENERGY STAR Program, European Commission Joint Research Center Data Centers
Code of Conduct, Japan‘s Ministry of Economy, Trade and Industry, Japan‘s Green IT
Promotion Council and The Green Grid (2011a). Harmonizing Global Metrics for Data
Center Energy Efficiency. February 2011.
http://www.thegreengrid.org/~/media/WhitePapers/HarmonizingGlobalMetricsforDataC
enterEnergyEfficiency2011-02-28.ashx?lang=en
U.S. DOE, Interstate Renewable Energy Council and North Carolina Solar Center (2011b).
DSIRE, Map: Net Metering. June 2011.
http://dsireusa.org/documents/summarymaps/net_metering_map.pdf
U.S. DOE, Interstate Renewable Energy Council and North Carolina Solar Center (2011c).
Database of State Incentives for Renewables & Efficiency (DSIRE), Home Page.
Accessed March 2011.
www.dsireusa.org
U.S. DOE, Interstate Renewable Energy Council and North Carolina Solar Center (2011d).
DSIRE, California Incentives/Policies for Renewables and Efficiency - Self-Generation
Incentive Program. Last updated March 2011.
http://www.dsireusa.org/incentives/incentive.cfm?Incentive_Code=CA23F&re=1&ee=1
U.S. DOE, Interstate Renewable Energy Council and North Carolina Solar Center (2011e).
DSIRE, Rules, Regulations & Policies for Renewable Energy. Accessed March 2011.
http://www.dsireusa.org/summarytables/rrpre.cfm
U.S. Energy Information Administration (EIA) (2010a). 2011 Annual Energy Outlook. Table 2.
November 2010. http://tonto.eia.doe.gov/oiaf/beck_plantcosts/excel/table2.xls
U.S. EIA (2010b). Annual Energy Review. Table 8.10: Average Retail Prices of Electricity,
1960-2009. August 2010. http://www.eia.gov/emeu/aer/txt/stb0810.xls
Data Center Energy Efficiency, Renewable Energy and Carbon Offset Investment Best Practices
© 2012 Patrick Costello and Roshni Rathi 110
U.S. EIA (2011). North American Electric Reliability Corporation (NERC) Regions. Accessed
March 2011.
http://www.eia.doe.gov/cneaf/electricity/chg_str_fuel/html/fig02.html
U.S. Environmental Protection Agency (EPA) (2007a). Air Emissions. Last updated December
2007.
http://www.epa.gov/cleanenergy/energy-and-you/affect/air-emissions.html
U.S. EPA (2007b). Report to Congress on Server and Data Center Energy Efficiency Public
Law 109-431. ENERGY STAR. August 2007.
U.S. EPA (2008). Combined Heat and Power: Energy Savings and Energy Reliability for Data
Centers. Combined Heat and Power (CHP) Partnership. October 2008.
http://www.epa.gov/chp/documents/datacenter_fs.pdf
U.S. EPA (2010a). eGrid Subregion Map. eGrid2010 Version 1.0. December 2010.
http://www.epa.gov/cleanenergy/documents/egridzips/eGRID2010_eGRID_subregions.j
pg
U.S. EPA (2010b). Environmental Value of Purchasing RECs. Last updated December 2010.
http://www.epa.gov/greenpower/rec.htm
U.S. EPA (2010c). Energy Savings from ENERGY STAR-Qualified Servers. ENERGY STAR.
August 2010.
http://www.energystar.gov/ia/products/downloads/ES_server_case_study.pdf
U.S. EPA (2011a). Greenhouse Gas Equivalencies Calculator. Last updated June 2011.
http://www.epa.gov/cleanenergy/energy-resources/calculator.html
U.S. EPA (2011b). eGRID2010 Version 1.1. May 2011.
http://www.epa.gov/cleanenergy/energy-resources/egrid/index.html
U.S. EPA (2011c). Efficiency Benefits. CHP Partnership. Last updated February 2011.
http://www.epa.gov/chp/basic/efficiency.html
U.S. EPA (2011d). Funding Resources. CHP PartnershipAccessed March 2011.
http://www.epa.gov/chp/funding/regulatory.html
U.S. EPA (2011e). Home Page. CHP Partnership. Accessed March 2011.
www.epa.gov/chp
Data Center Energy Efficiency, Renewable Energy and Carbon Offset Investment Best Practices
© 2012 Patrick Costello and Roshni Rathi 111
U.S. EPA (2011f). CHP Partnership. Public Recognition. Accessed March 2011.
http://www.epa.gov/chp/public-recognition/
U.S. EPA (2011g). Renewable Portfolio Standards Fact Sheet - Figure 3: Eligible Technologies
Under State RPS Requirements. CHP Partnership. Accessed March 2011.
http://www.epa.gov/chp/state-policy/renewable_fs.html#tn2
U.S. EPA (2011h). Apply for the ENERGY STAR for Your Buildings. ENERGY STAR.
Accessed March 2011.
http://www.energystar.gov/index.cfm?c=evaluate_performance.bus_portfoliomanager_i
ntro
U.S. EPA (2011i). ENERGY STAR Certified Buildings and Plants. ENERGY STAR. Accessed
March 2011.
http://www.energystar.gov/index.cfm?fuseaction=labeled_buildings.locator
U.S. EPA (2011j). ENERGY STAR Data Center Energy Efficiency Initiatives. ENERGY
STAR. Accessed May 2011.
http://www.energystar.gov/index.cfm?c=prod_development.server_efficiency
U.S. EPA (2011k). Purchasing More Energy-Efficient Servers, UPSs, PDUs. ENERGY STAR.
Accessed May 2011.
http://www.energystar.gov/index.cfm?c=power_mgt.datacenter_efficiency_purchasing
U.S. EPA (2011l). The ENERGY STAR Challenge. ENERGY STAR. Accessed March 2011.
http://www.energystar.gov/index.cfm?c=challenge.bus_challenge
U.S. EPA (2011m). Green Power Equivalency Calculator. Green Power Partnership. Accessed
June 2011. http://www.epa.gov/greenpower/pubs/calculator.htm
U.S. EPA (2011n). Green Power Leadership Awards - 2010 Award Winers. Green Power
Partnership. June 2011. http://www.epa.gov/greenpower/awards/winners.htm
U.S. EPA (2011o). Green Power Locator. Green Power Partnership. June 2011.
http://www.epa.gov/greenpower/pubs/gplocator.htm
U.S. EPA (2011p). National Top 50. Green Power Partnership. Updated October 2011.
http://www.epa.gov/greenpower/toplists/top50.htm
U.S. EPA (2011q). Top Partner Rankings. Green Power Partnership. June 2011.
http://www.epa.gov/greenpower/toplists/index.htm
Data Center Energy Efficiency, Renewable Energy and Carbon Offset Investment Best Practices
© 2012 Patrick Costello and Roshni Rathi 112
U.S. Green Building Council (USGBC) (2011a). LEED 2009 for Existing Buildings Operations
and Maintenance. Updated May 2011.
http://www.usgbc.org/ShowFile.aspx?DocumentID=8876
UNEP Risoe (2011). Content of CDM/JI Pipeline: CDM projects by type - CDM projects
grouped in types. Updated June 2011. http://cdmpipeline.org/cdm-projects-type.htm
USGBC (2011b). LEED 2009 for New Construction and Major Renovations. Last updated May
2011. http://www.usgbc.org/ShowFile.aspx?DocumentID=8868
UTC Power (2011). PureCell Model 400: Performance. Accessed May 2011.
http://www.utcpower.com/products/purecell400
VMWare (2008). How VMWare Virtualization Right-sizes IT Infrastructure to Reduce Power
Consumption.
http://www.vmware.com/files/pdf/WhitePaper_ReducePowerConsumption.pdf
Voluntary Carbon Standard (2011). Frequently Asked Questions: Are US renewable energy
projects eligible under the VCS? Accessed July 2011.
http://www.v-c-s.org/faqs/are-us-renewable-energy-projects-eligible-under-vcs
Wesco Distribution (2011). Phone Conversation. Chris Crump, Southwest Region Solar
Manager for Wesco Distribution. December 2011.
Wirth, Bianca 2007 . ―How did Sun design their Eco Data Centre?‖ GreenITStrategy.com.
September 2007.
http://webcache.googleusercontent.com/search?q=cache:pGNFN_CyxOoJ:www.greenit
strategy.com/data-centre/9-how-did-sun-design-their-eco-data-
centre+How+did+Sun+design+their+Eco+Data+Centre&cd=2&hl=en&ct=clnk&gl=us
&client=firefox-a&source=www.google.com
Wood, Lisa (2008a). "The power of savings." Environmental Risk. Spring 2008.
http://www.nexant.com/cem/docs/Nexant_EE_EnvRisk_Spring_2008.pdf
Wood, Lisa 2008b . ―Profile of a White Tag Project‖. Alternative Energy Base. September
2008. http://www.alternativeenergybase.com/Article/Profile-of-a-White-Tag-
Project/1756
Woody, Todd (2011). "Google to Buy 100.8 Megawatts of Oklahoma Wind Energy." Grist.
April 2011. http://www.grist.org/wind-power/2011-04-22-google-to-buy-100.8-
megawatts-of-oklahoma-wind-energy
Data Center Energy Efficiency, Renewable Energy and Carbon Offset Investment Best Practices
© 2012 Patrick Costello and Roshni Rathi 113
WRI/WBCSD (2004). Greenhouse Gas Protocol: A Corporate Accounting and Reporting
Standard. Revised Edition. March 2004.
http://www.ghgprotocol.org/files/ghgp/public/ghg-protocol-revised.pdf
Wright Line (2009a). Chaos Cooling and Smart Sensing in your Data Center.
http://www.wrightline.com/news_and_events/media_webinars.html
Wright Line (2009b). Creating Data Center Efficiencies Using Closed-Loop Design. April
2009.
http://www.wrightline.com/images/WhitePapers/Scalable%20Design%20White%20Pap
er.pdf