Embed Size (px)
Citation preview
Data Center Projects: Growth Model
Revision 1
by Neil Rasmussen and Suzanne Niles
Introduction 2
The six parameters of the growth model
7
The value of stepped phase-in 10
Determining the system capacity plan
12
Role of the growth model in the system planning sequence
16
Use of the growth model in TCO calculations
20
Conclusion 24
Resources 26
Click on a section to jump to it Contents
White Paper 143
Long term data center or network room capacity planning may seem impossible in the face of evolving IT technology and business requirements. Nevertheless, data center facilities have a lifetime that may span many generations of IT equipment, so planning – or lack of planning – can have a large impact on the effectiveness of investments. Many unnecessary costs can be avoided with simple planning strategies, and even uncertainty itself can be incorporated into a plan. This paper shows a simple and effective way to develop a capacity plan for a data center or network room.
Executive summary>
white papers are now part of the Schneider Electric white paper libraryproduced by Schneider Electric’s Data Center Science Center [email protected]
Data Center Projects: Growth Model
Schneider Electric – Data Center Science Center White Paper 143 Rev 1 2
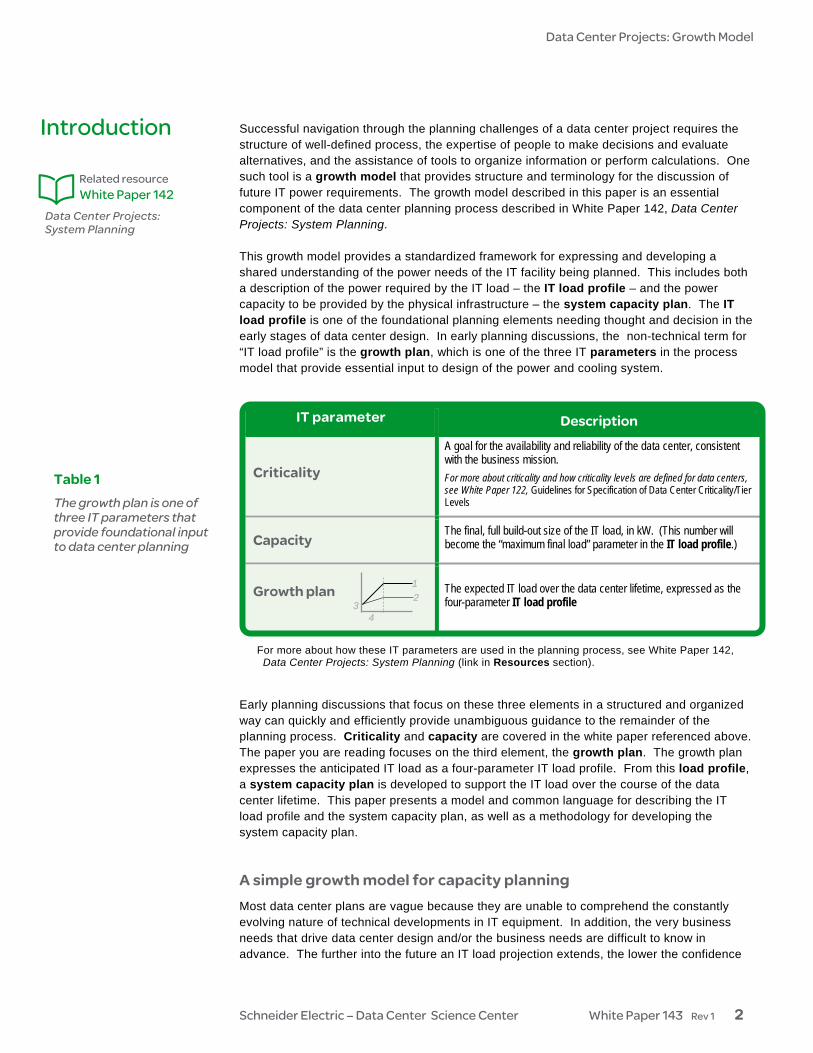
Successful navigation through the planning challenges of a data center project requires the structure of well-defined process, the expertise of people to make decisions and evaluate alternatives, and the assistance of tools to organize information or perform calculations. One such tool is a growth model that provides structure and terminology for the discussion of future IT power requirements. The growth model described in this paper is an essential component of the data center planning process described in White Paper 142, Data Center Projects: System Planning. This growth model provides a standardized framework for expressing and developing a shared understanding of the power needs of the IT facility being planned. This includes both a description of the power required by the IT load – the IT load profile – and the power capacity to be provided by the physical infrastructure – the system capacity plan. The IT load profile is one of the foundational planning elements needing thought and decision in the early stages of data center design. In early planning discussions, the non-technical term for “IT load profile” is the growth plan, which is one of the three IT parameters in the process model that provide essential input to design of the power and cooling system.
IT parameter Description
Criticality
A goal for the availability and reliability of the data center, consistent with the business mission. For more about criticality and how criticality levels are defined for data centers, see White Paper 122, Guidelines for Specification of Data Center Criticality/Tier Levels
Capacity The final, full build-out size of the IT load, in kW. (This number will become the “maximum final load” parameter in the IT load profile.)
Growth plan The expected IT load over the data center lifetime, expressed as the
four-parameter IT load profile
Early planning discussions that focus on these three elements in a structured and organized way can quickly and efficiently provide unambiguous guidance to the remainder of the planning process. Criticality and capacity are covered in the white paper referenced above. The paper you are reading focuses on the third element, the growth plan. The growth plan expresses the anticipated IT load as a four-parameter IT load profile. From this load profile, a system capacity plan is developed to support the IT load over the course of the data center lifetime. This paper presents a model and common language for describing the IT load profile and the system capacity plan, as well as a methodology for developing the system capacity plan. A simple growth model for capacity planning Most data center plans are vague because they are unable to comprehend the constantly evolving nature of technical developments in IT equipment. In addition, the very business needs that drive data center design and/or the business needs are difficult to know in advance. The further into the future an IT load projection extends, the lower the confidence
Introduction
Data Center Projects: System Planning
Related resource White Paper 142
12
34
Table 1 The growth plan is one of three IT parameters that provide foundational input to data center planning
For more about how these IT parameters are used in the planning process, see White Paper 142, Data Center Projects: System Planning (link in Resources section).

Data Center Projects: Growth Model
Schneider Electric – Data Center Science Center White Paper 143 Rev 1 3
in the projection. Any model of forward-looking capacity requirements needs information regarding the quality (certainty) of the projections. One approach to the problem of uncertainty is to bracket the projection by stating a maximum and minimum value that can be reasonably expected over the lifetime of the data center. This is the approach taken by the growth model described in this paper. The concept of minimum and maximum final load is shown in Figure 1. Data center lifetime is typically defined as ten years. Once the maximum and minimum load estimates are established, adding the INITIAL load and the RAMP-UP time completes the growth projection of the IT load (Figure 2). This much of the model, which describes the projected IT load over the data center lifetime, is determined very early in the planning process. The final element of the growth model is the system capacity plan, which is the planned deployment of the power and cooling infrastruc-ture to support the projected IT power load (Figure 3). The system capacity plan is deter-mined later in the planning process, after the details of the system architecture and the physical space become known.
MINIMUM final loadMINIMUM final load
Data center lifespan
MAXIMUM final loadMAXIMUM final load
Figure 1 Estimated MINIMUM final load and MAXIMUM final load model
MAXIMUM load
MINIMUM load
RAMPRAMP--UP UP timetime
Data center lifespan
INITIAL INITIAL loadload
Figure 2 INITIAL load and RAMP-UP time

Data Center Projects: Growth Model
Schneider Electric – Data Center Science Center White Paper 143 Rev 1 4
While this model may appear deceptively simple and self-explanatory, it is able to represent complex concepts that are often miscommunicated among the stakeholders in a data center project. The complete model can be described by six parameters, and is shown in Figure 4.
Parameters in this model The six parameters of this model describe the essential characteristics of data center growth and provide the language for a common understanding and discussion of planning issues. These six parameters are summarized in Table 2.
MAXIMUM load
MINIMUM load
RAMP-UP time
Data center lifespan
INITIAL load
System capacity plan
Figure 3 System capacity plan portion of growth model
MAXIMUMMAXIMUM final load
MINIMUMMINIMUM final load
Initial load
Ramp-up time
3
4
MINIMUMfinal load
5Step size
MAXIMUM final load1 2
Data center lifespan
System capacity plan
ACTUAL final load (unknown)
6 Margin
Figure 4 Complete growth model

Data Center Projects: Growth Model
Schneider Electric – Data Center Science Center White Paper 143 Rev 1 5
Growth model parameter Meaning
IT lo
ad p
rofil
e
1 MAXIMUM final load Maximum anticipated IT load
2 MINIMUM final load Minimum anticipated IT load
3 INITIAL load IT load of initial installation
4 Ramp-up time The time it takes to go from initial load to final load
Syst
em c
apac
ity
plan
5 Step size Incremental step size of the physical infrastructure system, if full buildout is deferred
6 Margin
Extra capacity to cover the unex-pected – either an unexpected addi-tion to the IT load or an unexpected drain on system capacity
Why not a single “predicted” actual load? The model shown in Figure 4 shows a maximum and minimum anticipated final load, but no explicit prediction of the actual final load. Any statement of actual final load is, in most cases, a guess. The actual final load of a particular installation will typically depend upon many variables, some of which may not be predictable – or even known to exist – by planners. A more useful planning method, the one embodied by this growth model, is to identify upper and lower limits of final load, which can usually be done with a higher degree of confidence and consensus than a single predicted load level. Users often come to the planning table with a firm idea of what to assume for the maximum load, because maximum possible load has historically been the “safe” value to use in designing complete upfront buildout of the system, and planners are accustomed to thinking in those terms. The additional requirement of a parameter representing the minimum anticipated load may at first appear superfluous, but it is the key to obtaining the significant cost benefits of this growth model, as will be described later. The identification of both a maximum and a minimum anticipated load adds intelligence to the model and enables a system capacity plan that comprehends growth uncertainty, providing a simple strategy for minimizing the risk of overbuilding and lowering the total cost of ownership. The distinction between “IT load profile” and “system capacity plan” This growth model provides a common language and framework for accommodating both the user’s understanding of IT load requirement and the physical infrastructure designer’s plan for a system with sufficient power and cooling capacity to support that load requirement. One follows the other. The first part of the growth model – the IT load profile – is provided by the user as input to the planning process. The second part of the growth model – the system capacity plan – is provided by the planning process as output to the user, defining the
Table 2 Parameters of the growth model
Data Center Projects: Growth Model
Schneider Electric – Data Center Science Center White Paper 143 Rev 1 6
deployment of power and cooling infrastructure (including phase-in steps) to support the user’s IT load profile. Therefore, for a particular project, the growth model is developed in two parts:
1. First, develop the IT load profile. The IT load profile, consisting of parameters 1-4 of the model, is created early in the planning process, based on an understanding of the organization’s business needs. In some cases, this may require consulting exper-tise from someone familiar with the organization’s business and general IT issues, or reference to standard profiles describing the IT growth parameters of similar organiza-tions. The key at this step is for the participants of the planning process to develop a shared view of the projected IT load.
2. Second, develop the system capacity plan to support the IT load profile. The system capacity plan is represented by parameters 5 and 6 of the growth model (step size and margin). Development of the system capacity plan is begun early in the planning sequence, with a rough estimate of step size that will guide the choice of reference design (discussed later in this paper). The system capacity plan is finalized later in the planning sequence, after the basic system architecture and the floor plan (row layout of the room) have been determined. The user will typically not have exper-tise in this area, and so will rely upon the equipment vendor or other qualified consult-ing services. Incremental phase-in steps provide the option to delay, adjust, or cancel full buildout based on actual conditions as they develop during the ramp-up time. The benefits of a stepped phase-in are discussed later in this paper in the section “The value of stepped phase-in”.
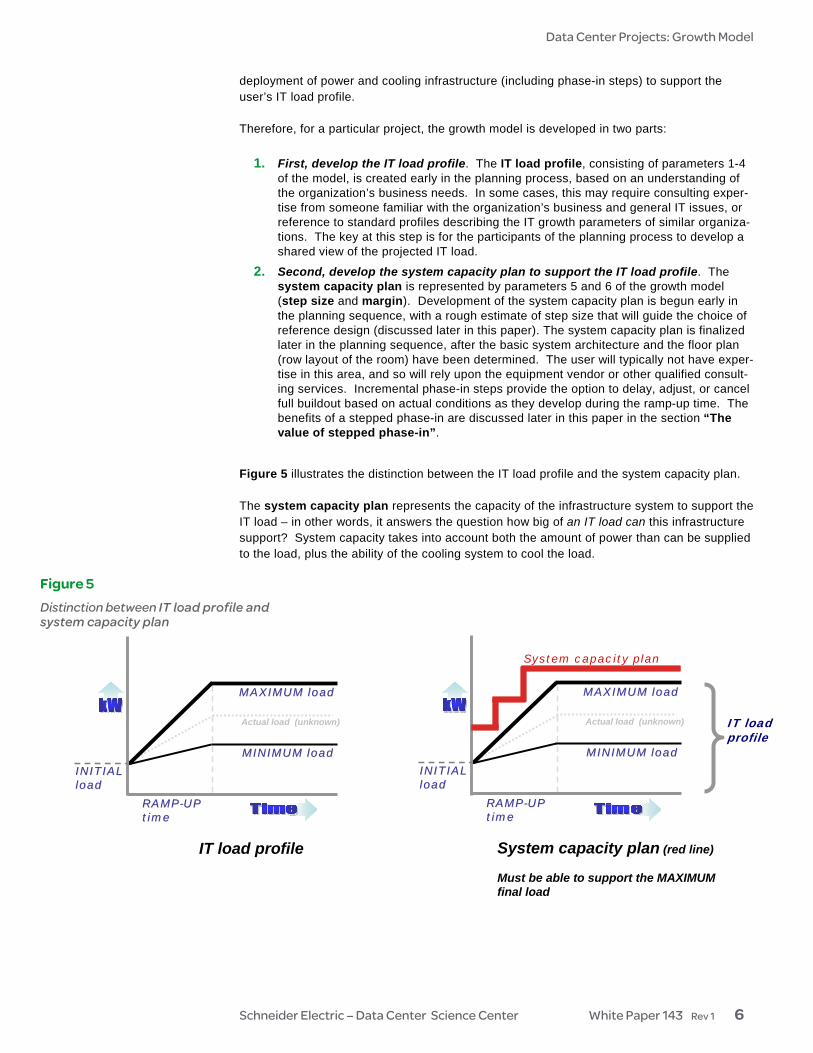
Figure 5 illustrates the distinction between the IT load profile and the system capacity plan. The system capacity plan represents the capacity of the infrastructure system to support the IT load – in other words, it answers the question how big of an IT load can this infrastructure support? System capacity takes into account both the amount of power than can be supplied to the load, plus the ability of the cooling system to cool the load.
IT load profile
IT load profile System capacity plan (red line) Must be able to support the MAXIMUM final load
MAXIMUM loadMAXIMUM load
MINIMUM loadMINIMUM load
INITIAL INITIAL loadload
Actual load (unknown)
RAMPRAMP--UP UP timetime
MAXIMUM loadMAXIMUM load
MINIMUM loadMINIMUM load
INITIAL INITIAL loadload
System capacity plan
Actual load (unknown)
RAMPRAMP--UP UP timetime
Figure 5 Distinction between IT load profile and system capacity plan

Data Center Projects: Growth Model
Schneider Electric – Data Center Science Center White Paper 143 Rev 1 7
What about cooling? The IT load profile is a growth projection for the project’s power requirement. The cooling requirement is implicit in this model because the power requirement directly drives the cooling requirement. Discussions of load and capacity are usually stated, as here, in terms of the power require-ment of the IT load. However, the actual capacity of the infrastructure to support a given IT power load depends not only upon the power it can supply to the load, but also upon the cooling it can provide to keep the load from overheating. The infrastructure’s capacity to support a given IT power load, therefore, is a whole-system ability that is a combination of the ability to power it and the ability to cool it. Fortunately for system designers, the power and cooling requirement are directly related – each watt of electrical power consumed by IT equipment is converted to one watt of heat (thermal power) that must be removed. Therefore, power and cooling requirements of the IT equipment are not only equal (within a fraction of a percent), but can be expressed in the same units – kilowatts. The IT cooling profile is the same as the IT load profile. Cooling system phase-in steps may differ from power system phase-in steps, depending upon the scalability of the equipment selected and the architecture of the system configura-tion. Parameters #1 and #2: MAXIMUM and MINIMUM final load The first step is to establish a projection of the IT power load. This is a best guess of the anticipated IT load during the lifetime of the installation. Since it can be difficult to under-stand or quantify the uncertainty of IT needs in the future, this growth model simplifies the discussion by requiring only a maximum final load and a minimum final load, both of which can usually be established with more confidence that a single target load. Figure 6 highlights these two parameters in the growth model. MAXIMUM final load – The highest load that can be reasonably anticipated, considering the business plan and whatever potential opportunities the user foresees. Some users may want to further “pad” this estimate to guard against the serious consequences of coming up against a hard limit on expansion with regard to non-scalable elements such as room size or electric-al service entrance (which will be sized to accommodate the MAXIMUM final load). Note that in most cases, this maximum will never be reached – historically, the vast majority of facilities end up far below their original maximum load projection. In this model, the phase-in plan (the ramp-up time and number of steps parameters) allows for slowing or stopping the buildout as the future becomes more clear, and uncertainty becomes certainty. (The functioning and benefits of a stepped phased-in are covered later in this paper in the section “The value of stepped phase-in”.)
> Cooling in kilowattsSometimes cooling requirements and air conditioner capacity are stated in units of “tons” or “BTUs per hour,” but these units obscure the simple and direct relationship between power consumed and heat that must be removed from the room. The use of kilowatts to measure cooling simplifies analysis and planning. Schneider Electric uses the international standard of kilowatts to express both the data center cooling requirement and the cooling capacity of air conditioning equipment. Cooling expressed in BTU/hr or tons can easily be converted to kilowatts in order to simplify planning. kW = BTU/hr x .000293 kW = tons x 3.52
The six parameters of the growth model

Data Center Projects: Growth Model
Schneider Electric – Data Center Science Center White Paper 143 Rev 1 8
MINIMUM final load – The lowest final load that can be reasonably anticipated, considering known business risks and potential market changes. This parameter will be used later to establish the initial capacity of the system and the phase-in plan (see later section, Determin-ing the system capacity plan). It also plays a major role in TCO (total cost of ownership) analysis, described later in this paper. Figure 6 illustrates the MAXIMUM final load and MINIMUM final load parameters. These two parameters provide significant intelligence to the design of the system capacity plan, affecting both the scalable and the non-scalable elements of the system, as described in the later section “Determining the system capacity plan”. Parameter #3: INITIAL load INITIAL load (Figure 7) is the IT load that must be supported at the time the system is initially installed. Since it directly relates to present business conditions, it is much easier to determine than the forward-looking minimum and maximum extremes of parameters #1 and #2. INITIAL load will typically be less than either MAXIMUM final load or MINIMUM final load, although in some cases it could be greater than MINIMUM final load, if there is a chance that the IT load will decrease.
Initial load
Ramp-up time
3
4
MINIMUMfinal load
MAXIMUM final load1 2
Data center lifespan
ACTUAL final load (unknown)Figure 6 MAXIMUM final load and MINIMUM final load parameters of growth model
INITIALload 3
4
MINIMUMfinal load
MAXIMUM final load1 2
Data center lifespan
ACTUAL final load (unknown)
RAMP-UPtime
Figure 7 INITIAL load parameter of growth model

Data Center Projects: Growth Model
Schneider Electric – Data Center Science Center White Paper 143 Rev 1 9
Parameter #4: ramp-up time Ramp-up time is the projected time between initial installation and final load. Parameter #5: step size STEP SIZE is an attribute of the system capacity plan, not of the IT load profile. It is deter-mined later in the planning sequence, taking into account the scalability of the selected system architecture (the reference design, described later), the floor plan (the row layout of the room), and an assessment of growth uncertainty and the potential TCO benefits of incremental deployment.
INITIALload
RAMP-UPtime
3
4
MINIMUMfinal load
MAXIMUM final load1 2
Data center lifespan
ACTUAL final load (unknown)
Figure 8 RAMP-UP time parameter of growth model
INITIALload 3
MINIMUMfinal load
MAXIMUM final load1 2
Data center lifespan
ACTUAL final load (unknown)
4 RAMP-UPtime
STEP SIZE
System capacity plan5MARGIN6
Figure 9 STEP SIZE parameter of growth model

Data Center Projects: Growth Model
Schneider Electric – Data Center Science Center White Paper 143 Rev 1 10
Parameter #6: margin The margin is the “extra” infrastructure capacity needed to cover unexpected changes – either an increase in the power demand of the IT load (for example, unauthorized addition of servers) or a decrease in the capacity provided by the power and cooling infrastructure (for example, a decrease in cooling caused by a clogged heat rejection pipe). “Stepped phase-in” refers to an incremental buildout strategy for the system capacity plan during ramp-up of the IT load. The principles behind stepped phase-in are simple and intuitive:
• Stepped phase-in allows power and cooling capaci-ty to grow with the IT load, avoiding the capital and operating expense (especially energy cost) of equipment that is not yet needed.
• If the future IT load is uncertain, each step provides a re-evaluation point where the decision can be made to defer or reduce the next step, or stop the buildout entirely
While these concepts are familiar to many applications in everyday life, non-scalable legacy power and cooling architecture for data centers has for decades dictated upfront buildout of the entire facility. However, recent developments in scalable modular system architecture now allow designers to take advantage of the significant benefits of incremental deployment. There will still be elements of the infrastructure that cannot be scaled, and will need to be installed for full capacity upfront. See Figure 11 for an illustration of scalable vs. non-scalable elements. Three factors make stepped phase-in particularly attractive:
• Energy has become a major expense. The electric bill is a powerful incentive to avoid excess capacity wherever possible. “Green building” initiatives and “demand-side man-agement” programs that reward efficient operation further increase the incentive to run a lean data center. A “right-sized” data center – one whose power and cooling capacity
INITIALload 3
MINIMUMfinal load
MAXIMUM final load1 2
Data center lifespan
ACTUAL final load (unknown)
4 RAMP-UPtime
STEP SIZE
System capacity plan5 6MARGINFigure 10
MARGIN parameter of growth model
The value of stepped phase-in
From Figure 5
System capacity planSystem capacity plan
IT IT load load profileprofile
Stepped Stepped phasephase--inin

Data Center Projects: Growth Model
Schneider Electric – Data Center Science Center White Paper 143 Rev 1 11
track the growth of the IT load, is much more efficient than one with excessive unused capacity.
• Data centers rarely build out to their projected maximum size. Research has shown that most data centers end up at far less load than the maximum that was pro-jected during planning. A stepped phase-in mitigates the risk of installing capacity that will never be used. For most data centers, this is the greatest benefit of incremental deployment,
• Unused capacity generates unnecessary maintenance cost. Installed equipment must be maintained and repaired even if the capacity is unused. By installing only what is needed to support the current load, significant service expense can be avoided – there is no service expense for equipment you don’t have.
Figure 11 illustrates stepped phase-in. Note that greater uncertainty dictates more steps in the phase-in, to provide additional decision points for re-evaluation and adjustment of the plan.
Initial load
Stepped phase-in allows for abort of capacity plan at any step as future becomes more clear
Ramp-up time
Original plan
Modified planMAXIMUMMAXIMUM projected load
MINIMUMMINIMUM projected load
System capacity plan
““STOP buildout now STOP buildout now –– we we have stopped growinghave stopped growing””
ACTUALACTUAL final load reached early
Original plan
Initial load
Ramp-up time
Smaller phase-in steps allow more frequent evaluation of uncertain future
MAXIMUMMAXIMUM projected loadModified plan
System capacity plan
ACTUALACTUAL final load reached early
MINIMUMMINIMUM projected load
““STOP buildout now STOP buildout now –– we we have stopped growinghave stopped growing””
Figure 11 Stepped phase-in provides re-evaluation points before full buildout
Data Center Projects: Growth Model
Schneider Electric – Data Center Science Center White Paper 143 Rev 1 12
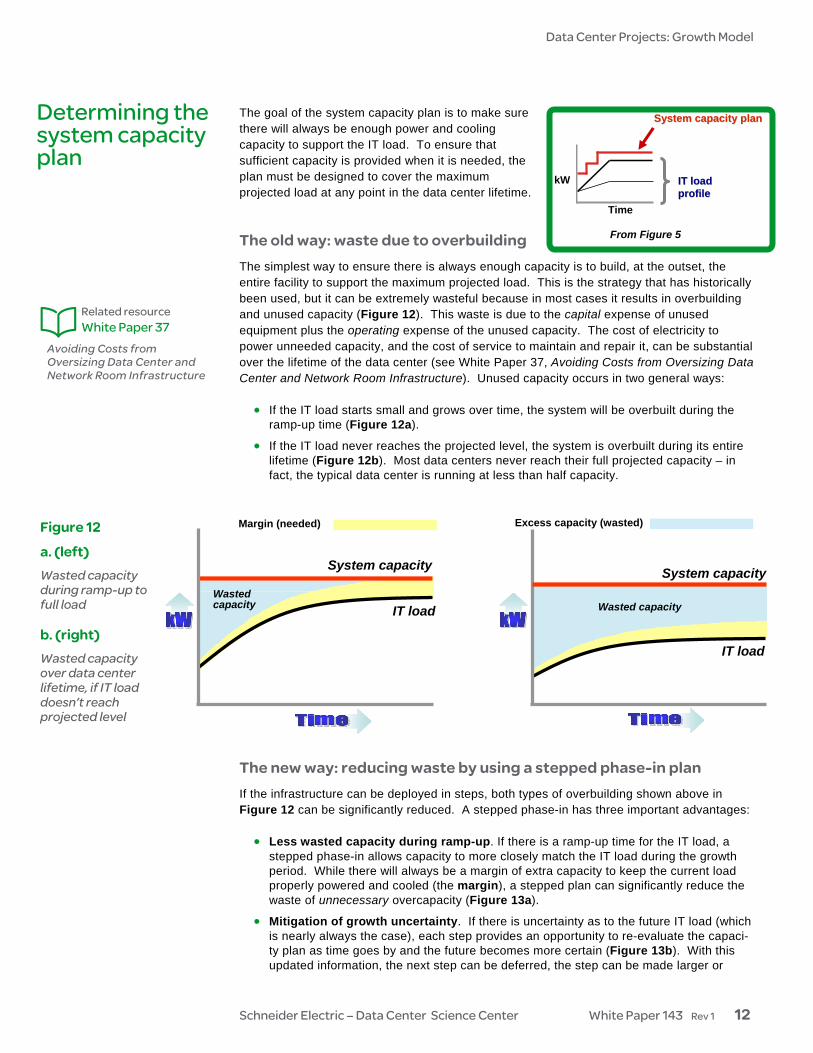
The goal of the system capacity plan is to make sure there will always be enough power and cooling capacity to support the IT load. To ensure that sufficient capacity is provided when it is needed, the plan must be designed to cover the maximum projected load at any point in the data center lifetime. The old way: waste due to overbuilding The simplest way to ensure there is always enough capacity is to build, at the outset, the entire facility to support the maximum projected load. This is the strategy that has historically been used, but it can be extremely wasteful because in most cases it results in overbuilding and unused capacity (Figure 12). This waste is due to the capital expense of unused equipment plus the operating expense of the unused capacity. The cost of electricity to power unneeded capacity, and the cost of service to maintain and repair it, can be substantial over the lifetime of the data center (see White Paper 37, Avoiding Costs from Oversizing Data Center and Network Room Infrastructure). Unused capacity occurs in two general ways:
• If the IT load starts small and grows over time, the system will be overbuilt during the ramp-up time (Figure 12a).
• If the IT load never reaches the projected level, the system is overbuilt during its entire lifetime (Figure 12b). Most data centers never reach their full projected capacity – in fact, the typical data center is running at less than half capacity.
The new way: reducing waste by using a stepped phase-in plan If the infrastructure can be deployed in steps, both types of overbuilding shown above in Figure 12 can be significantly reduced. A stepped phase-in has three important advantages:
• Less wasted capacity during ramp-up. If there is a ramp-up time for the IT load, a stepped phase-in allows capacity to more closely match the IT load during the growth period. While there will always be a margin of extra capacity to keep the current load properly powered and cooled (the margin), a stepped plan can significantly reduce the waste of unnecessary overcapacity (Figure 13a).
• Mitigation of growth uncertainty. If there is uncertainty as to the future IT load (which is nearly always the case), each step provides an opportunity to re-evaluate the capaci-ty plan as time goes by and the future becomes more certain (Figure 13b). With this updated information, the next step can be deferred, the step can be made larger or
SSyysstteemm ccaappaacciittyy ppllaann
IITT llooaadd pprrooffiillee
Time
kW
From Figure 5
Avoiding Costs from Oversizing Data Center and Network Room Infrastructure
Related resource White Paper 37
Margin (needed) Excess capacity (wasted)
System capacity
IT load Wasted capacity Wasted capacity
System capacity
IT load
Figure 12
a. (left) Wasted capacity during ramp-up to full load b. (right) Wasted capacity over data center lifetime, if IT load doesn’t reach projected level
Determining the system capacity plan

Data Center Projects: Growth Model
Schneider Electric – Data Center Science Center White Paper 143 Rev 1 13
smaller, or the phase-in can be stopped completely. This strategy avoids overbuilding if the expected IT growth doesn’t materialize.
• Informed evolution of cooling architecture. The way that cooling is distributed in the room affects the ability to support high density IT equipment. Room-level cooling archi-tecture cannot target high-density “hot spots,” leaving physical areas of the room un-available for high density even though the total cooling capacity of the room matches the total cooling required by the equipment in the room. Deploying physical infrastruc-ture incrementally, with power and cooling added in row-based increments that support known density requirements, avoids waste from such “stranded capacity” that cannot be used.
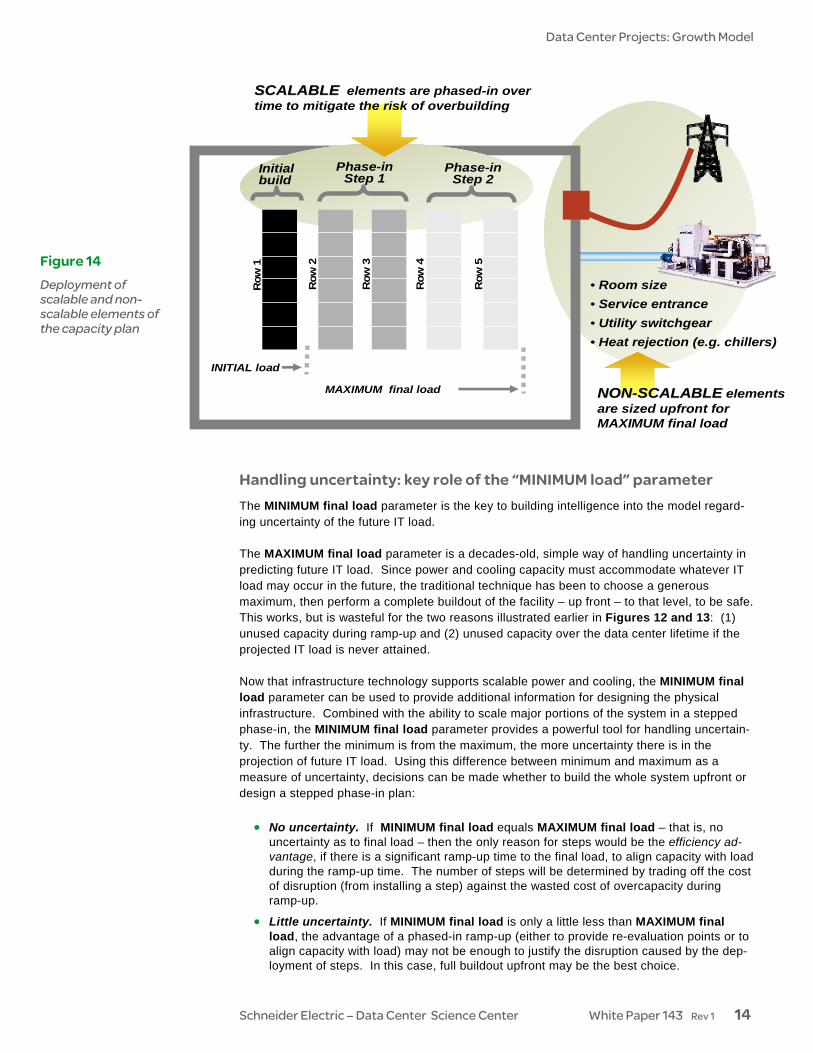
Scalable vs. non-scalable elements To accomplish the goal of minimizing overbuilding while assuring sufficient capacity for the IT load, the scalable and non-scalable elements of the infrastructure are deployed differently:
• Non-scalable elements are installed, at the outset, to accommodate the maximum load anticipated during the data center lifetime (MAXIMUM final load parameter). Examples of non-scalable elements are the physical room size, electrical service entrance capaci-ty, and pre-existing room-based air conditioning. Coming up against these “hard” ca-pacity constraints can be a major disruption in time, availability, and expense, and is usually considered something to be avoided at all cost.
• Scalable elements are installed, at the outset, for a lower-than-maximum load (enough to support the INITIAL load for a period of time), then increased over time according to the steps of the phase-in plan. Examples of scalable elements are racks, rack-based power protection and distribution, and rack-based cooling equipment.
Modified capacity plan
IT load
Original capacity plan
Decision to stop buildout made here
IT load
System capacity plan
Margin (needed) Excess capacity (wasted)
Compare to wasted capacity (blue area) in Figure 12
Figure 13
a. (left) Reduced waste during ramp-up, by matching capacity more closely to load b. (right) Reduced waste over data center lifetime, by stopping capacity buildout to match lower actual load
Data Center Projects: Growth Model
Schneider Electric – Data Center Science Center White Paper 143 Rev 1 14
Handling uncertainty: key role of the “MINIMUM load” parameter The MINIMUM final load parameter is the key to building intelligence into the model regard-ing uncertainty of the future IT load. The MAXIMUM final load parameter is a decades-old, simple way of handling uncertainty in predicting future IT load. Since power and cooling capacity must accommodate whatever IT load may occur in the future, the traditional technique has been to choose a generous maximum, then perform a complete buildout of the facility – up front – to that level, to be safe. This works, but is wasteful for the two reasons illustrated earlier in Figures 12 and 13: (1) unused capacity during ramp-up and (2) unused capacity over the data center lifetime if the projected IT load is never attained. Now that infrastructure technology supports scalable power and cooling, the MINIMUM final load parameter can be used to provide additional information for designing the physical infrastructure. Combined with the ability to scale major portions of the system in a stepped phase-in, the MINIMUM final load parameter provides a powerful tool for handling uncertain-ty. The further the minimum is from the maximum, the more uncertainty there is in the projection of future IT load. Using this difference between minimum and maximum as a measure of uncertainty, decisions can be made whether to build the whole system upfront or design a stepped phase-in plan:
• No uncertainty. If MINIMUM final load equals MAXIMUM final load – that is, no uncertainty as to final load – then the only reason for steps would be the efficiency ad-vantage, if there is a significant ramp-up time to the final load, to align capacity with load during the ramp-up time. The number of steps will be determined by trading off the cost of disruption (from installing a step) against the wasted cost of overcapacity during ramp-up.
• Little uncertainty. If MINIMUM final load is only a little less than MAXIMUM final load, the advantage of a phased-in ramp-up (either to provide re-evaluation points or to align capacity with load) may not be enough to justify the disruption caused by the dep-loyment of steps. In this case, full buildout upfront may be the best choice.
MAXIMUM final load
Initial build
Phase-inStep 2
SCALABLESCALABLE elements are phased-in over time to mitigate the risk of overbuilding
Row
1
Row
2
Row
5
Row
4
Row
3
• Room size• Service entrance• Utility switchgear• Heat rejection (e.g. chillers)
INITIAL load
NONNON--SCALABLESCALABLE elements are sized upfront for MAXIMUM final load
Phase-inStep 1
Figure 14 Deployment of scalable and non-scalable elements of the capacity plan

Data Center Projects: Growth Model
Schneider Electric – Data Center Science Center White Paper 143 Rev 1 15
• Great uncertainty. If MINIMUM final load is significantly less than MAXIMUM final load, a low initial buildout and a stepped phase-in is usually justified, with step size base on the considerations described in the next section, Factors determining step size.
Figure 15 shows several scenarios that illustrate the above principles.
MAXIMUM = MINIMUMMAXIMUM = MINIMUM
Power capacity plan
NO UNCERTAINTY as to final loadNO RAMP-UP
Full upfront buildout
MAXIMUM = MINIMUMMAXIMUM = MINIMUM
Power capacity plan
NO UNCERTAINTY as to final load,LONG RAMP-UP to final load
Stepped phase-in reduces excess capacity (and energy expense) during ramp-up
MAXIMUM loadMAXIMUM load
MINIMUM loadMINIMUM load
Power capacity plan
LITTLE UNCERTAINTY as to final load
A few steps to reduce excess capacity during ramp-up, but don’t need many decision points
MAXIMUM = MINIMUMMAXIMUM = MINIMUM
Power capacity plan
NO UNCERTAINTY as to final loadSHORT RAMP-UP to final load
Stepped phase-in isn’t worth the disruption, so full buildout up front
MAXIMUM MAXIMUM
MINIMUM MINIMUM
Power capacity plan
Extra steps for more decision points
GREAT UNCERTAINTY as to final load
A
B C
IT load profile
System capacity plan
Figure 15 Scenarios showing how IT load uncertainty and ramp-up time affect phase-in of the system capacity plan
D E

Data Center Projects: Growth Model
Schneider Electric – Data Center Science Center White Paper 143 Rev 1 16
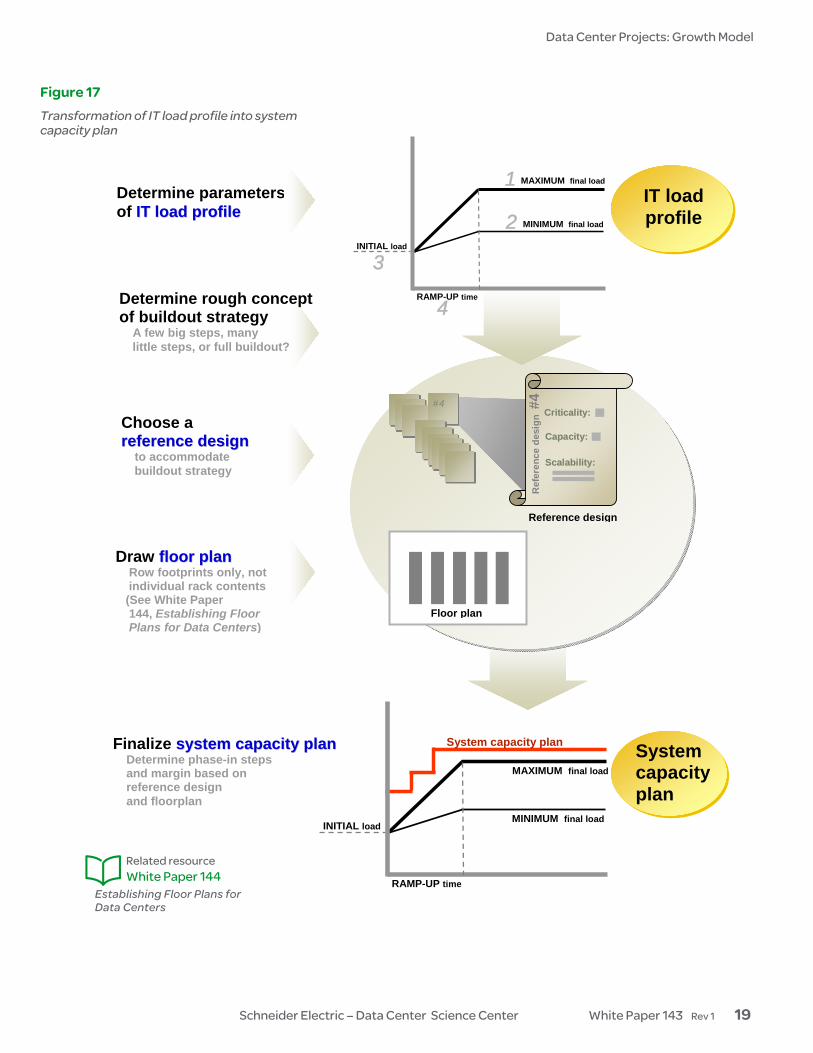
Factors determining step size The step size of a phased-in deployment is determined by careful consideration of tradeoffs among several factors: System architecture. The basic architecture of the design under consideration will dictate the degree to which the system can be scaled – in other words, how finely the design can be divided into “building blocks.” If there is a library of reference designs available for use as design templates, each one should have a “scalability” attribute that indicates possible step sizes. Room layout. The physical room layout will usually suggest a logical breakdown of deploy-ment steps. Steps will typically be row-based, with each step consisting of a number of rows (along with integrated row-based power and cooling, where possible). If the system will need to be physically isolated during installation of the next step, there may be an obvious place where a temporary wall can be constructed, in which case the location of that wall will dictate the division of physical space, hence the step size. Uncertainty of IT load. If the future size of the IT load is uncertain (MINIMUM final load significantly below MAXIMUM final load), phase-in steps can provide stopping points for reassessment before a commitment is made to further deployment. When there is greater uncertainty, smaller and more frequent steps provide more opportunities for adjustment of the plan based on developing conditions (see Figure 11). For extreme uncertainty, this bail-out feature of stepwise deployment becomes the primary consideration in designing the size and frequency of steps. Uncertainty of data center lifetime. If the lifespan of the data center itself uncertain – for example, if there is a known risk that the data center will have to be shut down or physically moved partway through its lifetime – the size of phase-in steps can take that risk into consideration, to reduce potential waste from the decommissioning of never-used spare capacity. If such an event should become imminent, phase-in can be stopped. Cost and disruption. Regardless of the efficiency of installation or the price of equipment, there will always be some cost and disruption associated with the deployment of a phase-in step. This must be weighed against the strategic advantages of adding a step to the phase-in plan. Figure 15 shows several examples of step size. The growth model plays a key role in the sequence of activity that takes physical infrastruc-ture planning from concept to detailed design. This planning sequence is described in White Paper 142, Data Center Projects: System Planning. Figure 16 shows the context of the growth model within the system planning sequence. Early in the planning sequence, the user provides the IT load profile as an input to the planning sequence. Later in the planning sequence, the system capacity plan (including phase-in steps, if any) is established based on the architecture of the chosen reference design and on the user’s room layout. (Note that one type of phase-in plan is NO phase-in – just maximum buildout at the beginning.) The size and timing of the phase-in steps are an output of the planning sequence. Figure 17 summarizes the transformation of the growth model from IT load profile to system capacity plan. All of this activity occurs within the planning sequence, along with other planning activity for the project.
Role of the growth model in the system planning sequence
Data Center Projects: System Planning
Related resource White Paper 142

Data Center Projects: Growth Model
Schneider Electric – Data Center Science Center White Paper 143 Rev 1 17
3
4
1 2
IT load profile (parameters 1, 2, 3, 4) decided by user, and input here
1 Maximum kW 2 Minimum kW 3 Initial kW 4 Ramp-up time
CAPACITY
GROWTH PLAN
The IITT llooaadd pprrooffiillee is an INPUT to the planning sequence The ssyysstteemm ccaappaacciittyy ppllaann is an OUTPUT of the planning sequence
System capacity plan (parameters 5 and 6) finalized here, taking system architecture and floor plan into consideration
MAXIMUMIT load
MINIMUMIT loadINITIAL
IT load
Step Step sizesize
MarginMargin55 66System capacity plan
Identify needs
Preferences
Preferences
Preferences
Preferences
Constraints
Constraints
Constraints
Constraints
COMPLETE SYSTEMCOMPLETE SYSTEMSPECIFICATIONSPECIFICATION
DETAILEDDETAILEDDESIGNDESIGN
• Criticality
• Capacity
• Growth plan
• Reference
design
• Room
IT Load Profile
Figure 16 Role of the growth model in the system planning sequence (for more information about the system planning sequence, see White Paper 142 (link in Resources section)

Data Center Projects: Growth Model
Schneider Electric – Data Center Science Center White Paper 143 Rev 1 18
Choosing a reference design A reference design serves as a simplifying and time-saving shortcut between creating the IT load profile and designing a system capacity plan to support it. The IT load profile for the growth model is established very early in the planning sequence. As described earlier in this paper, this forward-looking profile provides the basis for a general idea of the buildout strategy (full buildout vs. phase-in steps). Once this general strategy has been identified, a reference design can be chosen. Every reference design has a “scalability” associated with it – a step size it can accommodate – which makes it more or less appropriate to the general buildout strategy. As described earlier, a small difference between the maximum and minimum expected load represents high certainty regarding growth plans. In this case, the chosen reference design can be less flexible, designed for a specific capacity with little ability to start small and scale up. On the other hand, a large difference between the maximum and minimum expected load represents low certainty, in which case the reference design should be very flexible (adaptable) with regard to the step size it can accommodate. An adaptable reference design can be scaled to match a wide range of capacities. A less adaptable reference design will be geared toward a specific capacity – while it will have ample capacity to cover the smaller loads of a ramp-up to that capacity, using it that way means the wasted expense of overca-pacity.
> What is a reference design? Starting from an IT load profile, there are potentially thousands of ways the DCPI system could be designed, but there are a much smaller number of “good” designs. A library of these good – i.e., recommend-ed – designs can be used to quickly narrow down the possibilities. Much like a catalog of kitchen designs at a home im-provement store, this library of “reference designs” provides a choice of general architecture for the design of the system. Each reference design embodies a criti-cality level, a maximum buildout capacity, scalability characteristics, cost, and PUE. A reference design is a shortcut along the path to the user’s final design, with most of the engineering built in but with enough variability to satisfy the specific require-ments of a range of user projects. The library of reference designs must be created by a party with expertise in both data center design and in the specific products available. The scalability characteristics of the chosen reference design, combined with the row layout of the user’s floor plan, provide the necessary information to develop an appropriate step size for the phase-in portion of the system capacity plan.
Data Center Projects: Growth Model
Schneider Electric – Data Center Science Center White Paper 143 Rev 1 19
System capacity plan
11225555555555
1111222255555555555555555555
#4Criticality:Criticality:
Ref
eren
ce d
esig
n #
4
Capacity: Capacity:
Scalability:Scalability:
Determine parameters of IITT llooaadd pprrooffiillee
Choose a rreeffeerreennccee ddeessiiggnn to accommodate buildout strategy
Draw fflloooorr ppllaann Row footprints only, not individual rack contents (See White Paper 144, Establishing Floor Plans for Data Centers)
3
1
2
4
MAXIMUM final load
MINIMUM final load
RAMP-UP time
INITIAL load
Finalize ssyysstteemm ccaappaacciittyy ppllaann Determine phase-in steps and margin based on reference design and floorplan
Determine rough concept of buildout strategy A few big steps, many little steps, or full buildout?
IT load profile
MAXIMUM final load
MINIMUM final load
RAMP-UP time
INITIAL load
System capacity plan
Floor plan
Reference design
Figure 17 Transformation of IT load profile into system capacity plan
Establishing Floor Plans for Data Centers
Related resource White Paper 144
Data Center Projects: Growth Model
Schneider Electric – Data Center Science Center White Paper 143 Rev 1 20
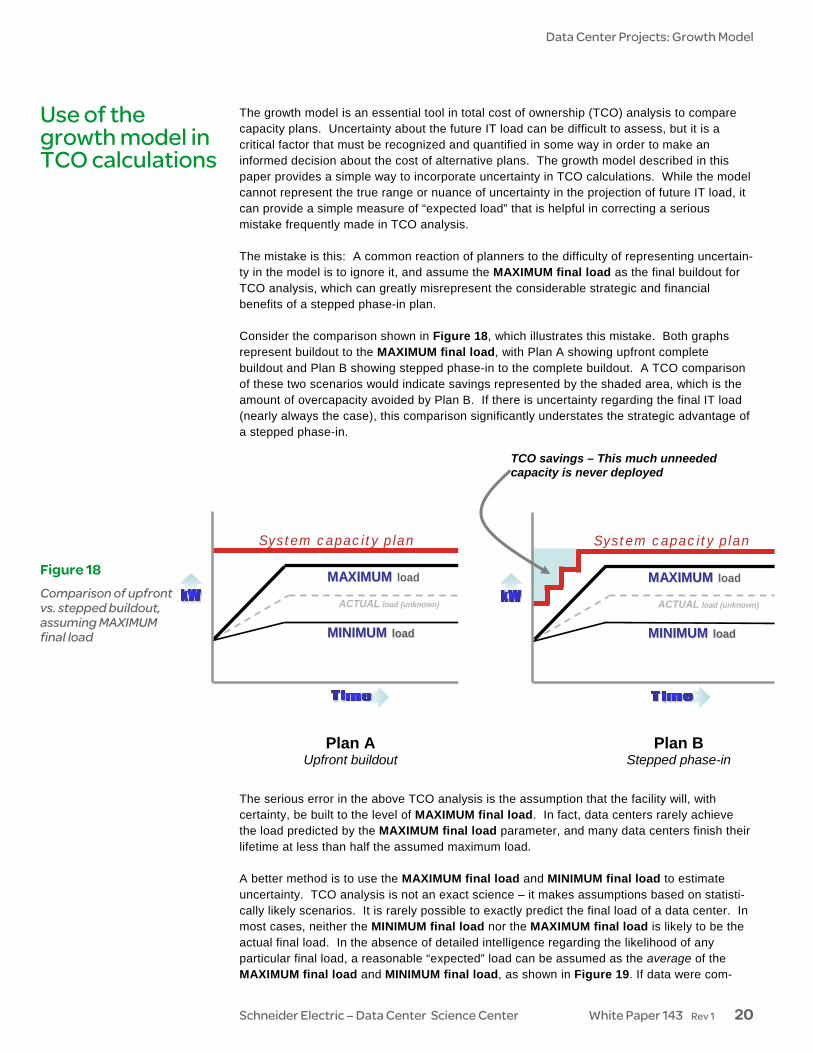
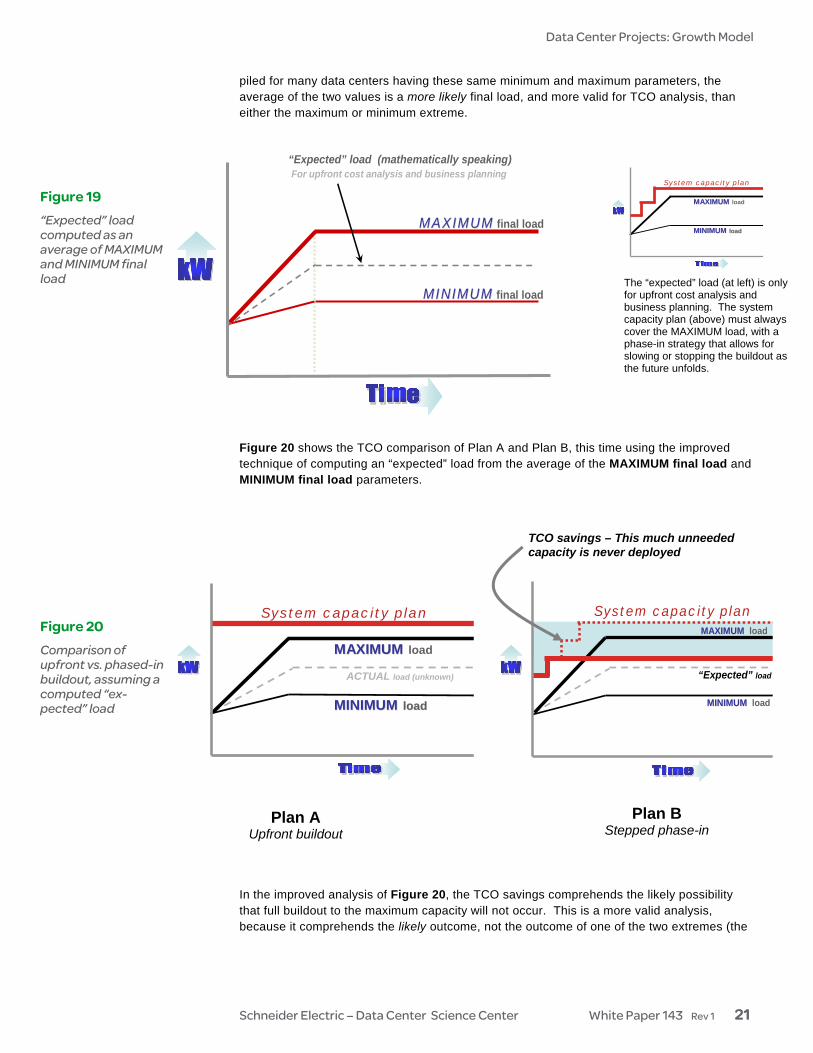
The growth model is an essential tool in total cost of ownership (TCO) analysis to compare capacity plans. Uncertainty about the future IT load can be difficult to assess, but it is a critical factor that must be recognized and quantified in some way in order to make an informed decision about the cost of alternative plans. The growth model described in this paper provides a simple way to incorporate uncertainty in TCO calculations. While the model cannot represent the true range or nuance of uncertainty in the projection of future IT load, it can provide a simple measure of “expected load” that is helpful in correcting a serious mistake frequently made in TCO analysis. The mistake is this: A common reaction of planners to the difficulty of representing uncertain-ty in the model is to ignore it, and assume the MAXIMUM final load as the final buildout for TCO analysis, which can greatly misrepresent the considerable strategic and financial benefits of a stepped phase-in plan. Consider the comparison shown in Figure 18, which illustrates this mistake. Both graphs represent buildout to the MAXIMUM final load, with Plan A showing upfront complete buildout and Plan B showing stepped phase-in to the complete buildout. A TCO comparison of these two scenarios would indicate savings represented by the shaded area, which is the amount of overcapacity avoided by Plan B. If there is uncertainty regarding the final IT load (nearly always the case), this comparison significantly understates the strategic advantage of a stepped phase-in. The serious error in the above TCO analysis is the assumption that the facility will, with certainty, be built to the level of MAXIMUM final load. In fact, data centers rarely achieve the load predicted by the MAXIMUM final load parameter, and many data centers finish their lifetime at less than half the assumed maximum load. A better method is to use the MAXIMUM final load and MINIMUM final load to estimate uncertainty. TCO analysis is not an exact science – it makes assumptions based on statisti-cally likely scenarios. It is rarely possible to exactly predict the final load of a data center. In most cases, neither the MINIMUM final load nor the MAXIMUM final load is likely to be the actual final load. In the absence of detailed intelligence regarding the likelihood of any particular final load, a reasonable “expected” load can be assumed as the average of the MAXIMUM final load and MINIMUM final load, as shown in Figure 19. If data were com-
Use of the growth model in TCO calculations
System capacity plan
MAXIMUMMAXIMUM load
MINIMUMMINIMUM loadload
ACTUAL load (unknown)
Plan B Stepped phase-in
Plan A Upfront buildout
TCO savings – This much unneeded capacity is never deployed
System capacity plan
MAXIMUMMAXIMUM load
MINIMUMMINIMUM loadload
ACTUAL load (unknown)
Figure 18 Comparison of upfront vs. stepped buildout, assuming MAXIMUM final load
Data Center Projects: Growth Model
Schneider Electric – Data Center Science Center White Paper 143 Rev 1 21
piled for many data centers having these same minimum and maximum parameters, the average of the two values is a more likely final load, and more valid for TCO analysis, than either the maximum or minimum extreme. Figure 20 shows the TCO comparison of Plan A and Plan B, this time using the improved technique of computing an “expected” load from the average of the MAXIMUM final load and MINIMUM final load parameters.
In the improved analysis of Figure 20, the TCO savings comprehends the likely possibility that full buildout to the maximum capacity will not occur. This is a more valid analysis, because it comprehends the likely outcome, not the outcome of one of the two extremes (the
System capacity plan
MAXIMUMMAXIMUM load
MINIMUMMINIMUM loadload
ACTUAL load (unknown)
The “expected” load (at left) is only for upfront cost analysis and business planning. The system capacity plan (above) must always cover the MAXIMUM load, with a phase-in strategy that allows for slowing or stopping the buildout as the future unfolds.
MAXIMUMMAXIMUM final load
MINIMUMMINIMUM final load
“Expected” load (mathematically speaking)For upfront cost analysis and business planning
System capacity plan
MAXIMUMMAXIMUM load
MINIMUMMINIMUM loadload
Figure 19 “Expected” load computed as an average of MAXIMUM and MINIMUM final load
System capacity planMAXIMUMMAXIMUM load
“Expected” load
MINIMUMMINIMUM load
TCO savings – This much unneeded capacity is never deployed
Plan B Stepped phase-in
Plan A Upfront buildout
Figure 20 Comparison of upfront vs. phased-in buildout, assuming a computed “ex-pected” load
Data Center Projects: Growth Model
Schneider Electric – Data Center Science Center White Paper 143 Rev 1 22
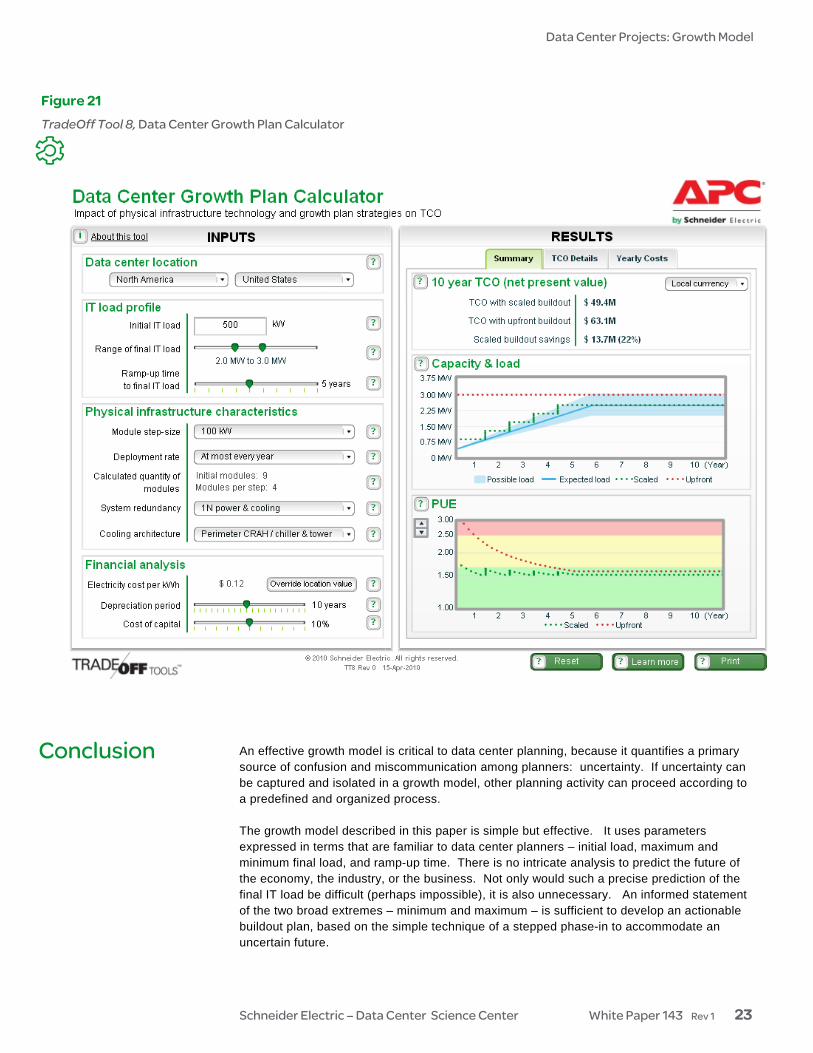
maximum).1 Note the much greater potential savings (blue shaded area) when the likely outcome of incomplete buildout is considered. This outcome must be considered, because it is statistically much more likely than the maximum IT load represented by the MAXIMUM final load parameter. If there is uncertainty, the analysis of Figure 20 more accurately represents the significant advantage of a stepped phase-in over full initial buildout. The increasing importance of accurate TCO analysis When energy cost was low, it was often a matter of pride and preparedness to have a data center with lots of spare power and cooling capacity to “handle anything.” Full upfront buildout to support the MAXIMUM final load parameter (as in Figure 20, Plan A) has historically provided a foolproof way to accomplish that goal. But today, with a stressed energy supply and skyrocketing cost, excessive unused capacity has become financially and ecologically unsound. An equally effective, but lean, power and cooling infrastructure is becoming the new paradigm. The ability to make a realistic comparison of proposed buildout strategies is critical to the deployment of an efficiently-used system. Careful estimation of the maximum and minimum possible IT load, then using those extremes to estimate a statistically “expected” load, is a simple but effective way to achieve a more realistic TCO analysis of alternative designs. Based on the growth model presented in this white paper, Schneider Electric’s Data Center Science Center has developed a web-based calculator to aid in TCO analysis of data centers. TradeOff Tool 8, Data Center Growth Plan Calculator, is illustrated in Figure 21. This calculator demonstrates how various capacity plan scenarios can impact data center costs over time. The user defines the IT load profile, including uncertainty in the final load, along with various physical infrastructure characteristics such as module step size and system redundancy. The calculator compares the TCO of a data center scaled step-by-step to the final expected load vs. a data center that is oversized on day 1 to accommodate the maxi-mum final IT load.
1 Schneider Electric’s TCO calculation methodology uses, by default, the average of the MAXIMUM final
load and MINIMUM final load parameters of the IT load profile supplied by the user. However, once the concept of “expected” load – not maximum possible load – is understood as the proper value for TCO calculation, the user can apply additional business intelligence to adjust the expected value to reflect uncertainty even better than the simple average of the initially stated maximum and minimum.
Data Center Projects: Growth Model
Schneider Electric – Data Center Science Center White Paper 143 Rev 1 23
An effective growth model is critical to data center planning, because it quantifies a primary source of confusion and miscommunication among planners: uncertainty. If uncertainty can be captured and isolated in a growth model, other planning activity can proceed according to a predefined and organized process. The growth model described in this paper is simple but effective. It uses parameters expressed in terms that are familiar to data center planners – initial load, maximum and minimum final load, and ramp-up time. There is no intricate analysis to predict the future of the economy, the industry, or the business. Not only would such a precise prediction of the final IT load be difficult (perhaps impossible), it is also unnecessary. An informed statement of the two broad extremes – minimum and maximum – is sufficient to develop an actionable buildout plan, based on the simple technique of a stepped phase-in to accommodate an uncertain future.
Conclusion
Figure 21 TradeOff Tool 8, Data Center Growth Plan Calculator

Data Center Projects: Growth Model
Schneider Electric – Data Center Science Center White Paper 143 Rev 1 24
Stepped phase-in is a powerful strategy for managing uncertainty, made possible by recent developments in power and cooling that enable scalable deployment of modular elements. It corrects the long-standing problem of wasteful underutilization of power and cooling capacity caused by overbuilding to an inflated target capacity. Stepped phase-in serves as a “steering wheel” to keep the buildout on track with reality – to keep capacity closer to load, allow for re-evaluation and adjustment of subsequent steps as the future unfolds, and avoid wasted investment in overbuilt infrastructure that may never be used. In addition to its role in guiding the design of power and cooling infrastructure, this growth model also plays a crucial role in TCO (total cost of ownership) analysis to compare alterna-tive system designs before one is chosen. It helps to correct the serious error of assuming the final load to be the maximum projected load – a target rarely achieved in data center installations. This common mistake obscures the substantial TCO benefit of a stepped phase-in. Uncertainty regarding the future of IT operations is a common frustration in data center planning. An essential tool for successful planning is a growth model that uses ordinary language to describe the IT load expectation, provides an actionable strategy to manage uncertainty, and supplies useful input to TCO analysis.
Neil Rasmussen is a Senior VP of Innovation for Schneider Electric. He establishes the technology direction for the world’s largest R&D budget devoted to power, cooling, and rack infrastructure for critical networks. Neil holds 19 patents related to high-efficiency and high-density data center power and cooling infrastructure, and has published over 50 white papers related to power and cooling systems, many published in more than 10 languages, most recently with a focus on the improvement of energy efficiency. He is an internationally recognized keynote speaker on the subject of high-efficiency data centers. Neil is currently working to advance the science of high-efficiency, high-density, scalable data center infrastructure solutions and is a principal architect of the APC InfraStruXure system. Prior to founding APC in 1981, Neil received his bachelors and masters degrees from MIT in electrical engineering, where he did his thesis on the analysis of a 200MW power supply for a tokamak fusion reactor. From 1979 to 1981 he worked at MIT Lincoln Laboratories on flywheel energy storage systems and solar electric power systems. Suzanne Niles is a Senior Research Analyst with the Schneider Electric Data Center Science Center. She studied mathematics at Wellesley College before receiving her Bachelor’s degree in computer science from MIT, with a thesis on handwritten character recognition. She has been educating diverse audiences for over 30 years using a variety of media from software manuals to photography and children’s songs.
About the author

Data Center Projects: Growth Model
Schneider Electric – Data Center Science Center White Paper 143 Rev 1 25
Data Center Projects: System Planning White Paper 142
Avoiding Costs from Oversizing Data Center and Network Room Infrastructure White Paper 37
Establishing Floor Plans for Data Centers White Paper 144
Guidelines for Specification of Data Center Criticality/Tier Levels White Paper 122
Data Center Growth Plan Calculator TradeOff Tool 8
Resources Click on icon to link to resource
Browse all white papers
tools.apc.com
Browse all TradeOff Tools™
whitepapers.apc.com
For feedback and comments about the content of this white paper: Data Center Science Center [email protected] If you are a customer and have questions specific to your data center project: Contact your Schneider Electric representative
Contact us