Embed Size (px)
Citation preview
Data Collection and Analysis for Auditors
Carole Buncher and Associates: The Competency Company
All rights reserved. No part of this manual may be
reproduced by any means without written permission from
Carole Buncher, Washington, D.C., USA
Printed in the United States of America
1
Carole S. Buncher, M.S., B.A.
Hello. I’m pleased to be working with you today. I own Carole Buncher and Associates: The Competency Company (CBA), a small, emerging, Washington, DC-based training and consulting firm. CBA specializes in delivering a wide variety of training, primarily to the audit community, including audit report writing, public speaking, supervision, interviewing, and auditing standards.
For 23 years prior to establishing CBA, I led analyses of federal programs and policies for the U.S. Government Accountability Office (GAO).
During my GAO tenure, I was actively involved in designing and delivering audit training, both internal and external to GAO .
Delivering training that is fun and results focused is my passion. I look forward to sharing my expertise with you and facilitating your learning and performance improvement experience.
My contact information:
http://www.carolebuncher.com
2
Learning Objectives
• Describe frequently used data collection methods and the advantages and disadvantages of each
• Conduct effective unstructured interviews
• Understand the features of effective questionnaire designs
• Be familiar with a variety of data analysis methods
3
4
Discuss with
a neighbor(s)
WHY IS THIS TRAINING IMPORTANT?
Module 1. DATA COLLECTION METHODOLOGIES
5
What Are Some Methods We Use to Collect Evidence?
• Reviewing records
• Administering surveys
• Conducting interviews
• Observing people, things, processes
6
Two Types of Data
• Secondary
• Primary
7
Secondary Data
• Organization charts
• Procedures manuals
• Policies
• Memos
• Mission statements
• Previous studies
• Financial statements
• Spreadsheets
8
PRIMARY Data Collection Methodologies
• Unstructured Interviews
• Questionnaires and Surveys
• Physical Observation
9
Module 2.
10
Unstructured Interviews
Three Stages
1. Preparation
2. Conducting
3. Post-Interview
11
Stage 1- Preparation • Do homework
• Subject matter
• Interviewee—attitudes and personality
• Prior working relationships
• Become conversant—time saver
• Prepare questions (linked to objectives)
• Schedule interview and begin establishing trust and rapport
• Prepare back-up plan—consider what-ifs
• Be prepared!
12
Stage 2 - Conducting
• Small talk • Continue establishing
rapport/trust
• Baseline for normal communications
• Introductions
• Background on audit
• Purpose of this interview
• How much time
• Questions before we begin?
• Ask questions linked to interview objectives
• End
13
Stage 3 - Post-Interview
Activities
• Write up within 3 days
• Collaborate with other interviewers
• Share write up with other interviewers
• Follow up on documents and referrals
14
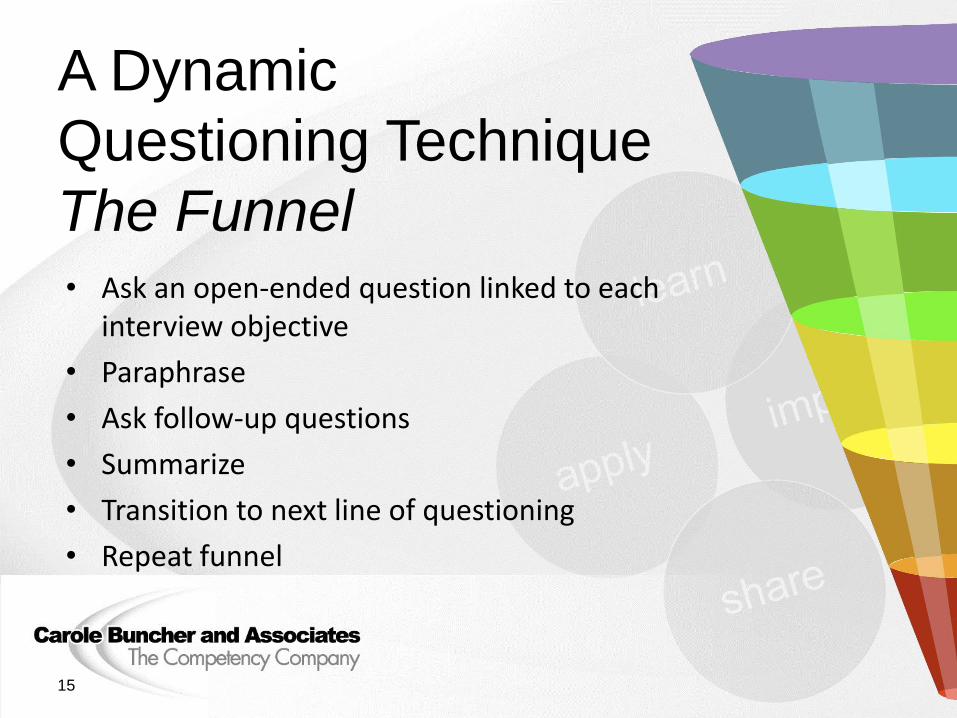
A Dynamic
Questioning Technique
The Funnel • Ask an open-ended question linked to each
interview objective
• Paraphrase
• Ask follow-up questions
• Summarize
• Transition to next line of questioning
• Repeat funnel
15
Module 3.
Structured Interviews: Questionnaires
16
Anatomy of a Questionnaire
• A cover letter
• An opening section
– Survey objective
– How respondent was selected
– How the responses will add value
– How anonymity will be handled
• How to return the completed survey (if not face to face)
• The questions
• Thank you
17
Best Practices for Developing a Questionnaire
1. Keep the language simple.
2. Keep the questions short.
3. Keep the number of questions to a minimum.
4. Do not ask leading questions.
5. Allow for all possible answers.
6. Formulate your questions to minimize confusion.
18
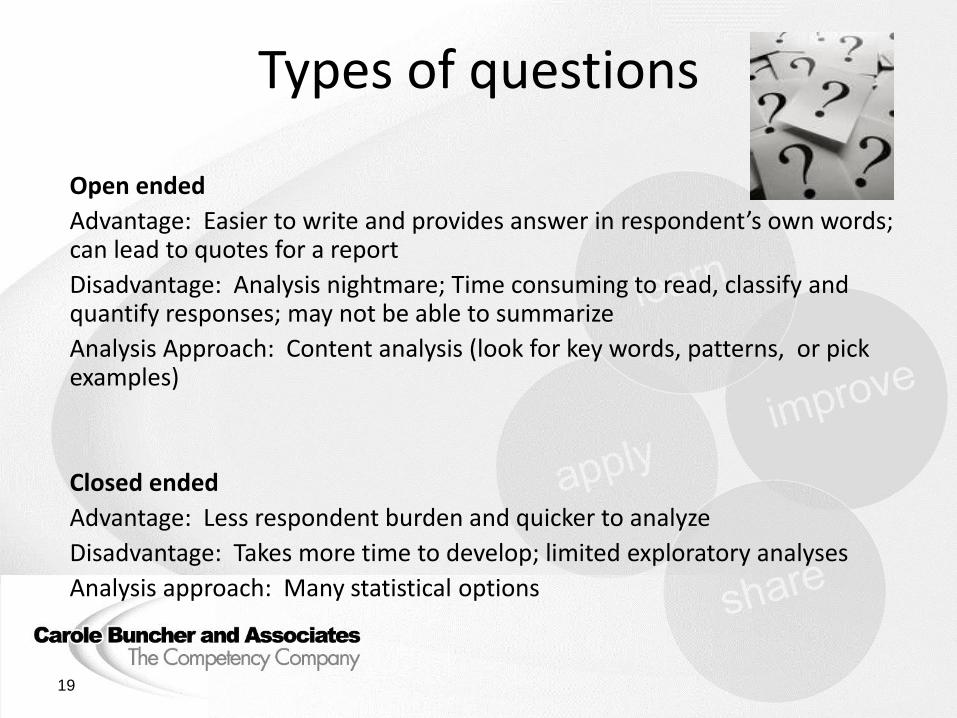
Types of questions
Open ended
Advantage: Easier to write and provides answer in respondent’s own words; can lead to quotes for a report
Disadvantage: Analysis nightmare; Time consuming to read, classify and quantify responses; may not be able to summarize
Analysis Approach: Content analysis (look for key words, patterns, or pick examples)
Closed ended
Advantage: Less respondent burden and quicker to analyze
Disadvantage: Takes more time to develop; limited exploratory analyses
Analysis approach: Many statistical options
19
Open-ended question Limit open-ended questions.
Example: “What additional comments do you have?”
20
Closed-Ended Question Formats
–Dichotomous questions
–Nominal questions
–Ordinal questions
– Interval questions
21
Dichotomous questions
Two possible responses, e.g.,
– My gender is: ___Male ___Female
– I have used the new software at least once in the past 5 days: ___yes ___no
22
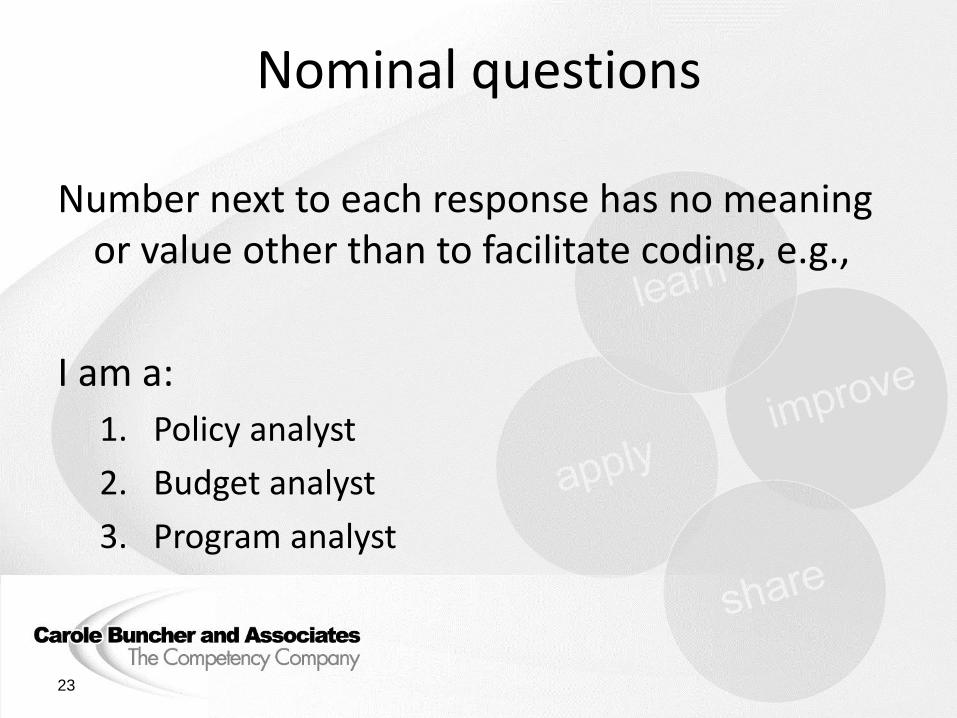
Nominal questions
Number next to each response has no meaning or value other than to facilitate coding, e.g.,
I am a:
1. Policy analyst
2. Budget analyst
3. Program analyst
23
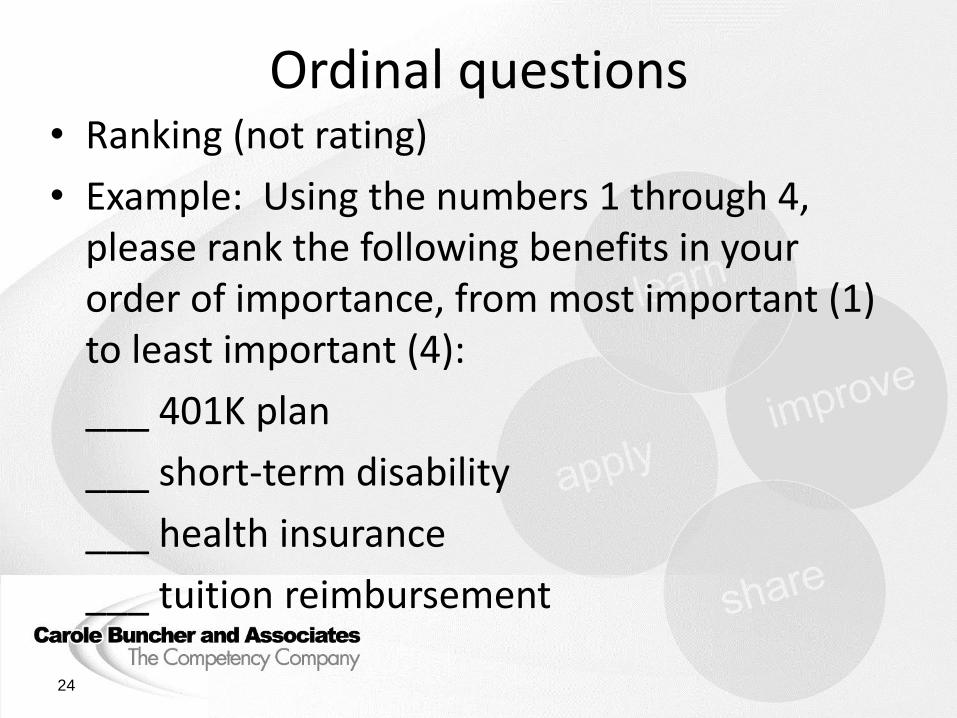
Ordinal questions • Ranking (not rating)
• Example: Using the numbers 1 through 4, please rank the following benefits in your order of importance, from most important (1) to least important (4):
___ 401K plan
___ short-term disability
___ health insurance
___ tuition reimbursement
24
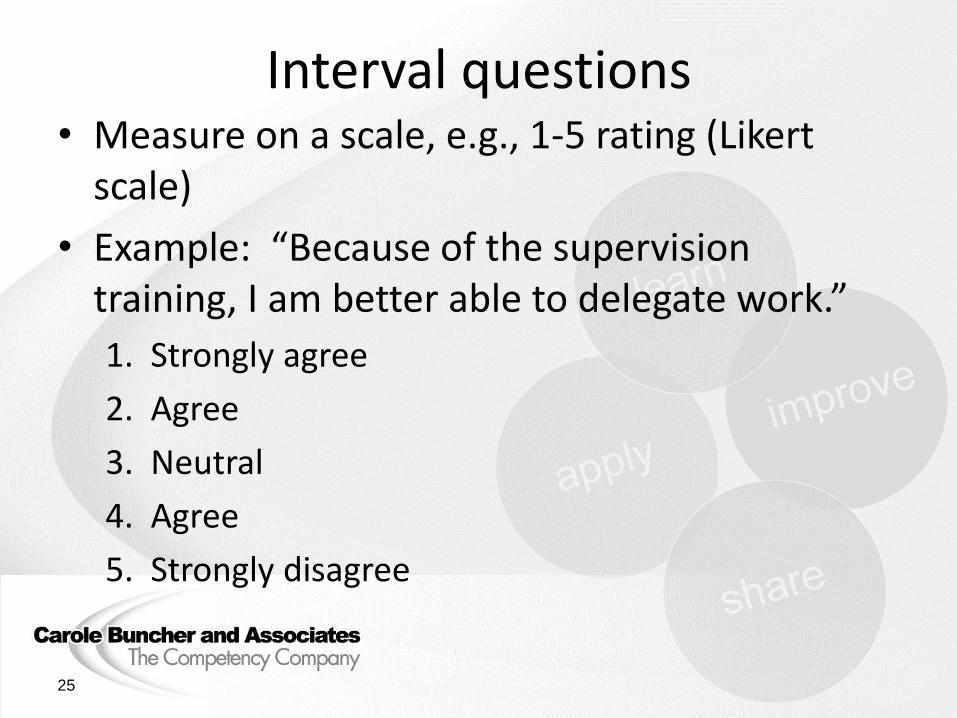
Interval questions • Measure on a scale, e.g., 1-5 rating (Likert
scale)
• Example: “Because of the supervision training, I am better able to delegate work.”
1. Strongly agree
2. Agree
3. Neutral
4. Agree
5. Strongly disagree
25
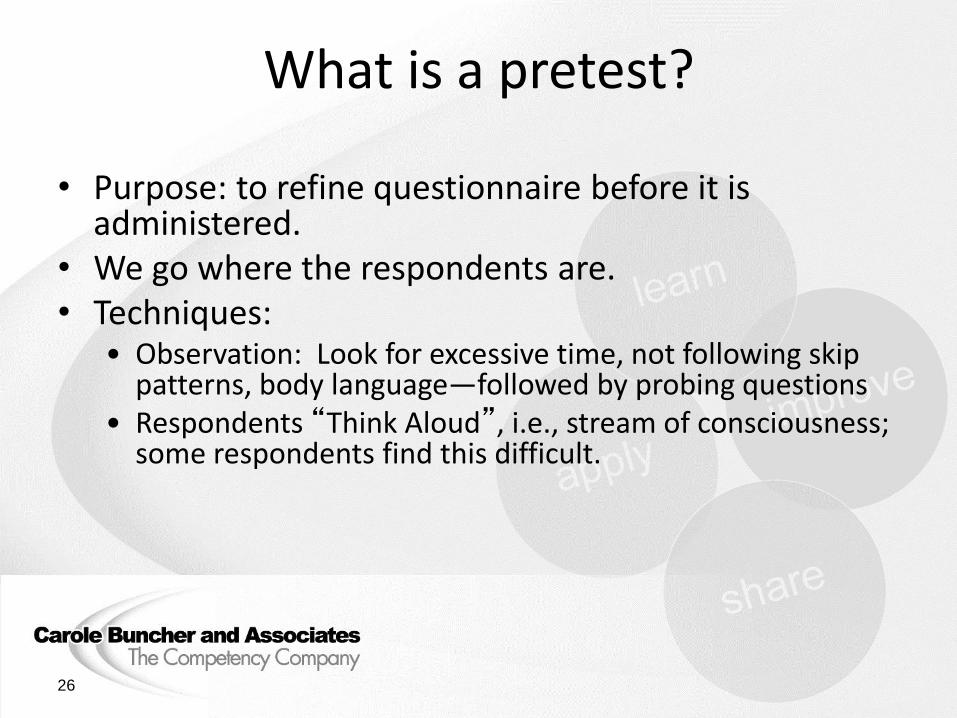
What is a pretest?
• Purpose: to refine questionnaire before it is administered.
• We go where the respondents are. • Techniques:
• Observation: Look for excessive time, not following skip patterns, body language—followed by probing questions
• Respondents “Think Aloud”, i.e., stream of consciousness; some respondents find this difficult.
26
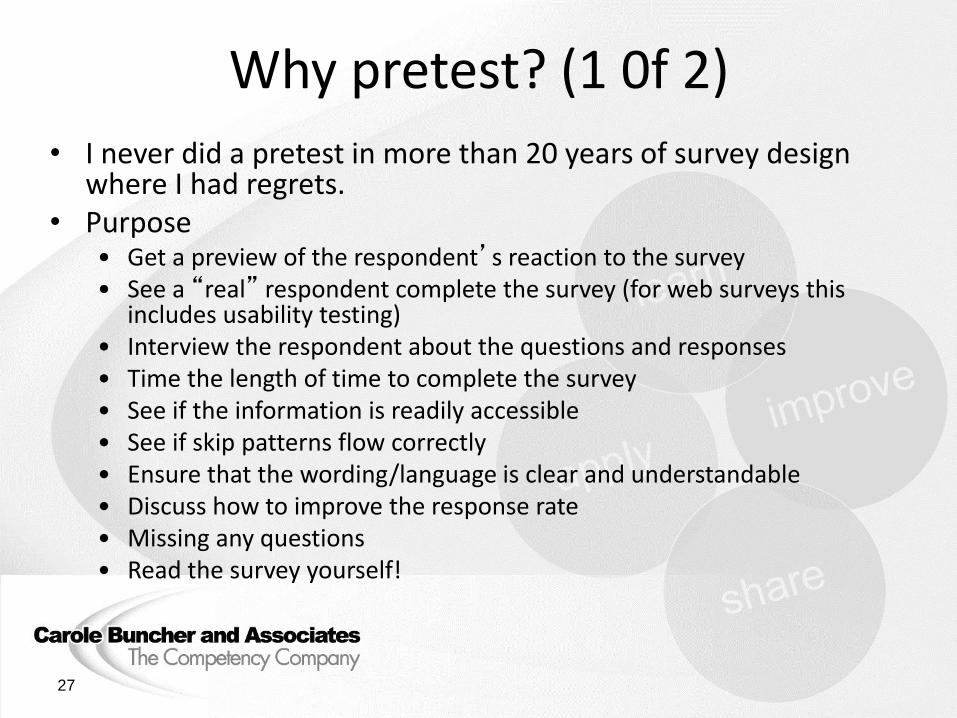
Why pretest? (1 0f 2)
• I never did a pretest in more than 20 years of survey design where I had regrets.
• Purpose • Get a preview of the respondent’s reaction to the survey • See a “real” respondent complete the survey (for web surveys this
includes usability testing) • Interview the respondent about the questions and responses • Time the length of time to complete the survey • See if the information is readily accessible • See if skip patterns flow correctly • Ensure that the wording/language is clear and understandable • Discuss how to improve the response rate • Missing any questions • Read the survey yourself!
27
Why pretest? (2)
• How many pretests? – At least 3
• When to stop pretesting?
– No new information is gained
28
Module 4.
Data Analysis
29
Two Types of Data
1. Qualitative, e.g., unstructured interviews; open-ended questions on questionnaires
2. Quantitative , e.g., closed-ended questions on questionnaires; spreadsheets
30
Steps for Analyzing QUALITATIVE Data
• Read through the data.
• Organize the comments into categories, e.g., concerns, strengths, recommendations, etc.
• Look for results, e.g., all of the management representatives had similar concerns.
31
Mean (or Mean Average)
• Most frequently used
• How to calculate: add all values in a data set and divide by the total number of values in the data set
• Influenced by outliers
32
Median • Middle value of a set of numbers
• How to calculate: Find the middle number of numbers placed in ascending or descending order
• Less influenced by outliers
• If odd number of values, take the middle number.
• If even number of values, take the two middle numbers, and, if different, divide by two.
33
Mode
• Most frequently occurring data value
• Can be more than one mode
• How to calculate: count number of occurrences
• Limited applications. One example, if 70 percent of respondents were male, mode would be “male”.
34
Range
• Difference between the highest and lowest values
• Example:
– Highest value = 300
– Lowest value = 100
– Range = 200 (or from 100-300)
35
How To Choose?
• Ideal world = all the same and no need to decide
• If not, don’t use “mean average” if don’t want to include outlier influence
• Can report all four (M,M,M,R), and let reader decide
• Audit objective will help determine which is most appropriate
36
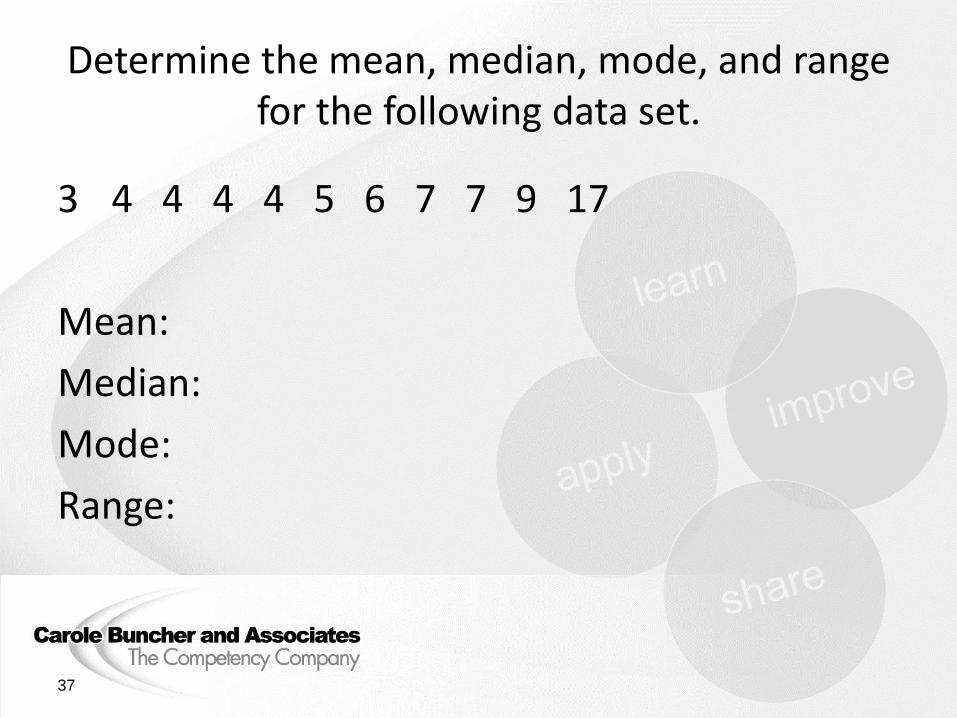
Determine the mean, median, mode, and range for the following data set.
3 4 4 4 4 5 6 7 7 9 17
Mean:
Median:
Mode:
Range:
37
What have you learned this morning?
38
Thank you!
Use your newly honed data collection and analysis skills, and you will shine!
39