Embed Size (px)
Citation preview

February 2016
4 英文 資料 115535.240803.28.2.18 作業;047
Data Collection Survey on Solid Waste Management in Democratic Socialist
Republic of Sri Lanka
Final Report(Annex)
Democratic Socialist Republic of Sri Lanka
February 2016D
ata Collection Survey on Solid W
aste Managem
ent in D
emocratic Socialist R
epublic of Sri LankaFinal R
eport(A
nnex)
Japan International Cooperation Agency (JICA)
Kokusai Kogyo Co., Ltd.
JR16-029
環境

Contents
RESULTS OF DETAIL SURVEYS 1
Kataragama PS 1.1
Thamankaduwa PS 1.2
Jaffna MC 1.3
Trincomalee UC 1.4
Kurunegala MC 1.5
Moratuwa MC 1.7
Kesbewa UC 1.8
Katunayake Seeduwa UC 1.9
Dehiwala Mt. Lavinia MC 1.10
(1)

Results of detail surveys 1
Waste Composition Survey (WCS)
Waste Generation Survey (WGS)
Public Opinion Survey (POS)
Final Disposal Site Survey (FDS)
(3)この前に合紙 この前に合紙

Kataragama PS 1.1
(5)この前に合紙 この前に合紙

The data collection survey of solid waste management in Sri Lanka Main Report‐ Kataragama Pradeshiya Sabha
i
Table of content
1 Introduction .................................................................................................................................... 1
1.1 Background conditions of Kataragama Pradeshiya Sabha ...................................................... 1
2 Waste Composition Survey (WCS) .................................................................................................. 4
2.1 Methods of waste composition Survey .................................................................................. 4
2.1.1 Classification of Wastes at Disposal Facility .................................................................... 4
2.1.2 Sampling frequency ........................................................................................................ 4
2.1.3 Bulk‐Sampling for WCS ................................................................................................... 4
2.1.4 Measurement of physical composition........................................................................... 6
2.2 Waste composition survey results .......................................................................................... 7
3 Waste Generation Survey (WGS) .................................................................................................... 9
3.1 Waste Generation Survey Results ......................................................................................... 10
4 Public Opinion Survey (POS) ......................................................................................................... 14
4.1 Public opinion survey methodology ..................................................................................... 14
4.2 Results of Public Opinion Survey .......................................................................................... 15
5 Final disposal site survey (FDS) ..................................................................................................... 18
5.1 Introduction the FDS of Kataragama PS ................................................................................ 18
5.1.1 Survey Method .............................................................................................................. 18
5.1.2 Target of Survey ............................................................................................................ 18
5.1.3 Data Sampling ............................................................................................................... 18
5.2 Current condition of final disposal sites and its surroundings.............................................. 19
5.2.1 Kataragama waste disposal sites .................................................................................. 19
5.2.2 Brief overview of four dumpsites in Kataragama PS area ............................................ 19
5.2.3 Waste receiving and disposal ........................................................................................ 23
5.2.4 Current condition of final disposal site and its surroundings ....................................... 24
5.2.5 Operation and Management of final disposal site ....................................................... 25
(6)

The data collection survey of solid waste management in Sri Lanka Main Report‐ Kataragama Pradeshiya Sabha
ii
List of Tables
Table 1‐1 Basic fact sheet of Kataragama Pradeshiya Sabha.................................................................. 1
Table 2‐1 Summary results of MSW physical composition survey in Kataragama PS ............................ 7
Table 3‐1 Type of data collected for WGS in Kataragama PS ................................................................. 9
Table 3‐2 Population statistics of villages in KPS area .......................................................................... 10
Table 3‐3 Type and number of municipal establishment own by Kataragama PS ............................... 11
Table 3‐4 Number of government and privet institutions within Kataragama PS ............................... 11
Table 3‐5 Types and number of business establishments in KPS area ................................................. 12
Table 3‐6 Type and estimated waste quantities from large waste generators in KPS area ................. 12
Table 4‐1 Category and number of samples for Public Opinion Survey ............................................... 14
Table 4‐2 Average and standard deviation values of income and family size ...................................... 15
Table 5‐1 Data collected during the final disposal site survey ............................................................. 18
Table 5‐2 Sources and quantities of waste disposed four dumpsites in Kataragama .......................... 23
(7)

The data collection survey of solid waste management in Sri Lanka Main Report‐ Kataragama Pradeshiya Sabha
iii
List of Figures
Figure 1‐1 Administration area of Kataragama Pradeshiya Sabha and its land use pattern .................. 2
Figure 1‐2 Major religious places and event in Kataragama ................................................................... 3
Figure 2‐1 Waste sampling and preparation for detail composition analysis ........................................ 5
Figure 2‐2 Average physical composition of MSW in Kataragama PS .................................................... 8
Figure 4‐1 Method of garbage discharge by residence in KPS area ..................................................... 15
Figure 4‐2 Willingness of residence for a source separated garbage collection system in Kataragama
PS ........................................................................................................................................................... 16
Figure 5‐1 MSW dumpsites within Kataragama PS area ...................................................................... 19
Figure 5‐2 Location and evvironment around Galapitayaya dumpsite ................................................ 20
Figure 5‐3 Composting facility of Kataragama PS ................................................................................. 21
Figure 5‐4 Environment around Devala Dumpsite of Kataragama ....................................................... 21
Figure 5‐5 Sellakataragama dumpsite .................................................................................................. 22
Figure 5‐6 MSW dumpsite near the Menik Ganga‐ Kataragama .......................................................... 22
(8)

The data collection survey of solid waste management in Sri Lanka Main Report‐ Kataragama Pradeshiya Sabha
1
1 Introduction
The purpose of this survey is to obtain the current data regarding Solid Waste Management (SWM)
at Kataragama Pradeshiya Sabha (KPS). The data collection survey was conducted from 6th
November 12th November, 2015 by a team of expert dispatched by Waste To Energy Technologies
Limited.
This report consists of brief summaries of survey methods and results. The additional primary data
and records are available as soft copies. The preliminary data collection was conducted through four
comprehensive surveys which are;
i. Waste Composition Survey (WCS) is to gather information on Physical Composition of MSW
collected by KPS.
ii. Waste Generation Survey (WGS) is to gather information on waste generation sources at
KPS based on secondary data available at KPS and other relevant organizations.
iii. Public Opinion Survey (POS) is gather information on public opinion on current waste
management in KPS. The POS was conducted through a questionnaire survey that covers
different types of waste generators in the KPS area.
iv. Final Disposal Site Survey (FDSS) is to collection data on final MSW disposal site of KPS
based on secondary data as well as field recordings & visits to the site.
1.1 Background conditions of Kataragama Pradeshiya Sabha
Kataragama is a pilgrimage town sacred to all religions of Sri Lanka, especially for Buddhist and
Hindus. And also people from South India and foreign tourists also go there to worship and site
seining. The town has the Ruhunu Maha Kataragama devalaya, a shrine dedicated to Skanda‐
Murukan also known as Kataragama‐devio. In addition, Kataragama houses the ancient Kiri Vehera
Buddhist stupa. The Ruhunu Maha Kataragama devalaya and Kiri Vehera Buddhist stupa are the
main attractions in the area and the Kataragama township and majority of citizens are depends on
those religious places for their day‐to‐day social and economical activities.
Kataragama Pradeshiya Sabha is in the Monaragala District of Uva province, Sri Lanka. It is 228 km
(through A2 highway) South‐East of Colombo. Although Kataragama was a small village in medieval
times, today it is a fast‐developing township surrounded by jungle in the southeastern region of Sri
Lanka. Since the 1950s the city has undergone many improvements with successive governments
investing in public transportation, medical facilities, and business development and hotel services. It
adjoins the popular Yala National Park.
Table 1‐1 Basic fact sheet of Kataragama Pradeshiya Sabha
Item Description
Province Uva Province of Sri Lanka
District Monaragala
Local Authority Status Pradeshiya Sabha
Year of Establishment 1987 by Pradeshiya Sabhas Act (No. 15 of 1987)
Location in Relation to Kataragama PS lies North to Hambantota on South‐East of Sri Lanka
(9)

The data collection survey of solid waste management in Sri Lanka Main Report‐ Kataragama Pradeshiya Sabha
2
228 km away from Colombo
Extent of the Authority Area 607.92 sq.km
No. of Council Members 29
No. of Villages 5 GN divisions (35 villages)
No. of Dwellings 4, 664
Population PS record (2012 statistics) 22, 415 (2012 statistics)
Average Population Density 0.37 p/ha
As shown in Land used pattern in KPS area showed that 8, 800 hectares are controlled by UDA, 447
hectares are belonged Temples and Devala, and also 71% of are classified as forest and other
reserves.
Figure 1‐1 Administration area of Kataragama Pradeshiya Sabha and its land use pattern
The population of KPS was 22, 145 individuals in 4, 759 families of 4, 664 households. Its floating
population increases tremendously during festival season, as it is a place of visitors from all around
the country and abroad for worshiping and touring the famous shrine and other religious
monuments. The festive season also attracts a large number of businessmen, transitory merchants,
security persons, beggars and other service providers.
Kataragama PS collects waste at Kataragama, Sella Kataragama and Detagamuwa and dispose at the
sites at same areas. The waste generated at the Devalaya is be managed by Devalaya itself and
dumped in the lands belongs to the Devalaya. Kataragama PS is very different from other
Pradesheeya Sabhas due to it being located in a sacred area and pilgrim numbers to Kataragama
(10)

The data collection survey of solid waste management in Sri Lanka Main Report‐ Kataragama Pradeshiya Sabha
3
increase especially during the weekends and holidays. Therefore the main waste generators are
floating pilgrims. There are Guest houses, and other restaurants situated. The PS collects tax from
these restaurants and guest houses.
With a daily floating population exceeding 20 times its inhabitants of 22, 145 during the festival
season (Mid of July to mid of August each year), Kataragama presents many challenges in dealing
with waste. Main waste generators are pilglims, Hotel, Restaurants etc. The Household collection
only covers a small area close to the town. No schedule of collection of waste and only a minor
officer controls the collection service. The tractors the PS has are old and trailers are corroded due
to fruit juice generated in the waste. As dogs and cows attack waste bins placed in shops waste is
always scattered in the town area.
Figure 1‐2 Major religious places and event in Kataragama
(11)

The data collection survey of solid waste management in Sri Lanka Main Report‐ Kataragama Pradeshiya Sabha
4
2 Waste Composition Survey (WCS)
The primary purpose of this survey is to ensure a standard approach to waste physical composition
analysis for the purposes of understanding the composition of waste delivered to final disposal
facility which was collected from KPS area. Information generated by WCAs will be useful to KPS as
well as administrators/policy makers to improve the efficiency and overall effectiveness of waste
management systems.
All the MSW collected within KPS is disposed off at several dumpsites in Kataragama. However, the
main dumpsite is the Galapitayaya dumpsite in the reservation forest. At the beginning of the access
road to the Galapitayaya dumpsite, Kataragma MSW Compost facility lies. Therefore the WCS survey
was conducted at MSW composting facility in Gam‐Udawa road.
2.1 Methods of waste composition Survey
2.1.1 Classification of Wastes at Disposal Facility
This study was conducted to assess the physical composition of MSW samples collected from KPS
and delivered to the final disposal facility by collection vehicles.
2.1.2 Sampling frequency
The WCA was carried out for a full waste collection cycle starting from Friday (6th November 2015) to
Thursday (12th November 2015).
2.1.3 Bulk‐Sampling for WCS
An effective WCA programme must be based on waste samples that are representative of the target
area as a whole (usually a whole local authority), be sufficient to take account of variation in waste
arising whilst also being affordable within the project budget. A good sampling strategy is essential
to achieving this difficult balance. Thus it is needed to ensure that a ‘good’ sample is obtained within
the constraints of time and cost.
Waste collection vehicles, especially four wheel tractors trailers (4‐wheel tractors) are filled from
bottom to the top of the trailer, thus making a distinguished vertical stratification in the tractor. The
filling pattern becomes more complex when the garbage is discharged in bags. Therefore, as shown
in エラー! 参照元が見つかりません。, profile sampling from collection vehicles was adapted in
this study. The profile sample was taken from the back of the trailer, measuring at least 1/8 of the
length of the trailer. Therefore, the size of the composite sample was found to be varied from 100
and 150 kg.
Thereafter, all the large and over sized waste particles were manually shredded into smaller particles.
At the first round of shredding, larger particles were cut in to small the size particles with knife and
scissors (Figure 2‐1).
(12)

The data collection survey of solid waste management in Sri Lanka Main Report‐ Kataragama Pradeshiya Sabha
5
Figure 2‐1 Waste sampling and preparation for detail composition analysis
(13)
The data collection survey of solid waste management in Sri Lanka Main Report‐ Kataragama Pradeshiya Sabha
6
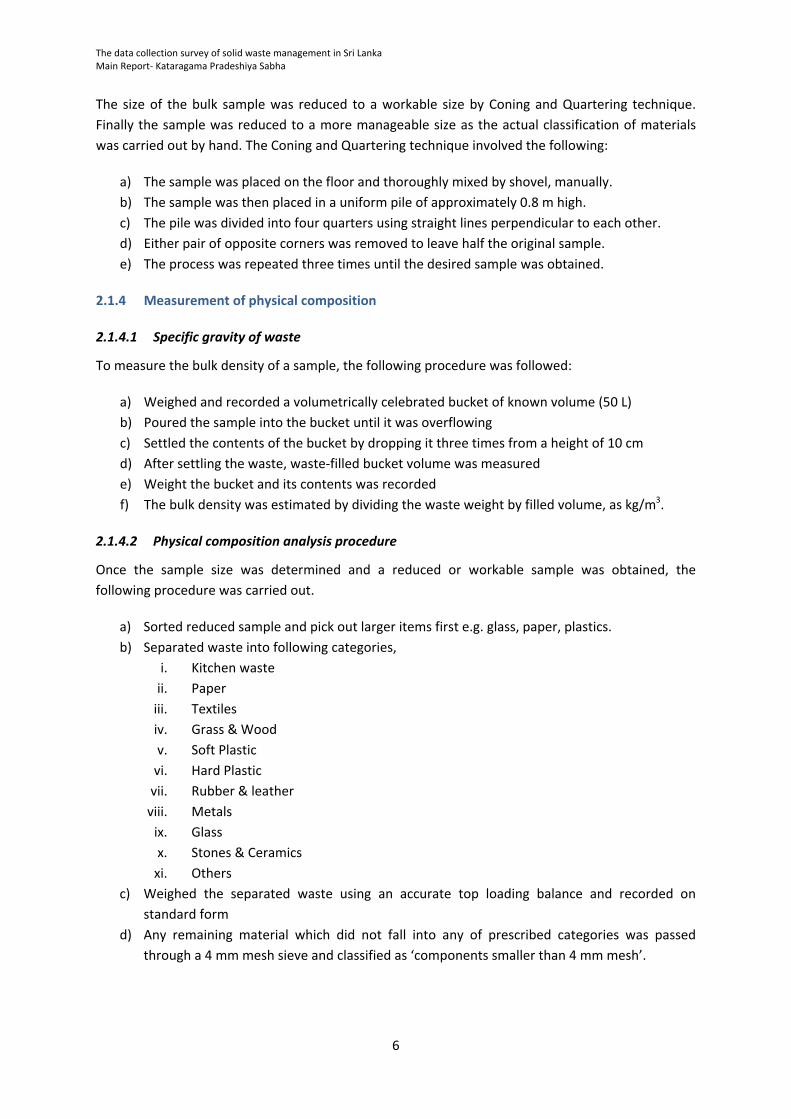
The size of the bulk sample was reduced to a workable size by Coning and Quartering technique.
Finally the sample was reduced to a more manageable size as the actual classification of materials
was carried out by hand. The Coning and Quartering technique involved the following:
a) The sample was placed on the floor and thoroughly mixed by shovel, manually.
b) The sample was then placed in a uniform pile of approximately 0.8 m high.
c) The pile was divided into four quarters using straight lines perpendicular to each other.
d) Either pair of opposite corners was removed to leave half the original sample.
e) The process was repeated three times until the desired sample was obtained.
2.1.4 Measurement of physical composition
2.1.4.1 Specific gravity of waste
To measure the bulk density of a sample, the following procedure was followed:
a) Weighed and recorded a volumetrically celebrated bucket of known volume (50 L)
b) Poured the sample into the bucket until it was overflowing
c) Settled the contents of the bucket by dropping it three times from a height of 10 cm
d) After settling the waste, waste‐filled bucket volume was measured
e) Weight the bucket and its contents was recorded
f) The bulk density was estimated by dividing the waste weight by filled volume, as kg/m3.
2.1.4.2 Physical composition analysis procedure
Once the sample size was determined and a reduced or workable sample was obtained, the
following procedure was carried out.
a) Sorted reduced sample and pick out larger items first e.g. glass, paper, plastics.
b) Separated waste into following categories,
i. Kitchen waste
ii. Paper
iii. Textiles
iv. Grass & Wood
v. Soft Plastic
vi. Hard Plastic
vii. Rubber & leather
viii. Metals
ix. Glass
x. Stones & Ceramics
xi. Others
c) Weighed the separated waste using an accurate top loading balance and recorded on
standard form
d) Any remaining material which did not fall into any of prescribed categories was passed
through a 4 mm mesh sieve and classified as ‘components smaller than 4 mm mesh’.
(14)

The data collection survey of solid waste management in Sri Lanka Main Report‐ Kataragama Pradeshiya Sabha
7
2.2 Waste composition survey results
A summary of the results of the waste composition survey conducted in KPS are tabulated below.
Table 2‐1 Summary results of MSW physical composition survey in Kataragama PS
Sample BD KW PP TEX GR S‐PL H‐PL R&L ME GL ST OTH
Collection Date Percentage (%)
06/10 Sam‐1 592.1 81.8 3.0 0.4 9.6 4.5 0.1 0.1 0.1 0.1 0.4 0.0
07/11 Sam‐1 538.5 66.2 9.3 3.1 10.0 6.8 0.2 0.5 0.2 0.8 2.9 0.0
07/11 Sam‐2 581.1 66.8 4.8 1.7 14.1 3.3 1.0 0.8 0.2 0.5 6.8 0.0
08/11 Sam‐1 569.8 71.7 6.9 0.0 19.5 1.1 0.2 0.1 0.0 0.0 0.6 0.0
09/11 Sam‐1 793.8 86.3 4.4 0.2 8.6 0.4 0.0 0.0 0.0 0.0 0.0 0.0
09/11 Sam‐2 575.0 65.2 9.0 0.5 22.6 1.8 0.0 0.0 0.0 0.1 0.8 0.0
09/11 Sam‐3 578.9 66.6 9.5 0.8 14.8 7.3 0.5 0.1 0.1 0.1 0.1 0.0
09/11 Sam‐4 583.3 49.5 5.0 0.1 36.6 5.8 0.6 0.6 0.2 0.8 0.8 0.0
10/11 Sam‐1 378.4 6.2 5.9 0.0 60.0 3.5 1.4 0.0 0.0 0.6 22.4 0.0
10/11 Sam‐1 750.0 78.6 4.5 0.1 2.5 9.7 1.1 0.0 0.8 0.1 2.5 0.0
10/11 Sam‐2 452.0 28.8 8.9 0.9 21.0 3.3 0.5 0.1 0.2 0.0 36.2 0.011/11 Sam‐1 526.1 63.3 11.0 0.5 12.2 5.2 1.4 0.0 0.4 5.0 1.0 0.011/11 Sam‐2 659.7 78.6 3.0 0.0 16.5 1.4 0.2 0.0 0.0 0.0 0.4 0.011/11 Sam‐3 787.5 77.2 13.9 0.0 8.5 0.3 0.0 0.0 0.0 0.0 0.1 0.0
Average 597.6 63.3 7.1 0.6 18.3 3.9 0.5 0.2 0.2 0.6 5.4 0.0Stranded Deviation 118.2 22.0 3.3 0.9 14.6 2.8 0.5 0.3 0.2 1.3 10.6 0.0Mean Error 30.5 5.7 0.8 0.2 3.8 0.7 0.1 0.1 0.1 0.3 2.7 0.0Median 580.0 66.7 6.4 0.3 14.5 3.4 0.4 0.0 0.1 0.1 0.8 0.0BD‐ Bulk density (kg m‐3), KW‐ Kitchen waste, PP‐ Paper, TEX‐ Textile, GR‐Grass & wood, S‐Pl‐ Soft plastics, H‐PL‐ Hard plastics, R&L‐ Rubber & leather, ME‐ Metal, GL‐ Blass & bottles, ST‐ Stones & ceramics, OTH‐ Other
The analysis showed that the amount of food & kitchen waste is the highest portion (average 63.3%).
However, except in one collection load, the amount of garden waste in the collection is
comparatively low which is equal to 18.3 % on average. Another notable feature is the variation of
composition among collection vehicles; some are having higher percentage of garden waste (10/11
sample 1) and one load is having higher portion of stones and ceramics (10/11 sample 2). The
average waste composition derived from the 14 samples is shown in Figure 2‐2.
(15)

The data collection survey of solid waste management in Sri Lanka Main Report‐ Kataragama Pradeshiya Sabha
8
Figure 2‐2 Average physical composition of MSW in Kataragama PS
The above figures shows that collected waste are suitable for composting. However, it is noted that
collected mixed waste contains considerable amount of stones & ceramics which have to be
separated to make good quality compost.
It also showed that the percentages of more profitable recyclable materials (hard plastic, metal, and
glass) are reasonably low (0.2 – 0.5 %), also the percentages of less profitable materials (paper, soft
plastic, textile) are on lower range (3.8 – 7.1 %) compared to other LAs in Sri Lanka.
(16)

The data collection survey of solid waste management in Sri Lanka Main Report‐ Kataragama Pradeshiya Sabha
9
3 Waste Generation Survey (WGS)
In order to obtain general information on waste generation amounts, the data available at waste
management section of the Health Department and Revenue Department of KPS was used. Some of
the data was available in the form of formal records and reports which were treated as the most
precise secondary data while the data collected from official interviews with KPS officers was treated
as verification data. Thus, the survey data was collected through different methods;
a) Recording and compiling of published and verified data by KPS,
b) Reading and recording of unpublished & non‐confidential data available at KPS,
c) Recording and official statistics available at Kataragama Divisional Secretariat office, and
d) Official person‐to‐person interview with relevant officers at KPS for verification of data.
The numerical data was collected as specified in following Table 3‐1.
Table 3‐1 Type of data collected for WGS in Kataragama PS
Source Description
Household Each number of following category households was surveyed;1) High income level, 2) Middle income level and 3) Low income level.
Commercial Each number of following category restaurants was surveyed;1) Large size restaurants, 2) Middle size restaurants and 3) Small size restaurants. Each number of following category shops was surveyed; 1)Organic shops (large) 2)Organic shops (middle) 3)Organic shops (small) 4)Non‐Organic shops (large) 5)Non‐Organic shops (middle) 6)Non‐Organic shops (small)
Hotels Each number of following category hotels was surveyed;1) Large size hotels 2) Middle size hotels and 3) Small size hotels.
Markets Number of stalls and types
Institutions Each number of following institute was surveyed;1) Schools 2) Hospitals (government) 3) Hospitals (private) 4) Public office 5) Bank/private office 6) Buddhist temples 7) Hindu temples 8) Mosques 9) Churches 10) Navy/Police/ Army bases 11) Others
Industries Wastes from any industries.
(17)

The data collection survey of solid waste management in Sri Lanka Main Report‐ Kataragama Pradeshiya Sabha
10
Source Description
Other Public parks and other public facilities
Construction and demolition
Wastes originating from construction, rehabilitation and demolition activities, etc.
Hazardous (Special)
Management and collection of hazardous wastes originating from various sources, including household items
3.1 Waste Generation Survey Results
The records indicate that the total residential population within KPS is 22, 145 (Source: Divisional
Secretariat, Kataragama 2015). The Kataragama PS area consists of 5 Grama Niladari (GN) divisions
as shown in below Table 3‐2 .
Table 3‐2 Population statistics of villages in KPS area
GN Division Village name Total population
Sellakataragama Kohomba digana/salmal palassa
4120
Sellakataragama town
Akkara wissa
Old buttala road
Raja mawatha
Karavile Karavile thanamalwila road
3500
Krushi Gammanaya
Punchi Dambe/Maha Dambe
Mailagama
Diyawara Gammanaya
Galahitiya
Passara Yaya
Gestupana
Detagamuwa Peragirigama
4061
Wallimathagama
Kochchipathana/sithulpawwa road
katagamuwa Road Manikpuragama
Kataragama Town
Kandasurindu mawatha
Kanda Road
Kataragama nagaha Weediya
5387
Gothamigama
Sramuddi Mawatha
Gaminipura
Gothamigama 2 Adiyara
Kandasurindugama Detagamuwa 1 piyawara5347
Detagamuwa 2 piyawara
(18)

The data collection survey of solid waste management in Sri Lanka Main Report‐ Kataragama Pradeshiya Sabha
11
GN Division Village name Total population
Detagamuwa 3 Piyawara
Kanda Road
raja Mawatha
Gamudawa
Niwasa 35
Kandasurindugama
Wiharamahadewi Gama
Murungalanda
Total 22, 415
As shown in following Table 3‐3, Kataragama PS own and control only a small number of public
properties and institutes.
Table 3‐3 Type and number of municipal establishment own by Kataragama PS
Public Property No of units
Library 3
Ayrvedic Medical Center 1
Cemetery 5
Play Ground 1
Montessori 20
Weekly Fair 1
Lavatory 196
Following Table 3‐4 shows the number of government and privet/non‐government establishments
within Kataragama PS.
Table 3‐4 Number of government and privet institutions within Kataragama PS
Type of institute No of units
Schools 5
Hospitals 1
Divisional secretary offices 1
Government Banks 3
Post office 3
Other Government office 23
Police stations 1
Privet Banks 4
Buddhist temples 32
Hindu Kovils 3
Mosques 1
(19)

The data collection survey of solid waste management in Sri Lanka Main Report‐ Kataragama Pradeshiya Sabha
12
A major portion of MSW is generated from commercial sector in the city. Following Table 3‐5 shows
the number of different commercial (business) establishments in KPS area.
Table 3‐5 Types and number of business establishments in KPS area
Type of business No of units
Grocery 67
Rest House 277
Sweet Selling 86
Restaurant 15
Saloon 6
Pharmacy 5
Farm Shop 1
Bakery 3
Fish Shop 2
Beauty Saloon 2
Grinding Mills 2
Fruit Shop 31
Rice mill 2
Saw mill & Work Shop 1
Hotel 5
Communications 1
In addition, Kataragama PS has listed number of large waste generating businesses and has
estimated the quantities of waste generated as shown in Table 3‐6.
Table 3‐6 Type and estimated waste quantities from large waste generators in KPS area
Name of large waste generator Tractor loads per month
Wishaka rest 1
Hindu rest house 1
Sea bank rest 1
Sri Lanka insurance 0.5
Paradise Hotel 1
Dutugemunu rest house 1
Government officers rest house 1
Colombo YMBA Rest House 1
Manik sisila rest house 1
Army rest house 1
Sumaga rest house 1
Gangarama rest house 1
Thilina rest 0.5
Niro rest 1
Mandara roshen hotel 5
(20)

The data collection survey of solid waste management in Sri Lanka Main Report‐ Kataragama Pradeshiya Sabha
13
Name of large waste generator Tractor loads per month
Sunsungchitta rest house 1
Gandewi Kovil 1
Gurugedara rest house 1
Muslim rest house 1
Hotel sunflower 1
Hashani glass center 0.5
Lake house rest house 1
Sri Lanka Harbour 0.5
Sathosa rest house 1
Saamwil holiday resort 1
Construction training & development center 0.5
Harbour rest house 1
National saving bank 1
Edirisingha rest 1
Ud garden 1
Rivinka rest 1
Dewasi rest 1
Sampath bank rest house 1
Thisara rest 1
(21)

The data collection survey of solid waste management in Sri Lanka Main Report‐ Kataragama Pradeshiya Sabha
14
4 Public Opinion Survey (POS)
This Public Opinion Survey (POS) was commissioned to identify a range of household waste
management matters in relation to the household sector. Information on household waste
management practices and information on householders’ experiences with waste collection delivery
services was collected for the purpose of improving our understanding of householder’s experiences
and attitudes and also to better understand prevailing situation in householder’s point of view. The
purpose of this survey research included;
a. To collect information on public attitudes to the waste management and environment in
broader,
b. To value aspects of environmental health and protection,
c. To provide information on experiences with Local Authority’s waste management service
and,
d. To provide information on household waste management practices.
4.1 Public opinion survey methodology
The number of samples from Kataragama identified as 200 households, but size of the sample
increased to 226 during the implementation to increase the accuracy. The selection of households
and areas within Kataragama PS was done after a consultative discussion with MSW section officers
at KPS and JICA expert team members.
The survey was executed by a team of university students who were trained about the questionnaire,
survey methodology and the data entering before dispatched to their respective fields. A senior
expertise took the leadership and continuously supervised the field survey. The selected households
were first educated about the survey, its main objectives and asked their cooperation before starting
the field survey. In addition business and institutes, large waste generators, hospitals recycling shops
and large public markets were also surveyed using appropriate questionnaires prepared in
consultation with JICA experts.
Table 4‐1 Category and number of samples for Public Opinion Survey
Category Survey Area Number of samples
High‐income households Wedahitikanda Rd, Sellakataragama Rd, Thanamalwila Rd, Passara Yaya Rd,
34
Middle‐income Households Old Buttala Rd, Lakshmi Devala Rd, Samudri Mw, New Buttala Rd, Sellakataragama Rd, Gamsaba Niwasa
86
Low‐income Households Old Buttala Rd, Samudri Mw, New Buttala Rd, Sellakataragama Rd, Kawantissa Mw,
41
Businesses /Service organization New Town, Main Street, Sellakataragama, Wadahitikanda Rd
44
Large waste generators 18
Markets 1
Recycling shops 1
(22)

The data collection survey of solid waste management in Sri Lanka Main Report‐ Kataragama Pradeshiya Sabha
15
Category Survey Area Number of samples
Hospital 1
Total 226
The questionnaires were available in all languages (English/Sinhala/Tamil); however the
questionnaire form was filled by the interviewer based on interviewees’ response. The collected
information was recorded in digital form using Microsoft Excel and reviewed for accuracy. The data
was analyzed in detail for different objectives that generate an overview of the survey.
4.2 Results of Public Opinion Survey
99% of the surveyed households are Sinhalese, with 1 % of Tamils. Data on the average
number of people per household and monthly income is set out in below Table 4‐2.
Table 4‐2 Average and standard deviation values of income and family size
Category Family size Income (Rs/month)
High 4.3 ± 0.9 172, 500 ± 175, 780
Middle 4.4 ± 1.2 48, 012 ± 9, 295
Low 4.0 ± 1.4 23, 476 ± 6,995
No of workers Income (Rs/month)
Business 2.6 ± 2.4 3, 677, 386 ± 3, 813, 062
In Kataragama PS, only 44 % of surveyed households are provided with a garbage collection
service, of which 36 % stated they use this service. Only 41 % of surveyed households are
“very satisfied” with present SWM service provision, while 39 % are “somewhat satisfied”.
Figure 4‐1 Method of garbage discharge by residence in KPS area
Placing outside53%
Carrying to collection point25%
Carrying to collection truck22%
Other0%
How is your garbage collected?
(23)

The data collection survey of solid waste management in Sri Lanka Main Report‐ Kataragama Pradeshiya Sabha
16
Out of the Households’ who use the garbage collection service, the main methods of waste
discharge are shown in Figure 4‐1. The most common methods are discharging it outside
their premises for house to house collection (53 %) and carrying garbage to collection point
(25 %) and to collection truck (22 %).
Out of households who use the service, only 11 % receive a daily garbage collection service
while 56 % stated that they received the service 2‐3 times/week.
61 % of surveyed households discharge garbage as soon as it is generated and 28 %
discharge their garbage daily.
In general, adult females handle waste in about 84 % of surveyed households.
As shown in Figure 4‐2, only 7 % of households separate their garbage into organic and
inorganic waste at the source of generation. Only 3 % of surveyed households are not/less
willing to cooperate with source separation for recycling. Rests of the household are very
much willing (89 %) and somewhat willing (1 %) to cooperate in source separated garbage
collection system.
Further, 72 % of surveyed households stated that there are recyclable collectors or someone
who comes to collect their reusable or recyclable materials. Hence, informal recycling
system is well established in Kataragama PS area.
Figure 4‐2 Willingness of residence for a source separated garbage collection system in Kataragama PS
Only 13 % of surveyed households use kitchen/garden waste for composting and used the
finished compost for their own garden.
Not many surveyed households (75 %) have ever discussed proper garbage discharge
methods at the community level.
A notable feature is that 100 % households stated that SWM awareness programmes are
very necessary
Very much willing89%
Somewhat willing1%
Less willing0%
Not willing3%
Doing already7%
Willingness to cooperate in separate garbage collection system
(24)

The data collection survey of solid waste management in Sri Lanka Main Report‐ Kataragama Pradeshiya Sabha
17
75 % of household do not like to pay for SWM service mainly because of the revenue tax
they paid for KPS. The average WTP (willingness to pay) for improved SWM services is 42 ±
91 Rs/month per household.
Out of all surveyed households, 12 % stated that they sale/give‐off Glass & Bottle for
recycling and 39 % of residence sale/give‐off Plastics for recycling. But only 1 % of
households sale/ give‐off can & metal for recycling. Cardboard and paper recycling were 1 %
and 19 % respectively.
(25)

The data collection survey of solid waste management in Sri Lanka Main Report‐ Kataragama Pradeshiya Sabha
18
5 Final disposal site survey (FDS)
5.1 Introduction the FDS of Kataragama PS
5.1.1 Survey Method
The data and information in this report were collected from various sources including published
reports, verified data from Kataragama Pradeshiya Sabha, Manager‐ Kataragama Maha Devala and
direct interview with officers & workers at disposal site.
5.1.2 Target of Survey
The survey is focus on obtaining general information on waste receiving, handling, disposal, facility
management, environmental monitoring and legal adherences.
5.1.3 Data Sampling
The numerical data was collected as specified in following Table 5‐1.
Table 5‐1 Data collected during the final disposal site survey
Survey Items Method
1 Current condition of final disposal site and its surroundings
Disposal method and structure Records, visual observation
Soil‐covering Records, visual observation
Land owner Records
Residual area Records, visual observation
Leachate water Records, visual observation
Waste picker Records, visual observation, interview
Scattering waste, smoke, fire, offensive odour, animals and so on
Records, visual observation
2 Operation and Management of final disposal site
Environmental Protect License and Environmental Clearance
Record
Personnel Records, interview
Operation vehicles, their maintenances and drivers Records, interview
Weighbridge Records, interview
Waste collection data Records, interview
Supervisory method Records, interview
3 Waste amount to final disposal site (24 hours, 7 days) Records, Survey
4 Adverse impact near by residences Records, Survey
5 Implementation status of geological, topographic and EIA survey
for new final disposal site
Records, interview
6 Progress situation for new final disposal site Records, interview
7 Court case Records, interview
(26)

The data collection survey of solid waste management in Sri Lanka Main Report‐ Kataragama Pradeshiya Sabha
19
5.2 Current condition of final disposal sites and its surroundings
5.2.1 Kataragama waste disposal sites
Waste generated in the Maha Devala and Kirivehera premises are entirely done by Devala
administration by using its own four wheel tractor for collection and maintaining a separate
dumpsite within Maha Devala areas.
Kataragama PS collects waste from all other PS areas and disposed in two permenet dumpsites and
one temporally dumpsite that is known as illegal dumpsite.
Therefore, as shown Figure 5‐1 in there are four dumpsites within Kataragama area at present.
Figure 5‐1 MSW dumpsites within Kataragama PS area
5.2.2 Brief overview of four dumpsites in Kataragama PS area
5.2.2.1 Galapitayaya dumpsite
The available records showed Galapitayaya Dumpsite was started in early 90s and continue to shift
within the forest for several places. Waste dumping at present location started in early 2000s.
The site is located within crown land own by Department of Forest and Government Agent of
Monaragala. Scavenging of wild elephants is the major thread to Wildlife in the forest, among many
other environmental problems associated with the site.
(27)

The data collection survey of solid waste management in Sri Lanka Main Report‐ Kataragama Pradeshiya Sabha
20
Approximately 2 hectares of land has already been covered with waste up to 2‐3 m high.
Figure 5‐2 Location and evvironment around Galapitayaya dumpsite
There is a composting facility which was constructed by Swedish Donor Agency (Figure 5‐3). The
composting facility receives one tractor load of waste per day. After receiving, mix waste is sorted
and filled into large waste bin with passive aeration system. The composting facility includes two
separate buildings for recyclable storage and finish compost storage. In addition there is a small
biogas unit (100 kg/day) which supply Bio‐gas for workers restroom.
(28)

The data collection survey of solid waste management in Sri Lanka Main Report‐ Kataragama Pradeshiya Sabha
21
Figure 5‐3 Composting facility of Kataragama PS
5.2.2.2 Devala dumpsite
Devala dumpsite is located within the land area managed and controlled by Maha Devala. The site
has also been used as a soil burrow pit in recent days. The waste is unloaded at the site and no any
control measures are taken to manage the waste and protect the environment. Thus, site has
become a scavenging ground for cattle and wild animals.
Figure 5‐4 Environment around Devala Dumpsite of Kataragama
(29)

The data collection survey of solid waste management in Sri Lanka Main Report‐ Kataragama Pradeshiya Sabha
22
5.2.2.3 Sellakataragama dumpsite
Sellakataragama is a small township belongs to KPS on Buttala‐kataragama highway. The
Sellakataragama township is located 4 km away from the Kataragama town, therefore MSW
collected in Sellakataragama area is dumped in a small dumpsite. The selllakataragama dumpsite has
also been used for few decays though the daily waste disposal amount is comparatively low.
As shown in Figure 5‐5, the site is managed without any environmental or health control measures.
Figure 5‐5 Sellakataragama dumpsite
5.2.2.4 Illegal dumpsite near Menik Ganga (river)
Kataragama PS operate a temporally dumpsite near Menik river during the surveyed duration
(October‐November, 2015). There are no records or formal evidence on the existence of this
dumpsite; however the site observation showed that at least 3‐5 tractor loads of waste are being
dumped at the site (Figure 5‐6).
Figure 5‐6 MSW dumpsite near the Menik Ganga‐ Kataragama
(30)

The data collection survey of solid waste management in Sri Lanka Main Report‐ Kataragama Pradeshiya Sabha
23
5.2.3 Waste receiving and disposal
None of the surveyed dumpsites has proper recording system to account number of waste loads
discharged at the site. Therefore, the waste discharged at each dumpsite was recorded for a one
week period and shown in .
Table 5‐2 Sources and quantities of waste disposed four dumpsites in Kataragama
Date Galapitayaya Composting facility Sellakataragama Devala
Tonnes per day
7‐Nov‐15 3.7 0.0 11.1 7.4
8‐Nov‐15 7.4 0.0 3.7 7.4
9‐Nov‐15 3.7 0.0 11.1 7.4
10‐Nov‐15 11.1 3.7 3.7 7.4
11‐Nov‐15 7.4 0.0 7.4 7.4
12‐Nov‐15 7.4 0.0 7.4 7.4
13‐Nov‐15 3.7 3.7 7.4 7.4
(31)

The data collection survey of solid
waste m
anagem
ent in Sri Lanka
Main Rep
ort‐ Kataragam
a Pradeshiya Sabha
24
5.2.4
Current condition of final disposal site and its surroundings
1
Current condition of final disposal site and its surroundings
1.1
Disposal
method
and
structure
All other M
SW collection veh
icles emptied
its waste at the dumpsite. No specific control measures apply for
selection of dumping area. Thus, Open Dumping is practiced.
All other wastes are dumped on the ground
1.2
Soil‐covering
Daily covering of waste by soil is not practiced
1.3
Land owner
Galapitayaya: ownership lies with Dep
artm
ent of Forest and Governmen
t Agent – Monaragala. There is a 10
acre land allocated for composting facility and for a future landfill developmen
t
Sellakataragama: ownership lies with Governmen
t Agent – Monaragala
Devala: ownership lies with M
aha Devala‐ Kataragam
a
Illegal dumpsite: o
wnership lies with M
aha Devala‐ Kataragam
a
1.4
Residual area
Galapitayaya: Approximately 2 hectares
Sellakataragama: A
pproximately 1 acre
Devala: Approximately 1 hectares
Illegal dumpsite: A
pproximately 1 acre
1.5
Leachate water
No leachate collection and treatment system
1.6
Waste picker
None
1.7
Scattering
waste,
smoke,
fire, offen
sive odor, anim
als
Waste is dumped in
the forest or bare lands
No fire and smoke witness at any dumpsite
Elep
hants are scavenging on Galapitayaya dumpsite
Cows and m
onkeys scavenging on Devala dumpsite
(32)

The data collection survey of solid
waste m
anagem
ent in Sri Lanka
Main Rep
ort‐ Kataragam
a Pradeshiya Sabha
25
5.2.5
Operation and M
anagement of final disposal site
2
Operation and M
anagement of final disposal site
2.1
Environmental
Protect
License
and
Environmental Clearance
None
2.2
Personnel
No site supervisors or labors available at any dumpsite
2.3
Operation vehicles, their maintenances
and
drivers
None
Kataragam
a PS has employed PS own backhoe loader and tractor for repairing the access
road
to the Galapitayaya dumpsite (~ 1 km). The soil backfilling workload
has been
estimated as 5 days.
2.4
Weighbridge
None
2.5
Waste collection data
None
2.6
Supervisory m
ethod
None
3.0
Waste amount to final disposal site (24 hours, 7
days)
A summary is shown in
Table 5‐2
4.0
Adverse im
pact nearby residen
ces
Galapitayaya: No residence around the dumpsite within 1.5 km radius
Sellakataragama: close proximity is about 200 m
from the dumpsite. Residences around
the dumpsite complain about flies and offen
sive odor
Devala: No residen
ce around the dumpsite within 500 m
radius.
Illegal dumpsite: No residen
ce around the dumpsite w
ithin 500 m
radius. However, the
dump site is very close to a bathing place of Men
ik Ganga
(33)

The data collection survey of solid
waste m
anagem
ent in Sri Lanka
Main Rep
ort‐ Kataragam
a Pradeshiya Sabha
26
2
Operation and M
anagement of final disposal site
5.0
Implemen
tation
status
of
geological,
topographic and EIA survey for
new final
disposal site
None
6.0
Progress situation for new
final disposal site
None
7.0
Court case
None
Cen
tral Environmen
tal A
uthority and Divisional Secretariat have made verbal complains
against the illegal dumpsite near Menik ganga. Kataragam
a PS is now excavating large soil
pits on the site to bury the waste.
(34)

Annex
KATARAGAMA PRADESHIYA SABHA
(35)

Response to Public Opinion Survey for Household Kataragama PS
Page 1 of 7
Response to Public Opinion Survey for Household
Sinhala
99%
Muslim
0%
Tamil
1% Other
0%
Ethnicity
Buddhist
99%
Islam
0%
Hindu
1%Christian
0% Other
0%
Religion
Garbage
collection5%
Storm water
drainage
34%Water
supply61%
Please specify the priority for your daily life regarding the improvement of the following
aspects?
Yes
44%No
56%
Are there garbage collection services in your area?
Yes36%
No64%
Do you use these services?
Placing
outside53%
Carrying
to collection
point25%
Carrying to
collection truck22%
Other0%
How is your garbage collected?
(36)

Response to Public Opinion Survey for Household Kataragama PS
Page 2 of 7
Response to Public Opinion Survey for Household
2‐25m94%
26‐50m
6%
51‐100m0%
100‐250m0%
>250m0%
Don't know0%
How far do you have to walk to reach this point?
Daily11%
> 4
times/Wk5%
2‐3 times/Wk
56%
Once/Wk13%
< Once/Wk
9%
Irregular4%
Don't know2%
How often is your garbage collected
Yes22%
No60%
Don't know18%
Is the garbage collection service done at a fixed time on the collection?
Very satisfied41%
Somewhat satisfied
39%
Less than satisfied
9%
Not satisfied at all11%
Are you satisfied with the collection service?
Not properly done29%
Frequency too low10%
Is irregular
18%Too early/ too late
16%
Bad workers'
behaviour3%
Workers demand allowance
0%
Allowance is expensive
0%
Service not fair8%
Point if too far
3%Other
13%
What are reasons for dissatisfaction?
(37)

Response to Public Opinion Survey for Household Kataragama PS
Page 3 of 7
Response to Public Opinion Survey for Household
Yes6%
No94%
Have you ever complained about the garbage collection service to the authorities in the last
three years?
Yes60%
No40%
Do you want to receive a garbage collection service? (only for persons who do not have garbage collection services in the area)
Discharge outside
13%
Specific place1%
Open dump25%
Request a collection truck0%
Self‐dispose
58%
Composting2%
Give for recycling0%
Other (collection
truck/ common bin)1%
How do you dispose off garbage generated in your premises?
As soon
as61%
Once daily28%
Once 2‐3 days10%
Less frequent
1%
How often do you dispose off garbage generated in your premises
Adult male
16%
Adult female84%
Servant0%
Other0%
Who mainly handles wastes at home?
(38)

Response to Public Opinion Survey for Household Kataragama PS
Page 4 of 7
Response to Public Opinion Survey for Household
Very much willing89%
Somewhat willing1%
Less
willing0%
Not willing3%
Doing
already7%
Willingness to cooperate in separate garbage collection system
Reduce landfill amount52%
Protect environm
ent47%
Can earn
money0%
Others1%
If you are willing to cooperate, why do you think recycling is important?
Yes
72%
No28%
Don't
know0%
Is there someone who comes around to collect or buy your reusable or recyclable materials?
Yes4%
No
96%
Do you take for recyclable materials to shops for refund or sale?
Yes13%
No87%
Are you using kitchen/garden waste for composting?
< Half43%
Half0%> Half
5%
All
52%
If you do composting, how much of kitchen waste used for composting?
(39)

Response to Public Opinion Survey for Household Kataragama PS
Page 5 of 7
Response to Public Opinion Survey for Household
< Half35%
Half0%
> Half0%
All65%
If you do composting, how much of garden waste used for composting?
Sell
5%
Own use
95%
What do you do with produced compost
Don’t like75%
Willing to pay
25%
Suppose that you are satisfied with the service of Municipal solid waste management, either as is or as a result of improvement. Think for a moment about the largest amount of
money that your household would be willing to pay each month as a garbage colle
Yes44%
No
54%
Don't
know2%
Do you have any community‐based organizations to solve not only the waste problems but also other community
problems? Yes8%
No
75%
Don't know17%
Have you ever discussed the methods of proper garbage handling and discharge at the
meetings
(40)

Response to Public Opinion Survey for Household Kataragama PS
Page 6 of 7
Response to Public Opinion Survey for Household
Yes62%
No38%
Have you ever been taught method of proper garbage handling & disposal?
Parents
18%
Communit
y21%
School
5%
Local Gov.
14%
Central Gov.1%
NGOs
1%
Others
40%
If you have learned , who taught proper garbage handling methods?
Very necessary100%
Somewhat necessary
0%
Not very necessary
0%Not
necessary at all0%
Do you think a campaign to raise awareness of people for maintaining the cleaner city and
environment is necessary?
(41)

Thamankaduwa PS 1.2
(43)この前に合紙 この前に合紙

The data collection survey of solid waste management in Sri Lanka Main Report‐ Thamankaduwa Pradeshiya Sabha
i
Table of content
1 Introduction .................................................................................................................................... 1
1.1 Background conditions of Thamankaduwa Pradeshiya Sabha ............................................... 1
2 Waste Composition Survey (WCS) .................................................................................................. 2
2.1 Methods of waste composition Survey .................................................................................. 2
2.1.1 Classification of Wastes at Disposal Facility .................................................................... 2
2.1.2 Sampling frequency ........................................................................................................ 2
2.1.3 Bulk‐Sampling for WCS ................................................................................................... 2
2.1.4 Measurement of physical composition........................................................................... 3
2.2 Waste composition survey results .......................................................................................... 4
3 Waste Generation Survey (WGS) .................................................................................................... 7
3.1 Waste Generation Survey Results ........................................................................................... 8
4 Public Opinion Survey (POS) ......................................................................................................... 12
4.1 Public opinion survey methodology ..................................................................................... 12
4.2 Results of Public Opinion Survey .......................................................................................... 13
5 Final disposal site survey (FDS) ..................................................................................................... 16
5.1 Introduction to the FDS at Thamankaduwa PS’s .................................................................. 16
5.1.1 Survey Method .............................................................................................................. 16
5.1.2 Target of Survey ............................................................................................................ 16
5.1.3 Data Sampling ............................................................................................................... 16
5.2 Current condition of final disposal site and its surroundings ............................................... 17
5.2.1 Final Disposal Site of Thamankaduwa PS ...................................................................... 17
5.2.2 Extend and landform ..................................................................................................... 17
5.2.3 Waste receiving and disposal ........................................................................................ 19
5.2.4 Site infrastructure facilities ........................................................................................... 19
5.2.5 Management of the dumpsite ...................................................................................... 20
5.2.6 Current condition of final disposal site and its surroundings ....................................... 22
5.2.7 Operation and Management of final disposal site ....................................................... 23
(44)
The data collection survey of solid waste management in Sri Lanka Main Report‐ Thamankaduwa Pradeshiya Sabha
ii
List of Tables
Table 2‐1 Summary results of MSW physical composition survey in Thamankaduwa PS ...................... 4
Table 3‐1 Type of data collected for WGS in Thamankaduwa PS ........................................................... 7
Table 3‐2 Household population (GN level) within Thamankaduwa PS area ......................................... 8
Table 3‐3 Type and number of municipal establishment own by Thamankaduwa PS ........................... 9
Table 3‐4 Number of government and privet institutions within Thamankaduwa PS ........................... 9
Table 3‐5 Type and number of business premises within Tamankaduwa PS area ............................... 10
Table 4‐1 Category and number of samples for Public Opinion Survey ............................................... 12
Table 4‐2 Average and standard deviation values of income and family size ...................................... 13
Table 5‐1 Data collected during the final disposal site survey ............................................................. 16
Table 5‐2 Daily waste disposal amount at Thamankaduwa site ........................................................... 19
Table 5‐3 Administration structure and human resources available at Sundarapola site ................... 20
Table 5‐4 Monthly operational cost of the dumpsite ........................................................................... 20
(45)

The data collection survey of solid waste management in Sri Lanka Main Report‐ Thamankaduwa Pradeshiya Sabha
iii
List of Figures
Figure 1‐1 Administrative map of Thamankaduwa PS area .................................................................... 1
Figure 2‐1 Sampling for WCS at TPS, (a) manually unloading the profile sample and (b) unloaded
sample ..................................................................................................................................................... 2
Figure 2‐2 Particle size reduction, mixing and preparation of working sample by coning & quartering
technique ................................................................................................................................................ 3
Figure 2‐3 Procedure of analysis of physical composition ...................................................................... 4
Figure 2‐4 Average physical composition of MSW in Thamankaduwa PS .............................................. 6
Figure 4‐1 Method of garbage discharge by residence in TPS area ...................................................... 14
Figure 4‐2 Willingness of residence for a source separated garbage collection system in
Thamankaduwa PS ................................................................................................................................ 15
Figure 5‐1 Location of Thamankaduwa PS's MSW dumpsite in Thamankaduwa ................................. 17
Figure 5‐2 Environment around the Thamankaduwa MSW disposal site ............................................ 18
Figure 5‐3 Protective measures to prevent elephants entering the site .............................................. 18
Figure 5‐4 Auxiliary MSW management facilities at Thamankaduwa dump site ................................. 20
Figure 5‐5 present status of Thamankaduwa disposal site .................................................................. 21
(46)

The data collection survey of solid waste management in Sri Lanka Main Report‐ Thamankaduwa Pradeshiya Sabha
1
1 Introduction
The purpose of this survey is to obtain the current data regarding Solid Waste Management (SWM)
at Thamankaduwa Pradeshiya Sabha (TPS). The data collection survey was conducted from 11th
November to 18th November, 2015 by a team of expert dispatched by Waste To Energy Technologies
Limited.
This report consists of brief summaries of survey methods and results. The additional primary data
and records are available as soft copies. The preliminary data collection was conducted through four
comprehensive surveys which are;
i. Waste Composition Survey (WCS) is to gather information on Physical Composition of MSW
collected by TPS.
ii. Waste Generation Survey (WGS) is to gather information on waste generation sources at
TPS based on secondary data available at TPS and other relevant organizations.
iii. Public Opinion Survey (POS) is gather information on public opinion on current waste
management in TPS. The POS was conducted through a questionnaire survey that covers
different types of waste generators in the TPS area.
iv. Final Disposal Site Survey (FDSS) is to collection data on final MSW disposal site of TPS
based on secondary data as well as field recordings & visits to the site.
1.1 Background conditions of Thamankaduwa Pradeshiya Sabha
Thamankaduwa is the major township in Pollonnaruwa District of North Central province of Sri Lanka.
The Thamankaduwa Pradeshiya Sabha is bordering to several other local authorities in Pollonnaruwa
District; Hingurakgoda PS, Lankapura PS and Elahera PS. Matale district lies on the south of
Thamankaduwa PS. At present, the Thamankaduwa Divisional secretariat is coincide with
Thamankaduwa PS area.
Thamankaduwa PS consists of few townships in Pollonnaruwa District; Pollonnaruwa new town,
Palugasdamana town and Kaduruwela town. Most of those townships were developed after the
Mahaveli Development project during mid 1980s.
The area of the TPS is about 445 km2 and major part of the PS area is covered with forest. The main
town is stretch on the Habarana‐Batticaloa highway on North West direction.
In general the topography is almost flat with well built irrigation reservoir & channel sytems and
navigable road system.
Thamankaduwa area has typical tropical climate with two rainy seasons occur; major during the
North East monsoons (October to December) and the minor rainy season occurs during the South
West monsoon (April and May). The period between the South West Monsoon and the North East
Monsoon is the dry season extending from June to September.
(47)

The data collection survey of solid
waste m
anagem
ent in Sri Lanka
Main Rep
ort‐ Tham
ankaduwa Pradeshiya Sabha
1
Figure 1‐1 Administrative m
ap of Th
aman
kaduwa PS area
(48)
The data collection survey of solid waste management in Sri Lanka Main Report‐ Thamankaduwa Pradeshiya Sabha
2
2 Waste Composition Survey (WCS)
The primary purpose of this survey is to ensure a standard approach to waste physical composition
analysis for the purposes of understanding the composition of waste delivered to final disposal
facility which was collected from TPS area. Information generated by WCAs will be useful to TPS as
well as administrators/policy makers to improve the efficiency and overall effectiveness of waste
management systems.
2.1 Methods of waste composition Survey
2.1.1 Classification of Wastes at Disposal Facility
This study was conducted to assess the physical composition of MSW samples collected from TPS
and delivered to the final disposal facility by collection vehicles.
2.1.2 Sampling frequency
The WCA was carried out for a full waste collection cycle starting from Monday (12th Thursday
November 2015) to Wednesday (18th November 2015).
2.1.3 Bulk‐Sampling for WCS
An effective WCA programme must be based on waste samples that are representative of the target
area as a whole (usually a whole local authority), be sufficient to take account of variation in waste
arising whilst also being affordable within the project budget. A good sampling strategy is essential
to achieving this difficult balance. Thus it is needed to ensure that a ‘good’ sample is obtained within
the constraints of time and cost.
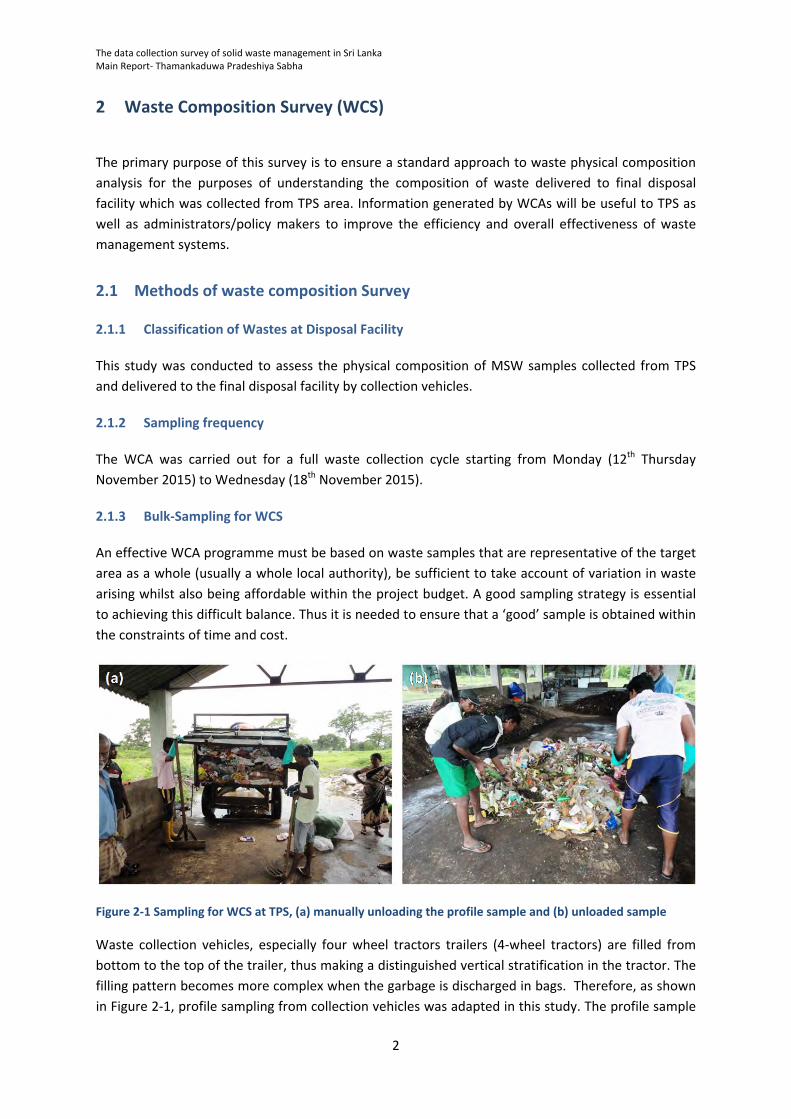
Figure 2‐1 Sampling for WCS at TPS, (a) manually unloading the profile sample and (b) unloaded sample
Waste collection vehicles, especially four wheel tractors trailers (4‐wheel tractors) are filled from
bottom to the top of the trailer, thus making a distinguished vertical stratification in the tractor. The
filling pattern becomes more complex when the garbage is discharged in bags. Therefore, as shown
in Figure 2‐1, profile sampling from collection vehicles was adapted in this study. The profile sample
(49)

The data collection survey of solid waste management in Sri Lanka Main Report‐ Thamankaduwa Pradeshiya Sabha
3
was taken from the back of the trailer, measuring at least 1/8 of the length of the trailer. Therefore,
the size of the composite sample was found to be varied from 100 and 150 kg.
Thereafter, all the large and over sized waste particles were manually shredded into smaller particles.
At the first round of shredding, larger particles were cut in to small the size particles with knife and
scissors (Figure 2‐2).
Figure 2‐2 Particle size reduction, mixing and preparation of working sample by coning & quartering technique
The size of the bulk sample was reduced to a workable size by Coning and Quartering technique.
Finally the sample was reduced to a more manageable size as the actual classification of materials
was carried out by hand. The Coning and Quartering technique involved the following:
a) The sample was placed on the floor and thoroughly mixed by shovel, manually.
b) The sample was then placed in a uniform pile of approximately 0.8 m high.
c) The pile was divided into four quarters using straight lines perpendicular to each other.
d) Either pair of opposite corners was removed to leave half the original sample.
e) The process was repeated three times until the desired sample was obtained.
2.1.4 Measurement of physical composition
2.1.4.1 Specific gravity of waste
To measure the bulk density of a sample, the following procedure was followed:
a) Weighed and recorded a volumetrically celebrated bucket of known volume (50 L)
b) Poured the sample into the bucket until it was overflowing
c) Settled the contents of the bucket by dropping it three times from a height of 10 cm
d) After settling the waste, waste‐filled bucket volume was measured
e) Weight the bucket and its contents was recorded
f) The bulk density was estimated by dividing the waste weight by filled volume, as kg/ m3.
(50)
The data collection survey of solid waste management in Sri Lanka Main Report‐ Thamankaduwa Pradeshiya Sabha
4
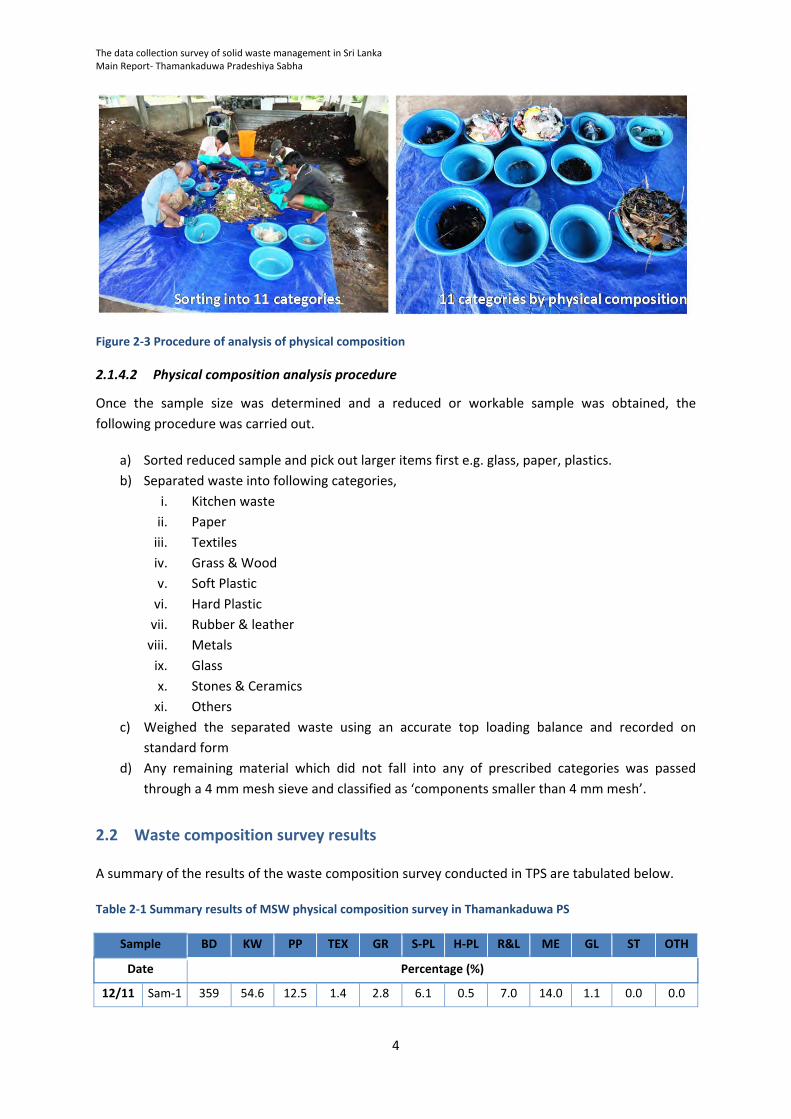
Figure 2‐3 Procedure of analysis of physical composition
2.1.4.2 Physical composition analysis procedure
Once the sample size was determined and a reduced or workable sample was obtained, the
following procedure was carried out.
a) Sorted reduced sample and pick out larger items first e.g. glass, paper, plastics.
b) Separated waste into following categories,
i. Kitchen waste
ii. Paper
iii. Textiles
iv. Grass & Wood
v. Soft Plastic
vi. Hard Plastic
vii. Rubber & leather
viii. Metals
ix. Glass
x. Stones & Ceramics
xi. Others
c) Weighed the separated waste using an accurate top loading balance and recorded on
standard form
d) Any remaining material which did not fall into any of prescribed categories was passed
through a 4 mm mesh sieve and classified as ‘components smaller than 4 mm mesh’.
2.2 Waste composition survey results
A summary of the results of the waste composition survey conducted in TPS are tabulated below.
Table 2‐1 Summary results of MSW physical composition survey in Thamankaduwa PS
Sample BD KW PP TEX GR S‐PL H‐PL R&L ME GL ST OTH
Date Percentage (%)
12/11 Sam‐1 359 54.6 12.5 1.4 2.8 6.1 0.5 7.0 14.0 1.1 0.0 0.0
(51)

The data collection survey of solid waste management in Sri Lanka Main Report‐ Thamankaduwa Pradeshiya Sabha
5
Sample BD KW PP TEX GR S‐PL H‐PL R&L ME GL ST OTH
Sam‐2 332 47.1 12.6 1.8 27.4 6.0 0.6 0.0 0.2 0.6 3.6 0.0
13/11 Sam‐1 307 46.8 19.7 0.8 19.0 10.5 2.1 0.7 0.1 0.0 0.3 0.0
Sam‐2 344 42.6 12.4 5.2 16.1 9.3 4.4 3.6 1.4 2.0 2.9 0.0
14/11 Sam‐1 444 60.6 16.3 3.1 9.7 6.7 1.6 0.0 0.0 0.3 1.1 0.6
Sam‐2 594 63.8 12.3 1.3 18.8 2.5 0.3 0.0 0.0 0.0 1.0 0.0
15/11 Sam‐1 257 49.2 23.4 3.3 6.6 6.9 3.6 0.0 3.7 0.0 3.4 0.0
Sam‐2 494 66.7 13.5 3.4 4.8 9.1 1.1 1.4 0.1 0.0 0.0 0.0
16/11 Sam‐1 402 70.0 14.9 1.2 8.0 5.1 0.7 0.1 0.0 0.0 0.0 0.0
Sam‐2 332 37.1 29.4 5.4 8.9 15.3 1.2 0.6 0.5 1.2 0.4 0.0
17/11 Sam‐1 369 66.5 15.6 1.7 9.5 4.6 0.5 1.2 0.3 0.0 0.0 0.0
Sam‐2 430 53.9 14.2 2.7 18.6 9.8 0.8 0.0 0.2 0.0 0.0 0.0
18/11 Sam‐1 375 54.8 21.0 0.4 14.3 7.1 0.8 0.0 0.3 0.7 0.6 0.0
Sam‐2 280 9.6 7.8 5.7 54.3 14.3 1.8 0.1 1.1 0.6 4.5 0.1
Average 380 51.7 16.1 2.7 15.6 8.1 1.4 1.1 1.6 0.5 1.3 0.0
Stranded Deviation
89 15.6 5.5 1.8 13.0 3.6 1.2 2.0 3.7 0.6 1.6 0.2
Mean Error 23 4.0 1.4 0.5 3.4 0.9 0.3 0.5 1.0 0.2 0.4 0.0
Median 364 54.3 14.5 2.2 12.0 7.0 0.9 0.1 0.2 0.2 0.5 0.0
BD‐ Bulk density (kg m‐3), KW‐ Kitchen waste, PP‐ Paper, TEX‐ Textile, GR‐Grass & wood, S‐Pl‐ Soft plastics, H‐PL‐ Hard plastics, R&L‐ Rubber & leather, ME‐ Metal, GL‐ Blass & bottles, ST‐ Stones & ceramics, OTH‐ Other
The analysis showed that the amount of food & kitchen waste is making up the bulk (51.7 %). The
amount of garden waste in the collection is also on average range is about 15.65. The average waste
composition derived from the 14 samples is shown in Figure 2‐4.
(52)
The data collection survey of solid waste management in Sri Lanka Main Report‐ Thamankaduwa Pradeshiya Sabha
6
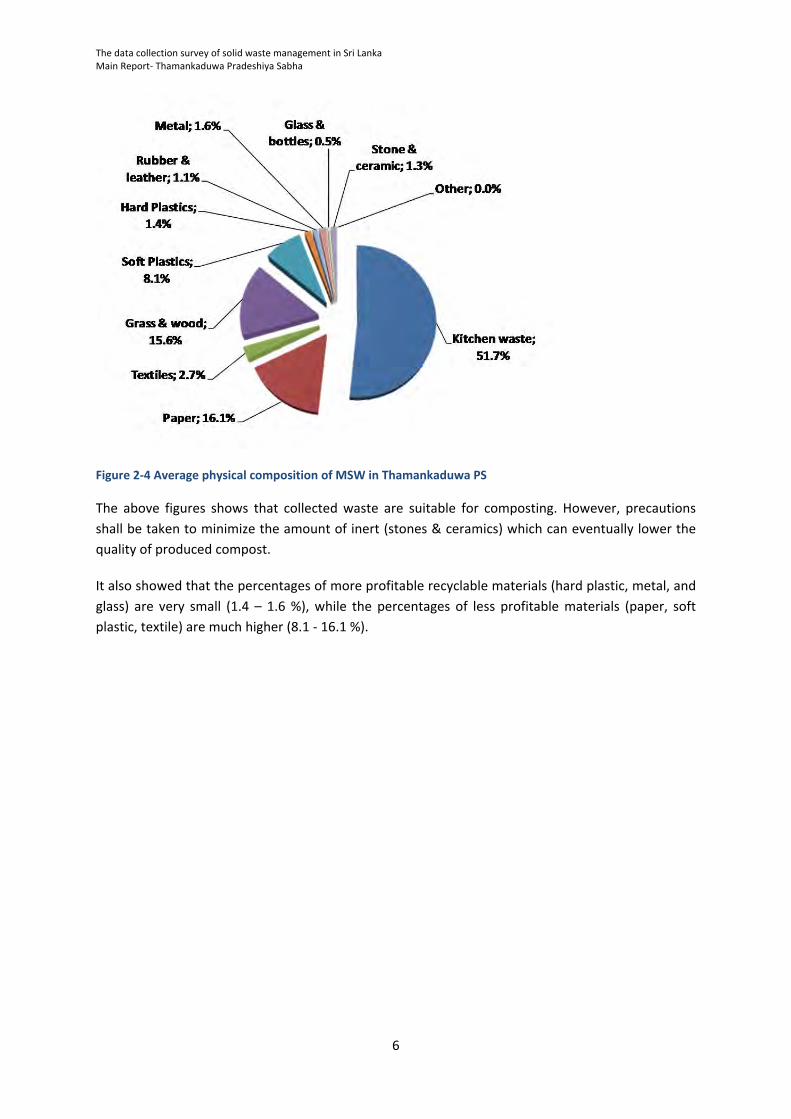
Figure 2‐4 Average physical composition of MSW in Thamankaduwa PS
The above figures shows that collected waste are suitable for composting. However, precautions
shall be taken to minimize the amount of inert (stones & ceramics) which can eventually lower the
quality of produced compost.
It also showed that the percentages of more profitable recyclable materials (hard plastic, metal, and
glass) are very small (1.4 – 1.6 %), while the percentages of less profitable materials (paper, soft
plastic, textile) are much higher (8.1 ‐ 16.1 %).
(53)

The data collection survey of solid waste management in Sri Lanka Main Report‐ Thamankaduwa Pradeshiya Sabha
7
3 Waste Generation Survey (WGS)
In order to obtain general information on waste generation amounts, the data available at waste
management section of the Health Department, Works Department and Revenue Department of TPS
was used. Some of the data was available in the form of formal records and reports which were
treated as the most precise secondary data while the data collected from official interviews with TPS
officers was treated as verification data. Thus, the survey data was collected through different
methods;
a) Recording and compiling of published and verified data by TPS,
b) Reading and recording of unpublished & non‐confidential data available at TPS,
c) Recording and official statistics available at District Secretariat, Thamankaduwa Divisional
Secretariat offices, and
d) Official person‐to‐person interview with relevant officers at TPS for verification of data.
The numerical data was collected as specified in following Table 3‐1.
Table 3‐1 Type of data collected for WGS in Thamankaduwa PS
Source Description
Household Each number of following category households was surveyed;1) High income level, 2) Middle income level and 3) Low income level.
Commercial Each number of following category restaurants was surveyed;1) Large size restaurants, 2) Middle size restaurants and 3) Small size restaurants. Each number of following category shops was surveyed; 1)Organic shops (large) 2)Organic shops (middle) 3)Organic shops (small) 4)Non‐Organic shops (large) 5)Non‐Organic shops (middle) 6)Non‐Organic shops (small)
Hotels Each number of following category hotels was surveyed;1) Large size hotels 2) Middle size hotels and 3) Small size hotels.
Markets Number of stalls and types
Institutions Each number of following institute was surveyed;1) Schools 2) Hospitals (government) 3) Hospitals (private) 4) Public office 5) Bank/private office 6) Buddhist temples 7) Hindu temples 8) Mosques 9) Churches 10) Navy/Police/ Army bases
(54)
The data collection survey of solid waste management in Sri Lanka Main Report‐ Thamankaduwa Pradeshiya Sabha
8
Source Description
11) Others
Industries Wastes from any industries.
Other Public parks and other public facilities
Construction and demolition
Wastes originating from construction, rehabilitation and demolition activities, etc.
Hazardous (Special)
Management and collection of hazardous wastes originating from various sources, including household items
3.1 Waste Generation Survey Results
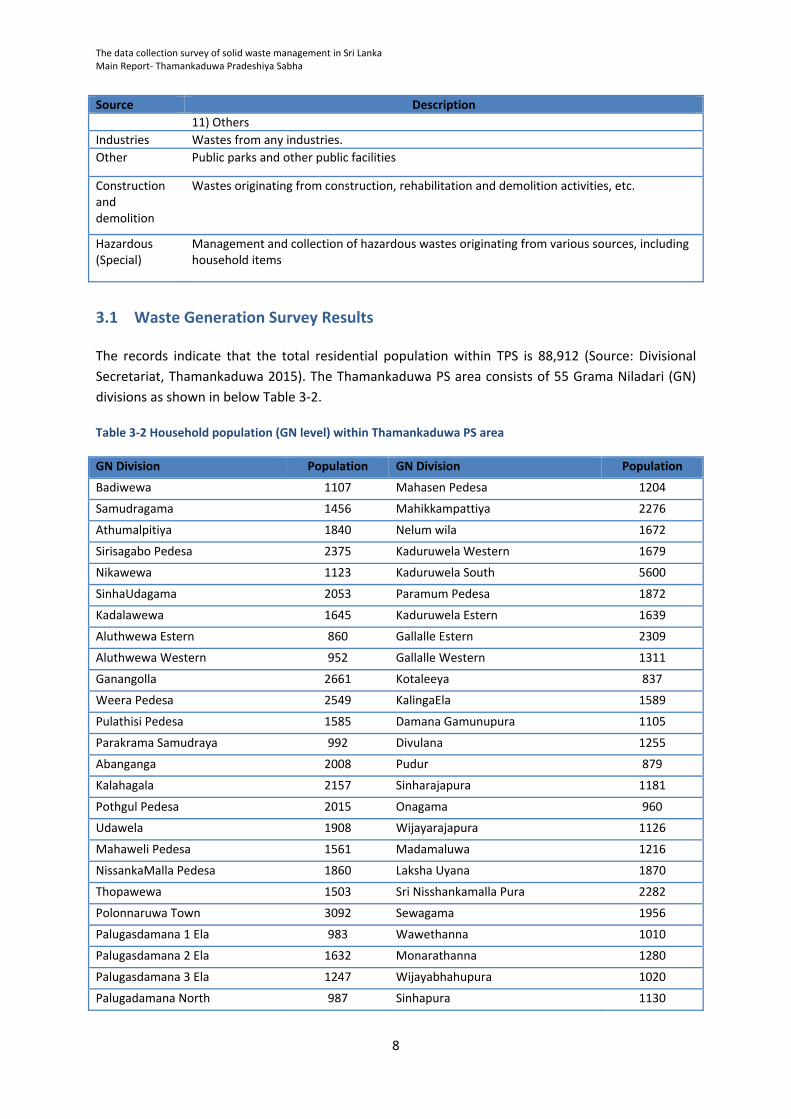
The records indicate that the total residential population within TPS is 88,912 (Source: Divisional
Secretariat, Thamankaduwa 2015). The Thamankaduwa PS area consists of 55 Grama Niladari (GN)
divisions as shown in below Table 3‐2.
Table 3‐2 Household population (GN level) within Thamankaduwa PS area
GN Division Population GN Division Population
Badiwewa 1107 Mahasen Pedesa 1204
Samudragama 1456 Mahikkampattiya 2276
Athumalpitiya 1840 Nelum wila 1672
Sirisagabo Pedesa 2375 Kaduruwela Western 1679
Nikawewa 1123 Kaduruwela South 5600
SinhaUdagama 2053 Paramum Pedesa 1872
Kadalawewa 1645 Kaduruwela Estern 1639
Aluthwewa Estern 860 Gallalle Estern 2309
Aluthwewa Western 952 Gallalle Western 1311
Ganangolla 2661 Kotaleeya 837
Weera Pedesa 2549 KalingaEla 1589
Pulathisi Pedesa 1585 Damana Gamunupura 1105
Parakrama Samudraya 992 Divulana 1255
Abanganga 2008 Pudur 879
Kalahagala 2157 Sinharajapura 1181
Pothgul Pedesa 2015 Onagama 960
Udawela 1908 Wijayarajapura 1126
Mahaweli Pedesa 1561 Madamaluwa 1216
NissankaMalla Pedesa 1860 Laksha Uyana 1870
Thopawewa 1503 Sri Nisshankamalla Pura 2282
Polonnaruwa Town 3092 Sewagama 1956
Palugasdamana 1 Ela 983 Wawethanna 1010
Palugasdamana 2 Ela 1632 Monarathanna 1280
Palugasdamana 3 Ela 1247 Wijayabhahupura 1020
Palugadamana North 987 Sinhapura 1130
(55)

The data collection survey of solid waste management in Sri Lanka Main Report‐ Thamankaduwa Pradeshiya Sabha
9
GN Division Population GN Division Population
Palugadamana South 1642 Unagalawehera 1041
Galthabharawa 1029 Shanthipura 1431
Kuruppu Junction 1360
As shown in following, Thamankaduwa PS own and control a number of public properties and
institutes.
Table 3‐3 Type and number of municipal establishment own by Thamankaduwa PS
Public property No of Units Public property No of Units
Libraries 5 Aryurvedha Dispensaries 3
Reading centres 1 Quarters 4
Municipal parks 1 Crematorium 1
Play grounds 5 Fire distinguish unit buildings 1
Market complexes 2 Solid waste Management Centres 1
Cemetery 24 Shop rooms 34
Bus stand complexes 1 No of rent out shop rooms 240
Slaughter house 1 Buildings 8
Fish stalls 9 Buddhi maddapaya 1
Meat stalls 3 Pradeshiya Sabah gathering hall 1
Public toilets 7 Cinema 1
Pola premises 2 Community centres 8
Community centres 6 Common water taps 12
Preschools 3 Bathing Places 3
Thamankaduwa city host most of the government and privet sector institutes in the Polonnaruwa
District. Following Table 3‐4 shows the number of government and privet/non‐government
establishments within Thamankaduwa PS.
Table 3‐4 Number of government and privet institutions within Thamankaduwa PS
Type of institute No of units Type of institute No of units
Government Privet
Schools 52 Hospitals 4
Higher education institutes 9 Banks 9
Hospitals 1 Aruradic dispensaries 13
Hospitals ‐ Clinics 5 Insurance and Finance 19
District Secretariat office 1 Sport clubs 32
Divisional secretary offices 1 Cultural centres 1
Banks 16 Art institutes 21
Main Post offices 2 Video halls 5
Sub. Post offices 17 Other
(56)

The data collection survey of solid waste management in Sri Lanka Main Report‐ Thamankaduwa Pradeshiya Sabha
10
Type of institute No of units Type of institute No of units
Police stations 2 Civil Security Committees 55
Court 1 Sport clubs 32
Agrarian Service Centres 2 Youth and sport societies 95
Other government institutes 446 Youth societies 55
Religious Cultural Centres 1
Buddhist temples 41 Play grounds 41
Hindu Kevil's 1 Gymnasiums 10
Mosques 22 Town halls 2
Churches 5 Community halls 85
Dharma Schools 41
A major portion of MSW is generated from commercial sector in the city. Following Table 3‐5 shows
the number of different commercial (business) establishments in TPS area.
Table 3‐5 Type and number of business premises within Tamankaduwa PS area
Type of business No of units
Type of business No of units
Middle size restaurants 53 Paint sale 19
Small size restaurants 99 Well rings and anicut tubes sales 1
Canteens and tea shops 85 Building blocks sales 3
cool drinks and fruit juice 12 Flower pot and floor tiles (concrete) sale 12
Vegetable/ Fruit shops (large) 30 Ornamental fish 3
Retail shops 709 Fish raring accessories 1
Glossary shops 52 Sweeping ticket sale 8
General wholesale shops (large) 21 Drinking water sale 3
Textile trading shops (large) 108 Book shops 3
Furniture sales shops 14 Stationary 45
Vehicle spare parts 18 News paper, magazine 12
Bicycle spare parts 4 School items 27
Fish sales stalls 5 Jewellery 26
Barber shops 33 CCTV 1
Pharmacy (clinics and pharmacy)
18 Building material sales 33
Bars 5 Cement sales 18
Sweets 16 Roof tiles sales 1
Ice‐cream and yogurt 6 Lime powder sale 3
milk sales 3 Hotels
Curd 3 Large size hotels 8
Freeze Chicken 47 Middle/ small size hotels 60
Chick pea 3
Soup 9 Industries
Wood Carvings 1 Bakery products 30
(57)

The data collection survey of solid waste management in Sri Lanka Main Report‐ Thamankaduwa Pradeshiya Sabha
11
Type of business No of units
Type of business No of units
Clock sales 1 Furniture 10
PVC pipe sales 3 Chilli mills 21
washing machine sales 3 Rice mills 204
Gem sales 4 Grain mills 14
Radio and TV spare parts 5 coconut mills 9
Electric and Furniture sale 19 Granite mills 1
Gas sales 20 Granite plate mills 1
Motor vehicle sales 6 Granite workshop 2
Bicycle sales 5 Granite production 15
Tinker and Spray 1 Saw mills 18
Motorcycle 13 Joss stick production 5
Nuts and bolts sale 1 Soap production 2
Tyre and tube 10 Lamp drapery (Pahan thira) 1
Motorcycle spare parts 6 Souvenir production 2
Hand tractor spare parts 2 Notice board production and preparation 3
Computer sales 11 Jewellery manufacturing 13
Computer spare parts 6 Gem products 2
Battery sales 6 Textile various 3
Agrochemical sales 10 Ready made garments 82
wood sales 9 Fruit processing 4
Wood furniture 7 Sweets production 66
Wedding invitation sale 1 Agricultural tools and equipment manufacturing
22
Festival items 8 Wood ware manufacturing 42
Fishing tools 1 Cement products 33
Offerings 2 Leather products 2
Glass sale 1 Welding smithies 65
All goods 5 Roof tiles and tiles production 28
Plastic goods 7 Pottery production 28
shoes sales 27 Coir products 9
Cushion 6 Ornamental goods production 12
Sales items 5 Yoghurt production 4
DVD and Video sales 12 Ice‐cream production 3
Mobile sales 30 Curd production 25
Mobile cards 1 Milk bottling 2
Glass 10 Communications 35
Asbestos sale 5 Mobile telephone repair 10
(58)

The data collection survey of solid waste management in Sri Lanka Main Report‐ Thamankaduwa Pradeshiya Sabha
12
4 Public Opinion Survey (POS)
This Public Opinion Survey (POS) was commissioned to identify a range of household waste
management matters in relation to the household sector. Information on household waste
management practices and information on householders’ experiences with waste collection delivery
services was collected for the purpose of improving our understanding of householder’s experiences
and attitudes and also to better understand prevailing situation in householder’s point of view. The
purpose of this survey research included;
a. To collect information on public attitudes to the waste management and environment in
broader,
b. To value aspects of environmental health and protection,
c. To provide information on experiences with Local Authority’s waste management service
and,
d. To provide information on household waste management practices.
4.1 Public opinion survey methodology
The number of samples from Thamankaduwa identified as 200 households, but size of the sample
increased to 206 during the implementation to increase the accuracy. The selection of households
and areas within Thamankaduwa PS was done after a consultative discussion with Municipal
commissioner, MSW section officers at TPS and JICA expert team members.
The survey was executed by a team of university students who were trained about the questionnaire,
survey methodology and the data entering before dispatched to their respective fields. A senior
expertise took the leadership and continuously supervised the field survey. The selected households
were first educated about the survey, its main objectives and asked their cooperation before starting
the field survey. In addition business and institutes, large waste generators, hospitals recycling shops
and large public markets were also surveyed using appropriate questionnaires prepared in
consultation with JICA experts.
Table 4‐1 Category and number of samples for Public Opinion Survey
Category Survey area Number of samples
High‐income households Nissankamallapura, Nuwara Rd, Circular Rd, Wewa Rd, New Town
28
Middle‐income Households Circular Rd, Dakunu Ela Rd, Wasundara RD, Lake Rd, Nissankamallapura
71
Low‐income Households Circular Rd, Arama Rd, WasundaraRd, New Town Rd, Bediwewa
51
Businesses /Service organization New Town, Pollonnaruwa, Thopawewa,
37
Large waste generators 12
Hospitals 2
Markets 2
(59)

The data collection survey of solid waste management in Sri Lanka Main Report‐ Thamankaduwa Pradeshiya Sabha
13
Category Survey area Number of samples
Recycling shops 2
NGO 1
Total 206
The questionnaires were available in all languages (English/Sinhala/Tamil); however the
questionnaire form was filled by the interviewer based on interviewees’ response. The collected
information was recorded in digital form using Microsoft Excel and reviewed for accuracy. The data
was analyzed in detail for different objectives that generate an overview of the survey.
4.2 Results of Public Opinion Survey
97% of the surveyed households are Tamil with only 3 % Muslims. Data on the average
number of people per household and monthly income is set out in below Table 4‐2.
Table 4‐2 Average and standard deviation values of income and family size
Category Family size Income (Rs/month)
High 4.4 ± 0.8 61,500 ± 9,965
Middle 4.3 ± 1.3 35,451 ± 6,594
Low 4.5± 1.3 16,569 ± 5,917
No of workers Income (Rs/month)
Business 3.0 ± 2.2 963,919 ± 3,904,081
In Thamankaduwa PS, only 55 % of surveyed households are provided with a garbage
collection service, of which only 68% stated they use this service. Only 35 % of surveyed
households are “very satisfied” with present SWM service provision, while 53 % are
“somewhat satisfied”.
(60)

The data collection survey of solid waste management in Sri Lanka Main Report‐ Thamankaduwa Pradeshiya Sabha
14
Figure 4‐1 Method of garbage discharge by residence in TPS area
Households’ main methods of waste discharge are shown in Figure 4‐1. The most common
methods are discharging it outside their premises for house to house collection (47 %) and
carrying garbage to collection truck (32%), and 21% residence disposed waste at designated
disposal points.
Only 6% of surveyed households receive a daily garbage collection service while 35 % stated
that they received the service once/week while 51% received the service 2‐3 times/week.
However, 64% discharge their garbage as soon as it is generated and 34 % discharge their
garbage daily, the gap between discharge and collection being slightly greater for the
residence far away from city center. The discrepancy between these figures explains the
large amount of discarded garbage present on many streets around Thamankaduwa.
In general, adult females handle waste in about 53 % of surveyed households.
As shown in Figure 4‐2, 48 % of surveyed households are practice source separation. And
also, only 91 % of surveyed households stated that there are recyclable collectors or
someone who comes to collect their reusable or recyclable materials. Hence, an informal
source separation recycling system is not well established in Thamankaduwa PS area.
Placing outside47%
Carrying to collection point21%
Carrying to collection truck32%
Other0%
How is your garbage collected?
(61)

The data collection survey of solid waste management in Sri Lanka Main Report‐ Thamankaduwa Pradeshiya Sabha
15
Figure 4‐2 Willingness of residence for a source separated garbage collection system in Thamankaduwa PS
Only 23 % of surveyed households use kitchen/garden waste for composting and used the
finished compost for their own garden.
Only 31% of households have ever discussed proper garbage discharge methods at the
community level.
96 % households stated that SWM awareness programmes are very necessary while rest of
4 % stated “somewhat necessary”.
The average WTP (willingness to pay) for improved SWM services is 56 ± 76 Rs/month per
household. However 49 % of household do not like to pay for SWM service.
Out of all surveyed households, 24 % stated that they sale/give‐off metal for recycling and
12 % of residence sale/give‐off tins & cans for recycling. The glass and bottle recycling is
practiced by 26 % of households while the plastic recycling is 8 %. Percentage of household
who involved in paper recycling was low (11 %).
Very much willing35%
Somewhat willing6%
Less willing4%
Not willing7%
Doing already48%
Willingness to cooperate in separate garbage collection system
(62)

The data collection survey of solid waste management in Sri Lanka Main Report‐ Thamankaduwa Pradeshiya Sabha
16
5 Final disposal site survey (FDS)
5.1 Introduction to the FDS at Thamankaduwa PS’s
5.1.1 Survey Method
The data and information in this report were collected from various sources including published
reports, verified data from Thamankaduwa Pradeshiya Sabha, and direct interview with responsible
authorities at disposal site.
5.1.2 Target of Survey
The survey is focus on obtaining general information on waste receiving, handling, disposal, facility
management, environmental monitoring and legal adherences.
5.1.3 Data Sampling
The numerical data was collected as specified in following Table 5‐1.
Table 5‐1 Data collected during the final disposal site survey
Survey Items Method
1 Current condition of final disposal site and its surroundings
Disposal method and structure Records, visual observation
Soil‐covering Records, visual observation
Land owner Records
Residual area Records, visual observation
Leachate water Records, visual observation
Waste picker Records, visual observation, interview
Scattering waste, smoke, fire, offensive odour, animals and so on
Records, visual observation
2 Operation and Management of final disposal site
Environmental Protect License and Environmental Clearance
Record
Personnel Records, interview
Operation vehicles, their maintenances and drivers Records, interview
Weighbridge Records, interview
Waste collection data Records, interview
Supervisory method Records, interview
3 Waste amount to final disposal site (24 hours, 7 days) Records, Survey
4 Adverse impact near by residences Records, Survey
5 Implementation status of geological, topographic and EIA survey
for new final disposal site
Records, interview
6 Progress situation for new final disposal site Records, interview
7 Court case Records, interview
(63)

The data collection survey of solid waste management in Sri Lanka Main Report‐ Thamankaduwa Pradeshiya Sabha
17
5.2 Current condition of final disposal site and its surroundings
5.2.1 Final Disposal Site of Thamankaduwa PS
Final disposal site is located in Gallella, about 8.5 km away from the Polonnaruwa town on
Polonnaruwa‐Batticalloa main road. The site lies within Kotaleeya GN division of Thamankaduwa
Divisional Secretariat Division in Polonnaruwa District of the North‐Eastern Province of Sri Lanka.
The final disposal site is situated close to the National Livestock Development Board (NLDB) premises
500 m away from the Pollonnaruwa‐ Baticaloa highway. The final disposal site is scrub forest lands
extend to Mahaveli Forest Reserve along the lower Mahaveli River catchment.
The site is bordering to staff quarters of Milco‐NLDB factory on North, residential areas on East and
other sides to the Forest.
Figure 5‐1 Location of Thamankaduwa PS's MSW dumpsite in Thamankaduwa
5.2.2 Extend and landform
At present, a 1.621 hectare land has been allocated for the dumpsite by Department of Forestry and
Wildlife.
Except the residential areas, surrounding area is covered with shrubs and forest vegetation. The site
is at the edge of a major forest reserve in dry zone of Sri Lanka; therefore scavenging of wild
elephants is the major thread to Wildlife in the forest, among many other environmental problems
associated with the site. Thus, Department of wildlife has recently built an electric fence around the
dumpsite in addition to a 3 m deep, 2 m wide and 500 m long soil trench along the periphery of the
(64)

The data collection survey of solid waste management in Sri Lanka Main Report‐ Thamankaduwa Pradeshiya Sabha
18
site. However, it was observed that elephants enter the site breaking the trenches and even the
electric fence.
Figure 5‐2 Environment around the Thamankaduwa MSW disposal site
The landform is a flat terrain except the areas where the trench & bunds were built.
Figure 5‐3 Protective measures to prevent elephants entering the site
(65)

The data collection survey of solid waste management in Sri Lanka Main Report‐ Thamankaduwa Pradeshiya Sabha
19
5.2.3 Waste receiving and disposal
The available records show that Thamankaduwa PS delivers approximately 7 to 18 tonnes of MSW to
the site. In addition, on average, 24 m3/month of toilet waste is also emptied at the site.
Table 5‐2 Daily waste disposal amount at Thamankaduwa site
Survey date 4‐wheel tractor Tipper truck Total
Tonnes/ day
12/11/2015 11.8 2.2 13.9 13/11/2015 9.4 4.3 13.7 14/11/2015 7.1 2.2 9.2 15/11/2015 7.1 0.0 7.1 16/11/2015 9.4 8.6 18.0 17/11/2015 7.1 8.6 15.7 18/11/2015 9.4 2.2 11.6
There is no formal recyclable collection system established in TPS area. However, residences are
request to sort the waste at household level. The delivery of segregated waste is doe through
normal collection, thus unloading of segregated waste at the dumpsite is difficult. Thus, workers
dumped all the waste at the dumpsite, unless otherwise recyclable wastes are packed in large plastic
bags.
The highly organic waste generated from weekly Pola and market areas are filled into the large
biogas reactors. However, the reactors are not functioning well, thus it is practice as strategy to
prevent elephant entering the site for scavenging on food & vegetable waste.
5.2.4 Site infrastructure facilities
The integrated site includes a composting facility, recyclable storing facility and large scale biogas
reactors (4 tanks) as auxiliary waste management facilities.
However, the biogas facility is not operated properly due to technical problems associated with
design and maintenance. Therefore, the reactors are used as temporally anaerobic digesters for food
& vegetable waste.
The composting facility does not have adequate space for operation thus compost production is very
limited.
The recyclable storing facility is used for storing marketable recyclables. The collected materials are
sold as bulk through open tenders, once a reasonable quantity is collected.
In addition, the site has a security gate, office building with workers rest room and basic site services
such as electricity and water supply.
(66)

The data collection survey of solid waste management in Sri Lanka Main Report‐ Thamankaduwa Pradeshiya Sabha
20
Figure 5‐4 Auxiliary MSW management facilities at Thamankaduwa dump site
5.2.5 Management of the dumpsite
At present, the dumpsite management is done by PS workers stationed at the site. Following table
show the management structure and human resources at the Thamankaduwa dumpsite.
Table 5‐3 Administration structure and human resources available at Sundarapola site
Human resources Number of persons
Municipal Secretary (Administration) 1
Public Health Inspector (Administration) 1
Resident site officers
Site supervisors –(Permanent position) 1
Men labours–(Permanent position) 3
Women Labour ‐ (Permanent position) 1
Security guard ‐Day time (Permanent positions) 1
Security guards –Night (Permanent position) 1
The daily machine and labor operation records are available at the site office. The records showed
that the site operation cost nearly Rs. 286,000 per month, excluding direct wages for supervisor and
security personals.
Table 5‐4 Monthly operational cost of the dumpsite
Item Backhoe loader Tractor Loader & mover Grass Cutter Bulldozer Total
Rs / month
(67)

The data collection survey of solid waste management in Sri Lanka Main Report‐ Thamankaduwa Pradeshiya Sabha
21
Fuel 33,199 36,187 402 None
Insurance/Revenue 385 Not paid None
Repair/Service 17,581 12,717 80 None
Rental fee ‐ ‐ ‐ 9000
Operators Salary 34,800 33,800 None None
Monthly Amount 85,965 82,704 482 9000
Working factor for final disposal site
20% 50% 100% 100%
Total Cost 17,193 41,352 482 9000 286,131
Figure 5‐5 present status of Thamankaduwa disposal site
(68)

The data collection survey of solid
waste m
anagem
ent in Sri Lanka
Main Rep
ort‐ Tham
ankaduwa Pradeshiya Sabha
22
5.2.6
Current condition of final disposal site and its surroundings
1
Current condition of final disposal site and its surroundings
1.1
Disposal m
ethod and structure
Incoming waste loads (tractors, trucksand gully bowsers) are recorded
at the en
trance gate.
Selected
veh
icles which contain food & vegetable wastes are unloaded
into biogas reactors (1 tractor load/day)
All other M
SW collection veh
icles em
ptied
its waste at the dumpsite. No specific control m
easures apply for selection of
dumping area. Thus, Open
Dumping is practiced
.
Site supervisor explained
that the Tham
ankaduwa PS em
ploys bulldozer when
there is a req
uirem
ent for leveling the
waste. A privately own bulldozer is ren
ted out for 1‐2 days every month. In addition a tractor loader &
mover is also
employed at site for waste handling every other day.
Sewage is discharged to a shallow pit excavated
on the dump
1.2
Soil‐covering
Covering of waste by soil is not practiced
1.3
Land owner
Tham
ankaduwaPSthe ownership of the land
1.4
Residual area
Approximately50% of the allocated 1.621ha area has already been covered with waste
1.5
Leachate water
No leachate collection and treatmen
t system
Leachate and surface water flow towards the forest through
the dredged channel
Many sm
all leachate ponds and pits ( 1‐5 m
2) are scattered on the dump site
Sewage is discharged to pits excavated on the dump
1.6
Waste picker
None
1.7
Scattering waste, sm
oke, fire,
offen
sive odor, anim
als
Waste is dumped
everywhere on the dumping site
Polythen
e, papers and other soft m
aterials have blown all over the area by the wind. Polythen
e and soft plastic bags
have blown m
ore than
few
hundred m
eters aw
ay from the site and dep
osited on trees in
forest.
Labors set fire on selected waste (garden
waste/ textile waste/ paper waste) within the dumpsite
The fly breed
ing is a problem throughout the year
There are more than
50 stray dogs reside in the dump site
(69)

The data collection survey of solid
waste m
anagem
ent in Sri Lanka
Main Rep
ort‐ Tham
ankaduwa Pradeshiya Sabha
23
5.2.7
Operation and M
anagement of final disposal site
2
Operation and M
anagemen
t of final disposal site
2.1
Environmen
tal Protect License and Environmen
tal
Clearance
None
2.2
Personnel
1‐Supervisor –M
orning (Permanen
t position)
3‐M
en labors (Permanen
t position)
1‐W
omen
labor (Permanen
t position)
1‐Security guard for day tim
e (Permanen
t position)
1‐ Security guard for night time (permanen
t position)
2.3
Operation veh
icles, their maintenances and drivers
Tractor loader/ mover (curren
tly out of order and on rep
airs)
(A Bulldozer is hired
every 6 m
onths for 10‐12 hours)
TPS own backhoe loader is used to unload
waste from biogas tank. W
ork load
is 50‐60
hours/m
onth
2.4
Weighbridge
None
2.5
Waste collection data
A record book is available
2.6
Supervisory m
ethod
Municipal Secretary do the overall supervision
Public Health Inspector(PHI)‐ 1 nos
Those three officers are regularly inspecting the site and instruct the site supervisor for necessary
actions. Officer‐in‐charge is responsible for coordinating with m
unicipal officers for solving daily
managem
ent issues as well as other contingency m
atters.
Site supervisor is responsible for daily operation and labor control
3.0
Waste amount to final disposal site (24 hours, 7
days)
A summary is shown in
Table 5‐2
4.0
Adverse im
pact nearby residen
ces
Odor problem
Fly problem
(70)

The data collection survey of solid
waste m
anagem
ent in Sri Lanka
Main Rep
ort‐ Tham
ankaduwa Pradeshiya Sabha
24
2
Operation and M
anagemen
t of final disposal site
Elep
hant roam
ing around the dumpsite pose a threat on nearby residen
ce
Scattering of materials by wind is a problem for residen
ce around the dumpsite
5.0
Implemen
tation status of geological, topographic and
EIA survey for new
final disposal site
None
6.0
Progress situation for new
final disposal site
None
However, a project rep
ort including the estimate for Im
provemen
ts to the solid
waste
managem
ent center has been submitted to Tham
ankaduwa DS office, Dep
artm
ent of wildlife and
Cen
tral Environmen
tal A
uthority for possible funding. The project evaluation is in
progress. The
total estim
ated
cost for project is Rs. 14.7 m
illion as follows.
i. Proposed composting Shed
– 6,023,819.31
ii.
Internal Road
construction ‐ 5,671,308.00
iii.
Proposed shorted
Roof ‐ 255,090.00
iv.
Proposed toilet facility ‐ 1,503,751.78
v.
Contingencies ‐ 1,345,396.91
vi.
Total Estim
ate (Rs) ‐14,799,366.00
7.0
Court case
None
(71)

Annex
THAMANKADUWA PRADESHIYA SABHA
(72)

Response to Public Opinion Survey for Household Thamankaduwa PS
Page 1 of 7
Response to Public Opinion Survey for Household
Sinhala97%
Muslim
3%
Tamil0% Other
0%
Ethnicity
Buddhist
93%
Islam4%
Hindu0%
Christia
n 3%
Other
0%
Religion
Garbage collectio
n49%Storm
water45%
Water supply6%
Please specify the priority for your daily life regarding the improvement of the
following aspects?
Yes55%
No45%
Are there garbage collection services in your area?
Yes68%
No32%
Do you use these services?
Placing
outside47%
Carrying to
collection
point21%
Carrying
to collection
truck32%
Other
0%
How is your garbage collected?
(73)

Response to Public Opinion Survey for Household Thamankaduwa PS
Page 2 of 7
Response to Public Opinion Survey for Household
2‐25m82%
26‐50m14%
51‐100m2%
100‐250m0%
>250m2%
Don't know0%
How far do you have to walk to reach this point?
Daily
6%> 4
times/Wk0%
2‐3
times/Wk51%
Once/Wk
35%
<
Once/Wk0%
Irregular
7%
Don't
know1%
How often is your garbage collected?
Yes
47%No
46%
Don't
know7%
Is the garbage collection service done at a fixed time on the collection?
Very satisfied35%
Somewha
t satisfied53%
Less than
satisfied11%
Not satisfied at all
1%
Are you satisfied with the collection service?
Not properly done21%
Frequency too low52%
Is irregular16%
Too early/ too late8%
Bad workers' behaviour
0%
Workers demand allowance
0%
Allowance is expensive
0%
Service not fair0%
Point if too far1%
Other2%
What are reasons for dissatisfaction?
(74)

Response to Public Opinion Survey for Household Thamankaduwa PS
Page 3 of 7
Response to Public Opinion Survey for Household
Yes
5%
No
95%
Have you ever complained about the garbage collection service to the authorities in the last
three years?
Yes71%
No29%
Do you want to receive a garbage collection service? (only for persons who do not have garbage collection services in the area)
Discharge outside
41%
Specific place
5%Open dump
16%
Request a collection
truck1%
Self‐dispose28%
Composting
9%
Give for recycling
0%Other (collection
truck/ common bin)0%
How do you dispose off garbage generated in your premises?
As soon
as64%
Once daily34%
Once 2‐3
days1%
Less
frequent1%
How often do you dispose off garbage generated in your premises?
Adult male8%
Adult
female53%
Servant4%
Other35%
Who mainly handles wastes at home?
(75)

Response to Public Opinion Survey for Household Thamankaduwa PS
Page 4 of 7
Response to Public Opinion Survey for Household
Very much willing35%
Somewhat willing6%
Less
willing4%
Not
willing7%
Doing already48%
Willingness to cooperate in separate garbage collection system
Reduce landfill amount
8%
Protect environm
ent63%
Can earn money21%
Others8%
Why do you think recycling is important?
Yes91%
No9%
Don't
know0%
Is there anyone to collect recyclables ?
Yes0%
No100%
Do you take for recyclable materials to shops for refund or sale?
Yes23%
No
77%
Are you using kitchen/garden waste for composting?
< Half20%
Half9%
> Half6%
All
65%
If you do composting, how much of kitchen waste used for composting?
(76)
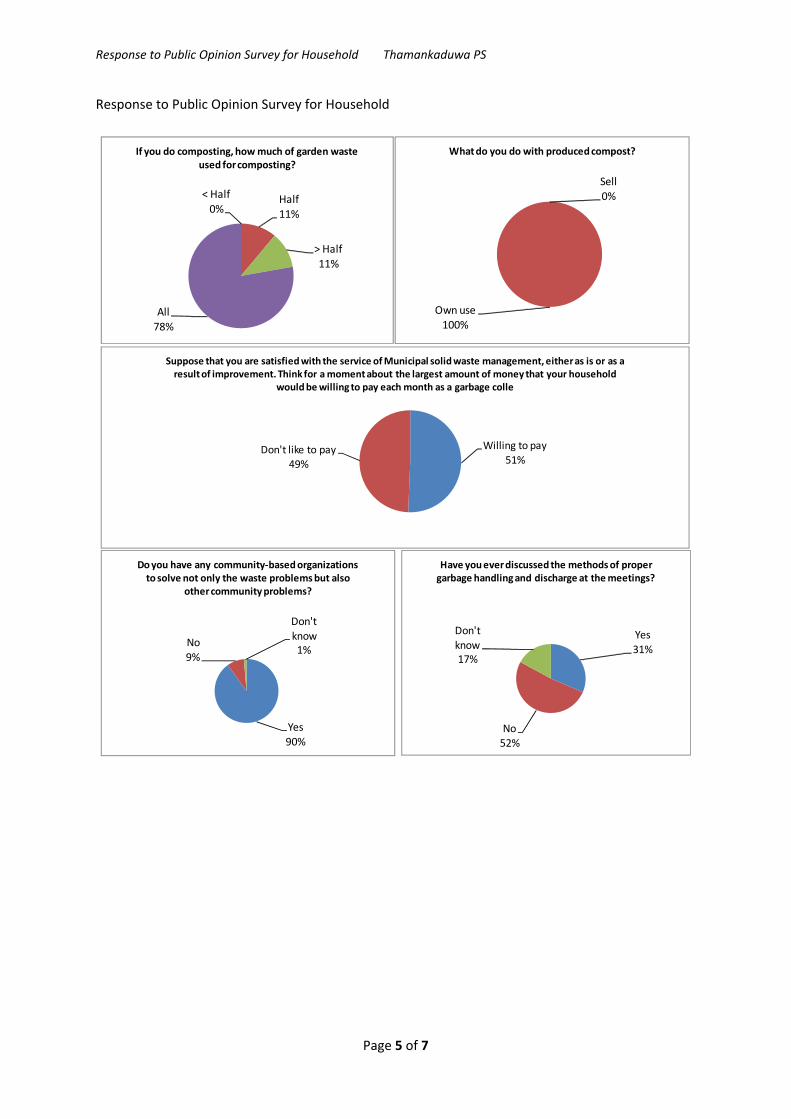
Response to Public Opinion Survey for Household Thamankaduwa PS
Page 5 of 7
Response to Public Opinion Survey for Household
< Half0%
Half11%
> Half11%
All78%
If you do composting, how much of garden waste used for composting?
Sell0%
Own use100%
What do you do with produced compost?
Willing to pay
51%Don't like to pay
49%
Suppose that you are satisfied with the service of Municipal solid waste management, either as is or as a result of improvement. Think for a moment about the largest amount of money that your household
would be willing to pay each month as a garbage colle
Yes90%
No9%
Don't know1%
Do you have any community‐based organizations to solve not only the waste problems but also
other community problems?
Yes
31%
No52%
Don't
know17%
Have you ever discussed the methods of proper garbage handling and discharge at the meetings?
(77)

Response to Public Opinion Survey for Household Thamankaduwa PS
Page 6 of 7
Response to Public Opinion Survey for Household
Yes
72%
No
28%
Have you ever been taught method of proper garbage handling & disposal?
Parents
3%Communit
y5%
School
6%
Local Gov.
58%
Central Gov.9%
NGOs
2%
Others
17%
If you have learned , who taught proper garbage handling methods?
Very necessary
96%
Somewhat necessary
4%
Not very
necessary0%
Not
necessary at all
0%
Necessity of awareness campaign
(78)

Jaffna MC 1.3
(79)この前に合紙 この前に合紙

The data collection survey of solid waste management in Sri Lanka Main Report‐ Jaffna Municipal Council
i
Table of content
1 Introduction .................................................................................................................................... 1
1.1 Background conditions of Jaffna Municipal Council ............................................................... 1
2 Waste Composition Survey (WCS) .................................................................................................. 2
2.1 Methods of waste composition Survey .................................................................................. 2
2.1.1 Classification of Wastes at Disposal Facility .................................................................... 2
2.1.2 Sampling frequency ........................................................................................................ 2
2.1.3 Bulk‐Sampling for WCS ................................................................................................... 2
2.1.4 Measurement of physical composition........................................................................... 4
2.2 Waste composition survey results .......................................................................................... 5
3 Waste Generation Survey (WGS) .................................................................................................... 7
3.1 Waste Generation Survey Results ........................................................................................... 8
4 Public Opinion Survey (POS) ......................................................................................................... 11
4.1 Public opinion survey methodology ..................................................................................... 11
4.2 Results of Public Opinion Survey .......................................................................................... 12
5 Final disposal site survey (FDS) ..................................................................................................... 14
5.1 Introduction the FDS at Jaffna MC’s dumpsite ..................................................................... 14
5.1.1 Survey Method .............................................................................................................. 14
5.1.2 Target of Survey ............................................................................................................ 14
5.1.3 Data Sampling ............................................................................................................... 14
5.2 Current condition of final disposal site and its surroundings ............................................... 15
5.2.1 Final Disposal Site of Jaffna MC .................................................................................... 15
5.2.2 History and evolution of the dumpsite ......................................................................... 15
5.2.3 Extend and landform ..................................................................................................... 17
5.2.4 Waste receiving and disposal ........................................................................................ 17
5.3 Site infrastructure facilities ................................................................................................... 18
5.3.1 Current condition of final disposal site and its surroundings ....................................... 20
5.3.2 Operation and Management of final disposal site ....................................................... 22
(80)

The data collection survey of solid waste management in Sri Lanka Main Report‐ Jaffna Municipal Council
ii
List of Tables
Table 2‐1 Summary results of MSW physical composition survey in Jaffna MC .................................... 5
Table 3‐1 Type of data collected for WGS in Jaffna MC ......................................................................... 7
Table 3‐2 Household population (GN level) within Jaffna MC area ....................................................... 8
Table 3‐3 Type and number of municipal establishment own by Jaffna MC ......................................... 9
Table 3‐4 Number of government and privet institutions within Jaffna MC .......................................... 9
Table 4‐1 Category and number of samples for Public Opinion Survey ............................................... 11
Table 4‐2 Average and standard deviation values of income and family size ...................................... 12
Table 5‐1 Data collected during the final disposal site survey ............................................................. 14
Table 5‐2 Estimated waste disposal amount at Jaffna MC's dumpsite ................................................ 25
(81)

The data collection survey of solid waste management in Sri Lanka Main Report‐ Jaffna Municipal Council
iii
List of Figures
Figure 2‐1 Sampling for WCS at JMC, (a) manually unloading the profile sample and (b) unloaded
sample ..................................................................................................................................................... 2
Figure 2‐2 Particle size reduction, mixing and preparation of working sample by coning & quartering
technique ................................................................................................................................................ 3
Figure 2‐3 Procedure of analysis of physical composition ...................................................................... 4
Figure 2‐4 Average physical composition of MSW in Jaffna MC ............................................................ 6
Figure 4‐1 Method of garbage discharge by residence in JMC area ..................................................... 12
Figure 4‐2 Willingness of residence for a source separated garbage collection system in Jaffna MC . 13
Figure 5‐1 Location of Jaffna MC's MSW dumpsite in Jaffna peninsula ............................................... 15
Figure 5‐2 Historical evolution of Jaffna MSW dumpsite from year 2002 ........................................... 16
Figure 5‐3 Environment around the Jaffna MC's dumpsite .................................................................. 16
Figure 5‐4 A Google image showing the elevation profile from road to the lagoon across the Jaffna
MC's dumpsite ...................................................................................................................................... 17
Figure 5‐5 Notable features around the Jaffna MC's MSW dumpsite .................................................. 18
Figure 5‐6 (a) Toilet waste disposal pit and (b) toilet waste collection bowser at Jaffna MC'c MSW
dumpsite ............................................................................................................................................... 19
Figure 5‐7 A waste picker at the Jaffna MC's dumpsite (dated on 20‐10‐2015) .................................. 24
Figure 5‐8 Municipal labors manually spreading the unloaded waste at Jaffna MC's dumpsite ......... 24
(82)

The data collection survey of solid waste management in Sri Lanka Main Report‐ Jaffna Municipal Council
1
1 Introduction
The purpose of this survey is to obtain the current data regarding Solid Waste Management (SWM)
at Jaffna Municipal Council (JMC). The data collection survey was conducted from 19th October to
26th October, 2015 by a team of expert dispatched by Waste To Energy Technologies Limited.
This report consists of brief summaries of survey methods and results. The additional primary data
and records are available as soft copies. The preliminary data collection was conducted through four
comprehensive surveys which are;
i. Waste Composition Survey (WCS) is to gather information on Physical Composition of MSW
collected by JMC.
ii. Waste Generation Survey (WGS) is to gather information on waste generation sources at
JMC based on secondary data available at JMC and other relevant organizations.
iii. Public Opinion Survey (POS) is gather information on public opinion on current waste
management in JMC. The POS was conducted through a questionnaire survey that covers
different types of waste generators in the JMC area.
iv. Final Disposal Site Survey (FDSS) is to collection data on final MSW disposal site of JMC
based on secondary data as well as field recordings & visits to the site.
1.1 Background conditions of Jaffna Municipal Council
The local Government structure and system which got initiated with the introduction of the local
Board from July 1906, the Urban District Council from 01st January 1923, the Urban Council from 01st
January 1940 culminated in the promulgation of the Municipal Council with effect from 01st January
1949 under the provision of the Municipal Council Ordinance No 29 of 1947.
The Jaffna Town lies in the Southern part of Jaffna Peninsula between 9° 38’ North and 9° 42’ North
and between 79° 59’ East and 80° 3’ East. It is the District Head Quarters for Jaffna District, which
consist of most parts of Northern Sri Lanka. The area of the Town is about 20.20 km2 and the town is
longer in the East – West direction measuring a maximum of 6 km in length and its width varies from
8.5 to 4.0 km. The Jaffna lagoon forms the Southern boundary of the town. The Municipal Council
consists of Jaffna and part of Nallur Divisional Secretariat Division.
In general the topography is almost flat, the highest elevation is one 10 MSL and no sharp gradients
are noticeable. There is no natural stream.
Jaffna peninsula has typical tropical climate with two rainy seasons occur; major during the North
East monsoons (October to December) and the minor rainy season occurs during the South West
monsoon (April and May). The period between the South West Monsoon and the North East
Monsoon is the dry season extending from June to September. The average rainfall is 1300 mm with
mean annual air temperature of 26.2 °C.
(83)

The data collection survey of solid waste management in Sri Lanka Main Report‐ Jaffna Municipal Council
2
2 Waste Composition Survey (WCS)
The primary purpose of this survey is to ensure a standard approach to waste physical composition
analysis for the purposes of understanding the composition of waste delivered to final disposal
facility which was collected from JMC area. Information generated by WCAs will be useful to JMC as
well as administrators/policy makers to improve the efficiency and overall effectiveness of waste
management systems.
2.1 Methods of waste composition Survey
2.1.1 Classification of Wastes at Disposal Facility
This study was conducted to assess the physical composition of MSW samples collected from JMC
and delivered to the final disposal facility by collection vehicles.
2.1.2 Sampling frequency
The WCA was carried out for a full waste collection cycle starting from Monday (20th October 2015)
to Sunday (26th October 2015).
2.1.3 Bulk‐Sampling for WCS
An effective WCA programme must be based on waste samples that are representative of the target
area as a whole (usually a whole local authority), be sufficient to take account of variation in waste
arising whilst also being affordable within the project budget. A good sampling strategy is essential
to achieving this difficult balance. Thus it is needed to ensure that a ‘good’ sample is obtained within
the constraints of time and cost.
Figure 2‐1 Sampling for WCS at JMC, (a) manually unloading the profile sample and (b) unloaded sample
Waste collection vehicles, especially four wheel tractors trailers (4‐wheel tractors) are filled from
bottom to the top of the trailer, thus making a distinguished vertical stratification in the tractor. The
filling pattern becomes more complex when the garbage is discharged in bags. Therefore, as shown
in Figure 2‐1, profile sampling from collection vehicles was adapted in this study. The profile sample
(84)

The data collection survey of solid waste management in Sri Lanka Main Report‐ Jaffna Municipal Council
3
was taken from the back of the trailer, measuring at least 1/8 of the length of the trailer. Therefore,
the size of the composite sample was found to be varied from 100 and 150 kg.
Thereafter, all the large and over sized waste particles were manually shredded into smaller particles.
At the first round of shredding, larger particles were cut in to small the size particles with knife and
scissors (Figure 2‐2).
Figure 2‐2 Particle size reduction, mixing and preparation of working sample by coning & quartering technique
The size of the bulk sample was reduced to a workable size by Coning and Quartering technique.
Finally the sample was reduced to a more manageable size as the actual classification of materials
was carried out by hand. The Coning and Quartering technique involved the following:
a) The sample was placed on the floor and thoroughly mixed by shovel, manually.
b) The sample was then placed in a uniform pile of approximately 0.8 m high.
c) The pile was divided into four quarters using straight lines perpendicular to each other.
d) Either pair of opposite corners was removed to leave half the original sample.
e) The process was repeated three times until the desired sample was obtained.
(85)

The data collection survey of solid waste management in Sri Lanka Main Report‐ Jaffna Municipal Council
4
2.1.4 Measurement of physical composition
2.1.4.1 Specific gravity of waste
To measure the bulk density of a sample, the following procedure was followed:
a) Weighed and recorded a volumetrically celebrated bucket of known volume (50 L)
b) Poured the sample into the bucket until it was overflowing
c) Settled the contents of the bucket by dropping it three times from a height of 10 cm
d) After settling the waste, waste‐filled bucket volume was measured
e) Weight the bucket and its contents was recorded
f) The bulk density was estimated by dividing the waste weight by filled volume, as kg/ m3.
Figure 2‐3 Procedure of analysis of physical composition
2.1.4.2 Physical composition analysis procedure
Once the sample size was determined and a reduced or workable sample was obtained, the
following procedure was carried out.
a) Sorted reduced sample and pick out larger items first e.g. glass, paper, plastics.
b) Separated waste into following categories,
i. Kitchen waste
(86)
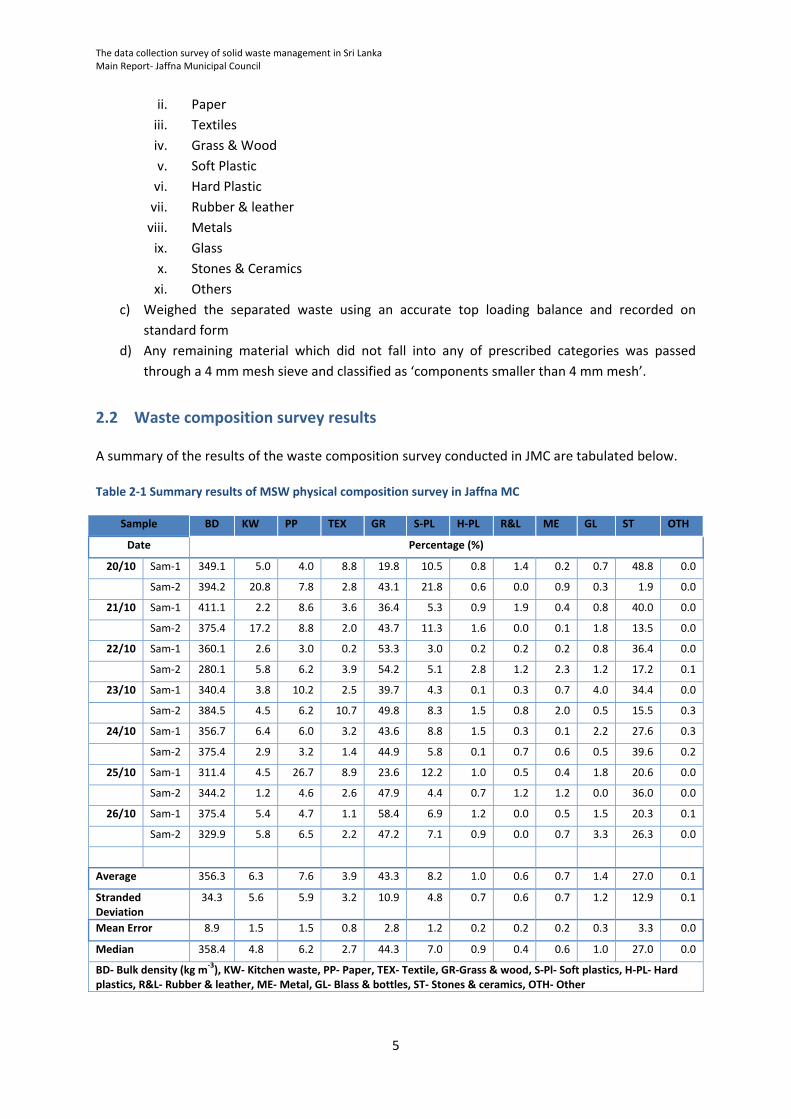
The data collection survey of solid waste management in Sri Lanka Main Report‐ Jaffna Municipal Council
5
ii. Paper
iii. Textiles
iv. Grass & Wood
v. Soft Plastic
vi. Hard Plastic
vii. Rubber & leather
viii. Metals
ix. Glass
x. Stones & Ceramics
xi. Others
c) Weighed the separated waste using an accurate top loading balance and recorded on
standard form
d) Any remaining material which did not fall into any of prescribed categories was passed
through a 4 mm mesh sieve and classified as ‘components smaller than 4 mm mesh’.
2.2 Waste composition survey results
A summary of the results of the waste composition survey conducted in JMC are tabulated below.
Table 2‐1 Summary results of MSW physical composition survey in Jaffna MC
Sample BD KW PP TEX GR S‐PL H‐PL R&L ME GL ST OTH
Date Percentage (%)
20/10 Sam‐1 349.1 5.0 4.0 8.8 19.8 10.5 0.8 1.4 0.2 0.7 48.8 0.0
Sam‐2 394.2 20.8 7.8 2.8 43.1 21.8 0.6 0.0 0.9 0.3 1.9 0.0
21/10 Sam‐1 411.1 2.2 8.6 3.6 36.4 5.3 0.9 1.9 0.4 0.8 40.0 0.0
Sam‐2 375.4 17.2 8.8 2.0 43.7 11.3 1.6 0.0 0.1 1.8 13.5 0.0
22/10 Sam‐1 360.1 2.6 3.0 0.2 53.3 3.0 0.2 0.2 0.2 0.8 36.4 0.0
Sam‐2 280.1 5.8 6.2 3.9 54.2 5.1 2.8 1.2 2.3 1.2 17.2 0.1
23/10 Sam‐1 340.4 3.8 10.2 2.5 39.7 4.3 0.1 0.3 0.7 4.0 34.4 0.0
Sam‐2 384.5 4.5 6.2 10.7 49.8 8.3 1.5 0.8 2.0 0.5 15.5 0.3
24/10 Sam‐1 356.7 6.4 6.0 3.2 43.6 8.8 1.5 0.3 0.1 2.2 27.6 0.3
Sam‐2 375.4 2.9 3.2 1.4 44.9 5.8 0.1 0.7 0.6 0.5 39.6 0.2
25/10 Sam‐1 311.4 4.5 26.7 8.9 23.6 12.2 1.0 0.5 0.4 1.8 20.6 0.0
Sam‐2 344.2 1.2 4.6 2.6 47.9 4.4 0.7 1.2 1.2 0.0 36.0 0.0
26/10 Sam‐1 375.4 5.4 4.7 1.1 58.4 6.9 1.2 0.0 0.5 1.5 20.3 0.1
Sam‐2 329.9 5.8 6.5 2.2 47.2 7.1 0.9 0.0 0.7 3.3 26.3 0.0
Average 356.3 6.3 7.6 3.9 43.3 8.2 1.0 0.6 0.7 1.4 27.0 0.1
Stranded Deviation
34.3 5.6 5.9 3.2 10.9 4.8 0.7 0.6 0.7 1.2 12.9 0.1
Mean Error 8.9 1.5 1.5 0.8 2.8 1.2 0.2 0.2 0.2 0.3 3.3 0.0
Median 358.4 4.8 6.2 2.7 44.3 7.0 0.9 0.4 0.6 1.0 27.0 0.0
BD‐ Bulk density (kg m‐3), KW‐ Kitchen waste, PP‐ Paper, TEX‐ Textile, GR‐Grass & wood, S‐Pl‐ Soft plastics, H‐PL‐ Hard plastics, R&L‐ Rubber & leather, ME‐ Metal, GL‐ Blass & bottles, ST‐ Stones & ceramics, OTH‐ Other
(87)

The data collection survey of solid waste management in Sri Lanka Main Report‐ Jaffna Municipal Council
6
The analysis showed that the amount of food & kitchen waste is very small (1.2‐ 20.8 %) compared
with other parts of the country. However, the amount of garden waste in the collection is
comparatively high which ranged from 19.8 % to 58.4 %. Another notable feature is the very high
amount of stones & ceramics (1.9 – 48.8 %). The average waste composition derived from the 14
samples is shown in Figure 2‐4.
Figure 2‐4 Average physical composition of MSW in Jaffna MC
The above figures shows that collected waste are suitable for composting. However, precautions
shall be taken to minimize the amount of inert (stones & ceramics) which can eventually lower the
quality f produced compost. Waste collected from bazaar and new market (Sample‐1 on 25th
October) has a lower organic content (28.1 %), as it includes commercial waste which contains more
inorganic materials such as paper (26.7 %) and soft plastics (12.2 %).
It also showed that the percentages of more profitable recyclable materials (hard plastic, metal, and
glass) are very small (0.1 ‐ 3.3 %), while the percentages of less profitable materials (paper, soft
plastic, textile) are much higher (3 ‐ 26.7 %).
(88)

The data collection survey of solid waste management in Sri Lanka Main Report‐ Jaffna Municipal Council
7
3 Waste Generation Survey (WGS)
In order to obtain general information on waste generation amounts, the data available at waste
management section of the Health Department, Works Department and Revenue Department of
JMC was used. Some of the data was available in the form of formal records and reports which were
treated as the most precise secondary data while the data collected from official interviews with
JMC officers was treated as verification data. Thus, the survey data was collected through different
methods;
a) Recording and compiling of published and verified data by JMC,
b) Reading and recording of unpublished & non‐confidential data available at JMC,
c) Recording and official statistics available at District Secretariat, Jaffna and Nallur Divisional
Secretariat offices, and
d) Official person‐to‐person interview with relevant officers at JMC for verification of data.
The numerical data was collected as specified in following Table 3‐1.
Table 3‐1 Type of data collected for WGS in Jaffna MC
Source Description
Household Each number of following category households was surveyed;1) High income level, 2) Middle income level and 3) Low income level.
Commercial Each number of following category restaurants was surveyed;1) Large size restaurants, 2) Middle size restaurants and 3) Small size restaurants. Each number of following category shops was surveyed; 1)Organic shops (large) 2)Organic shops (middle) 3)Organic shops (small) 4)Non‐Organic shops (large) 5)Non‐Organic shops (middle) 6)Non‐Organic shops (small)
Hotels Each number of following category hotels was surveyed;1) Large size hotels 2) Middle size hotels and 3) Small size hotels.
Markets Number of stalls and types
Institutions Each number of following institute was surveyed;1) Schools 2) Hospitals (government) 3) Hospitals (private) 4) Public office 5) Bank/private office 6) Buddhist temples 7) Hindu temples 8) Mosques 9) Churches 10) Navy/Police/ Army bases
(89)

The data collection survey of solid waste management in Sri Lanka Main Report‐ Jaffna Municipal Council
8
Source Description
11) Others
Industries Wastes from any industries.
Other Public parks and other public facilities
Construction and demolition
Wastes originating from construction, rehabilitation and demolition activities, etc.
Hazardous (Special)
Management and collection of hazardous wastes originating from various sources, including household items
3.1 Waste Generation Survey Results
The records indicate that the total residential population within JMC is 91,100 (Source: Divisional
Secretariat, Jaffna & Divisional Secretariat, Nallur, 2015). The Jaffna MC area consists of 47 Grama
Niladari (GN) divisions as shown in below Table 3‐2.
Table 3‐2 Household population (GN level) within Jaffna MC area
DN Division Population DN Division Population
GN division 2,015 Navanthurai South 2,771
Nedunkulam 2,120 Navanthurai North 2,446
Colombuthurei East 2,391 Moor Street South 3,546
Colombuthurei West 1,270 Moor Street North 4,849
Passaiyoor East 1,212 New Moor Street 1,629
Passaiyoor West 1,154 Ariyalai North West 1,744
Echchamoddai 3,068 Ariyalai Centre West 1,406
Thirunagar 1,684 Ariyalai South West 1,066
Reclamation East 4,426 Ariyalai Centre 1,649
Reclamation West 3,560 Ariyalai Centre North 892
Gurunagar East 1,793 Ariyalai Centre South 1,027
Gurunagar West 1,436 Iyanarkovilady 1,256
Small Bazaar 787 Vannarpannai North 1,882
Jaffna Town West 1,831 Vannarpannai North West 2,599
Jaffna Town East 2,336 Vannarpannai North East 2,523
Chundikuli South 1,944 Neeraviady 1,985
Chundikuli North 1,439 Kantharmadam North West 1,620
Maruthady 1,618 Kantharmadam North East 2,059
Aththiyady 2,202 Kantharmadam South West 1,245
Sirambiyady 1,231 Kantharmadam South East 1,001
Grand Bazaar 1,549 Nallur North 1,662
Fort 1,985 Nallur Rajathany 604
Vannarpannai 1,485 Nallur 1,506
Koddady 2,029 Nallur Sankiliyanthoppu 3,583
Total 91,100
(90)

The data collection survey of solid waste management in Sri Lanka Main Report‐ Jaffna Municipal Council
9
As shown in following, Jaffna MC own and control a larger number of public properties and institutes.
Table 3‐3 Type and number of municipal establishment own by Jaffna MC
MC properties Number of establishments
Libraries 7
Municipal parks 2
Play grounds 1
Market complexes 2
Cemetery 6
Vehicle parking complexes 0
Office/ sub‐office 0
Slaughter house 1
Fish markets 5
Meat stall/ markets 35
Pola premises 2
Aruradic dispensaries 9
Common wells 19
Jaffna city host most of the government and privet sector institutes in the Jaffna District. Following
table shows the number of government and privet/non‐government establishments within Jaffna
MC that consist of Jaffna and Nallur Divisional Secretariats.
Table 3‐4 Number of government and privet institutions within Jaffna MC
Type of Institution Number Type of Institution Number
Institutes (Government) 20 Banks 13
Schools 46 Financial institutes 13
Higher education institutes 0 Specialized leasing companies 5
Teaching Hospitals 1 Preschools 34
Hospitals ‐ Clinics 4 Buddhist temples 1
District Secretariat office 1 Hindu Kovils 60
Divisional secretary offices 2 Mosques 3
Banks 9 Churches 27
Main Post offices 3 Fishermen cooperative societies 10
Sub Post offices 8 Community based organizations (library societies) 5
Nursing training schools 1 Rural development societies 20
Maternity homes 8 Women rural development societies 40
Ayurvedic Dispensary 5 Women task force 14
M.O.H Office 1 Community centres 55
Public health service centres 28 Spot clubs 40
Rural hospital 1 Youth clubs 32
Government Departments 10 Multi purpose cooperative societies 24
Information technology parks 1 UN Agencies (Resource Profile, 2013) 9
National Apprentice & Industrial Training Authority
1 International NGOs (2013) 20
(91)

The data collection survey of solid waste management in Sri Lanka Main Report‐ Jaffna Municipal Council
10
Type of Institution Number Type of Institution Number
Authorities 7 Other foreign agencies (2013) 1
Institutes (Private) 3 NGOs 29
Schools 3
A major portion of MSW is generated from commercial sector in the city. Following table shows the
number of different commercial (business) establishments in JMC area.
Business type # Business type # Business type #
Restaurants 79 Cattle Farm 3 Rest House 7
Glossary shops 350 Coir Based Product 43 Saloon 15
General wholesale shops 66 Communication 10 Service Station 2
Textile trading shops 177 Computer Shop 6 Tailoring 77
Electronic equipment sales shop 51 Construction Work 5 Textile Shop 5
Hardware shops 42 Cycle Repair Work 7 Tyres Work 1
Vehicle spare parts shops 56 Decorative Item 5 Video 2
Vehicle repair garages 52 Education Centre 2 Watch Work 3
Saw mills 15 Electrical Repairing 5 Welding Works 58
Vegetable sales shops 1 Fancy Shop 4 Ice plants 4
Fruit sales shops 13 Food Cafe 20 Fish net factories 2
Beauty salon 50 Food Processing 48 Small oil 2
Pharmacy 40 Garland 3 Micro gate grill 10
Medical Shops 3 Grinding Mill 11 Micro Flower Vass Plastic 1
Private Tuition Centres 2 Grocery Shop 1 Coir products 1
Computer Centres 2 Handicraft 25 Pot Shetty soil dish 1
Whole Sales 19 Hard Ware 4 Service repairing small 22
Fancy Shop 3 Jewellery 62 Service communication small 1
Small Industries 5 Lathe Work 1 Service saloon small 3
Food Shops 1 Laundry 7 Small service grinding 1
Jewellery Shops 3 Learners 4 Service 47
Electrical Shops 2 Leather Product 5 Wood based 34
Printers 3 Work Shop 2 Cloth based 21
Filling stations 6 Masonry 7 Light engineering 31
Hotels 86 Metal Carving 2 Palmayra products 5
Furniture 12 Mixture 5 Paper based 8
Saw mills 15 Motor Bike Repair 7 Chemicals 1
Aluminium Fabrication 3 Phone Shop 5 Cement based 2
Bakery 9 Picture Palace 1 Sculpture 1
Beauty Palace 6 Poultry Farm 15 Pottery 1
Carpentry 53 Printer 17
Casting Industry 2 Radio, TV repairing 4
(92)

The data collection survey of solid waste management in Sri Lanka Main Report‐ Jaffna Municipal Council
11
4 Public Opinion Survey (POS)
This Public Opinion Survey (POS) was commissioned to identify a range of household waste
management matters in relation to the household sector. Information on household waste
management practices and information on householders’ experiences with waste collection delivery
services was collected for the purpose of improving our understanding of householder’s experiences
and attitudes and also to better understand prevailing situation in householder’s point of view. The
purpose of this survey research included;
a. To collect information on public attitudes to the waste management and environment in
broader,
b. To value aspects of environmental health and protection,
c. To provide information on experiences with Local Authority’s waste management service
and,
d. To provide information on household waste management practices.
4.1 Public opinion survey methodology
The number of samples from Jaffna identified as 200 households, but size of the sample increased to
223 during the implementation to increase the accuracy. The selection of households and areas
within Jaffna MC was done after a consultative discussion with Municipal commissioner, MSW
section officers at JMC and JICA expert team members. Jaffna MC has 7 zones as SWM areas; Bazar,
Kurunagar, Nallur, Ariyalei, Nawanthurai, Pasaiyoor and Vannar Pannai. Samples were selected from
each zone representing approximately equal numbers.
The survey was executed by a team of university students who were trained about the questionnaire,
survey methodology and the data entering before dispatched to their respective fields. A senior
expertise took the leadership and continuously supervised the field survey. The selected households
were first educated about the survey, its main objectives and asked their cooperation before starting
the field survey. In addition business and institutes, large waste generators, hospitals recycling shops
and large public markets were also surveyed using appropriate questionnaires prepared in
consultation with JICA experts.
Table 4‐1 Category and number of samples for Public Opinion Survey
Category Survey area Number of samples
High‐income households Pasaiyoor, Ariyalai, Navanthurai, Kurunagar, Nallur 39
Middle‐income Households Vannar Pannai, Pasaiyoor, Nallur, Ariyalai, Kurunagar
66
Low‐income Households Vannar Pannai, Pasaiyoor, Nallur, Ariyalai, Kurunagar
61
Businesses /Service organization Point Pedro Rd, Kurunagar, Beach Rd, St Anthony Rd, A.P. Road, Kandy Rd, NavalarRd
44
Large waste generators 8
Markets 2
Recycling shops 2
(93)

The data collection survey of solid waste management in Sri Lanka Main Report‐ Jaffna Municipal Council
12
Category Survey area Number of samples
NGO 1
Total 223
The questionnaires were available in all languages (English/Sinhala/Tamil); however the
questionnaire form was filled by the interviewer based on interviewees’ response. The collected
information was recorded in digital form using Microsoft Excel and reviewed for accuracy. The data
was analyzed in detail for different objectives that generate an overview of the survey.
4.2 Results of Public Opinion Survey
99% of the surveyed households are Tamil with only 1% Muslims. Data on the average
number of people per household and monthly income is set out in below Table 4‐2.
Table 4‐2 Average and standard deviation values of income and family size
Category Family size Income (Rs/month)
High 4.9 ± 1.3 39,744 ± 24,005
Middle 5.0 ± 2.2 18,447 ± 6,742
Low 4.6 ± 2.3 7,782 ± 5,061
No of workers Income (Rs/month)
Business 3.3 ± 4.5 53,780 ± 121,643
In Jaffna MC, 88 % of surveyed households are provided with a garbage collection service, of
whom 82% stated they use this service. Only 26 % of surveyed households are “very satisfied”
with present SWM service provision, while 45 % are “somewhat satisfied”.
Figure 4‐1 Method of garbage discharge by residence in JMC area
Placing outside64%
Carrying to collection point5%
Carrying to collection truck27%
Other4%
How is your garbage collected?
(94)

The data collection survey of solid waste management in Sri Lanka Main Report‐ Jaffna Municipal Council
13
Households’ main methods of waste discharge are shown in Figure 4‐1. The most common
methods are discharging it outside their premises for house to house collection (51 %) and
carrying garbage to collection truck (21%).
Only 38% of surveyed households receive a daily garbage collection service while 13 %
stated that they received the service less frequent than once/week. However, 73%
discharge their garbage as soon as it is generated and 22 % discharge their garbage daily, the
gap between discharge and collection being slightly greater for the low income group. The
discrepancy between these figures explains the large amount of discarded garbage present
on many streets around Jaffna.
In general, adult females handle waste in about 76 % of surveyed households.
As shown in Figure 4‐2, 30 % of surveyed households are not willing to cooperate with
source separation for recycling. Ando also, only 59 % of surveyed households stated that
there are recyclable collectors or someone who comes to collect their reusable or recyclable
materials. Hence, an informal source separation recycling system is not well established in
Jaffna MC area.
Figure 4‐2 Willingness of residence for a source separated garbage collection system in Jaffna MC
Only 8 % of surveyed households use kitchen/garden waste for composting and used the
finished compost for their own garden.
Not many surveyed households (64 %) have ever discussed proper garbage discharge
methods at the community level.
57 % households stated that SWM awareness programmes are very necessary while 39 %
stated “somewhat necessary”.
The average WTP (willingness to pay) for improved SWM services is 207 ± 263 Rs/month per
household. However 19 % of household do not like to pay for SWM service.
Out of all surveyed households, 13 % stated that they sale/give‐off metal for recycling and
12 % of residence sale/give‐off tins & cans for recycling. The glass and bottle recycling is only
practiced by 8 % of households while the plastic recycling is 12 %. Percentage of household
who involved in paper recycling (sale or given‐off) was low (3 %).
Very much
willing28%
Somewhat
willing26%
Less willing
10%
Not willing
30%
Doing
already6%
Willingness to cooperate in separate
garbage collection system
(95)

The data collection survey of solid waste management in Sri Lanka Main Report‐ Jaffna Municipal Council
14
5 Final disposal site survey (FDS)
5.1 Introduction the FDS at Jaffna MC’s dumpsite
5.1.1 Survey Method
The data and information in this report were collected from various sources including published
reports, verified data from Jaffna Municipal Council, and direct interview with responsible authorities
at disposal site.
5.1.2 Target of Survey
The survey is focus on obtaining general information on waste receiving, handling, disposal, facility
management, environmental monitoring and legal adherences.
5.1.3 Data Sampling
The numerical data was collected as specified in following Table 5‐1.
Table 5‐1 Data collected during the final disposal site survey
Survey Items Method
1 Current condition of final disposal site and its surroundings
Disposal method and structure Records, visual observation
Soil‐covering Records, visual observation
Land owner Records
Residual area Records, visual observation
Leachate water Records, visual observation
Waste picker Records, visual observation, interview
Scattering waste, smoke, fire, offensive odour, animals and so on
Records, visual observation
2 Operation and Management of final disposal site
Environmental Protect License and Environmental Clearance
Record
Personnel Records, interview
Operation vehicles, their maintenances and drivers Records, interview
Weighbridge Records, interview
Waste collection data Records, interview
Supervisory method Records, interview
3 Waste amount to final disposal site (24 hours, 7 days) Records, Survey
4 Adverse impact near by residences Records, Survey
5 Implementation status of geological, topographic and EIA survey
for new final disposal site
Records, interview
6 Progress situation for new final disposal site Records, interview
7 Court case Records, interview
(96)

The data collection survey of solid waste management in Sri Lanka Main Report‐ Jaffna Municipal Council
15
5.2 Current condition of final disposal site and its surroundings
5.2.1 Final Disposal Site of Jaffna MC
The final disposal site is situated in Kalundai village, at about 6.5 km away from the city center of
Jaffna on the left of Jaffna‐Karainagar (# AB21) main road. The final disposal site is an abundant
saltern situated in Navali South Grama Niladhari division in Sandilipai Divisional Secretariat area,
which is also politically administrated by Manippai Pradeshiya Sabha in Jaffna District of the
Northern Province of Sri Lanka.
Figure 5‐1 Location of Jaffna MC's MSW dumpsite in Jaffna peninsula
5.2.2 History and evolution of the dumpsite
The dumpsite was first started in year 2002. The site was an adjacent land of an abundant saltern.
From the beginning, the site was commonly shared by Jaffna Municipal Council and Sandilipai PS.
The historical evolution of the dumpsite is illustrated in Figure 5‐2.
The west side of the dump extend up to the Jaffna lagoon, approximately 600 m away from the
present dumping area. The north of the dumpsite extend up to an flood water regulation channel
that originate from an anicut built to regulate flood waters on the right side of the road coming
through the paddy fields.
As shown in the Figure 5‐3, the nearest residential area is on the opposite site of the main road
which is 700 m away from the dumpsite.
(97)

The data collection survey of solid waste management in Sri Lanka Main Report‐ Jaffna Municipal Council
16
Figure 5‐2 Historical evolution of Jaffna MSW dumpsite from year 2002
Figure 5‐3 Environment around the Jaffna MC's dumpsite
(98)

The data collection survey of solid waste management in Sri Lanka Main Report‐ Jaffna Municipal Council
17
5.2.3 Extend and landform
At present, a 10 hectare land has been allocated for the dumpsite by Jaffna DS which has been
planned to expand up to 20.8 hectares during the future development.
The area is covered with shrubs and grasses with very few small trees on the vicinity. The landform is
a flat terrain except the areas where the saltern was built. However, there is plenty of small waster
logging depressions on the land that eventually filled with water during the rainy season.
The surroundings of site are with lands leading to the lagoon on the South‐West, West and the
North‐West sides. Other areas are abandoned lands and paddy fields leading more than 1.5 km away
from the site. There is a gradual slope towards the lagoon. The opposite boundary is Kallundai canal
which flows parallel to the main road. The closet proximity to a residence is approximately 500 m on
the East side where only four families are living.
Figure 5‐4 A Google image showing the elevation profile from road to the lagoon across the Jaffna MC's dumpsite
5.2.4 Waste receiving and disposal
The existing dumpsite is commonly shared by three Local Authorities in Jaffna District. They are;
Jaffna Municipal Council, Valikammum‐South Pradeshiya Sabha and Nallur Pradeshiya Sabha.
The available records show that Jaffna MC delivers approximately 50 to 70 four‐wheel tractors loads
of MSW while the compactor trucks delivers 1 to 3 loads of waste per day. In addition, 4 to 7
loads/day of sewage (toilet waste) collected within Jaffna MC area is also dumped at the site.
Nallur PS delivers approximately 1 to 3 four‐wheel tractors loads of MSW to the site. The waste is
primarily collected from North sub‐urban areas of Jaffna city and Kondavil area in Nallur PS.
Valikammum‐South PS delivers approximately 1 to 2 four‐wheel tractors loads of MSW to the site.
The waste is primarily collected within Chunnakam township of Valikammum‐South PS area.
(99)

The data collection survey of solid waste management in Sri Lanka Main Report‐ Jaffna Municipal Council
18
Figure 5‐5 Notable features around the Jaffna MC's MSW dumpsite
5.3 Site infrastructure facilities
There is a Barrier Gate (3.5 m wide) just passing the culvert across the Kallundai canal. The 6 m wide
entrance road has been repaired in early 2015 with tarmac and sides of the road have been filled
(100)

The data collection survey of solid waste management in Sri Lanka Main Report‐ Jaffna Municipal Council
19
with gravel soil on the old waste. The tarmac extends up to the entrance of the dumpsite which is
about 150 m from the entrance gate.
There is a temporally site office adjacent to the gate. The office has a domestic water supply from
NWS&DB but not electricity.
There is no permanent or temporally fence around the site.
Toilet waste collected from gully bowser trucks are been emptied to a shallow pit inside the dump.
The available records shows average number of gully bowser loads emptied at the site is 4 1/ day which is equal to 16 m3 of toilet waste per day.
Figure 5‐6 (a) Toilet waste disposal pit and (b) toilet waste collection bowser at Jaffna MC'c MSW dumpsite
(101)

The data collection survey of solid
waste m
anagem
ent in Sri Lanka
Main Rep
ort‐ Jaffna Municipal Council
20
5.3.1
Current condition of final disposal site and its surroundings
1
Current condition of final disposal site and its surroundings
1.1
Disposal m
ethod and structure
Incoming waste loads (tractors, compactors and gully bowsers) are recorded
at the en
trance gate. Each veh
icle has been
issued
a sticker to be pasted by gate keeper on the record book at the en
trance
Selected
veh
icles which contain garden
wastes are unloaded
on a sep
arate floor area. The collected
garden
wastes are to
be used for composting.
All other M
SW collection veh
icles em
ptied
its waste at the dumpsite. No specific control m
easures apply for selection of
dumping area. Thus, Open
Dumping is practiced
.
All other wastes are dumped
on the ground and spread
manually using labor
No m
achineries are em
ployed at the site. H
owever, site supervisor explained
that the Jaffna MC employs bulldozer when
there is a req
uirem
ent for leveling the waste. A
privately own bulldozer is ren
ted out for 3‐4 days at 6 m
onths interval for
the purpose.
Sewage is discharged to a shallow pit excavated
on the dump
1.2
Soil‐covering
Covering of waste by soil is not practiced
1.3
Land owner
Jaffna
Divisional Secretariat possesses the
ownership of the
land and surrounding
area. The
area is under the
administration area of Manippai Pradeshiya Sabha
However, Jaffna MC has submitted the request to Jaffna Divisional Secretariat to transfer the ownership of the land to
Jaffna MC. The application is under review at Provincial Land Commissioner and the Dep
artm
ent of Land for transfer of
ownership.
1.4
Residual area
Approximately 5.5 ha area has already been covered with waste out the total land area (20.8 hectares).
1.5
Leachate water
No leachate collection and treatmen
t system
Leachate and surface water flow towards the lagoon situated
800 m
away from the canter of the dump site
The abundant saltern w
hich is approximately 600 m
long, 150 m
wide and 2 m
deep has been filled
with leachate
contaminated
water to a height of around 0.5 m
.
Many sm
all leachate ponds and pits ( 1‐5 m
2) are scattered on the dump site
Sewage is discharged to pits excavated on the dump. The pit often
overflows and connected to flowing water down to
the lagoon.
(102)

The data collection survey of solid
waste m
anagem
ent in Sri Lanka
Main Rep
ort‐ Jaffna Municipal Council
21
1
Current condition of final disposal site and its surroundings
1.6
Waste picker
At present, 10‐12 peo
ple including 2 women
pick materials for selling and their own use
Out of all w
aste pickers, 6
peo
ple used to come and pick firewood for their own household use
Some of pickers are coming from nearby villages, 3‐4 km away from the site
Plastic, M
etal, C
ardboard, W
ires, Empty beer cans, Empty Arrack bottles are collected
and sold every day to the buyers in
Ariyalai (Dyna plastics) and Otamadu Junction
Waste pickers are not visiting the site on heavy rainy days. Some of the waste pickers use safety boots and gloves during
the rainy days
The average earning of waste pickers is Rs. 500 ‐ 2000 per day
Waste pickers don’t take food/kitchen
waste away from the site as anim
al feed
See pictures o
f waste pickers in th
e Annex i
1.7
Scattering waste, sm
oke, fire,
offen
sive odor, anim
als
Waste is dumped
everywhere on the dumping site
Polythen
e, papers and other soft m
aterials have blown all over the area by the wind. Polythen
e and soft plastic bags
have blown m
ore than
500 m
away from the site and dep
osited on paddy fields, cannels and the lagoon.
Also, some plastic waste have moved with rain waters the lagoon, cannel and the paddy fields
No fire and smoke witness at the dumpsite during the observation (19‐26 October, 2015)
Site labors and waste pickers m
entioned
that there is an offen
sive odor comes out from waste during the rainy season.
The fly breed
ing is also accelerated
during dry season, but the severity red
uces due to heavy winds
There are more than
75 stray dogs reside in the dump site
Approximately 20 numbers of cattle belongs to nearby farm
ers are used to graze on vegetables and food waste on the
site
(103)

The data collection survey of solid
waste m
anagem
ent in Sri Lanka
Main Rep
ort‐ Jaffna Municipal Council
22
5.3.2
Operation and M
anagement of final disposal site
2
Operation and M
anagemen
t of final disposal site
2.1
Environmen
tal Protect License and Environmen
tal
Clearance
None
2.2
Personnel
1‐Supervisor –M
orning (Permanen
t position)
1‐Supervisor –Evening (Permanen
t position)
2‐Labors‐w
orks during daytime (Permanen
t position)
1‐Security guard (Permanen
t position)
8‐Labors employ for special activities (to pick scattered polythen
e & plastics around the site,
spread
heaped
waste in
the dump etc. (Temporary/contract basis)
2.3
Operation veh
icles, their maintenances and drivers
None
(A Bulldozer is hired
every 6 m
onths for 3‐4 days)
2.4
Weighbridge
None
2.5
Waste collection data
A record book is available
2.6
Supervisory m
ethod
MOH (attached
to the ministry of health‐North province)‐1 nos
Public Health Inspector(PHI)‐ 1 nos
Officer‐ in‐charge (Waste M
anagem
ent)‐ 1 nos (M
r. Ashovan)
Those three officers are regularly inspecting the site and instruct the site supervisor for necessary
actions. Officer‐in‐charge is responsible for coordinating with m
unicipal officers for solving daily
managem
ent issues as well as other contingency m
atters.
3.0
Waste amount to final disposal site (24 hours, 7
days)
A summary is shown in
Annex ii
4.0
Adverse im
pact nearby residen
ces
Scattering of materials by wind is a problem for nearby farm
ers and fishermen
.
(104)

The data collection survey of solid
waste m
anagem
ent in Sri Lanka
Main Rep
ort‐ Jaffna Municipal Council
23
2
Operation and M
anagemen
t of final disposal site
5.0
Implemen
tation status of geological, topographic and
EIA survey for new
final disposal site
None
6.0
Progress situation for new
final disposal site
None
7.0
Court case
Residen
ce around the dumpsite has
taken legal action against the Jaffna MC at District Court, and
the legal order has been issued
to Jaffna MC to rectify the issues on or before.
Further, Jaffna MC has been ordered
to find a solution to control w
astewater/leachate by January
2016.
The next hearing of the court will be on 11th January 2015.
No official records are available up to date since the court case is still going on.
(105)

The data collection survey of solid waste management in Sri Lanka Main Report‐ Jaffna Municipal Council
24
ANNEXTURE I:
Figure 5‐7 A waste picker at the Jaffna MC's dumpsite (dated on 20‐10‐2015)
Figure 5‐8 Municipal labors manually spreading the unloaded waste at Jaffna MC's dumpsite
(106)

The data collection survey of solid waste management in Sri Lanka Main Report‐ Jaffna Municipal Council
25
ANNEX ii: Waste collection amounts
Table 5‐2 Estimated waste disposal amount at Jaffna MC's dumpsite
Jaffna MC Valikammum‐South PS Nallur PS
Year 2015 Estimated waste disposal amount (Tonnes/month)
April 2, 115 57 210
May 2, 342 95 219
June 2, 925 95 241
July 3, 945 88 249
August 3, 628 95 236
September 3, 438 90 225
October (16‐22) 7 days 769 20 15
(107)

Annex
JAFFNA MUNICIPAL COUNCIL
(108)

Response to Public Opinion Survey for Household Jaffna MC
Page 1 of 7
Response to Public Opinion Survey for Household
Sinhala0%
Muslim1%
Tamil99%
Other0%
Ethnicity
Buddhist0%
Islam1%
Hindu42%
Christian 57%
Other0%
Religion
Garbage collection
59%Storm water23%
Water supply18%
Please specify the priority for your daily life regarding the improvement of the following
aspects?
Yes
88%
No
12%
Are there garbage collection services in your area?
Yes82%
No18%
Do you use these services?
Placing outside64%
Carrying to
collection point5%
Carrying to
collection truck27%
Other4%
How is your garbage collected?
(109)

Response to Public Opinion Survey for Household Jaffna MC
Page 2 of 7
Response to Public Opinion Survey for Household
2‐25m
94%
26‐50m0%
51‐100m
4%
100‐250m2%
>250m
0%Don't
know0%
How far do you have to walk to reach this point?
Daily
3%
> 4
times/Wk0%
2‐3 times/Wk
14%
Once/Wk38%
<
Once/Wk13%
Irregular
10%
Don't know1%
Irrelevant
21%
How often is your garbage collected?
Yes
32%
No57%
Don't
know11%
Is the garbage collection service done at a fixed time on the collection?
Very
satisfied26%
Somewha
t satisfied45%
Less than
satisfied15%
Not satisfied at all
14%
Are you satisfied with the collection service?
Not properly done20%
Frequency too low
18%
Is irregular25%
Too early/ too late
8%
Bad workers'
behaviour11%
Workers demand allowance
7%
Allowance is expensive
0%
Service not fair0%
Point if too far0% Other
11%
What are reasons for dissatisfaction?
(110)

Response to Public Opinion Survey for Household Jaffna MC
Page 3 of 7
Response to Public Opinion Survey for Household
Yes18%
No
82%
Have you ever complained about the garbage collection service to the authorities in the last
three years?
Yes78%
No22%
Do you want to receive a garbage collection service? (only for persons who do not have garbage collection services in the area)
Discharge outside52%
Specific place4%
Open dump2%
Request a collection
truck0%
Self‐dispose
25%
Composting2%
Give for recycling
10%
Other (collection
truck/ common bin)5%
How do you dispose off garbage generated in your premises?
As soon as74%
Once daily22%
Once 2‐3 days3%
Less frequent
1%
How often do you dispose off garbage generated in your premises?
Adult male12%
Adult female74%
Servant1%
Other13%
Who mainly handles wastes at home?
(111)

Response to Public Opinion Survey for Household Jaffna MC
Page 4 of 7
Response to Public Opinion Survey for Household
Very much
willing28%
Somewhat willing26%
Less
willing10%
Not willing30%
Doing already6%
Willingness to cooperate in separate garbage collection system
Reduce
landfill amount
5%
Protect
environment
61%
Can earn
money24%
Others
10%
If you are willing to cooperate, why do you think recycling is important?
Yes59%
No41%
Don't
know0%
Is there someone who comes around to collect or buy your reusable or recyclable materials?
Yes
4%
No
96%
Do you take for recyclable materials to shops for refund or sale?
Yes16%
No
84%
Are you using kitchen/garden waste for composting?
< Half
33%
Half10%
> Half24%
All33%
If you do composting, how much of kitchen waste used for composting?
(112)

Response to Public Opinion Survey for Household Jaffna MC
Page 5 of 7
Response to Public Opinion Survey for Household
< Half25%
Half13%
> Half8%
All54%
If you do composting, how much of garden waste used for composting?
Sell4%
Own use96%
What do you do with produced compost?
Don’t like19%
Willing to pay81%
Suppose that you are satisfied with the service of Municipal solid waste management, either as is or as a result of improvement. Think for a moment about the largest amount of money that your
household would be willing to pay each month as a garbage colle
Yes
46%No48%
Don't
know6%
Do you have any community‐based organizations to solve not only the waste problems but also
other community problems?
Yes
29%
No52%
Don't
know19%
Have you ever discussed the methods of proper garbage handling and discharge at the
meetings?
(113)

Response to Public Opinion Survey for Household Jaffna MC
Page 6 of 7
Response to Public Opinion Survey for Household
Yes
76%
No
24%
Have you ever been taught method of proper garbage handling & disposal?
Parents
1% Communi
ty18%
School
3%
Local Gov.
52%
Central Gov.0%
NGOs
2%
Others
24%
If you have learned , who taught proper garbage handling methods?
Very
necessary58%
Somewhat necessary
37%
Not very
necessary5%
Not
necessary at all
0%
Do you think a campaign to raise awareness of people for maintaining the cleaner city and environment is
necessary?
(114)

Trincomalee UC 1.4
(115)この前に合紙 この前に合紙

The data collection survey of solid waste management in Sri Lanka Main Report‐ Trincomalee Urban Council
i
Table of content
1 Introduction .................................................................................................................................... 1
1.1 Background conditions of Trincomalee Urban Council .......................................................... 1
2 Waste Generation Survey (WGS) .................................................................................................... 3
2.1 Waste Generation Survey Results ........................................................................................... 4
3 Public Opinion Survey (POS) ........................................................................................................... 8
3.1 Public opinion survey methodology ....................................................................................... 8
3.2 Results of Public Opinion Survey ............................................................................................ 9
4 Final disposal site survey (FDS) ..................................................................................................... 12
4.1 Introduction the FDS at Trincomalee UC’s dumpsite ........................................................... 12
4.1.1 Survey Method .............................................................................................................. 12
4.1.2 Target of Survey ............................................................................................................ 12
4.1.3 Data Sampling ............................................................................................................... 12
4.2 Current condition of final disposal site and its surroundings ............................................... 13
4.2.1 Final Disposal Site of Trincomalee UC ........................................................................... 13
4.2.2 History and evolution of the dumpsite ......................................................................... 13
4.2.3 Extend and landform ..................................................................................................... 15
4.2.4 Waste receiving and disposal ........................................................................................ 15
4.3 Site infrastructure facilities ................................................................................................... 16
4.3.1 Current condition of final disposal site and its surroundings ....................................... 18
4.3.2 Operation and Management of final disposal site ....................................................... 19
(116)

The data collection survey of solid waste management in Sri Lanka Main Report‐ Trincomalee Urban Council
ii
List of Tables
Table 2‐1 Type of data collected for WGS in Trincomalee UC ................................................................ 3
Table 2‐2 Household population (GN level) within Trincomalee UC area .............................................. 4
Table 2‐3 Type and number of municipal establishment own by Trincomalee UC ................................ 4
Table 2‐4 Number of government and privet institutions within Trincomalee UC ................................ 5
Table 2‐5 Number of business establishments in TUC area ................................................................... 6
Table 3‐1 Category and number of samples for Public Opinion Survey ................................................. 8
Table 3‐2 Average and standard deviation values of income and family size ........................................ 9
Table 4‐1 Data collected during the final disposal site survey ............................................................. 12
Table 4‐2 Estimated waste disposal quantities at Kannia dumpsite .................................................... 16
(117)

The data collection survey of solid waste management in Sri Lanka Main Report‐ Trincomalee Urban Council
iii
List of Figures
Figure 1‐1 City map of Trincomalee Urban Council ................................................................................ 2
Figure 3‐1 Method of garbage discharge by residence in TUC area ....................................................... 9
Figure 3‐2 Willingness of residence for a source separated garbage collection system in Trincomalee
UC .......................................................................................................................................................... 10
Figure 4‐1 Location of Trincomalee UC's MSW dumpsite in Trincomalee peninsula ........................... 13
Figure 4‐2 Historical evolution of Trincomalee MSW dumpsite from year 2005 to 2014 .................... 14
Figure 4‐3 Environment around the Trincomalee UC's dumpsite ........................................................ 14
Figure 4‐4 Elephants scavenge in the dumpsite ................................................................................... 15
Figure 4‐5 Few notable features at Kannia dumpsite in Trincomalee .................................................. 17
(118)

The data collection survey of solid waste management in Sri Lanka Main Report‐ Trincomalee Urban Council
1
1 Introduction
The purpose of this survey is to obtain the current data regarding Solid Waste Management (SWM)
at Trincomalee Urban Council (TUC). The data collection survey was conducted from 26th October to
30th October, 2015 by a team of expert dispatched by Waste To Energy Technologies Limited.
This report consists of brief summaries of survey methods and results. The additional primary data
and records are available as soft copies. The preliminary data collection was conducted through four
comprehensive surveys which are;
i. Waste Generation Survey (WGS) is to gather information on waste generation sources at
TUC based on secondary data available at TUC and other relevant organizations.
ii. Public Opinion Survey (POS) is to gather information on public opinion on current waste
management in TUC. The POS was conducted through a questionnaire survey that covers
different types of waste generators in the TUC area.
iii. Final Disposal Site Survey (FDSS) is to collection data on final MSW disposal site of TUC
based on secondary data as well as field recordings & visits to the site.
1.1 Background conditions of Trincomalee Urban Council
Trincomalee was administered by a Local Board between 1884 and 1933. Then between 1933 and
1939, the city administered by a Local Development Board. Thereafter city was promoted to an
Urban Council on 1st January 1940. However, Trincomalee is one of the largest cities in Sri Lanka
without municipality status although UC was established 75 years ago.
The Trincomalee Town lies in the Eastern part of the Trincomalee District. It is the District Head
Quarters for Trincomalee District. The area of the Town is about 7.5 km2 and the town is mainly
surrounded by sea and bay except from North and North‐west. The Urban Council is part of the
Trincomalee Town & Gravets DS division.
In general the topography is almost flat; the highest elevation is the Koneshwaram Temple area
which is one of the famous tourist attractions in Trincomalee city.
Trincomalee district has typical tropical climate with two rainy seasons occur; major during the
North East monsoons (October to January) and the minor rainy season occurs during the South West
monsoon (April and May). The period between the South West Monsoon and the North East
Monsoon is the dry season extending from June to September. The average rainfall is 1569 mm with
mean annual air temperature of 28.5 °C.
There are 18 GN divisions in the city with 14, 538 families (Figure 1‐1). The total residential
population in the TUC is 53, 550. Majority of residence are Tamil and Muslims comes at second. The
Sinhalese group restricted to 3 villages on around the Kandy‐Trincomalee main road.
The city has been divided into 12 wards; however the health administration has defined its own
warding system restricting the number of wards to 9 wards.
(119)

The data collection survey of solid waste management in Sri Lanka Main Report‐ Trincomalee Urban Council
2
Figure 1‐1 City map of Trincomalee Urban Council
(120)

The data collection survey of solid waste management in Sri Lanka Main Report‐ Trincomalee Urban Council
3
2 Waste Generation Survey (WGS)
In order to obtain general information on waste generation amounts, the data available at waste
management section of the Health Department, Works Department and Revenue Department of
TUC was used. Some of the data was available in the form of formal records and reports which were
treated as the most precise secondary data while the data collected from official interviews with
TUC officers was treated as verification data. Thus, the survey data was collected through different
methods;
a) Recording and compiling of published and verified data by TUC,
b) Reading and recording of unpublished & non‐confidential data available at TUC,
c) Recording and official statistics available at Divisional Secretariat offices, and
d) Official person‐to‐person interview with relevant officers at TUC for verification of data.
The numerical data was collected as specified in following Table 2‐1.
Table 2‐1 Type of data collected for WGS in Trincomalee UC
Source Description
Household Each number of following category households was surveyed;1) High income level, 2) Middle income level and 3) Low income level.
Commercial Each number of following category restaurants was surveyed;1) Large size restaurants, 2) Middle size restaurants and 3) Small size restaurants. Each number of following category shops was surveyed; 1)Organic shops (large) 2)Organic shops (middle) 3)Organic shops (small) 4)Non‐Organic shops (large) 5)Non‐Organic shops (middle) 6)Non‐Organic shops (small)
Hotels Each number of following category hotels was surveyed;1) Large size hotels 2) Middle size hotels and 3) Small size hotels.
Markets Number of stalls and types
Institutions Each number of following institute was surveyed;1) Schools 2) Hospitals (government) 3) Hospitals (private) 4) Public office 5) Bank/private office 6) Buddhist temples 7) Hindu temples 8) Mosques 9) Churches 10) Navy/Police/ Army bases 11) Others
Industries Wastes from any industries.
(121)

The data collection survey of solid waste management in Sri Lanka Main Report‐ Trincomalee Urban Council
4
Source Description
Other Public parks and other public facilities
Construction and demolition
Wastes originating from construction, rehabilitation and demolition activities, etc.
Hazardous (Special)
Management and collection of hazardous wastes originating from various sources, including household items
2.1 Waste Generation Survey Results
The records indicate that the total residential population within TUC is 53, 550 (Source: Divisional
Secretariat, Trincomalee. 2015). The Trincomalee UC area consists of 18 Grama Niladari (GN)
divisions as shown in below Table 2‐2.
Table 2‐2 Household population (GN level) within Trincomalee UC area
GN division Population
Abayapura 4124
Anpuvalipuram 4266
Arasadi 2022
Arunagirinagar 1705
Jinnanagar 2936
Linganagar 3359
Manayaveli 3630
Mihindupura 1369
Murugapuri 3343
Orr's Hill 4778
Pattanatheru 1160
Peruntheru 2549
Selvanayahapuram 2628
Sivapuri 4060
Sonagavadi 2629
Thillainagar 2210
Thirukadaloor 3554
Villundy 3228
Total 53550
As shown in following, Trincomalee UC own and control a larger number of public properties and
institutes.
Table 2‐3 Type and number of municipal establishment own by Trincomalee UC
Public property No. of units
Town Hall 1
(122)

The data collection survey of solid waste management in Sri Lanka Main Report‐ Trincomalee Urban Council
5
Public property No. of units
Libraries 1
Reading centres 3
Children's parks 3
Play grounds 4
Market complexes 2
Cemetery 3
Bus stand complexes 2
Office/ sub‐office 42
Slaughter house 1
Fish markets 2
Meat stall/ markets 17 stall/ 1 market
Public toilets 61
Community centres 19
Gymnasiums 1
Staff Quarters 45
Public wells 30
Three wheeler parks 50
pavillion 2
Quarters‐ staff 33
Quarters ‐ labour lines 49
Stadium 2
Trincomalee city host most of the government and privet sector institutes in the Trincomalee District.
Following table shows the number of government and privet/non‐government establishments
within Trincomalee UC.
Table 2‐4 Number of government and privet institutions within Trincomalee UC
Institute No. of units
Schools 75
Other education institutes 61
General Hospital 1
Hospitals ‐ Clinics 1
Medical clinics 43
District Secretariat office 1
Divisional secretary offices 1
Banks 12
Post office 6
Other Government offices 14
Police stations 1
Military (Army/ Navy/ Air‐force) 1
International NGO 10
(123)

The data collection survey of solid waste management in Sri Lanka Main Report‐ Trincomalee Urban Council
6
Institute No. of units
Local NGO 12
Cultural & Religious school 51
Sports clubs 32
Community based organizations 47
Buddhist temples 3
Hindu Kovils 52
Mosques 9
Churches 20
A major portion of MSW is generated from commercial sector in the city. Following Table 2‐5 shows
the number of different commercial (business) establishments in TUC area.
Table 2‐5 Number of business establishments in TUC area
Business establishments No of units
Business establishments No of units
Large hotels 6 Iron welding 35
Large size restaurants 49 Plastic shop 20
Middle size restaurants and 52 Mobile phone shop 30
Small size restaurants. 60 Fried fish shop 5
Vegetable(middle) 45 Sweet shop 35
Fruit shops (middle) 20 Shoe palaces 30
Glossary shops 15 Roof tiles sales 15
General wholesale shops (large) 110 Coconut business 6
General wholesale shops (small) 205 Egg business 10
Textile trading shops (large) 140 Temple festival goods 12
Hardware shops 25 Printers 10
Vehicle spare parts shops 22 Gas cylinder sales 20
Timber/furniture shops 25 Tyre tube sales 8
Vegetable sales shops 116 Milk powder sales 10
Fish sales stalls 47 Old iron sale shop 13
Meat sales stalls 17 Cement shop 13
Barber shops 25 Recording place 17
Beauty salon 12 Net café‐ E‐mail 25
Pharmacy 22 coffin box sale 2
Transport providers 8 Saw mills 1
Contractors 28 Stone quarry 1
Foreign visa 8 Dairy production 1
Pawning centres 27 Processing fish 1
Computer literacy 6 Gingerly coconut oil 1
Driving learners 2 Bakery products 1
Foreign money exchangers 10 Sugar factory and Palmyra 1
Stationary shops 40 Chocolates & sugar confectionaries 1
(124)

The data collection survey of solid waste management in Sri Lanka Main Report‐ Trincomalee Urban Council
7
Business establishments No of units
Business establishments No of units
Tailor shops 42 Food products (papadam) 1
wine shops 16 Palmyra Juggery 1
Ice –chicken shops 15 Soft drink manufacture 1
Fashion shop 70 Aerated water 1
Grinding mills 25 Coir and rope 1
small shops 40 Metal Industries 1
Electronic equipment repairs shop 12 Other 2
(125)

The data collection survey of solid waste management in Sri Lanka Main Report‐ Trincomalee Urban Council
8
3 Public Opinion Survey (POS)
This Public Opinion Survey (POS) was commissioned to identify a range of household waste
management matters in relation to the household sector. Information on household waste
management practices and information on householders’ experiences with waste collection delivery
services was collected for the purpose of improving our understanding of householder’s experiences
and attitudes and also to better understand prevailing situation in householder’s point of view. The
purpose of this survey research included;
a. To collect information on public attitudes to the waste management and environment in
broader,
b. To value aspects of environmental health and protection,
c. To provide information on experiences with Local Authority’s waste management service
and,
d. To provide information on household waste management practices.
3.1 Public opinion survey methodology
The number of samples from Trincomalee identified as 200 households, but size of the sample
increased to 202 during the implementation to increase the accuracy. The selection of households
and areas within Trincomalee UC was done after a consultative discussion with Municipal
commissioner, MSW section officers at TUC and JICA expert team members. Trincomalee UC has 9
zones as SWM areas. Samples were selected from each zone representing approximately equal
numbers.
The survey was executed by a team of university students who were trained about the questionnaire,
survey methodology and the data entering before dispatched to their respective fields. A senior
expertise took the leadership and continuously supervised the field survey. The selected households
were first educated about the survey, its main objectives and asked their cooperation before starting
the field survey. In addition business and institutes, large waste generators, hospitals recycling shops
and large public markets were also surveyed using appropriate questionnaires prepared in
consultation with JICA experts.
Table 3‐1 Category and number of samples for Public Opinion Survey
Category Survey area Number of samples
High‐income households Orr’s Hill, Linganagar, Moor Street, Arunakiri St 51
Middle‐income Households Lower St Orr’s Hill, 2nd Lane Linganagar, Takkiya Lane Moor Street, Arunakiri St
42
Low‐income Households Orr’s Hill, Linganagar, Sirimapura, Thirugnanasampanthar street
58
Businesses /Service organization Kandy Rd, Main Street, Thirugnanasampantar street, Dockyard street, Mosque Rd
40
Large waste generators 6
Markets 2
Hospitals 2
(126)
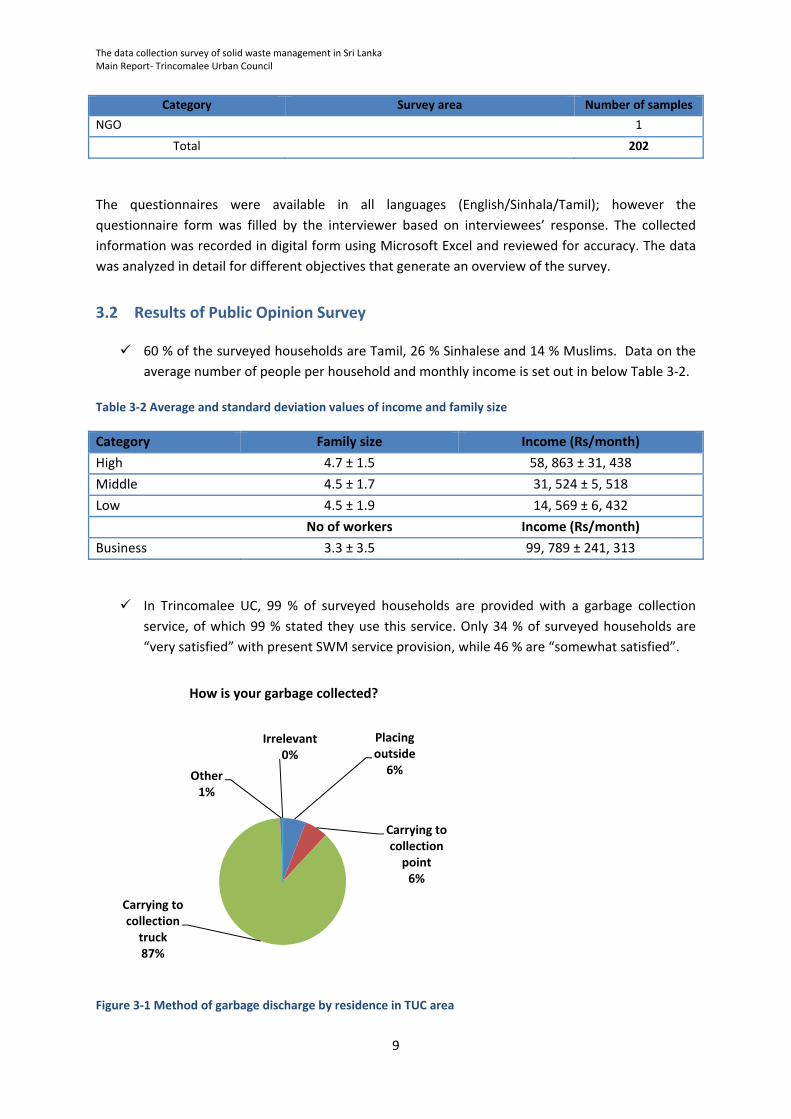
The data collection survey of solid waste management in Sri Lanka Main Report‐ Trincomalee Urban Council
9
Category Survey area Number of samples
NGO 1
Total 202
The questionnaires were available in all languages (English/Sinhala/Tamil); however the
questionnaire form was filled by the interviewer based on interviewees’ response. The collected
information was recorded in digital form using Microsoft Excel and reviewed for accuracy. The data
was analyzed in detail for different objectives that generate an overview of the survey.
3.2 Results of Public Opinion Survey
60 % of the surveyed households are Tamil, 26 % Sinhalese and 14 % Muslims. Data on the
average number of people per household and monthly income is set out in below Table 3‐2.
Table 3‐2 Average and standard deviation values of income and family size
Category Family size Income (Rs/month)
High 4.7 ± 1.5 58, 863 ± 31, 438
Middle 4.5 ± 1.7 31, 524 ± 5, 518
Low 4.5 ± 1.9 14, 569 ± 6, 432
No of workers Income (Rs/month)
Business 3.3 ± 3.5 99, 789 ± 241, 313
In Trincomalee UC, 99 % of surveyed households are provided with a garbage collection
service, of which 99 % stated they use this service. Only 34 % of surveyed households are
“very satisfied” with present SWM service provision, while 46 % are “somewhat satisfied”.
Figure 3‐1 Method of garbage discharge by residence in TUC area
Placing outside6%
Carrying to collection point6%
Carrying to collection truck87%
Other1%
Irrelevant0%
How is your garbage collected?
(127)

The data collection survey of solid waste management in Sri Lanka Main Report‐ Trincomalee Urban Council
10
Households’ main methods of waste discharge are shown in Figure 3‐1. The most common
method is carrying garbage to collection truck (87 %). 6% of residence discharges waste
outside their premises for house to house collection while another 6 % caring waste to
waste collection points.
78% of surveyed households receive the garbage collection service once in a week while 15%
stated that they received the service less frequent than once/week. However, 61%
discharge their garbage as soon as it is generated and 34 % discharge their garbage daily.
The discrepancy between these figures explains the large amount of discarded garbage
present on many streets around Trincomalee.
In general, adult females handle waste in about 79 % of surveyed households.
As shown in Figure 3‐2, only 20 % of surveyed households are not willing to cooperate with
source separation for recycling while majority (69 %) very much willing for separate garbage
collection system.
Ando also, 69 % of surveyed households stated that there are recyclable collectors or
someone who comes to collect their reusable or recyclable materials.
Figure 3‐2 Willingness of residence for a source separated garbage collection system in Trincomalee UC
Only 21 % of surveyed households use kitchen/garden waste for composting and used the
finished compost for their own garden.
Many surveyed households (60 %) have ever discussed proper garbage discharge methods at
the community level.
72 % households stated that SWM awareness programmes are very necessary while 24 %
stated “somewhat necessary”.
The average WTP (willingness to pay) for improved SWM services is 37 ± 57 Rs/month per
household. However 23 % of household do not like to pay for SWM service.
Out of all surveyed households, only 9 % stated that they sale/give‐off metal for recycling
and 2 % of residence sale/give‐off tins & cans for recycling. The glass and bottle recycling is
Very much willing69%
Somewhat willing7%
Less willing2%
Not willing20%
Doing already2%
Willingness to cooperate in separate garbage collection system
(128)

The data collection survey of solid waste management in Sri Lanka Main Report‐ Trincomalee Urban Council
11
only practiced by 1 % of households while the plastic recycling is 11 %. Percentage of
household who involved in paper recycling (sale or given‐off) was low (2 %).
(129)

The data collection survey of solid waste management in Sri Lanka Main Report‐ Trincomalee Urban Council
12
4 Final disposal site survey (FDS)
4.1 Introduction the FDS at Trincomalee UC’s dumpsite
4.1.1 Survey Method
The data and information in this report were collected from various sources including published
reports, verified data from Trincomalee Urban Council, and direct interview with responsible Privet
authority (CGL International Eco Pvt Ltd) at disposal site.
4.1.2 Target of Survey
The survey is focus on obtaining general information on waste receiving, handling, disposal, facility
management, environmental monitoring and legal adherences.
4.1.3 Data Sampling
The numerical data was collected as specified in following Table 4‐1.
Table 4‐1 Data collected during the final disposal site survey
Survey Items Method
1 Current condition of final disposal site and its surroundings
Disposal method and structure Records, visual observation
Soil‐covering Records, visual observation
Land owner Records
Residual area Records, visual observation
Leachate water Records, visual observation
Waste picker Records, visual observation, interview
Scattering waste, smoke, fire, offensive odour, animals and so on
Records, visual observation
2 Operation and Management of final disposal site
Environmental Protect License and Environmental Clearance
Record
Personnel Records, interview
Operation vehicles, their maintenances and drivers Records, interview
Weighbridge Records, interview
Waste collection data Records, interview
Supervisory method Records, interview
3 Waste amount to final disposal site (24 hours, 7 days) Records, Survey
4 Adverse impact near by residences Records, Survey
5 Implementation status of geological, topographic and EIA survey
for new final disposal site
Records, interview
6 Progress situation for new final disposal site Records, interview
7 Court case Records, interview
(130)

The data collection survey of solid waste management in Sri Lanka Main Report‐ Trincomalee Urban Council
13
4.2 Current condition of final disposal site and its surroundings
4.2.1 Final Disposal Site of Trincomalee UC
The final disposal site is situated in a forest reserve near Kannia village, at about 9 km away from the
city center of Trincomalee on the left of Trincomalee‐Anuradhapura (A 12) main road. The final
disposal site is situated inside the western boarder of Naval Headquarters Sanctuary which is
administrated by Department of Forestry and District Secretariat of Trincomalee.
Figure 4‐1 Location of Trincomalee UC's MSW dumpsite in Trincomalee peninsula
4.2.2 History and evolution of the dumpsite
The dumpsite was first started in year 2005. From the beginning, the site was commonly shared by
Trincomalee Urban Council and Trincomalee Four Gravets PS. The historical evolution of the
dumpsite is illustrated in Figure 4‐2.
The west side of the dump extend up to the Trincomalee lagoon, approximately 600 m away from
the present dumping area. The north of the dumpsite extend up to an flood water regulation
channel that originate from an anicut built to regulate flood waters on the right side of the road
coming through the paddy fields.
(131)

The data collection survey of solid waste management in Sri Lanka Main Report‐ Trincomalee Urban Council
14
As shown in the Figure 4‐3, the nearest residential area is on the opposite site of the main road
which is 700 m away from the dumpsite.
Figure 4‐2 Historical evolution of Trincomalee MSW dumpsite from year 2005 to 2014
Figure 4‐3 Environment around the Trincomalee UC's dumpsite
(132)

The data collection survey of solid waste management in Sri Lanka Main Report‐ Trincomalee Urban Council
15
4.2.3 Extend and landform
At present, a 5 hectare land has been allocated for the dumpsite by Department of forestry and
District Secretariat of Trincomalee which has been planned to expand up to 25 hectares during the
future development.
As shown in Figure 4‐4, the area is covered with thick forest with abundant wildlife. Especially, folk
of elephants frequently visit the site for scavenging. The landform is a flat‐undulated terrain with a
mild slope towards North. However, there are several seasonal streams crossing the access road to
the dumpsite.
Figure 4‐4 Elephants scavenge in the dumpsite
Although the main dumping area is situated about 1 km inside the forest, waste has been dumped
either sides of the road. This practice is very common during the rainy season when vehicles could
not travel on the unpaved muddy access road.
4.2.4 Waste receiving and disposal
Very recently, starting from 1st of October, 2015, the overall management and maintenance of the
dumpsite was handed over to a privet company called CGL International Eco Pvt Ltd. The intension
of Privet Company is to establish plastic recycling center and a waste to energy facility at the
dumpsite after preliminary site rehabilitation. The site rehabilitation works have already been
started. The company has dispatched several workers to work at the site (watchmen and record
keeper). In addition, access road has been cleared and partly paved with concrete (approximately
150 m). At present, the Company does not collect a tipping fee for vehicle entry and disposal.
The existing dumpsite is commonly shared by two Local Authorities and few Government and Privet
sector organizations in Trincomalee District.
(133)

The data collection survey of solid waste management in Sri Lanka Main Report‐ Trincomalee Urban Council
16
The available records show that dumpsite receive 10 to 30 loads of MSW from different
organizations. The estimated waste quantities disposed at the dumpsite is shown Table 4‐2. In
addition, 2‐6 loads of toilet waste is also transported in gully bowser and disposed at the dumpsite.
Table 4‐2 Estimated waste disposal quantities at Kannia dumpsite
Survey date TUC UPS PRIMA NAVY POLICE OTHER Gully waste
Tonnes/day m3/day
18/10/2015 23.5 7.1 0.0 2.4 7.1 2.4 24.0
19/10/2015 17.0 9.4 0.0 2.4 9.4 2.4 8.0
20/10/2015 45.4 7.1 7.1 0.0 11.8 7.1 20.0
21/10/2015 10.9 9.4 0.0 4.7 18.8 4.7 0.0
22/10/2015 37.9 2.4 0.0 0.0 21.2 4.7 20.0
23/10/2015 4.7 2.4 0.0 2.4 7.1 2.4 4.0
24/10/2015 31.3 0.0 0.0 4.7 14.1 14.1 24.0
25/10/2015 7.6 0.0 0.0 4.7 11.8 0.0 8.0
27/10/2015 10.0 9.4 0.0 2.4 7.1 0.0 8.0
TUC: Trincomalee Urban Council UPS: Uppuveli Pradeshiya Sabha PRIMA: Prima Mills Pvt Ltd NAVY: Sri Lanka navy camp‐ Trincomalee POLICE: Sri Lanka Police Headquarters‐ Trincomalee Other: Town & Gravet PS and indiviaduals
4.3 Site infrastructure facilities
There is an entrance to the site from the Trincomalee‐Anuradhapura (A12) highway. The access road
has not been paved and there is no gate or office building near the entrance.
There was an electric fence around the dumping area which was constructed in 2013. However, the
fence was damaged by elephants soon after the construction.
In addition, there is a partly constructed toilet waste treatment facility at the middle of dumping
ground. Some of the installation at the toilet waste disposal facility was also damaged by elephants
in year 2013.
(134)

The data collection survey of solid waste management in Sri Lanka Main Report‐ Trincomalee Urban Council
17
Figure 4‐5 Few notable features at Kannia dumpsite in Trincomalee
(135)

The data collection survey of solid
waste m
anagem
ent in Sri Lanka
Main Rep
ort‐ Trincomalee
Urban
Council
18
4.3.1
Current condition of final disposal site and its surroundings
1
Current condition of final disposal site and its surroundings
1.1
Disposal m
ethod and structure
Incoming waste loads (tractors, compactors and gully bowsers) are recorded
at the en
trance gate(starting from 2
nd week
of October).
All other M
SW collection veh
icles em
ptied
its waste at the dumpsite. No specific control m
easures apply for selection of
dumping area. Thus, Open
Dumping is practiced
.
All other wastes are dumped
on the ground and no compaction or spreading
No m
achineries are em
ployed at the site. However, site m
anagem
ent explained
that they w
ill employ bulldozer when
there is a req
uirem
ent for leveling the waste.
Sewage is discharged to tem
porally streams near culverts
1.2
Soil‐covering
Covering of waste by soil is not practiced
1.3
Land owner
Trincomalee
Divisional Secretariat and Dep
artm
ent of Wildlife possesses the ownership of the land and surrounding
area.
However, Trincomalee
UC and the Company are in the process of obtaining 25 acres of land for future developmen
t
1.4
Residual area
Approximately 10ha area has already been covered with waste
1.5
Leachate water
No leachate collection and treatmen
t system
Leachate and surface water flow towards the down slope and into the forest
1.6
Waste picker
Admission of waste pickers has been restricted by the Company
1.7
Scattering waste, sm
oke, fire,
offen
sive odor, anim
als
Waste is dumped
everywhere on the dumping site, especially along the access road
There is eviden
ce that at least half of the dumpsite (approximately 2 hectares) has been recen
tly burned
out by
intentional or unintentional fires.
There are more than
25 stray dogs reside in the dump site
(136)

The data collection survey of solid
waste m
anagem
ent in Sri Lanka
Main Rep
ort‐ Trincomalee
Urban
Council
19
4.3.2
Operation and M
anagement of final disposal site
2
Operation and M
anagemen
t of final disposal site
2.1
Environmen
tal Protect License and Environmen
tal
Clearance
None
2.2
Personnel
1‐Supervisor –visit in the morning (employ by the Company)
1‐Labors‐w
orks during daytime and keep veh
icle entry records (employ by the Company)
1‐Labors‐w
orks during daytime and keep veh
icle entry records (employ by the TU
C)
2.3
Operation veh
icles, their maintenances and drivers
None
2.4
Weighbridge
None
2.5
Waste collection data
A record book is available from 1
stOctober 2015
2.6
Supervisory m
ethod
Company manager and site supervisor freq
uen
tly visit the site
3.0
Waste amount to final disposal site (24 hours, 7
days)
A summary is shown in
Table 4‐2
4.0
Adverse im
pact nearby residen
ces
Residen
ces are at least 500 m
away from the dumping area. A
nd the forest act as a cover for dour
and waste blowing.
5.0
Implemen
tation status of geological, topographic and
EIA survey for new
final disposal site
None
6.0
Progress situation for new
final disposal site
None
(137)

The data collection survey of solid
waste m
anagem
ent in Sri Lanka
Main Rep
ort‐ Trincomalee
Urban
Council
20
2
Operation and M
anagemen
t of final disposal site
7.0
Court case
None
(138)

Annex
TRINCOMALEE URBAN COUNCIL
(139)

Response to Public Opinion Survey for Household Trincomalee UC
Page 1 of 7
Response to Public Opinion Survey for Household
Sinhala26%
Muslim
14%
Tamil60%
Other
0%
Ethnicity
Buddhist26%
Islam14%
Hindu
50%
Christian
10%
Other
0%
Religion
Garbage collection
53%
Storm water
drainage43%
Water supply4%
Please specify the priority for your daily life regarding the improvement of the following
aspects?
Yes99%
No1%
Are there garbage collection services in your area?
Yes99%
No1%
Do you use these services?
Placing outside6%
Carrying
to collection
point6%
Carrying
to collection
truck87%
Other1%
Irrelevant
0%
How is your garbage collected?
(140)

Response to Public Opinion Survey for Household Trincomalee UC
Page 2 of 7
Response to Public Opinion Survey for Household
2‐25m39%
26‐50m33%
51‐100m11%
100‐250m11%
>250m
6%
Don't know0%
How far do you have to walk to reach this point?
Daily
0%
> 4
times/Wk1%
2‐3 times/Wk
1%
Once/Wk78%
< Once/Wk
15%
Irregular
5%
Don't
know0%
Irrelevant
0%
How often is your garbage collected?
Yes51%
No49%
Don't know0%
Is the garbage collection service done at a fixed time on the collection?
Very
satisfied34%
Somewhat satisfied46%
Less than satisfied15%
Not satisfied at
all5%
Are you satisfied with the collection service?
Not properly done
15%
Frequency too low27%
Is irregular19%
Too early/ too late
9%
Bad workers' behaviour
3%
Workers demand
allowance13%
Allowance is expensive0%
Service not fair
0%Point if too far
0% Other14%
What are reasons for dissatisfaction?
(141)

Response to Public Opinion Survey for Household Trincomalee UC
Page 3 of 7
Response to Public Opinion Survey for Household
Yes
17%
No
83%
Have you ever complained about the garbage collection service to the authorities in the last
three years?
Yes
3%
No
97%
Do you want to receive a garbage collection service? (only for persons who do not have garbage collection services in the area)
Discharge outside
70%Specific place
5%
Open dump
4%
Request a collection truck0%
Self‐dispose12%
Composting4%
Give for recycling
0%Other (collection
truck/ common bin)5%
How do you dispose off garbage generated in your premises?
As soon as
61%Once daily
34%
Once 2‐3
days5%
Less
frequent0%
How often do you dispose off garbage generated in your premises?
Adult male17%
Adult female76%
Servant0%
Other7%
Who mainly handles wastes at home?
(142)

Response to Public Opinion Survey for Household Trincomalee UC
Page 4 of 7
Response to Public Opinion Survey for Household
Very much willing53%
Somewhat willing11%
Less
willing3%
Not willing32%
Doing already1%
Willingness to cooperate in separate garbage collection system
Reduce landfill amount1%
Protect environm
ent70%
Can earn
money25%
Others4%
If you are willing to cooperate, why do you think recycling is important?
Yes50%
No50%
Don't know0%
Is there someone who comes around to collect or buy your reusable or recyclable materials?
Yes5%
No95%
Do you take for recyclable materials to shops for refund or sale?
Yes26%
No74%
Are you using kitchen/garden waste for composting?
< Half
22%
Half27%
> Half8%
All43%
If you do composting, how much of kitchen waste used for composting?
(143)

Response to Public Opinion Survey for Household Trincomalee UC
Page 5 of 7
Response to Public Opinion Survey for Household
< Half7%
Half36%
> Half0%
All57%
If you do composting, how much of garden waste used for composting?
Sell
3%
Own use
97%
What do you do with produced compost?
Sell
3%
Own use
97%
Suppose that you are satisfied with the service of Municipal solid waste management, either as is or as a result of improvement. Think for a moment about the largest amount of money that your
household would be willing to pay each month as a garbage colle
Yes
34%
No
61%
Don't
know5%
Do you have any community‐based organizations to solve not only the waste problems but also
other community problems?
Yes
34%
No
61%
Don't
know5%
Have you ever discussed the methods of proper garbage handling and discharge at the meetings?
(144)

Response to Public Opinion Survey for Household Trincomalee UC
Page 6 of 7
Response to Public Opinion Survey for Household
Yes
93%
No
7%
Have you ever been taught method of proper garbage handling & disposal?
Parents0%
Communit
y2%
School0%
Local Gov.
72%
Central Gov.2%
NGOs1%
Others23%
If you have learned , who taught proper garbage handling methods?
Very necessary
70%
Somewhat necessary
28%
Not very necessary
2%
Not necessary at
all0%
Do you think a campaign to raise awareness of people for maintaining the cleaner city and environment is
necessary?
(145)

Kurunegala MC 1.5
(147)この前に合紙 この前に合紙

The data collection survey of solid waste management in Sri Lanka Main Report‐ Kurunegala Municipal Council
i
Table of content
1 Introduction .................................................................................................................................... 1
1.1 Background conditions of Kurunegala Municipal Council ...................................................... 1
2 Waste Generation Survey (WGS) .................................................................................................... 2
2.1 Waste Generation Survey Results ........................................................................................... 3
3 Public Opinion Survey (POS) ........................................................................................................... 6
3.1 Public opinion survey methodology ....................................................................................... 6
3.2 Results of Public Opinion Survey ............................................................................................ 7
4 Final disposal site survey (FDS) ..................................................................................................... 10
4.1 Introduction the FDS of Kurunegala MC ............................................................................... 10
4.1.1 Survey Method .............................................................................................................. 10
4.1.2 Target of Survey ............................................................................................................ 10
4.1.3 Data Sampling ............................................................................................................... 10
4.2 Current condition of final disposal site and its surroundings ............................................... 11
4.2.1 Sundarapola waste disposal site ................................................................................... 11
4.2.2 Extend and landform ..................................................................................................... 12
4.2.3 Waste receiving and disposal ........................................................................................ 13
4.2.4 Management of Sundarapola Dumpsite ....................................................................... 14
4.2.5 Major site infrastructure and auxiliary facilities ........................................................... 16
4.2.6 Current condition of final disposal site and its surroundings ....................................... 19
4.2.7 Operation and Management of final disposal site ....................................................... 20
(148)

The data collection survey of solid waste management in Sri Lanka Main Report‐ Kurunegala Municipal Council
ii
List of Tables
Table 1‐1 Basic fact sheet of Kurunegala Municipal Council .................................................................. 1
Table 2‐1 Type of data collected for WGS in Kurunegala MC ................................................................. 2
Table 2‐2 Population statistics of GN divisions in KMC area .................................................................. 3
Table 2‐3 Type and number of municipal establishment own by Kurunegala MC ................................. 3
Table 2‐4 Number of government and privet institutions within Kurunegala MC ................................. 4
Table 2‐5 Types and number of business establishments in KMC area.................................................. 5
Table 3‐1 Category and number of samples for Public Opinion Survey ................................................. 6
Table 3‐2 Average and standard deviation values of income and family size ........................................ 7
Table 4‐1 Data collected during the final disposal site survey ............................................................. 10
Table 4‐3 Sources and quantities of waste disposed at Sundarapola MSW dumpsite ........................ 13
Table 4‐2 Administration structure and human resources available at Sundarapola site ................... 16
(149)

The data collection survey of solid waste management in Sri Lanka Main Report‐ Kurunegala Municipal Council
iii
List of Figures
Figure 1‐1 City map of Kurunegala MC ................................................................................................... 1
Figure 3‐1 Method of garbage discharge by residence in KMC area ...................................................... 8
Figure 3‐2 Willingness of residence for a source separated garbage collection system in Kurunegala
MC ........................................................................................................................................................... 9
Figure 4‐1 Location of Sundarapola dumpsite ...................................................................................... 11
Figure 4‐2 Sundarapola dumpsite and environment within 500 m radius from center ....................... 12
Figure 4‐3 Access road and basic site infrastructure facilities at Sundarapola dumpsite .................... 13
Figure 4‐4 Landfilling machineries at Sundarapola dumpsite............................................................... 14
Figure 4‐5 Waste unloading and dumping area of Sundarapola dumpsite .......................................... 15
Figure 4‐6 Composting facility at Sundarapola dumpsite ..................................................................... 17
Figure 4‐7 Toilet waste treatment facility at Sundarapola dumpsite ................................................... 18
Figure 4‐8 Recycling center at Sundarapola dumpsite ......................................................................... 18
(150)

The data collection survey of solid waste management in Sri Lanka Main Report‐ Kurunegala Municipal Council
1
1 Introduction
The purpose of this survey is to obtain the current data regarding Solid Waste Management (SWM)
at Kurunegala Municipal Council (KMC). The data collection survey was conducted from 30th
October to 4th November, 2015 by a team of expert dispatched by Waste To Energy Technologies
Limited.
This report consists of brief summaries of survey methods and results. The additional primary data
and records are available as soft copies. The preliminary data collection was conducted through four
comprehensive surveys which are;
i. Waste Generation Survey (WGS) is to gather information on waste generation sources at
KMC based on secondary data available at KMC and other relevant organizations.
ii. Public Opinion Survey (POS) is gather information on public opinion on current waste
management in KMC. The POS was conducted through a questionnaire survey that covers
different types of waste generators in the KMC area.
iii. Final Disposal Site Survey (FDSS) is to collection data on final MSW disposal site of KMC
based on secondary data as well as field recordings & visits to the site.
1.1 Background conditions of Kurunegala Municipal Council
Kurunegala city is the capital of the North Western Province of Sri Lanka. It is situated about 94 km
from Colombo, and 42 km from Kandy. Kurunegala Municipal Council is bordering to Kurunegala
Pradeshiya Sabha on all directions (Figure 1‐1). KMC is the major commercial and service hub of the
Kurunegala District as well as the only Local Authority with Municipal status in North Western
Province of Sri Lanka. The city is well renounced for education, especially for popular schools and
tuition centers. And, Kurunegala city is a major transit center in the country connecting north and
south.
Table 1‐1 Basic fact sheet of Kurunegala Municipal Council
Item Description
Province North Western Province of Sri Lanka
District Kurunegala
Local Authority Status Municipal Council
Location in Relation to Kurunegala is situated about 94 km from Colombo, and 42 km from Kandy
Extent of the Authority Area 11. 34 sq.km
No. of Council Wards 12
No. of Council Members 22
No. of Dwellings 6, 049
Population MC record (2012 statistics) 26, 903 (~ 100,000 daily floating population)
Average Population Density 23.72 p/ha
Major economic activities Commerce, services, & light scale industry (Light industries such as vehicle repairs, vehicle service stations, printing presses, textile garments, small scale mechanical workshops, etc.)
(151)

The data collection survey of solid
waste m
anagem
ent in Sri Lanka
Main Rep
ort‐ Kurunegala Municipal Council
1
Figure 1‐1 City map
of Kurunegala MC
(152)

The data collection survey of solid waste management in Sri Lanka Main Report‐ Kurunegala Municipal Council
2
2 Waste Generation Survey (WGS)
In order to obtain general information on waste generation amounts, the data available at waste
management section of the Health Department, Works Department and Revenue Department of
KMC was used. Some of the data was available in the form of formal records and reports which were
treated as the most precise secondary data while the data collected from official interviews with
KMC officers was treated as verification data. Thus, the survey data was collected through different
methods;
a) Recording and compiling of published and verified data by KMC,
b) Reading and recording of unpublished & non‐confidential data available at KMC,
c) Recording and official statistics available at Kurunegala Divisional Secretariat office, and
d) Official person‐to‐person interview with relevant officers at KMC for verification of data.
The numerical data was collected as specified in following Table 2‐1.
Table 2‐1 Type of data collected for WGS in Kurunegala MC
Source Description
Household Each number of following category households was surveyed;1) High income level, 2) Middle income level and 3) Low income level.
Commercial Each number of following category restaurants was surveyed;1) Large size restaurants, 2) Middle size restaurants and 3) Small size restaurants. Each number of following category shops was surveyed; 1)Organic shops (large) 2)Organic shops (middle) 3)Organic shops (small) 4)Non‐Organic shops (large) 5)Non‐Organic shops (middle) 6)Non‐Organic shops (small)
Hotels Each number of following category hotels was surveyed;1) Large size hotels 2) Middle size hotels and 3) Small size hotels.
Markets Number of stalls and types
Institutions Each number of following institute was surveyed;1) Schools 2) Hospitals (government) 3) Hospitals (private) 4) Public office 5) Bank/private office 6) Buddhist temples 7) Hindu temples 8) Mosques 9) Churches 10) Navy/Police/ Army bases 11) Others
Industries Wastes from any industries.
(153)

The data collection survey of solid waste management in Sri Lanka Main Report‐ Kurunegala Municipal Council
3
Source Description
Other Public parks and other public facilities
Construction and demolition
Wastes originating from construction, rehabilitation and demolition activities, etc.
Hazardous (Special)
Management and collection of hazardous wastes originating from various sources, including household items
2.1 Waste Generation Survey Results
The records indicate that the total residential population within KMC is 26, 903 (Source: Divisional
Secretariat, Kurunegala 2015). The Kurunegala MC area consists of 12 Grama Niladari (GN) divisions
as shown in below Table 2‐2 .
Table 2‐2 Population statistics of GN divisions in KMC area
GN Division Name No of Houses Population
Kurunagala Town North 352 1,265
Gangoda 475 2,108
Gattuwana 420 1,843
Kurunagala Town North East 828 3,319
Kurunagala Town East 378 1,710
Theliyagonna 648 3,072
Kurunagala Town Western 988 5,664
Illuppugedara 751 3,136
Kurunagala Town Central 338 1,298
Kurunagala Town Bazaar 43 228
Kurunagala Town South 513 1,920
Udawalpola 315 1,340
Total 6,049 26,903
As shown in following Table 2‐3, Kurunegala MC own and control a larger number of public
properties and institutes.
Table 2‐3 Type and number of municipal establishment own by Kurunegala MC
Public property No of units Public property No of units
Libraries 1 Pola premises 1 (sun & Wed)
Reading centres 1 Community centres 9
Municipal parks 1 Gymnasiums 1
Play grounds 7 Swimming pools 1
Market complexes 1 (151 shops) Common wells 23
Cemetery 2 Town hall 1
Vehicle parking complexes 72 (4 main) Crematoriums 1
(154)
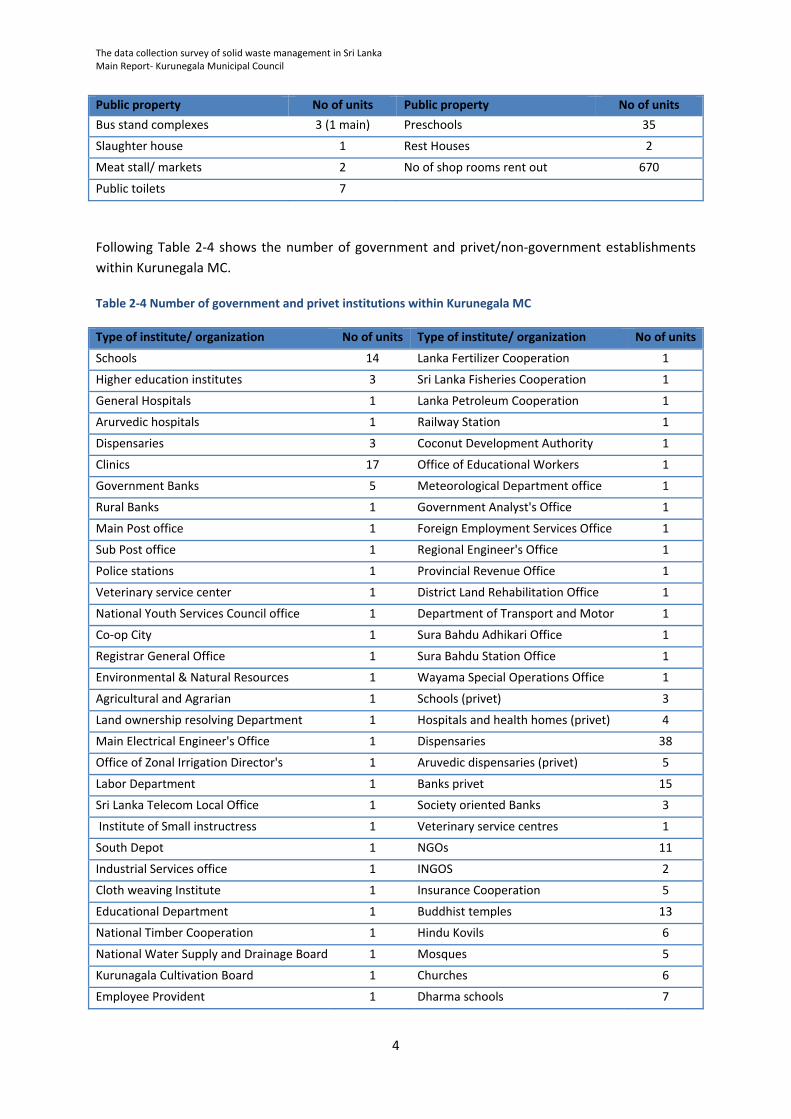
The data collection survey of solid waste management in Sri Lanka Main Report‐ Kurunegala Municipal Council
4
Public property No of units Public property No of units
Bus stand complexes 3 (1 main) Preschools 35
Slaughter house 1 Rest Houses 2
Meat stall/ markets 2 No of shop rooms rent out 670
Public toilets 7
Following Table 2‐4 shows the number of government and privet/non‐government establishments
within Kurunegala MC.
Table 2‐4 Number of government and privet institutions within Kurunegala MC
Type of institute/ organization No of units Type of institute/ organization No of units
Schools 14 Lanka Fertilizer Cooperation 1
Higher education institutes 3 Sri Lanka Fisheries Cooperation 1
General Hospitals 1 Lanka Petroleum Cooperation 1
Arurvedic hospitals 1 Railway Station 1
Dispensaries 3 Coconut Development Authority 1
Clinics 17 Office of Educational Workers 1
Government Banks 5 Meteorological Department office 1
Rural Banks 1 Government Analyst's Office 1
Main Post office 1 Foreign Employment Services Office 1
Sub Post office 1 Regional Engineer's Office 1
Police stations 1 Provincial Revenue Office 1
Veterinary service center 1 District Land Rehabilitation Office 1
National Youth Services Council office 1 Department of Transport and Motor 1
Co‐op City 1 Sura Bahdu Adhikari Office 1
Registrar General Office 1 Sura Bahdu Station Office 1
Environmental & Natural Resources 1 Wayama Special Operations Office 1
Agricultural and Agrarian 1 Schools (privet) 3
Land ownership resolving Department 1 Hospitals and health homes (privet) 4
Main Electrical Engineer's Office 1 Dispensaries 38
Office of Zonal Irrigation Director's 1 Aruvedic dispensaries (privet) 5
Labor Department 1 Banks privet 15
Sri Lanka Telecom Local Office 1 Society oriented Banks 3
Institute of Small instructress 1 Veterinary service centres 1
South Depot 1 NGOs 11
Industrial Services office 1 INGOS 2
Cloth weaving Institute 1 Insurance Cooperation 5
Educational Department 1 Buddhist temples 13
National Timber Cooperation 1 Hindu Kovils 6
National Water Supply and Drainage Board 1 Mosques 5
Kurunagala Cultivation Board 1 Churches 6
Employee Provident 1 Dharma schools 7
(155)

The data collection survey of solid waste management in Sri Lanka Main Report‐ Kurunegala Municipal Council
5
Type of institute/ organization No of units Type of institute/ organization No of units
Guiders headquarters 1 Nun Monasteries 4
Probationary and Child Care 1 Devala 1
Election Department office 1 Youth Societies 13
District Disaster Management Centre 1 Village Development societies 8
Consumer Affairs Authority 1 Women Societies 8
Provincial Ministry of Agriculture 1 Farmers Organizations 4
District Secretariat Office 1 Samurdhi Societies 12
Wayamba Provincial Council Complex 1 Funeral Aiding Societies 2
Land Registration Office 1
A major portion of MSW is generated from commercial sector in the city. Following Table 2‐5 shows
the number of different commercial (business) establishments in KMC area.
Table 2‐5 Types and number of business establishments in KMC area
Type of business No of units Type of business No of units
Middle size restaurants and 140 Rice mills 1
Vegetable shops (large) 43 Cloth weaving 1
Fruit sales shops 9 Coir products 1
Glossary shops 228 Leather products 7
Textile trading shops (large) 243 Constructions 12
Furniture sales shops 10 Fruit processing 4
Vehicle spare parts shops 65 Agricultural tools and equipment 1
Fish sales stalls 9 Gold and silver 7
Meat /fish sales stalls 26 Sweets 36
Barber shops 31 Welding smithies 25
Pharmacy 21 Saw mills 5
Ornamental plant nursery 9 Cement products 7
Ornamental fish 3 Ornamental goods 19
Bakery 12 Stationary production 6
Paints 34 Tailoring 80
Building materials sales 47 Floor mat production 30
God, silver and Gem shops 25 Mushrooms 2
Cooperatives 6 Joss sticks 6
Metal goods 29 Paper production 12
Local materials buying centres 4 Granite 1
Bars 11 Poultry farms 25
Laundry 4 Broiler farms 3
Middle size hotels 40 Buffalo farms 1
Tourist hotels (approved by Tourist Board) 8 Goat farms 10
Garments 3
(156)

The data collection survey of solid waste management in Sri Lanka Main Report‐ Kurunegala Municipal Council
6
3 Public Opinion Survey (POS)
This Public Opinion Survey (POS) was commissioned to identify a range of household waste
management matters in relation to the household sector. Information on household waste
management practices and information on householders’ experiences with waste collection delivery
services was collected for the purpose of improving our understanding of householder’s experiences
and attitudes and also to better understand prevailing situation in householder’s point of view. The
purpose of this survey research included;
a. To collect information on public attitudes to the waste management and environment in
broader,
b. To value aspects of environmental health and protection,
c. To provide information on experiences with Local Authority’s waste management service
and,
d. To provide information on household waste management practices.
3.1 Public opinion survey methodology
The number of samples from Kurunegala identified as 200 households, but size of the sample
increased to 210 during the implementation to increase the accuracy. The selection of households
and areas within Kurunegala MC was done after a consultative discussion with MSW section officers
at KMC and JICA expert team members.
The survey was executed by a team of university students who were trained about the questionnaire,
survey methodology and the data entering before dispatched to their respective fields. A senior
expertise took the leadership and continuously supervised the field survey. The selected households
were first educated about the survey, its main objectives and asked their cooperation before starting
the field survey. In addition business and institutes, large waste generators, hospitals recycling shops
and large public markets were also surveyed using appropriate questionnaires prepared in
consultation with JICA experts.
Table 3‐1 Category and number of samples for Public Opinion Survey
Category Survey area Number of samples
High‐income households Yanthampalawa, Jayanthipura, Araliya uyana, Gemunu Mw, Perakum Mw, Wilegoda Rd
48
Middle‐income Households Gangoda Rd, Yanthampalawa, Gattuwana, Jayanthipura
52
Low‐income Households Ammon Kovil Rd, Gattuwana, Wilegoda, Elugala 50
Businesses /Service organization Central Market, Yanthampalawa, Kachcheri Rd 41
Large waste generators 10
Markets 3
Hospitals 2
Recycling shops 3
NGO 1
(157)
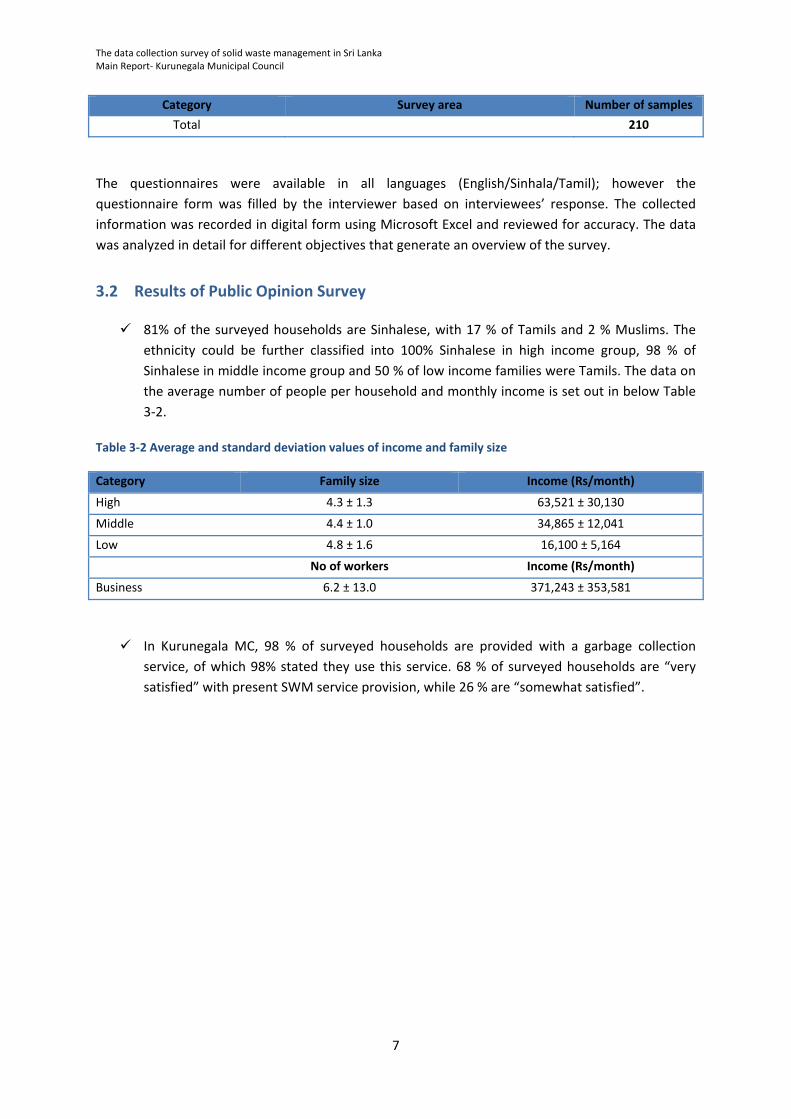
The data collection survey of solid waste management in Sri Lanka Main Report‐ Kurunegala Municipal Council
7
Category Survey area Number of samples
Total 210
The questionnaires were available in all languages (English/Sinhala/Tamil); however the
questionnaire form was filled by the interviewer based on interviewees’ response. The collected
information was recorded in digital form using Microsoft Excel and reviewed for accuracy. The data
was analyzed in detail for different objectives that generate an overview of the survey.
3.2 Results of Public Opinion Survey
81% of the surveyed households are Sinhalese, with 17 % of Tamils and 2 % Muslims. The
ethnicity could be further classified into 100% Sinhalese in high income group, 98 % of
Sinhalese in middle income group and 50 % of low income families were Tamils. The data on
the average number of people per household and monthly income is set out in below Table
3‐2.
Table 3‐2 Average and standard deviation values of income and family size
Category Family size Income (Rs/month)
High 4.3 ± 1.3 63,521 ± 30,130
Middle 4.4 ± 1.0 34,865 ± 12,041
Low 4.8 ± 1.6 16,100 ± 5,164
No of workers Income (Rs/month)
Business 6.2 ± 13.0 371,243 ± 353,581
In Kurunegala MC, 98 % of surveyed households are provided with a garbage collection
service, of which 98% stated they use this service. 68 % of surveyed households are “very
satisfied” with present SWM service provision, while 26 % are “somewhat satisfied”.
(158)

The data collection survey of solid waste management in Sri Lanka Main Report‐ Kurunegala Municipal Council
8
Figure 3‐1 Method of garbage discharge by residence in KMC area
Households’ main methods of waste discharge are shown in Figure 3‐1. The most common
methods are carrying garbage to collection truck (46%) and carrying to garbage collection
point (27%) and discharging it outside their premises for house to house collection (24%).
Only 34% of surveyed households receive a daily garbage collection service while 44 %
stated that they received the service 2‐3 times/week.
69% discharge their garbage as soon as it is generated and 27 % discharge their garbage
daily. Only 4% discharge their garbage 2‐3 times per week.
In general, adult females handle waste in about 67 % of surveyed households.
As shown in Figure 3‐2, 65 % of households separate their garbage into organic and
inorganic waste at the source of generation. Only 5 % of surveyed households are not/less
willing to cooperate with source separation for recycling. Rests of the household are very
much willing (23 %) and somewhat willing (7 %) to cooperate in source separated garbage
collection system.
Further, 73 % of surveyed households stated that there are recyclable collectors or someone
who comes to collect their reusable or recyclable materials. Hence, informal recycling
system is well established in Kurunegala MC area.
Placing outside24%
Carrying to collection point27%
Carrying to collection truck46%
Other0%
Irrelevant3%
How is your garbage collected?
(159)

The data collection survey of solid waste management in Sri Lanka Main Report‐ Kurunegala Municipal Council
9
Figure 3‐2 Willingness of residence for a source separated garbage collection system in Kurunegala MC
20 % of surveyed households use kitchen/garden waste for composting and 97% of them
used the finished compost for their own garden.
Not many surveyed households (48 %) have ever discussed proper garbage discharge
methods at the community level, but 35% said that they discussed the garbage issue at
community meetings.
92 % households stated that SWM awareness programmes are very necessary while 7 %
stated “somewhat necessary”. Only 1% of surveyed households stated that awareness
campaigns are not necessary or not needed at all.
49 % of household do not like to pay for SWM service mainly because of the revenue tax
they paid for KMC. The average WTP (willingness to pay) for improved SWM services is 68 ±
94 Rs/month per household.
Out of all surveyed households, 11 % stated that they sale/give‐off Glass & Bottle for
recycling and 6 % of residence sale/give‐off Plastics for recycling. Also, 1‐8 % of households
sale/ give‐off can & metal for recycling. Cardboard and paper recycling were 0 % and 10 %
respectively.
Very much willing23%
Somewhat willing7%
Less willing0%
Not willing5%
Doing already65%
Willingness to cooperate in separate garbage collection system
(160)

The data collection survey of solid waste management in Sri Lanka Main Report‐ Kurunegala Municipal Council
10
4 Final disposal site survey (FDS)
4.1 Introduction the FDS of Kurunegala MC
4.1.1 Survey Method
The data and information in this report were collected from various sources including published
reports, verified data from Kurunegala Municipal Council, Supervisor of Sundarapola Waste Disposal
site and direct interview with other officers & workers at disposal site.
4.1.2 Target of Survey
The survey is focus on obtaining general information on waste receiving, handling, disposal, facility
management, environmental monitoring and legal adherences.
4.1.3 Data Sampling
The numerical data was collected as specified in following Table 4‐1.
Table 4‐1 Data collected during the final disposal site survey
Survey Items Method
1 Current condition of final disposal site and its surroundings
Disposal method and structure Records, visual observation
Soil‐covering Records, visual observation
Land owner Records
Residual area Records, visual observation
Leachate water Records, visual observation
Waste picker Records, visual observation, interview
Scattering waste, smoke, fire, offensive odour, animals and so on
Records, visual observation
2 Operation and Management of final disposal site
Environmental Protect License and Environmental Clearance
Record
Personnel Records, interview
Operation vehicles, their maintenances and drivers Records, interview
Weighbridge Records, interview
Waste collection data Records, interview
Supervisory method Records, interview
3 Waste amount to final disposal site (24 hours, 7 days) Records, Survey
4 Adverse impact near by residences Records, Survey
5 Implementation status of geological, topographic and EIA survey
for new final disposal site
Records, interview
6 Progress situation for new final disposal site Records, interview
7 Court case Records, interview
(161)

The data collection survey of solid waste management in Sri Lanka Main Report‐ Kurunegala Municipal Council
11
4.2 Current condition of final disposal site and its surroundings
4.2.1 Sundarapola waste disposal site
Final disposal site is located at Sundarapola, at about 3.9 km away from the Kurunegala town (Figure
4‐1). The dumpsite lies within Kalawegedara GN division of Maspotha Divisional Secretariat and also
comes under Kurunegala PS administration limits. Sundarapola waste disposal site is one of the
largest MSW dumpsite in North Western Province of Sri Lanka and one of the oldest MSW dumpsite
in Sri Lanka. The site is commonly shared by KMC and Kurunegala PS for MSW and toilet waste
disposal since late 1920s. In addition, several government and privet organizations also use the site
for MSW and non‐hazardous solid waste disposal.
Figure 4‐1 Location of Sundarapola dumpsite
The available records showed the dumpsite was first started in year 1921. At that time, the
surrounding land use was mainly coconut plantations and scrub lands. However, during the recent
years, there are more than 200 families reside very close to the dumpsite on west side over the
access road. The dumpsite is boarded to Wawagedara forest reserve on East and North sides and to
a small cemetery on south. The forest reserve extends over 1000 acres on West side of the dump.
(162)

The data collection survey of solid waste management in Sri Lanka Main Report‐ Kurunegala Municipal Council
12
4.2.2 Extend and landform
Final disposal site is located at Sundarapola, at about 1 km away from Wariyapola‐Kurunegala
highway (A10). The extent of the final waste disposal site is 12.5 acres. The closet proximity to
residence is around 10 m from the site boundary on the western side across the 3 m wide public
road. The land is having mild slope toward the road on the left. The storm water drain on right side
of the road has been concreted which carry storm water from the site area during the rainy season
and well as leachate water throughout the year.
Figure 4‐2 Sundarapola dumpsite and environment within 500 m radius from center
(163)
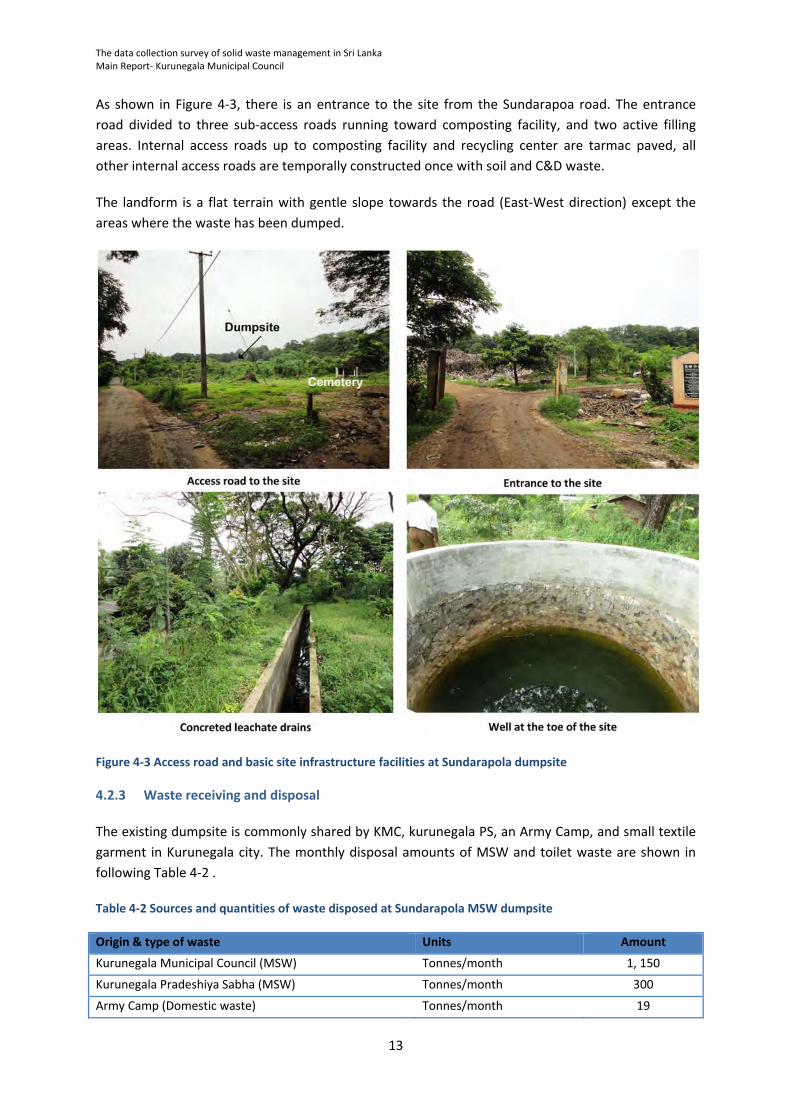
The data collection survey of solid waste management in Sri Lanka Main Report‐ Kurunegala Municipal Council
13
As shown in Figure 4‐3, there is an entrance to the site from the Sundarapoa road. The entrance
road divided to three sub‐access roads running toward composting facility, and two active filling
areas. Internal access roads up to composting facility and recycling center are tarmac paved, all
other internal access roads are temporally constructed once with soil and C&D waste.
The landform is a flat terrain with gentle slope towards the road (East‐West direction) except the
areas where the waste has been dumped.
Figure 4‐3 Access road and basic site infrastructure facilities at Sundarapola dumpsite
4.2.3 Waste receiving and disposal
The existing dumpsite is commonly shared by KMC, kurunegala PS, an Army Camp, and small textile
garment in Kurunegala city. The monthly disposal amounts of MSW and toilet waste are shown in
following Table 4‐2 .
Table 4‐2 Sources and quantities of waste disposed at Sundarapola MSW dumpsite
Origin & type of waste Units Amount
Kurunegala Municipal Council (MSW) Tonnes/month 1, 150
Kurunegala Pradeshiya Sabha (MSW) Tonnes/month 300
Army Camp (Domestic waste) Tonnes/month 19
(164)

The data collection survey of solid waste management in Sri Lanka Main Report‐ Kurunegala Municipal Council
14
Origin & type of waste Units Amount
Industry (Textile waste) Tonnes/month 9
Toilet waste (Gully waste from KMC) m3/month 380
Waste collected and received from KMC at the dumpsite is recorded but there is no weighbridge
facility. Thus, the site office maintains only a record of receiving waste from KMC but not from other
sources.
The management of the dumpsite has a pre‐schedule plan for waste disposal. The site supervisor
instructs the waste collection vehicles and waste handling machineries for disposal area.
One of the biggest challenges in management is to get dumping vehicle access to the active filling
area during the heavy rainy season. Therefore, site management uses a crawler excavator for waste
handling during.
Figure 4‐4 Landfilling machineries at Sundarapola dumpsite
Site facilities include two machineries; an excavator (primarily for dumpsite) and a skid‐steer loader
(primarily for compost facility).
4.2.4 Management of Sundarapola Dumpsite
The dumpsite lies within the Kurunegala PS limits; however the ownership of the land lies with KMC
(taken on 99 year lease from Department of Wildlife and Government Agent of Kurunegala).
The integrated site includes a composting facility, plastic recycling facility and night soil treatment
facility. Three tractor loads of waste containing high amount of biodegradables from Market places
and day‐fair are used for composting every day. The compostable waste is unloaded on the open
concrete floor and sorted for large non‐degradable particles. Window piles are built with Skid‐steer
loader. Rest of the general MSW is unloaded in the dumping area and heaps are made by the
Excavator (type 120). Sorted plastics collected through recyclable collection system of are received
to the recycling facility. Plastics and other recyclables from the composting process are also sent to
(165)

The data collection survey of solid waste management in Sri Lanka Main Report‐ Kurunegala Municipal Council
15
the recycling factory. Rejected materials from sorting such as contaminated Polythene, textile,
Styrofoam are collected by the Holcim Pvt LTD to use as RDF in the cement factory. However, KMC
does not pay or charge from Holcim Pvt Ltd.
Figure 4‐5 Waste unloading and dumping area of Sundarapola dumpsite
(166)
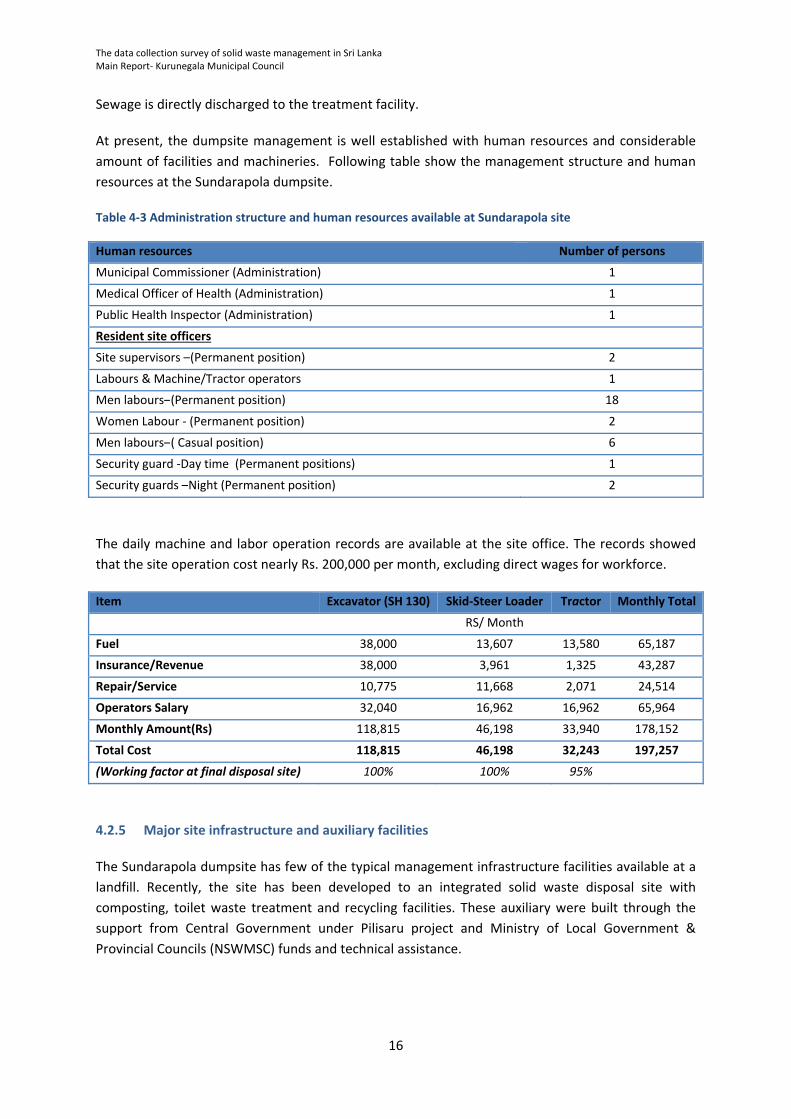
The data collection survey of solid waste management in Sri Lanka Main Report‐ Kurunegala Municipal Council
16
Sewage is directly discharged to the treatment facility.
At present, the dumpsite management is well established with human resources and considerable
amount of facilities and machineries. Following table show the management structure and human
resources at the Sundarapola dumpsite.
Table 4‐3 Administration structure and human resources available at Sundarapola site
Human resources Number of persons
Municipal Commissioner (Administration) 1
Medical Officer of Health (Administration) 1
Public Health Inspector (Administration) 1
Resident site officers
Site supervisors –(Permanent position) 2
Labours & Machine/Tractor operators 1
Men labours–(Permanent position) 18
Women Labour ‐ (Permanent position) 2
Men labours–( Casual position) 6
Security guard ‐Day time (Permanent positions) 1
Security guards –Night (Permanent position) 2
The daily machine and labor operation records are available at the site office. The records showed
that the site operation cost nearly Rs. 200,000 per month, excluding direct wages for workforce.
Item Excavator (SH 130) Skid‐Steer Loader Tractor Monthly Total
RS/ Month
Fuel 38,000 13,607 13,580 65,187
Insurance/Revenue 38,000 3,961 1,325 43,287
Repair/Service 10,775 11,668 2,071 24,514
Operators Salary 32,040 16,962 16,962 65,964
Monthly Amount(Rs) 118,815 46,198 33,940 178,152
Total Cost 118,815 46,198 32,243 197,257
(Working factor at final disposal site) 100% 100% 95%
4.2.5 Major site infrastructure and auxiliary facilities
The Sundarapola dumpsite has few of the typical management infrastructure facilities available at a
landfill. Recently, the site has been developed to an integrated solid waste disposal site with
composting, toilet waste treatment and recycling facilities. These auxiliary were built through the
support from Central Government under Pilisaru project and Ministry of Local Government &
Provincial Councils (NSWMSC) funds and technical assistance.
(167)

The data collection survey of solid waste management in Sri Lanka Main Report‐ Kurunegala Municipal Council
17
4.2.5.1 Common site infrastructure facilities
Site office, workers rest facility, security hut, entrance gate, chain‐link fence around the site, three
phase electricity connection, water well and pumping system, domestic water supply from NWS&DB.
4.2.5.2 Composting facility
The composting facility consists of waste unloading and piling area (open‐concrete floor), sorting
facility (designed for belt conveyer operations but conveying systems has not been installed yet),
compost maturing sheds, sieving area (2 mechanical sieving machines), bagging area, finished
compost storage. The facility has been designed for large scale operations that process up to 25
tonnes of MSW per day. However, the facility was operated by a private party at the beginning and
discontinued of the operation on from 18th June 2014. Thereafter, KMC took over the operation of
composting plant and now in the process of gradually starting up the composting operation since
October 2014.
Figure 4‐6 Composting facility at Sundarapola dumpsite
4.2.5.3 Toilet waste treatment facility
The facility was constructed from central Government fund allocation.
(168)

The data collection survey of solid waste management in Sri Lanka Main Report‐ Kurunegala Municipal Council
18
Figure 4‐7 Toilet waste treatment facility at Sundarapola dumpsite
4.2.5.4 Plastic recycling facility
The plastic recycling facility was constructed from Pilisary funds as the central recycling facility for
Kurunegala District. The facility has plastic sorting area, material store, crushing machines,
Agglomerator, washing tanks and finished plastic store area.
Figure 4‐8 Recycling center at Sundarapola dumpsite
(169)

The data collection survey of solid
waste m
anagem
ent in Sri Lanka
Main Rep
ort‐ Kurunegala Municipal Council
19
4.2.6
Current condition of final disposal site and its surroundings
1
Current condition of final disposal site and its surroundings
1.1
Disposal
method
and
structure
Incoming waste loads from KMC (tractors, compactors and trucks) are recorded
at the entrance gate. N
o
records on other waste collection veh
icle.
Trucks and tractors are directed to active unloading area
(during rain) and directly to filling area
(during dry
season).
All other M
SW collection veh
icles emptied
its waste at the dumpsite. No specific control measures apply for
selection of dumping area. Thus, Open Dumping is practiced.
All other w
astes are dumped
on the ground and heaped up using an
excavator. The skid steer loader is
occasionally used to assist the excavator
1.2
Soil‐covering
In general, daily covering of waste by soil is not practiced
However, soil and construction wastes are used to m
ake temporally access/roads on the dump
1.3
Land owner
Ownership lies with a Kurunegala MC under 99 year lease agreem
ent with D
epartm
ent of Wildlife and
Government Agent of Kurunegala
1.4
Residual area
Approximately 12.5 acres (~ 5 hectares) has already been allocated for the site. N
early 60 % of the site is filled
with waste.
1.5
Leachate water
No proper leachate collection system; however there is a properly constructed
leachate drain along the
roadside to diver the leachate flow to storm
water drain without flowing on the road
Leachate and surface water flow towards the stream flow downstream
of dumpsite
1.6
Waste picker
None
1.7
Scattering
waste,
smoke,
fire, offen
sive odor, anim
als
Waste is dumped on designated
areas on the dumping site
Scattering and blowing out of waste is a problem during the dry season because soil covering is not practiced
No fire and smoke witness at the dumpsite during the observation
Occasionally, offen
sive odors come out from active dumping area
Dogs are frequen
t in the dump site
(170)

The data collection survey of solid
waste m
anagem
ent in Sri Lanka
Main Rep
ort‐ Kurunegala Municipal Council
20
4.2.7
Operation and M
anagement of final disposal site
2
Operation and M
anagement of final disposal site
2.1
Environmental
Protect
License
and
Environmental Clearance
None
2.2
Personnel
2‐Supervisors –(Permanen
t position)
18‐M
en labors–(Permanent position)
2‐W
omen
Labor ‐ (Permanen
t position)
6‐M
en labors–( Casual position)
1‐Security guard ‐daytime (Permanen
t position)
2‐Security guards –N
ight (Permanen
t position)
2.3
Operation vehicles, their maintenances
and
drivers
1 excavator
1 skid steer loader
1 four wheel tractors
2.4
Weighbridge
None
2.5
Waste collection data
Daily record is available only for KMC veh
icles
2.6
Supervisory m
ethod
Gen
eral planning and supervision come under M
ajor/commissioner and M
OH of KMC.
Those three officers are regularly inspecting the site and instruct the site Chief PHI for
necessary actions. Site supervisors are responsible for coordinating with KMC for solving
daily m
anagemen
t issues as well as other contingency m
atters.
Site supervisor is responsible for daily operations of all facilities
(171)

The data collection survey of solid
waste m
anagem
ent in Sri Lanka
Main Rep
ort‐ Kurunegala Municipal Council
21
2
Operation and M
anagement of final disposal site
3.0
Waste amount to final disposal site (24 hours, 7
days)
A summary is shown in
Table 4‐2
4.0
Adverse im
pact nearby residen
ces
Odor is the man
nuisance for residen
ce around the dumpsite
Residen
ce also complain about fly and insect problems
Dust emission during the dry season is a problem for residen
ce around the dumpsite
5.0
Implemen
tation
status
of
geological,
topographic and EIA survey for
new final
disposal site
None
6.0
Progress situation for new
final disposal site
None
7.0
Court case
None
(172)

Annex
KURUNEGALA MUNICIPAL COUNCIL
(173)

Response to Public Opinion Survey for Household Kurunegala MC
Page 1 of 7
Response to Public Opinion Survey for Household
Sinhala81%
Muslim2%
Tamil17%
Other0%
Ethnicity
Buddhist75%
Islam2%
Hindu17%
Christian 6%
Other
0%
Religion
Garbage
collection32%
Storm
water drainage
46%
Water
supply22%
Please specify the priority for your daily life regarding the improvement of the following
aspects?
Yes
98%
No
2%
Are there garbage collection services in your area?
Yes98%
No2%
Do you use these services?
Placing
outside24%
Carrying to
collection point
27%
Carrying to
collection truck46%
Other
0%
Irrelevant
3%
How is your garbage collected?
(174)

Response to Public Opinion Survey for Household Kurunegala MC
Page 2 of 7
Response to Public Opinion Survey for Household
2‐25m
87%
26‐50m
9%
51‐100m
4%
100‐250m
0% >250m
0%Don't
know0%
How far do you have to walk to reach this point?
Daily
34%
> 4
times/Wk14%
2‐3
times/Wk44%
Once/Wk
4%
< Once/Wk
0%
Irregular
1%
Don't
know0% Irrelevant
3%
How often is your garbage collected?
Yes56%
No44%
Don't
know0%
Is the garbage collection service done at a fixed time on the collection?
Very satisfied68%Somewhat
satisfied26%
Less than satisfied
5%
Not satisfied at
all1%
Are you satisfied with the collection service?
Not properly done19%
Frequency too low
10%
Is irregular43%
Too early/ too late
6%
Bad workers' behaviour8%
Workers demand
allowance3%
Allowance is expensive
2%
Service not fair
3% Point if too far0%
Other6%
What are reasons for dissatisfaction?
(175)

Response to Public Opinion Survey for Household Kurunegala MC
Page 3 of 7
Response to Public Opinion Survey for Household
Yes
6%
No
94%
Have you ever complained about the garbage collection service to the authorities in the last
three years?
Yes
75%
No
25%
Do you want to receive a garbage collection service? (only for persons who do not have garbage collection services in the area)
Discharge outside72%Specific place
4%
Open dump
11%
Request a collection truck0%
Self‐dispose4%
Composting
6%
Give for recycling
2%Other (collection
truck/ common bin)1%
How do you dispose off garbage generated in your premises?
As soon as
69%
Once daily27%
Once 2‐3
days4%
Less frequent
0%
How often do you dispose off garbage generated in your premises?
Adult male5%
Adult
female67%
Servant
6%
Other
22%
Who mainly handles wastes at home?
(176)

Response to Public Opinion Survey for Household Kurunegala MC
Page 4 of 7
Response to Public Opinion Survey for Household
Very much
willing23%
Somewhat
willing7%
Less
willing0%
Not willing5%
Doing
already65%
Willingness to cooperate in separate garbage
collection system
Reduce landfill amount
16%
Protect
environment
63%
Can earn
money17%
Others4%
If you are willing to cooperate, why do you think recycling is important?
Yes
73%
No27%
Don't know0%
Is there someone who comes around to collect or buy your reusable or recyclable materials?
Yes
5%
No95%
Do you take for recyclable materials to shops for refund or sale?
Yes20%
No
80%
Are you using kitchen/garden waste for composting?
< Half
14%
Half
29%
> Half
11%
All
46%
If you do composting, how much of kitchen waste used for composting?
(177)

Response to Public Opinion Survey for Household Kurunegala MC
Page 5 of 7
Response to Public Opinion Survey for Household
< Half6%
Half20%
> Half7%
All67%
If you do composting, how much of garden waste used for composting?
Sell3%
Own use97%
What do you do with produced compost?
Willing to pay51%
Don’t like49%
Suppose that you are satisfied with the service of Municipal solid waste management, either as is or as a result of improvement. Think for a moment about the largest amount of money
that your household would be willing to pay each month as a garbage colle
Yes
79%
No
16%
Don't
know5%
Do you have any community‐based organizations to solve not only the waste
problems but also other community problems?
Yes35%
No48%
Don't know17%
Have you ever discussed the methods of proper garbage handling and discharge at
the meetings?
(178)

Response to Public Opinion Survey for Household Kurunegala MC
Page 6 of 7
Response to Public Opinion Survey for Household
Yes
86%
No14%
Have you ever been taught method of proper garbage handling & disposal?
Parents
3%Communi
ty4%
School
1%
Local Gov.84%
Central
Gov.5%
NGOs
2%
Others1%
If you have learned , who taught proper garbage handling methods?
Very
necessary92%
Somewhat necessary
7%
Not very
necessary1%
Not
necessary at all0%
Do you think a campaign to raise awareness of people for maintaining the cleaner city and
environment is necessary?
(179)

Nuwara Eliya MC 1.6
(181)この前に合紙 この前に合紙
The data collection survey of solid waste management in Sri Lanka Main Report‐ Nuwara Eliya Municipal Council
i
Table of content
1 Introduction .................................................................................................................................... 1
1.1 Background conditions of Nuwara Eliya Municipal Council ................................................... 1
2 Waste Generation Survey (WGS) .................................................................................................... 2
2.1 Waste Generation Survey Results ........................................................................................... 3
3 Public Opinion Survey (POS) ........................................................................................................... 7
3.1 Public opinion survey methodology ....................................................................................... 7
3.2 Results of Public Opinion Survey ............................................................................................ 8
4 Final disposal site survey (FDS) ..................................................................................................... 11
4.1 Introduction the FDS of Nuwara Eliya MC ............................................................................ 11
4.1.1 Survey Method .............................................................................................................. 11
4.1.2 Target of Survey ............................................................................................................ 11
4.1.3 Data Sampling ............................................................................................................... 11
4.2 Current condition of final disposal site and its surroundings ............................................... 12
4.2.1 Moonplains waste disposal site .................................................................................... 12
4.2.2 Extend and landform ..................................................................................................... 12
4.2.3 Waste receiving and disposal ........................................................................................ 13
4.2.4 Management of Moonplains Dumpsite ........................................................................ 14
4.2.5 Major site infrastructure and auxiliary facilities ........................................................... 16
4.2.6 Current condition of final disposal site and its surroundings ....................................... 18
4.2.7 Operation and Management of final disposal site ....................................................... 19
(182)

The data collection survey of solid waste management in Sri Lanka Main Report‐ Nuwara Eliya Municipal Council
ii
List of Tables
Table 1‐1 Basic fact sheet of Nuwara Eliya Municipal Council ............................................................... 1
Table 2‐1 Type of data collected for WGS in Nuwara Eliya MC .............................................................. 2
Table 2‐2 Population statistics of GN divisions in NEMC area ................................................................ 3
Table 2‐3 Type and number of municipal establishment own by Nuwara Eliya MC .............................. 3
Table 2‐4 Number of government and privet institutions within Nuwara Eliya MC .............................. 4
Table 2‐5 Types and number of business establishments in NEMC area ............................................... 4
Table 3‐1 Category and number of samples for Public Opinion Survey ................................................. 7
Table 3‐2 Average and standard deviation values of income and family size ........................................ 8
Table 4‐1 Data collected during the final disposal site survey ............................................................. 11
Table 4‐2 Average quantities of MSW disposed at Moonplains MSW dumpsite for 11 days .............. 14
Table 4‐3 Administration structure and human resources available at Moonplains site ..................... 15
Table 4‐4 Annual machinery cost (bulldozer) at Moonplains landfill ................................................... 16
(183)

The data collection survey of solid waste management in Sri Lanka Main Report‐ Nuwara Eliya Municipal Council
iii
List of Figures
Figure 1‐1 City map of Nuwara Eliya MC ................................................................................................ 1
Figure 3‐1 Method of garbage discharge by residence in NEMC area ................................................... 9
Figure 3‐2 Willingness of residence for a source separated garbage collection system in Nuwara Eliya
MC ......................................................................................................................................................... 10
Figure 4‐1 Location of Moonplains dumpsite ....................................................................................... 12
Figure 4‐2 Moonplains dumpsite and environment within 500 m radius from center ........................ 13
Figure 4‐3 Landfill facilities at Moonplains Landfill site ........................................................................ 13
Figure 4‐4 Landfilling machineries at Moonplains dumpsite ................................................................ 14
Figure 4‐5 Waste unloading and dumping area of Moonplains dumpsite ........................................... 15
Figure 4‐6 Plastic recycling center under construction ........................................................................ 16
Figure 4‐7 Land filling area and auxiliary facilities at Moonplains landfill ............................................ 17
(184)

The data collection survey of solid waste management in Sri Lanka Main Report‐ Nuwara Eliya Municipal Council
1
1 Introduction
The purpose of this survey is to obtain the current data regarding Solid Waste Management (SWM)
at Nuwara Eliya Municipal Council (NEMC). The data collection survey was conducted from 4th
November to 8th November, 2015 by a team of expert dispatched by Waste To Energy Technologies
Limited.
This report consists of brief summaries of survey methods and results. The additional primary data
and records are available as soft copies. The preliminary data collection was conducted through four
comprehensive surveys which are;
i. Waste Generation Survey (WGS) is to gather information on waste generation sources at
NEMC based on secondary data available at NEMC and other relevant organizations.
ii. Public Opinion Survey (POS) is gather information on public opinion on current waste
management in NEMC. The POS was conducted through a questionnaire survey that covers
different types of waste generators in the NEMC area.
iii. Final Disposal Site Survey (FDSS) is to collection data on final MSW disposal site of NEMC
based on secondary data as well as field recordings & visits to the site.
1.1 Background conditions of Nuwara Eliya Municipal Council
Nuwara Eliya city is the capital of the Nuwara Eliya District of Central Province of Sri Lanka. Nuwara
Eliya serves as the major capital city of the upcountry for commercial and services. It is situated
about 160 km from Colombo via Peradeniya. The Nuwara Eliya city is an important location for local
as well as foreign tourism, agriculture especially for upcountry vegetable production and sales, and
for tea industry.
Nuwara Eliya Municipal Council was established in 1949 to handle all aspects of development within
the city. In recent years, there is a boost in tourism industry in the city with latest infrastructure
development activities. The reconstruction that had been done in and around the area of the
famous Lake Gregory has become a tourist attraction not only to foreigners but also for those within
the country. The jogging and cycling areas, recreational activities at the lake side, and new and
renovated accommodation facilities are notable features of recent city infrastructure development.
Table 1‐1 Basic fact sheet of Nuwara Eliya Municipal Council
Item Description
Province Central Province of Sri Lanka
District Nuwara Eliya
Local Authority Status Municipal Council
Year of establishment 1949
Location in Relation to Nuwara Eliya is situated about 160 km from Colombo
Extent of the Authority Area 15. 1 sq.km
No. of Council Wards 10
No. of Council Members 10
No. of Dwellings 6, 799
Population MC record (2012 statistics) 53, 670 (~ 20,000 daily floating population that may increase by 10
(185)

The data collection survey of solid waste management in Sri Lanka Main Report‐ Nuwara Eliya Municipal Council
2
times during festive season in April & long vacations)
Average Population Density 35.5 p/ha
Major economic activities Tourism, commerce, services, & light scale industry (agro‐processing, textile garments etc.)
Due to its highland location, Nuwara Eliya has a subtropical highland climate with a mean annual
temperature of 16 °C).In the winter months it is quite cold at night, and there can even be frost.
However, it rapidly warms up as the tropical sun climbs higher during the day.
(186)

The data collection survey of solid
waste m
anagem
ent in Sri Lanka
Main Rep
ort‐ Nuwara Eliya Municipal Council
1
Figure 1‐1 City map
of Nuwara Eliya MC
(187)

The data collection survey of solid waste management in Sri Lanka Main Report‐ Nuwara Eliya Municipal Council
2
2 Waste Generation Survey (WGS)
In order to obtain general information on waste generation amounts, the data available at waste
management section of the Health Department, Engineering Department and Revenue Department
of NEMC was used. Some of the data was available in the form of formal records and reports which
were treated as the most precise secondary data while the data collected from official interviews
with NEMC officers was treated as verification data. Thus, the survey data was collected through
different methods;
a) Recording and compiling of published and verified data by NEMC,
b) Reading and recording of unpublished & non‐confidential data available at NEMC,
c) Recording and official statistics available at Nuwara Eliya Divisional Secretariat office, and
d) Official person‐to‐person interview with relevant officers at NEMC for verification of data.
The numerical data was collected as specified in following Table 2‐1.
Table 2‐1 Type of data collected for WGS in Nuwara Eliya MC
Source Description
Household Each number of following category households was surveyed;1) High income level, 2) Middle income level and 3) Low income level.
Commercial Each number of following category restaurants was surveyed;1) Large size restaurants, 2) Middle size restaurants and 3) Small size restaurants. Each number of following category shops was surveyed; 1)Organic shops (large) 2)Organic shops (middle) 3)Organic shops (small) 4)Non‐Organic shops (large) 5)Non‐Organic shops (middle) 6)Non‐Organic shops (small)
Hotels Each number of following category hotels was surveyed;1) Large size hotels 2) Middle size hotels and 3) Small size hotels.
Markets Number of stalls and types
Institutions Each number of following institute was surveyed;1) Schools 2) Hospitals (government) 3) Hospitals (private) 4) Public office 5) Bank/private office 6) Buddhist temples 7) Hindu temples 8) Mosques 9) Churches 10) Navy/Police/ Army bases 11) Others
Industries Wastes from any industries.
(188)

The data collection survey of solid waste management in Sri Lanka Main Report‐ Nuwara Eliya Municipal Council
3
Source Description
Other Public parks and other public facilities
Construction and demolition
Wastes originating from construction, rehabilitation and demolition activities, etc.
Hazardous (Special)
Management and collection of hazardous wastes originating from various sources, including household items
2.1 Waste Generation Survey Results
The records indicate that the total residential population within NEMC is 49, 505 (Source: Divisional
Secretariat, Nuwara Eliya 2015). The Nuwara Eliya MC area consists of 15 Grama Niladari (GN)
divisions as shown in below Table 2‐2 .
Table 2‐2 Population statistics of GN divisions in NEMC area
GN Name GN Number Total population No of dwellings
Nuwaraeliya 535 1341 248
Magastota 535A 1464 374
Kalukele 535B 1136 210
Kelegala 535C 1902 399
Nuwaraeliya Central 535D 4463 896
Sandathenna 535E 136 228
Hawaeliya West 535F 2154 492
Hawaeliya North 535G 2305 421
Hawaeliya East 535H 2364 499
Bulu Ela 535I 1408 307
Bambarakele 535K 3268 690
Nuwaraeliya West 535L 2580 618
Kalapura 535N 232 491
Topass 535J 2757 278
Shanthipura 535M 1408 648
As shown in following Table 2‐3, Nuwara Eliya MC own and control a larger number of public
properties and institutes.
Table 2‐3 Type and number of municipal establishment own by Nuwara Eliya MC
Public property No of units
Libraries 1
Municipal parks 4
Play grounds 2
Market complexes 1
Cemetery 4
(189)

The data collection survey of solid waste management in Sri Lanka Main Report‐ Nuwara Eliya Municipal Council
4
Public property No of units
Vehicle parking complexes 1
Bus stand complexes 1
Office/ sub‐office 14
Fish markets 4
Meat stall/ markets 2
Public toilets 12
Pola premises 1
Community centres 8
Gymnasiums 1
Market shops (rent out) 583
Following Table 2‐4 shows the number of government and privet/non‐government establishments
within Nuwara Eliya MC.
Table 2‐4 Number of government and privet institutions within Nuwara Eliya MC
Type of institute/organization No of units Type of institute/organization No of units
Government/public Institutes (Privet)
Schools 18 Schools 5
Higher education institutes 1 Higher education institutes 5
Hospitals 1 Hospitals 1
Hospitals ‐ Clinics 2 Hospitals ‐ Clinics 10
District Secretariat office 1 Banks 8
Divisional secretary offices 1 Insurance companies 10
Banks 4 Financial Institutes 17
Post office 1 Audit firms 7
Police stations 2 Learners 1
Military (Army/ Navy/ Air‐force) 1 Health service centres 2
Buddhist temples 10 Private telephone services centres 7
Hindu Kovils 10 Foreign employment agencies 1
Mosques 2 Employment agencies 1
Churches 9 Currier Services 3
A major portion of MSW is generated from commercial sector in the city. Following Table 2‐5 shows
the number of different commercial (business) establishments in NEMC area.
Table 2‐5 Types and number of business establishments in NEMC area
Type of business No of units
Tyepe of business No of units
Tea shops 49 Industries
Restaurants (Bojana shala) 51 Textile and other products 2
Snak bars 2 Diamond cutting 4
(190)

The data collection survey of solid waste management in Sri Lanka Main Report‐ Nuwara Eliya Municipal Council
5
Type of business No of units
Tyepe of business No of units
Ice‐cream 2 Artificial eye lasses production 1
Vegetable/ Fruit shops (large) 29 Jam Production 1
Vegetable and fruits retail shops 38 Other Businesses (trade)
Vegetable whole sale and potato whole sale
36 Bakery products 7
Retail shops 102 Sweets 7
Chick pea and nut sales 2 Jewelry manufacturing 8
Betel leaves sales 2 Handi crafts 1
Tea sales 13 Gas wholesale 3
Glossary shops 2 Super markets 3
General wholesale shops (large) 80 Whole sale goods distribution centers 7
Ready made garments sales 9 Chillie mills 2
Warm clothes 17 Iron mill (kamhala) 1
Textile trading shops (large) 17 Welding, (paasum, liyawana pattal) 5
Jewelry sales 9 Balances and repair 1
Shoes sales 7 Jewelry pawing centers 14
Electronic equipment sales shop 15 Tailor shops 21
Furniture sales shops 6 phone repair 8
mechanical carpentry items 3 Mobile phone cards and telecommunication services
9
Shop items (sappu Bhanda) 30 Printing 5
Seed potatoes 7 Electrical equipment repair and sales 26
Vegetable seeds and agricultural tools and equipment
11 Computer services 4
Agrochemicals, pesticides, inorganic fertilizer
18 milk collecting centers 1
Stationary 8 Funeral services 4
News papers 2 Colleting of recyclable items 4
Offerings items sales 1 Astrological offices 2
Hardware shops 13 Photographic centers 7
Vehicle sales 4 Fitness centers 1
Vehicle spare parts shops 15 Spa centers 1
Bicycle Spare parts shops 1 Cigarette Agency 1
Tyre and tubes 4 Temporary sale stalls during April season 66
Fish sales stalls 8 Bicycle repair 2
Egg stall 2 Water pums and equipment repair 1
Meat sales stalls 4 Three wheel repair 4
Barber shops 23 Vehicle repair garages 17
Beauty salon 18 Motor cycle repair 2
Pharmacy 10 Vehicle service stations 4
Arduredic and Sinhala medicines sales 10 Fuel filling stations 2
Spectacles 2 Transport services 3
Lottery selling stalls 2 Building blocks and concrete products 4
(191)

The data collection survey of solid waste management in Sri Lanka Main Report‐ Nuwara Eliya Municipal Council
6
Type of business No of units
Tyepe of business No of units
CD and Video DVD sales 13 Building materials 7
Computer items sales 3 Flower sales 8
Musical instrument sales 1 Miscellaneous 14
Tourist Hotels 18 Betting centers 9
Rest Houses 176
(192)

The data collection survey of solid waste management in Sri Lanka Main Report‐ Nuwara Eliya Municipal Council
7
3 Public Opinion Survey (POS)
This Public Opinion Survey (POS) was commissioned to identify a range of household waste
management matters in relation to the household sector. Information on household waste
management practices and information on householders’ experiences with waste collection delivery
services was collected for the purpose of improving our understanding of householder’s experiences
and attitudes and also to better understand prevailing situation in householder’s point of view. The
purpose of this survey research included;
a. To collect information on public attitudes to the waste management and environment in
broader,
b. To value aspects of environmental health and protection,
c. To provide information on experiences with Local Authority’s waste management service
and,
d. To provide information on household waste management practices.
3.1 Public opinion survey methodology
The number of samples from Nuwara Eliya identified as 200 households, but size of the sample
increased to 204 during the implementation to increase the accuracy. The selection of households
and areas within Nuwara Eliya MC was done after a consultative discussion with MSW section
officers at NEMC and JICA expert team members.
The survey was executed by a team of university students who were trained about the questionnaire,
survey methodology and the data entering before dispatched to their respective fields. A senior
expertise took the leadership and continuously supervised the field survey. The selected households
were first educated about the survey, its main objectives and asked their cooperation before starting
the field survey. In addition business and institutes, large waste generators, hospitals recycling shops
and large public markets were also surveyed using appropriate questionnaires prepared in
consultation with JICA experts.
Table 3‐1 Category and number of samples for Public Opinion Survey
Category Survey area Number of samples
High‐income households Unique View, Grand Hotel Rd, Bonavista, Wedaban Rd, Kalukale Rd, Edirisinghe Rd
47
Middle‐income Households Hawaeliya Mahinda Rd, Hawaeliya Vajira Rd, Kalukale Rd, Hawaeliya Rd
53
Low‐income Households Magastota Estate, Bambarakale, Unique View, Lady Mclum Rd, PWD Line
50
Businesses /Service organization City Center, Badulla Rd, Market complex, Kandy Rd 37
Large waste generators 11
Markets 2
Hospitals 1
Recycling shops 2
NGO 1
(193)

The data collection survey of solid waste management in Sri Lanka Main Report‐ Nuwara Eliya Municipal Council
8
Category Survey area Number of samples
Total 204
The questionnaires were available in all languages (English/Sinhala/Tamil); however the
questionnaire form was filled by the interviewer based on interviewees’ response. The collected
information was recorded in digital form using Microsoft Excel and reviewed for accuracy. The data
was analyzed in detail for different objectives that generate an overview of the survey.
3.2 Results of Public Opinion Survey
48% of the surveyed households are Sinhalese, with 47 % of Tamils and 5 % Muslims. The
ethnicity could be further classified into 60% Sinhalese in high income group, 68 % of
Sinhalese in middle income group and 82 % of low income families were Tamils. The data on
the average number of people per household and monthly income is set out in below Table
3‐2.
Table 3‐2 Average and standard deviation values of income and family size
Category Family size Income (Rs/month)
High 4.3 ± 1.1 60,383 ± 19,533
Middle 5.2 ± 2.3 27,340 ± 7,000
Low 5.2 ± 2.0 16,900 ± 8,817
No of workers Income (Rs/month)
Business 3.4 ± 2.7 349,083 ± 681,795
In Nuwara Eliya MC, 97 % of surveyed households are provided with a garbage collection
service, of which 95% stated they use this service. 55 % of surveyed households are “very
satisfied” with present SWM service provision, while 27 % are “somewhat satisfied”.
(194)

The data collection survey of solid waste management in Sri Lanka Main Report‐ Nuwara Eliya Municipal Council
9
Figure 3‐1 Method of garbage discharge by residence in NEMC area
Households’ main methods of waste discharge are shown in Figure 3‐1. The most common
methods are carrying garbage to collection point (65%) and carrying to garbage collection
truck (32%) and discharging it outside their premises for house to house collection (2%).
Only 40% of surveyed households receive a daily garbage collection service while 36 %
stated that they received the service 2‐3 times/week.
59% discharge their garbage as soon as it is generated and 32 % discharge their garbage
daily. Only 9% discharge their garbage 2‐3 times per week.
In general, adult females handle waste in about 53 % of surveyed households.
As shown in Figure 3‐2, 35 % of households separate their garbage into organic and
inorganic waste at the source of generation. Only 6 % of surveyed households are not/less
willing to cooperate with source separation for recycling. Rests of the household are very
much willing (50 %) and somewhat willing (4 %) to cooperate in source separated garbage
collection system.
Further, 72 % of surveyed households stated that there are recyclable collectors or someone
who comes to collect their reusable or recyclable materials. Hence, informal recycling
system is well established in Nuwara Eliya MC area.
Placing outside2%
Carrying to collection point65%
Carrying to collection truck32%
Other0%
Irrelevant1%
How is your garbage collected?
(195)

The data collection survey of solid waste management in Sri Lanka Main Report‐ Nuwara Eliya Municipal Council
10
Figure 3‐2 Willingness of residence for a source separated garbage collection system in Nuwara Eliya MC
Only 17 % of surveyed households use kitchen/garden waste for composting and 100% of
them used the finished compost for their own garden.
Not many surveyed households (53 %) have ever discussed proper garbage discharge
methods at the community level, but 26% said that they discussed the garbage issue at
community meetings.
88 % households stated that SWM awareness programmes are very necessary while 11 %
stated “somewhat necessary”. Only 1% of surveyed households stated that awareness
campaigns are not necessary or not needed at all.
51 % of household do not like to pay for SWM service mainly because of the revenue tax
they paid for NEMC. The average WTP (willingness to pay) for improved SWM services is 68
± 125 Rs/month per household.
Out of all surveyed households, 19 % stated that they sale/give‐off Glass & Bottle for
recycling and 2 % of residence sale/give‐off Plastics for recycling. Also, 7‐10 % of households
sale/ give‐off can & metal for recycling. Cardboard and paper recycling were 0 % and 4 %
respectively.
Very much willing50%
Somewhat willing4%
Less willing1%
Not willing10%
Doing already35%
Willingness to cooperate in separate garbage collection system
(196)

The data collection survey of solid waste management in Sri Lanka Main Report‐ Nuwara Eliya Municipal Council
11
4 Final disposal site survey (FDS)
4.1 Introduction the FDS of Nuwara Eliya MC
4.1.1 Survey Method
The data and information in this report were collected from various sources including published
reports, verified data from Nuwara Eliya Municipal Council, Supervisor of Moonplains Waste Disposal
site and direct interview with other officers & workers at disposal site.
4.1.2 Target of Survey
The survey is focus on obtaining general information on waste receiving, handling, disposal, facility
management, environmental monitoring and legal adherences.
4.1.3 Data Sampling
The numerical data was collected as specified in following Table 4‐1.
Table 4‐1 Data collected during the final disposal site survey
Survey Items Method
1 Current condition of final disposal site and its surroundings
Disposal method and structure Records, visual observation
Soil‐covering Records, visual observation
Land owner Records
Residual area Records, visual observation
Leachate water Records, visual observation
Waste picker Records, visual observation, interview
Scattering waste, smoke, fire, offensive odour, animals and so on
Records, visual observation
2 Operation and Management of final disposal site
Environmental Protect License and Environmental Clearance
Record
Personnel Records, interview
Operation vehicles, their maintenances and drivers Records, interview
Weighbridge Records, interview
Waste collection data Records, interview
Supervisory method Records, interview
3 Waste amount to final disposal site (24 hours, 7 days) Records, Survey
4 Adverse impact near by residences Records, Survey
5 Implementation status of geological, topographic and EIA survey
for new final disposal site
Records, interview
6 Progress situation for new final disposal site Records, interview
7 Court case Records, interview
(197)

The data collection survey of solid waste management in Sri Lanka Main Report‐ Nuwara Eliya Municipal Council
12
4.2 Current condition of final disposal site and its surroundings
4.2.1 Moonplains waste disposal site
Final disposal site is located in Moonplains, about 6.0 km away from the Nuwara Eliya city center.
The area lies within Moonplians GN division in Nuwara Eliya Divisional Secretariat Division.
Moonplains waste disposal facility was upgraded to a model semi‐engineered sanitary landfill in
year 2003 with JICA assistant. This disposal facility was the first model sanitary landfill in Sri Lanka
and is still continue to be a model landfill.
Figure 4‐1 Location of Moonplains dumpsite
4.2.2 Extend and landform
Final disposal site is located at Moonplains, at about 1 km inside the forest reservation. At present,
the area covering the dumpsite and access road to the dumpsite are belonging to NEMC which was
transferred during the landfill development in 2003. Currently the site is having valley landform on a
middle slope of a small mountain. The site is surrounded by the plantation forest and there are two
accesses to the site from the top of the slope as well as from the bottom of the landfill via
Bomuruella reservoir road. The closets proximity to a residence is about 1 km from the active filling
area. There is a small perennial stream at the bottom of the valley which used to discharge the
treated effluent from landfill and toilet waste treatment facility.
(198)
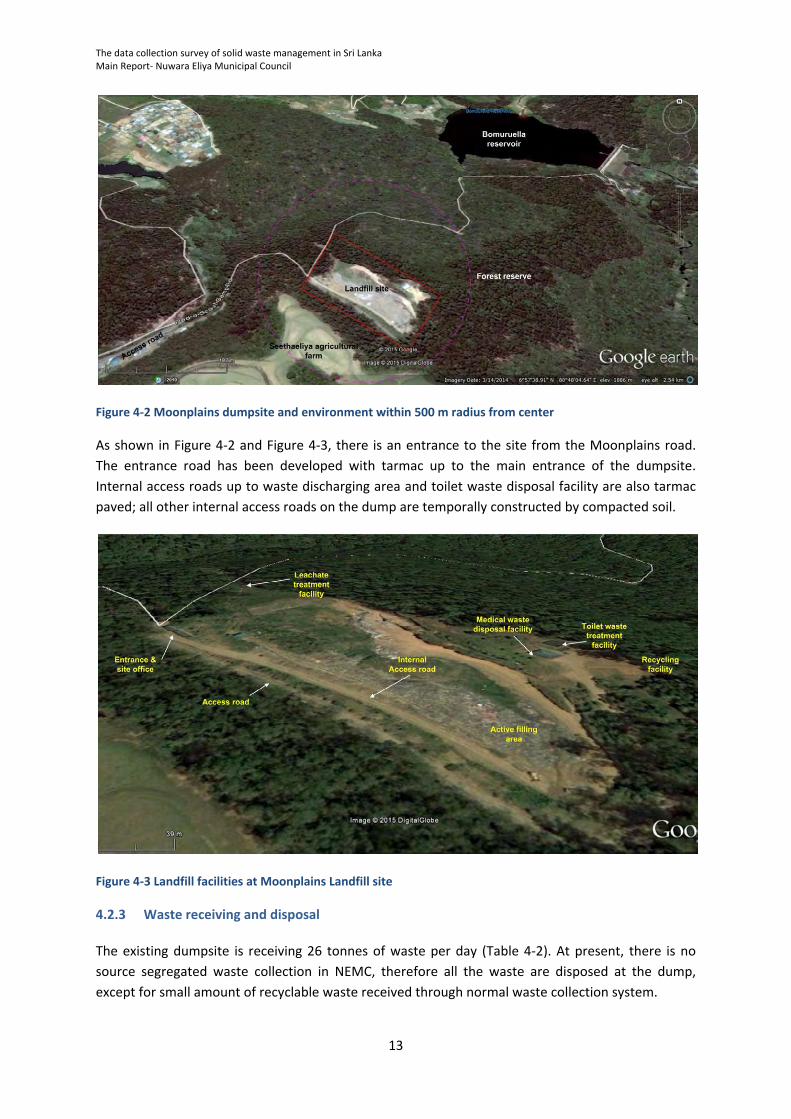
The data collection survey of solid waste management in Sri Lanka Main Report‐ Nuwara Eliya Municipal Council
13
Figure 4‐2 Moonplains dumpsite and environment within 500 m radius from center
As shown in Figure 4‐2 and Figure 4‐3, there is an entrance to the site from the Moonplains road.
The entrance road has been developed with tarmac up to the main entrance of the dumpsite.
Internal access roads up to waste discharging area and toilet waste disposal facility are also tarmac
paved; all other internal access roads on the dump are temporally constructed by compacted soil.
Figure 4‐3 Landfill facilities at Moonplains Landfill site
4.2.3 Waste receiving and disposal
The existing dumpsite is receiving 26 tonnes of waste per day (Table 4‐2). At present, there is no
source segregated waste collection in NEMC, therefore all the waste are disposed at the dump,
except for small amount of recyclable waste received through normal waste collection system.
(199)

The data collection survey of solid waste management in Sri Lanka Main Report‐ Nuwara Eliya Municipal Council
14
Table 4‐2 Average quantities of MSW disposed at Moonplains MSW dumpsite for 11 days
Date Tonnes/ day
21‐Oct 25.6
22‐Oct 29.6
23‐Oct 21.5
24‐Oct 19.0
25‐Oct 11.5
26‐Oct 45.6
27‐Oct 20.6
28‐Oct 34.9
29‐Oct 25.6
31‐Oct 30.6
1‐Nov 21.5
Average 26.0
The site office maintains a record of receiving waste from NEMC and also maintains written record
on day‐to‐day activities and including a visitor’s book.
Figure 4‐4 Landfilling machineries at Moonplains dumpsite
4.2.4 Management of Moonplains Dumpsite
The management of the dumpsite has a pre‐schedule plan for waste disposal. The site supervisor
instructs the waste collection vehicles and waste handling machineries for disposal area.
One of the biggest challenges in management is to get dumping vehicle access to the active filling
area during the heavy rainy season. Therefore, site management unloads the waste from the
internal access road to the dumping area and the bulldozer is used to move and compact the waste.
(200)

The data collection survey of solid waste management in Sri Lanka Main Report‐ Nuwara Eliya Municipal Council
15
Figure 4‐5 Waste unloading and dumping area of Moonplains dumpsite
At present, the dumpsite management is well established with human resources and considerable
amount of facilities and machineries. Following table show the management structure and human
resources at the Moonplains dumpsite.
Table 4‐3 Administration structure and human resources available at Moonplains site
Human resources Number of persons
Municipal Commissioner (Administration) 1
Medical Officer of Health (Administration) 1
Chief Public Health Inspector (Administration) 1
Resident site officers
Site supervisors –(Permanent position) 1
Labours & Machine/Tractor operators 1
Men labours–(Permanent position) 3
Security guard ‐Day time (Permanent positions) 1
Security guards –Night (Permanent position) 1
(201)

The data collection survey of solid waste management in Sri Lanka Main Report‐ Nuwara Eliya Municipal Council
16
The daily machine and labor operation records are available at the site office. The records showed
that the site operation cost is mainly for Bulldozer operation and maintenance which is nearly Rs. 1.1
million per year.
Table 4‐4 Annual machinery cost (bulldozer) at Moonplains landfill
Item Annual cost (Rs)
Fuel 434,158
Repair/Service 282,700
Operators Salary 384,000
Total annual cost 1,100,858
4.2.5 Major site infrastructure and auxiliary facilities
The integrated site includes a small incinerator for paper waste, toilet waste treatment facility,
medical waste disposal facility, e‐waste disposal facility, leachate treatment facility, workers rest and
site office, education & training facility, and plastic recycling facility (under construction).
The toilet waste treatment facility has been renovated with new coir biobrush application and
extension of primary clarification tank. Those renovations were done during 2010‐2014. The
leachate treatment facility was also renovated with application of coir biobrush and charcoal
filtering system. A plastic net has placed on the open tank to prevent plant letter fall on the tank.
In addition, electricity and domestic waste supply are also available at the site.
The plastic recycling facility is the new addition to integrated landfill facility which was partially
funded by Pilisaru project (Rs. 5.5 million) and NEMC (Rs. 2.5 million).
Figure 4‐6 Plastic recycling center under construction
(202)

The data collection survey of solid waste management in Sri Lanka Main Report‐ Nuwara Eliya Municipal Council
17
Figure 4‐7 Land filling area and auxiliary facilities at Moonplains landfill
(203)
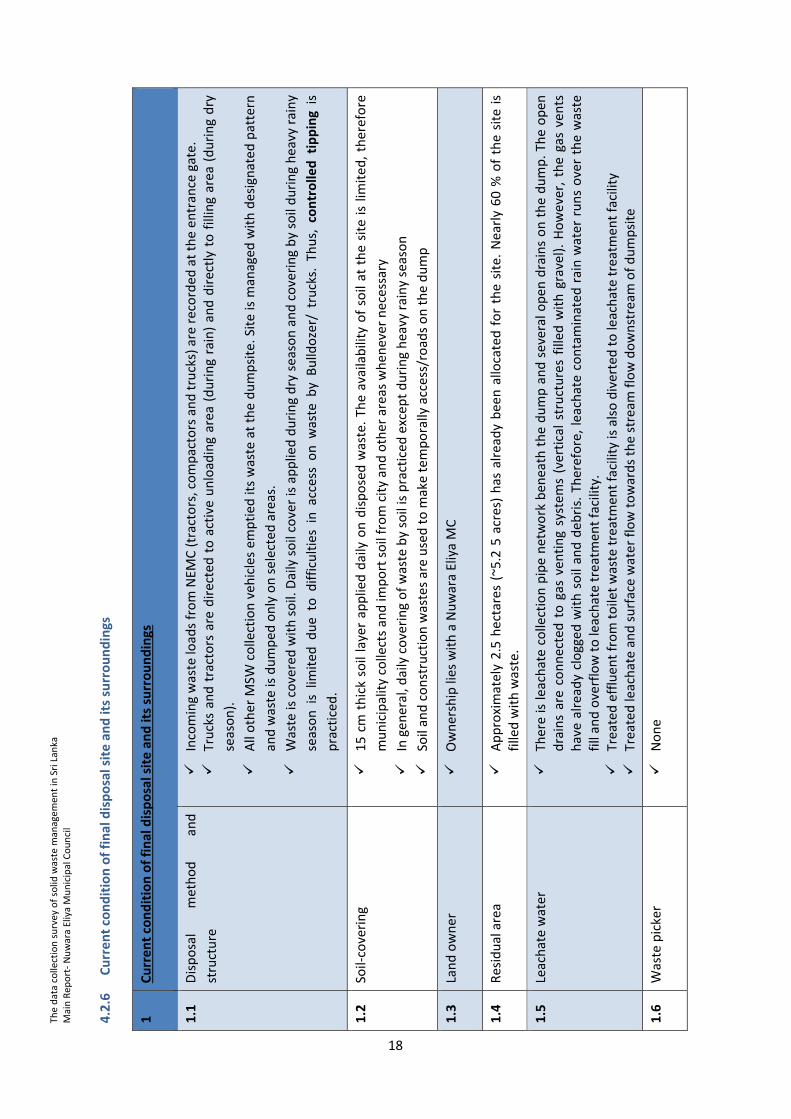
The data collection survey of solid
waste m
anagem
ent in Sri Lanka
Main Rep
ort‐ Nuwara Eliya Municipal Council
18
4.2.6
Current condition of final disposal site and its surroundings
1
Current condition of final disposal site and its surroundings
1.1
Disposal
method
and
structure
Incoming waste loads from NEM
C (tractors, compactors and trucks) are recorded
at the entrance gate.
Trucks and tractors are directed to active unloading area
(during rain) and directly to filling area
(during dry
season).
All other M
SW collection veh
icles em
ptied
its waste at the dumpsite. Site is m
anaged
with designated pattern
and waste is dumped
only on selected areas.
Waste is covered with soil. Daily soil cover is applied during dry season and covering by soil during heavy rainy
season is lim
ited
due to difficulties in access on w
aste by Bulldozer/ trucks. Thus, controlled tipping is
practiced
.
1.2
Soil‐covering
15 cm thick soil layer applied daily on disposed w
aste. Th
e availability of soil at the site is lim
ited, therefore
municipality collects and im
port soil from city and other areas when
ever necessary
In general, daily covering of waste by soil is practiced
except during heavy rainy season
Soil and construction wastes are used to m
ake temporally access/roads on the dump
1.3
Land owner
Ownership lies with a Nuwara Eliya MC
1.4
Residual area
Approximately 2.5 hectares (~5.2 5 acres) has already been allocated for the site. Nearly 60 %
of the site is
filled with waste.
1.5
Leachate water
There is leachate collection pipe network ben
eath the dump and several open
drains on the dump. Th
e open
drains are connected to gas ven
ting system
s (vertical structures filled w
ith gravel). However, the gas vents
have already clogged
with soil and debris. Therefore, leachate contaminated
rain water runs over the waste
fill and overflow to leachate treatm
ent facility.
Treated effluen
t from toilet waste treatmen
t facility is also diverted to leachate treatm
ent facility
Treated leachate and surface water flow towards the stream
flow downstream
of dumpsite
1.6
Waste picker
None
(204)

The data collection survey of solid
waste m
anagem
ent in Sri Lanka
Main Rep
ort‐ Nuwara Eliya Municipal Council
19
1
Current condition of final disposal site and its surroundings
1.7
Scattering
waste,
smoke,
fire, offen
sive odor, anim
als
Waste is dumped on designated
areas on the dumping site
Scattering and blowing out of waste is m
inim
um due to covering by soil during dry season
No fire and smoke witness at the dumpsite during the observation
Occasionally, offen
sive odors come out from active dumping area
There are about 10 dogs in
the site
Entering of wildlife (w
ild boar and stags) during the nighttim
e has been observed
4.2.7
Operation and M
anagement of final disposal site
2
Operation and M
anagement of final disposal site
2.1
Environmental
Protect
License
and
Environmental Clearance
Regular inspections are done by CEA
The irrigation dep
artm
ent analyze the quality of downstream
waters
2.2
Personnel
1‐Supervisors –(Permanen
t position)
3‐M
en labors–(Permanen
t position)
1‐M
achine operator ‐ (Permanen
t position)
1‐Security guard ‐daytime (Permanen
t position)
1‐Security guards –N
ight (Permanen
t position)
2.3
Operation vehicles, their maintenances
and
drivers
1 Bulldozer (CAT D4)
2.4
Weighbridge
None
(205)

The data collection survey of solid
waste m
anagem
ent in Sri Lanka
Main Rep
ort‐ Nuwara Eliya Municipal Council
20
2
Operation and M
anagement of final disposal site
2.5
Waste collection data
Daily record is available for vehicle and visitors entry. And also records are available for
daily routine works including repair and m
aintenance of facilities
2.6
Supervisory m
ethod
Gen
eral planning and supervision come under M
ajor/commissioner/ En
gineer and M
OH
of NEM
C. Those three officers are regularly inspecting the site and instruct the site
supervisor and Chief PHI for necessary actions. Site supervisors are responsible for
coordinating with NEM
C for solving daily m
anagement issues as well as other contingency
matters.
Site supervisor is responsible for daily operations of all facilities
3.0
Waste amount to final disposal site (24 hours, 7
days)
A summary is shown in
Table 4‐2
4.0
Adverse im
pact nearby residen
ces
No records and objections from nearby residen
ce
Dep
artm
ent of irrigation has m
ade verbal communication on treated
water quality
5.0
Implemen
tation
status
of
geological,
topographic and EIA survey for
new final
disposal site
None
6.0
Progress situation for new
final disposal site
None
7.0
Court case
None
(206)

Annex
NUWARA ELIYA MUNICIPAL COUNCIL
(207)

Response to Public Opinion Survey for Household Nuwara Eliya MC
Page 1 of 7
Response to Public Opinion Survey for Household
Sinhala
48%
Muslim
5%
Tamil
47%
Other
0%
Ethnicity
Buddhist
36%
Islam
6%
Hindu
45%
Christian
13%Other0%
Religion
Garbage collection
52%Storm
water drainage38%
Water supply10%
Please specify the priority for your daily life regarding the improvement of the following
aspects?
Yes97%
No
3%
Are there garbage collection services in your area?
Yes
95%
No
5%
Do you use these services?
Placing
outside2%
Carrying
to collection
point65%
Carrying
to collection
truck32%
Other
0%
Irrelevant1%
How is your garbage collected?
(208)

Response to Public Opinion Survey for Household Nuwara Eliya MC
Page 2 of 7
Response to Public Opinion Survey for Household
2‐25m
51%
26‐50m17%
51‐100m
14%
100‐250m
9%
>250m
9%Don't
know0%
How far do you have to walk to reach this point?
Daily40%
> 4
times/Wk5%
2‐3
times/Wk36%
Once/Wk7%
< Once/Wk
1%
Irregular
1%
Don't
know9% Irrelevant
1%
How often is your garbage collected?
Yes
30%
No
54%
Don't
know16%
Is the garbage collection service done at a fixed time on the collection?
Very
satisfied55%
Somewhat
satisfied27%
Less than
satisfied14%
Not
satisfied at all
4%
Are you satisfied with the collection service?
Not properly done38%
Frequency too low22%
Is irregular15%
Too early/ too late5%
Bad workers'
behaviour3%
Workers demand allowance
0%
Allowance is expensive
0%
Service not fair4%
Point if too far
12%Other1%
What are reasons for dissatisfaction?
(209)

Response to Public Opinion Survey for Household Nuwara Eliya MC
Page 3 of 7
Response to Public Opinion Survey for Household
Yes7%
No93%
Have you ever complained about the garbage collection service to the authorities in the last
three years?
Yes75%
No25%
Do you want to receive a garbage collection service? (only for persons who do not have garbage collection services in the area)
Discharge outside
61%Specific place32%
Open dump1%
Request a collection truck0%
Self‐dispose
0%
Composting
5%
Give for recycling
1%Other (collection
truck/ common bin)0%
How do you dispose off garbage generated in your premises?
As soon as
59%Once daily
32%
Once 2‐3
days9%
Less
frequent0%
How often do you dispose off garbage generated in your premises?
Adult
male7%
Adult female53%
Servant
5%
Other35%
Who mainly handles wastes at home?
(210)

Response to Public Opinion Survey for Household Nuwara Eliya MC
Page 4 of 7
Response to Public Opinion Survey for Household
Very much
willing50%
Somewhat willing4%
Less willing1%
Not
willing10%
Doing
already35%
Willingness to cooperate in separate garbage collection system
Reduce
landfill amount
9%
Protect
environment
71%
Can earn
money9%
Others
11%
Why do you think recycling is important?
Yes
72%
No
27%
Don't
know1%
Is there anyone to collect recyclables ?
Yes
3%
No
97%
Do you take for recyclable materials to shops for refund or sale?
Yes
17%
No
83%
Are you using kitchen/garden waste for composting?
< Half17%
Half
28%
> Half
0%
All
55%
If you do composting, how much of kitchen waste used for composting?
(211)

Response to Public Opinion Survey for Household Nuwara Eliya MC
Page 5 of 7
Response to Public Opinion Survey for Household
< Half0%
Half
16%
> Half4%
All80%
If you do composting, how much of garden waste used for composting?
Sell
0%
Own use
100%
What do you do with produced compost?
Willing to pay49%
Don’t like to pay
51%
Suppose that you are satisfied with the service of Municipal solid waste management, either as is or as a result of improvement. Think for a moment about the largest amount of money that your
household would be willing to pay each month as a garbage colle
Yes
59%No
30%
Don't
know11%
Do you have any community‐based organizations to solve not only the waste problems but also
other community problems?
Yes26%
No53%
Don't
know21%
Have you ever discussed the methods of proper garbage handling and discharge at the meetings?
(212)

Response to Public Opinion Survey for Household Nuwara Eliya MC
Page 6 of 7
Response to Public Opinion Survey for Household
Yes58%
No42%
Have you ever been taught method of proper garbage handling & disposal?
Parents6%
Community0%
School0%
Local Gov.
74%
Central Gov.1%
NGOs
0%
Others
19%
If you have learned , who taught proper garbage handling methods?
Very
necessary88%
Somewhat necessary
11%
Not very
necessary1%
Not
necessary at all
0%
Do you think a campaign to raise awareness of people for maintaining the cleaner city and environment is
necessary?
(213)

Moratuwa MC 1.7
(215)この前に合紙 この前に合紙

The data collection survey of solid waste management in Sri Lanka Main Report‐ Moratuwa Municipal Council
i
Table of content
1 Introduction .................................................................................................................................... 1
1.1 Background conditions of Moratuwa Municipal Council ........................................................ 1
2 Waste Generation Survey (WGS) .................................................................................................... 3
2.1 Waste Generation Survey Results ........................................................................................... 4
3 Public Opinion Survey (POS) ........................................................................................................... 7
3.1 Public opinion survey methodology ....................................................................................... 7
3.2 Results of Public Opinion Survey ............................................................................................ 8
4 Final disposal site survey (FDS) ..................................................................................................... 11
4.1 Introduction the FDS of Moratuwa MC ................................................................................ 11
4.1.1 Survey Method .............................................................................................................. 11
4.1.2 Target of Survey ............................................................................................................ 11
4.1.3 Data Sampling ............................................................................................................... 11
4.2 Current condition of final disposal site and its surroundings ............................................... 12
4.2.1 Karadiyana waste disposal site ..................................................................................... 12
4.2.2 History and evolution of the dumpsite ......................................................................... 12
4.2.3 Management and authority of Karadiyana Dumpsite .................................................. 14
4.2.4 Extend and landform ..................................................................................................... 14
4.2.5 Waste receiving and disposal ........................................................................................ 15
4.3 Site infrastructure facilities ................................................................................................... 17
4.3.1 Current condition of final disposal site and its surroundings ....................................... 19
4.3.2 Operation and Management of final disposal site ....................................................... 20
(216)

The data collection survey of solid waste management in Sri Lanka Main Report‐ Moratuwa Municipal Council
ii
List of Tables
Table 1‐1 Basic fact sheet of Moratuwa Municipal Council .................................................................... 2
Table 2‐1 Type of data collected for WGS in Moratuwa MC .................................................................. 3
Table 2‐2 Population statistics of villages in MMC area ......................................................................... 4
Table 2‐3 Type and number of municipal establishment own by Moratuwa MC .................................. 5
Table 2‐4 Number of government and privet institutions within Moratuwa MC .................................. 5
Table 2‐5 Types and number of business establishments in MMC area ................................................ 5
Table 2‐6 Type and number of vehicles own by MMC ........................................................................... 6
Table 3‐1 Category and number of samples for Public Opinion Survey ................................................. 7
Table 3‐2 Average and standard deviation values of income and family size ........................................ 8
Table 4‐1 Data collected during the final disposal site survey ............................................................. 11
Table 4‐2 Sources and quantities of waste disposed at Karadiyana MSW dumpsite ........................... 15
Table 4‐3 Different types of waste disposed at the Karadiyana dumpsite ........................................... 16
(217)

The data collection survey of solid waste management in Sri Lanka Main Report‐ Moratuwa Municipal Council
iii
List of Figures
Figure 3‐1 Method of garbage discharge by residence in MMC area .................................................... 8
Figure 3‐2 Willingness of residence for a source separated garbage collection system in Moratuwa
MC ........................................................................................................................................................... 9
Figure 4‐1 Location of Karadiyana dumpsite ........................................................................................ 12
Figure 4‐2 Historical evolution of Karadiyana dumpsite ....................................................................... 13
Figure 4‐3 Karadiyana dumpsite and environment within 500 m radius from center ......................... 14
Figure 4‐4 Daily waste disposal amount at Karadiyana dumpsite for a year (The peaks in August 2015
is due to discharge of soil/dredged waste) ........................................................................................... 16
Figure 4‐5 Major site infrastructure facilities at Karadiyana Dumpsite ................................................ 17
Figure 4‐6 Fleet of machineries work at Karadiyana dumpsite ............................................................ 18
(218)
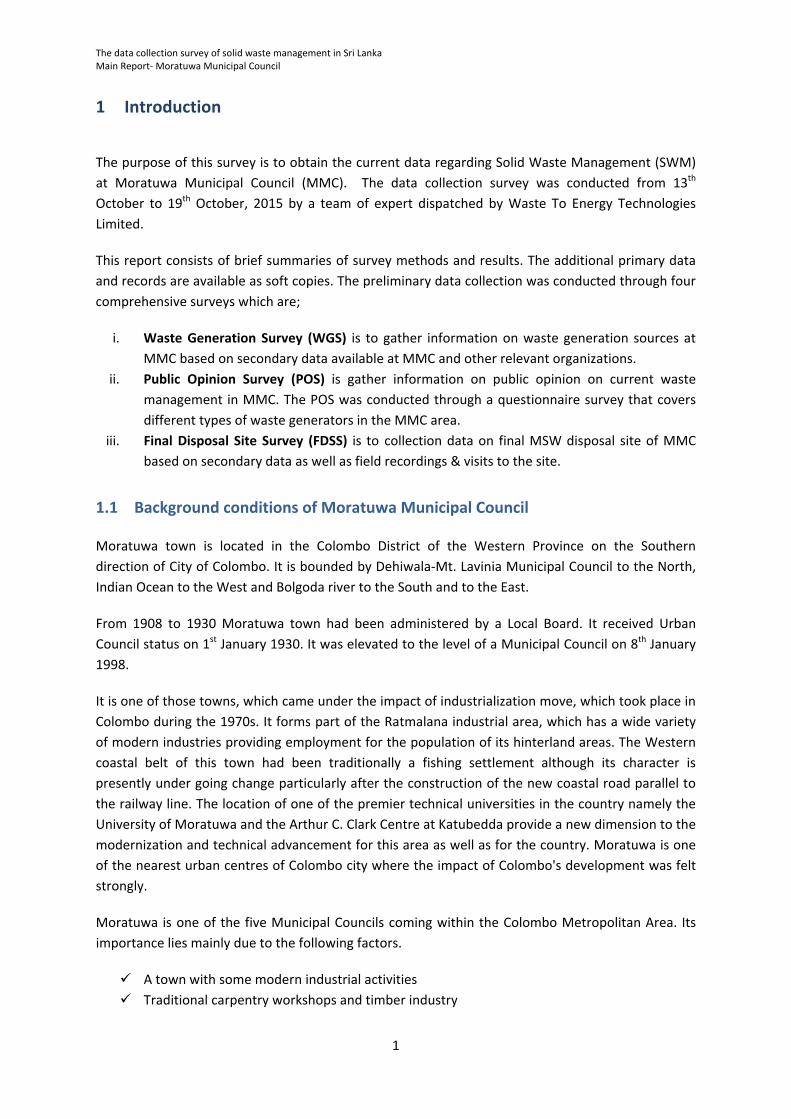
The data collection survey of solid waste management in Sri Lanka Main Report‐ Moratuwa Municipal Council
1
1 Introduction
The purpose of this survey is to obtain the current data regarding Solid Waste Management (SWM)
at Moratuwa Municipal Council (MMC). The data collection survey was conducted from 13th
October to 19th October, 2015 by a team of expert dispatched by Waste To Energy Technologies
Limited.
This report consists of brief summaries of survey methods and results. The additional primary data
and records are available as soft copies. The preliminary data collection was conducted through four
comprehensive surveys which are;
i. Waste Generation Survey (WGS) is to gather information on waste generation sources at
MMC based on secondary data available at MMC and other relevant organizations.
ii. Public Opinion Survey (POS) is gather information on public opinion on current waste
management in MMC. The POS was conducted through a questionnaire survey that covers
different types of waste generators in the MMC area.
iii. Final Disposal Site Survey (FDSS) is to collection data on final MSW disposal site of MMC
based on secondary data as well as field recordings & visits to the site.
1.1 Background conditions of Moratuwa Municipal Council
Moratuwa town is located in the Colombo District of the Western Province on the Southern
direction of City of Colombo. It is bounded by Dehiwala‐Mt. Lavinia Municipal Council to the North,
Indian Ocean to the West and Bolgoda river to the South and to the East.
From 1908 to 1930 Moratuwa town had been administered by a Local Board. It received Urban
Council status on 1st January 1930. It was elevated to the level of a Municipal Council on 8th January
1998.
It is one of those towns, which came under the impact of industrialization move, which took place in
Colombo during the 1970s. It forms part of the Ratmalana industrial area, which has a wide variety
of modern industries providing employment for the population of its hinterland areas. The Western
coastal belt of this town had been traditionally a fishing settlement although its character is
presently under going change particularly after the construction of the new coastal road parallel to
the railway line. The location of one of the premier technical universities in the country namely the
University of Moratuwa and the Arthur C. Clark Centre at Katubedda provide a new dimension to the
modernization and technical advancement for this area as well as for the country. Moratuwa is one
of the nearest urban centres of Colombo city where the impact of Colombo's development was felt
strongly.
Moratuwa is one of the five Municipal Councils coming within the Colombo Metropolitan Area. Its
importance lies mainly due to the following factors.
A town with some modern industrial activities
Traditional carpentry workshops and timber industry
(219)

The data collection survey of solid waste management in Sri Lanka Main Report‐ Moratuwa Municipal Council
2
Fisheries activities
Educational and religious centres of a higher order
Service activities particularly related to tourists industry
Residential suburbs of Colombo
In view of its demographic, social and economic importance, Moratuwa has been identified as a sub‐
regional center in the Regional Structure Plan prepared for the Colombo Metropolitan Region by the
Urban Development Authority in 1998.
Table 1‐1 Basic fact sheet of Moratuwa Municipal Council
Item Description
Province Western Province of Sri Lanka
District Colombo
Local Authority Status Municipal Council
Year of Establishment January 1998 (Formerly an Urban Council since January 1930)
Location in Relation to Moratuwa is located Colombo City on the Southern direction about 24 km away from Colombo City
Extent of the Authority Area 23.6 sq.km
No. of Council Wards 17
No. of Council Members 29
No. of Villages 42
No. of Dwellings 41, 459
Population MC record (2012 statistics) 166, 857 (132, 795)
Average Population Density 56.26 p/ha
(220)

The data collection survey of solid waste management in Sri Lanka Main Report‐ Moratuwa Municipal Council
3
2 Waste Generation Survey (WGS)
In order to obtain general information on waste generation amounts, the data available at waste
management section of the Health Department, Works Department and Revenue Department of
MMC was used. Some of the data was available in the form of formal records and reports which
were treated as the most precise secondary data while the data collected from official interviews
with MMC officers was treated as verification data. Thus, the survey data was collected through
different methods;
a) Recording and compiling of published and verified data by MMC,
b) Reading and recording of unpublished & non‐confidential data available at MMC,
c) Recording and official statistics available at Moratuwa Divisional Secretariat office, and
d) Official person‐to‐person interview with relevant officers at MMC for verification of data.
The numerical data was collected as specified in following Table 2‐1.
Table 2‐1 Type of data collected for WGS in Moratuwa MC
Source Description
Household Each number of following category households was surveyed;1) High income level, 2) Middle income level and 3) Low income level.
Commercial Each number of following category restaurants was surveyed;1) Large size restaurants, 2) Middle size restaurants and 3) Small size restaurants. Each number of following category shops was surveyed; 1)Organic shops (large) 2)Organic shops (middle) 3)Organic shops (small) 4)Non‐Organic shops (large) 5)Non‐Organic shops (middle) 6)Non‐Organic shops (small)
Hotels Each number of following category hotels was surveyed;1) Large size hotels 2) Middle size hotels and 3) Small size hotels.
Markets Number of stalls and types
Institutions Each number of following institute was surveyed;1) Schools 2) Hospitals (government) 3) Hospitals (private) 4) Public office 5) Bank/private office 6) Buddhist temples 7) Hindu temples 8) Mosques 9) Churches 10) Navy/Police/ Army bases 11) Others
Industries Wastes from any industries.
(221)

The data collection survey of solid waste management in Sri Lanka Main Report‐ Moratuwa Municipal Council
4
Source Description
Other Public parks and other public facilities
Construction and demolition
Wastes originating from construction, rehabilitation and demolition activities, etc.
Hazardous (Special)
Management and collection of hazardous wastes originating from various sources, including household items
2.1 Waste Generation Survey Results
The records indicate that the total residential population within MMC is 132, 795 (Source: Divisional
Secretariat, Moratuwa & Divisional Secretariat, Nallur, 2015). The Moratuwa MC area consists of 42
Grama Niladari (GN) divisions as shown in below Table 2‐2 .
Table 2‐2 Population statistics of villages in MMC area
Village Name Total Population Village Name Total Population
Angulana North 3,146 Rawathawatta West 2,754
Kaldemulla 3,939 Idama 2,371
Soysapura North 2,499 Uswatta 1,713
Soysapura South 2,276 Moratuwella South 3,594
Dahampura 2,217 Indibedda West 3,416
Thelawala North 4,346 Moratumulla East 3,023
Borupana 4,875 Moratumulla West 2,791
Thelawala South 3,305 Villorawatta East 2,833
Lakshapathiya North 3,667 Villorawatta West 3,575
Lakshapathiya Central 2,355 Indibedda East 2,756
Angulana South 2,443 Moratuwella North 1,814
Uyana South 3,476 Moratuwella West 1,797
Uyana North 2,824 Koralawella North 4,321
Rawathawatta South 1,667 Koralawella East 1,705
Rawathawatta East 3,225 Koralawella West 2,621
Lakshapathiya South 4,289 Koralawella South 2,781
Kuduwamulla 2,544 Katukurunda North 2,769
Katubedda 8,751 Katukurunda South 3,371
Molpe 6,062 EgodaUyana North 3,529
Moratumulla North 2,537 EgodaUyana Central 2,237
Kadalana 2,808 EgodaUyana South 3,773
As shown in following Table 2‐3, Moratuwa MC own and control a larger number of public
properties and institutes.
(222)

The data collection survey of solid waste management in Sri Lanka Main Report‐ Moratuwa Municipal Council
5
Table 2‐3 Type and number of municipal establishment own by Moratuwa MC
MC properties No. of units
Libraries 8
Municipal parks 5
Play grounds 7
Market buildings 8
Cemetery 4
Vehicle parking complexes 5
Bus stand complexes 1
Slaughter house 8
Meat stall/ markets 8
Following Table 2‐4 shows the number of government and privet/non‐government establishments
within Moratuwa MC.
Table 2‐4 Number of government and privet institutions within Moratuwa MC
Institutes (Governments) No. of units Institutes (Privet) No. of units
Schools 33 Schools 6
Hospitals 10 Hospitals 2
Government Office (AG, post office, bank etc) 20 Clinic/ dispensary 80
Public office 142 Other education institutes 72
Buddhist temples 47 Bank/Finance office 48
Hindu temples 3
Mosques 2
Churches 23
Navy/Police/ Army bases 4
A major portion of MSW is generated from commercial sector in the city. Following Table 2‐5 shows
the number of different commercial (business) establishments in MMC area.
Table 2‐5 Types and number of business establishments in MMC area
Type of Business No. of units Type of Business No. of units
Food & household goods General trading
Large/Middle size hotels 99 Textile trading shops (large) 106
Small size hotels 83 Electronic equipment sales shop 14
Restaurants 32 Electrical equipment sales shop 87
General wholesale shops (large) 12 Furniture sales shops 123
Glossary shops 510 Hardware shops 143
Vegetable sales shops 32 Vehicle spare parts shops 45
Fruit sales shops 18 Vehicle repair garages 101
Fish sales stalls 27 Barber shops 132
(223)

The data collection survey of solid waste management in Sri Lanka Main Report‐ Moratuwa Municipal Council
6
Type of Business No. of units Type of Business No. of units
Meat sales stalls 54 Beauty salon 38
Vine stores 16 Pharmacy 68
Medical laboratory 38 Plastic sales 37
Industries Communication 126
Saw mills 40 Watch repair & sell 18
Garments/ Tailoring 120 Optical center 21
Furniture 1509
Factory & product 44
In addition, Moratuwa MC own fleet of vehicles used for MSW service as well as other general
functions. Following Table 2‐6 shows a list of vehicles own by MMC.
Table 2‐6 Type and number of vehicles own by MMC
Type of vehicle In‐use Not in‐use Total
Tractor 18 7 25
Gully bowser 2 2 4
Tipper (dump) truck 8 8
Truck 1 1
Two wheel tractor 5 1 6
Tar‐cab 1 1
Compact bowser 4 4
Garbage buggy 2 2
Cart 2 2
Loader buggy 3 3
Wheel loader 1 1
Water bowser 2 2
Boom truck 1 1
Sky lift 2 2
Chain (Crawler) dozer 1 1
Road Roller compactor 3 3
Fire engines 2 2
Ambulance 1 1
Three wheeler 8 8
Jet bowser 1 1
Motorcycles 3 1 4
Wheel excavator 3 3
Dumper 2 2
Cab car 7 7
Total 81 13 94
(224)

The data collection survey of solid waste management in Sri Lanka Main Report‐ Moratuwa Municipal Council
7
3 Public Opinion Survey (POS)
This Public Opinion Survey (POS) was commissioned to identify a range of household waste
management matters in relation to the household sector. Information on household waste
management practices and information on householders’ experiences with waste collection delivery
services was collected for the purpose of improving our understanding of householder’s experiences
and attitudes and also to better understand prevailing situation in householder’s point of view. The
purpose of this survey research included;
a. To collect information on public attitudes to the waste management and environment in
broader,
b. To value aspects of environmental health and protection,
c. To provide information on experiences with Local Authority’s waste management service
and,
d. To provide information on household waste management practices.
3.1 Public opinion survey methodology
The number of samples from Moratuwa identified as 200 households, but size of the sample
increased to 202 during the implementation to increase the accuracy. The selection of households
and areas within Moratuwa MC was done after a consultative discussion with MSW section officers
at MMC and JICA expert team members.
The survey was executed by a team of university students who were trained about the questionnaire,
survey methodology and the data entering before dispatched to their respective fields. A senior
expertise took the leadership and continuously supervised the field survey. The selected households
were first educated about the survey, its main objectives and asked their cooperation before starting
the field survey. In addition business and institutes, large waste generators, hospitals recycling shops
and large public markets were also surveyed using appropriate questionnaires prepared in
consultation with JICA experts.
Table 3‐1 Category and number of samples for Public Opinion Survey
Category Survey Area Number of samples
High‐income households Koranelis Place, Anglican Church Rd, JMC Fernando Rd, Galpotta Mw, Rely Fernando Rd
50
Middle‐income Households 1st Lane Katubedda, Galpotta Mw, Kridangana Mw, Mendis Rd, C.P. de Silva,
50
Low‐income Households Samajawadi Niwasa‐Pura, Covious rd, Kovila Rd, Usawi Watta, Podu Jana Mw
50
Businesses /Service organization New Galle Rd, Galle Rd, Rawtawatta, Galle Rd, New Galle Rd
37
Large waste generators 11
Markets 1
Recycling shops 1
NGO 1
(225)

The data collection survey of solid waste management in Sri Lanka Main Report‐ Moratuwa Municipal Council
8
Category Survey Area Number of samples
Total 202
The questionnaires were available in all languages (English/Sinhala/Tamil); however the
questionnaire form was filled by the interviewer based on interviewees’ response. The collected
information was recorded in digital form using Microsoft Excel and reviewed for accuracy. The data
was analyzed in detail for different objectives that generate an overview of the survey.
3.2 Results of Public Opinion Survey
97% of the surveyed households are Sinhalese, with 1 % of Muslims, 1% Tamils and 1 %
other. Data on the average number of people per household and monthly income is set out
in below Table 3‐2.
Table 3‐2 Average and standard deviation values of income and family size
Category Family size Income (Rs/month)
High 4.5 ± 1.7 85, 200 ± 32, 607
Middle 4.1 ± 1.2 48, 375 ± 10, 226
Low 4.0 ± 1.3 27, 140 ± 9,553
No of workers Income (Rs/month)
Business 3.9 ± 3.4 602, 200 ± 940, 534
In Moratuwa MC, 100 % of surveyed households are provided with a garbage collection
service, of which 97% stated they use this service. Only 44 % of surveyed households are
“very satisfied” with present SWM service provision, while 34 % are “somewhat satisfied”.
Figure 3‐1 Method of garbage discharge by residence in MMC area
Placing outside53%
Carrying to collection point11%
Carrying to collection truck3%
Other3%
Irrelevant30%
How is your garbage collected?
(226)
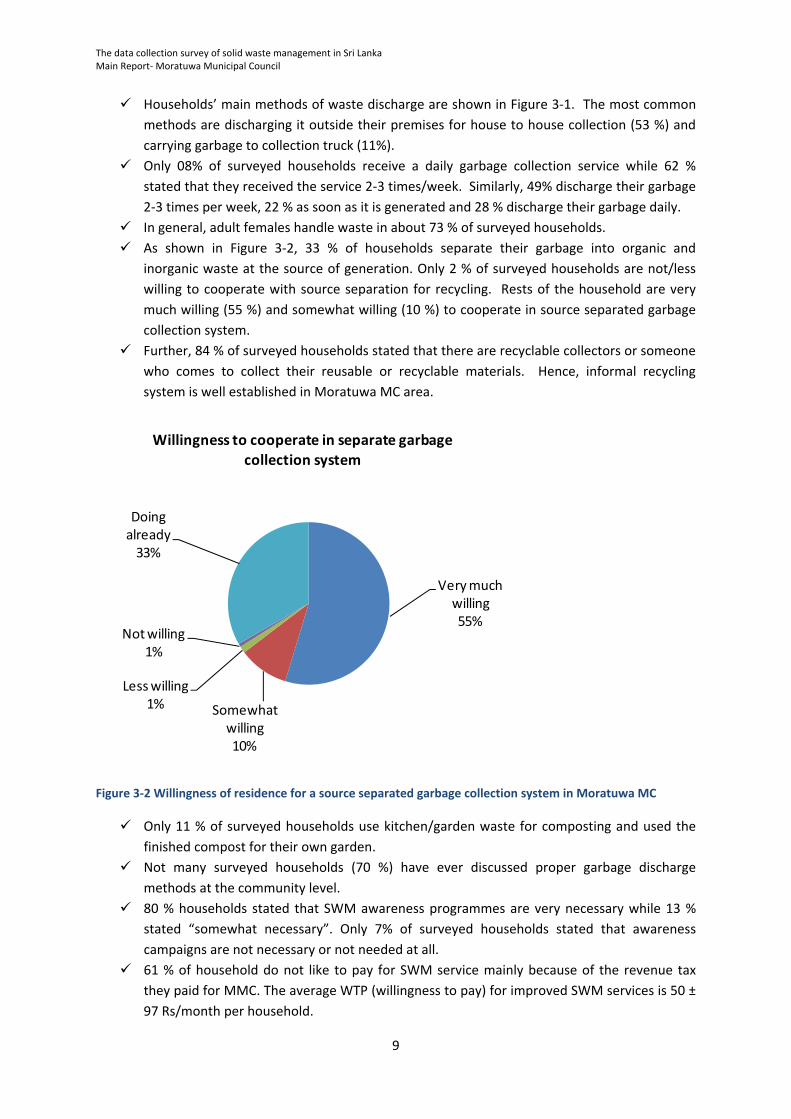
The data collection survey of solid waste management in Sri Lanka Main Report‐ Moratuwa Municipal Council
9
Households’ main methods of waste discharge are shown in Figure 3‐1. The most common
methods are discharging it outside their premises for house to house collection (53 %) and
carrying garbage to collection truck (11%).
Only 08% of surveyed households receive a daily garbage collection service while 62 %
stated that they received the service 2‐3 times/week. Similarly, 49% discharge their garbage
2‐3 times per week, 22 % as soon as it is generated and 28 % discharge their garbage daily.
In general, adult females handle waste in about 73 % of surveyed households.
As shown in Figure 3‐2, 33 % of households separate their garbage into organic and
inorganic waste at the source of generation. Only 2 % of surveyed households are not/less
willing to cooperate with source separation for recycling. Rests of the household are very
much willing (55 %) and somewhat willing (10 %) to cooperate in source separated garbage
collection system.
Further, 84 % of surveyed households stated that there are recyclable collectors or someone
who comes to collect their reusable or recyclable materials. Hence, informal recycling
system is well established in Moratuwa MC area.
Figure 3‐2 Willingness of residence for a source separated garbage collection system in Moratuwa MC
Only 11 % of surveyed households use kitchen/garden waste for composting and used the
finished compost for their own garden.
Not many surveyed households (70 %) have ever discussed proper garbage discharge
methods at the community level.
80 % households stated that SWM awareness programmes are very necessary while 13 %
stated “somewhat necessary”. Only 7% of surveyed households stated that awareness
campaigns are not necessary or not needed at all.
61 % of household do not like to pay for SWM service mainly because of the revenue tax
they paid for MMC. The average WTP (willingness to pay) for improved SWM services is 50 ±
97 Rs/month per household.
Very much willing55%
Somewhat willing10%
Less willing1%
Not willing1%
Doing already33%
Willingness to cooperate in separate garbage collection system
(227)

The data collection survey of solid waste management in Sri Lanka Main Report‐ Moratuwa Municipal Council
10
Out of all surveyed households, 31 % stated that they sale/give‐off Glass & Bottle for
recycling and 30 % of residence sale/give‐off Plastics for recycling. Also, 14 % of households
sale/ give‐off can & metal for recycling. Cardboard and paper recycling were 4 % and 11 %
respectively.
(228)

The data collection survey of solid waste management in Sri Lanka Main Report‐ Moratuwa Municipal Council
11
4 Final disposal site survey (FDS)
4.1 Introduction the FDS of Moratuwa MC
4.1.1 Survey Method
The data and information in this report were collected from various sources including published
reports, verified data from Moratuwa Municipal Council, Manager of Karadiyana Waste Disposal site
and direct interview with officers & workers at disposal site.
4.1.2 Target of Survey
The survey is focus on obtaining general information on waste receiving, handling, disposal, facility
management, environmental monitoring and legal adherences.
4.1.3 Data Sampling
The numerical data was collected as specified in following Table 4‐1.
Table 4‐1 Data collected during the final disposal site survey
Survey Items Method
1 Current condition of final disposal site and its surroundings
Disposal method and structure Records, visual observation
Soil‐covering Records, visual observation
Land owner Records
Residual area Records, visual observation
Leachate water Records, visual observation
Waste picker Records, visual observation, interview
Scattering waste, smoke, fire, offensive odour, animals and so on
Records, visual observation
2 Operation and Management of final disposal site
Environmental Protect License and Environmental Clearance
Record
Personnel Records, interview
Operation vehicles, their maintenances and drivers Records, interview
Weighbridge Records, interview
Waste collection data Records, interview
Supervisory method Records, interview
3 Waste amount to final disposal site (24 hours, 7 days) Records, Survey
4 Adverse impact near by residences Records, Survey
5 Implementation status of geological, topographic and EIA survey
for new final disposal site
Records, interview
6 Progress situation for new final disposal site Records, interview
7 Court case Records, interview
(229)

The data collection survey of solid waste management in Sri Lanka Main Report‐ Moratuwa Municipal Council
12
4.2 Current condition of final disposal site and its surroundings
4.2.1 Karadiyana waste disposal site
Karadiyana waste disposal site is one of the largest MSW dumpsite in the country. The Karadiyana
dumpsite second only to the Meethotumulla dumpsite for its waste disposal amounts.
The Karadiyana site is situated approximately 6.5 km away from Moratuwa city center. The site
boarded to Weras Ganga (upper catchment river of Bolgoda Lake) on the west and abandoned
paddy field and marshy lands on other sides (Figure 4‐1).
Figure 4‐1 Location of Karadiyana dumpsite
4.2.2 History and evolution of the dumpsite
The available records showed the dumpsite was first started in year 1996. Prior to this, Moratuwa
MC disposed collected MSW at a dumpsite in Thalahena on the west side Weras Ganga. Starting
from 1996, the site was commonly shared by few municipal and local authorities for waste disposal.
The historical evolution of the dumpsite is illustrated in Figure 4‐2.
During the late 90’s, there were several dumping grounds other right bank of the Weras Ganga. The
residence residing around the area stated there were three main dumping areas during late 90’s and
early 2000’s. However, by the mid of 2000’s, the dumping was limited two large areas separated by
a small stream, runs perpendicular to the Weras Ganga. It has been reported that, during the mid
2000’s the small river was heavily contaminated by leachate (Esakku et al., 2007).
The Weras Ganga, a stream flowing adjacent to the dumpsite on west direction, finally connected to
the Bolgoda lake which is considered as very sensitive coastal lagoon in western province of Sri
Lanka. Therefore, Karadiyana dump site has been a hot topic in the country due to protests from
public and environmentalist throughout the history.
(230)

The data collection survey of solid waste management in Sri Lanka Main Report‐ Moratuwa Municipal Council
13
Figure 4‐2 Historical evolution of Karadiyana dumpsite
(231)

The data collection survey of solid waste management in Sri Lanka Main Report‐ Moratuwa Municipal Council
14
4.2.3 Management and authority of Karadiyana Dumpsite
At first the dump site at Karadiyana has been used by a Private Sector Company to dispose the waste
collected from Dehiwala Mt Lavinia MC, Moratuwa MC and Kesbewa MC since 1996. In view of the
huge environmental & health impacts caused by open dumping of waste over a period of long time,
and due public objections, a Cabinet Sub Committee directed relevant ministries (ministry of Local
Government, Ministry of Environment, Pilisaru Project and Western Provincial Council) to provide a
temporary solution to manage the incoming waste in collaboration with the Western Province
Waste Management Authority (WMA‐WP). During the time, the private sector company agreed to
design and construct a feasible solution, but could not accomplish by themselves. Consequently, the
Privet Company and the WMA‐WP jointly prepared a project proposal and approval of the Cabinet of
Ministers was obtained on 16th December 2009 to implement the proposal with funding from the
General treasury. However, as the private company has not followed conditions laid out by the
Central Environment Authority, the site was handed over to the Western Province Waste
Management Authority (WMA) in 2010.
4.2.4 Extend and landform
Final disposal site is located at Karadiyana, at about 5 km away from the Galle road. The extent of
the final waste disposal site is 37 acres (site A =12 acres, site B = 13 acres, reservation for Waste
energy project = 12 acres). The closet proximity to residence is around 100 m from the site B and
800 m from site A on the western side across the Weras Ganga. The Weras ganga runs
approximately 5 km south to meet Bolgoda Lake and Lunawa Lagoon.
Figure 4‐3 Karadiyana dumpsite and environment within 500 m radius from center
There are two entrances to the site; main entrance (A) has gate and security office. The site B has
only security office. The site A and B are separated with a stream which has been widen and dredged
recently by Sri Lanka Land Reclamation & Development Corporation (SLLR & DC). The access road to
(232)
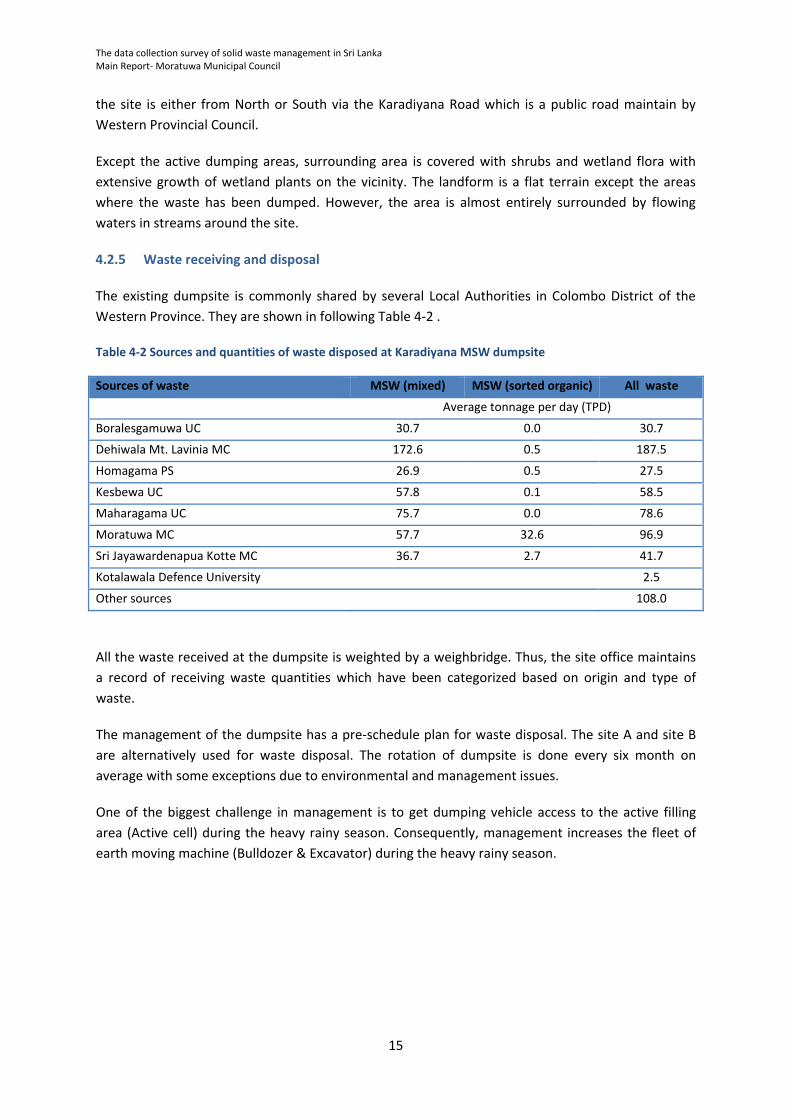
The data collection survey of solid waste management in Sri Lanka Main Report‐ Moratuwa Municipal Council
15
the site is either from North or South via the Karadiyana Road which is a public road maintain by
Western Provincial Council.
Except the active dumping areas, surrounding area is covered with shrubs and wetland flora with
extensive growth of wetland plants on the vicinity. The landform is a flat terrain except the areas
where the waste has been dumped. However, the area is almost entirely surrounded by flowing
waters in streams around the site.
4.2.5 Waste receiving and disposal
The existing dumpsite is commonly shared by several Local Authorities in Colombo District of the
Western Province. They are shown in following Table 4‐2 .
Table 4‐2 Sources and quantities of waste disposed at Karadiyana MSW dumpsite
Sources of waste MSW (mixed) MSW (sorted organic) All waste
Average tonnage per day (TPD)
Boralesgamuwa UC 30.7 0.0 30.7
Dehiwala Mt. Lavinia MC 172.6 0.5 187.5
Homagama PS 26.9 0.5 27.5
Kesbewa UC 57.8 0.1 58.5
Maharagama UC 75.7 0.0 78.6
Moratuwa MC 57.7 32.6 96.9
Sri Jayawardenapua Kotte MC 36.7 2.7 41.7
Kotalawala Defence University 2.5
Other sources 108.0
All the waste received at the dumpsite is weighted by a weighbridge. Thus, the site office maintains
a record of receiving waste quantities which have been categorized based on origin and type of
waste.
The management of the dumpsite has a pre‐schedule plan for waste disposal. The site A and site B
are alternatively used for waste disposal. The rotation of dumpsite is done every six month on
average with some exceptions due to environmental and management issues.
One of the biggest challenge in management is to get dumping vehicle access to the active filling
area (Active cell) during the heavy rainy season. Consequently, management increases the fleet of
earth moving machine (Bulldozer & Excavator) during the heavy rainy season.
(233)

The data collection survey of solid waste management in Sri Lanka Main Report‐ Moratuwa Municipal Council
16
Figure 4‐4 Daily waste disposal amount at Karadiyana dumpsite for a year (The peaks in August 2015 is due to discharge of soil/dredged waste)
As shown in Figure 4‐4 and Table 4‐3, in addition approximately about 500 tonnes of MSW waste,
dumpsite management accepts different types of other waste receiving from government and privet
organization.
Table 4‐3 Different types of waste disposed at the Karadiyana dumpsite
Type of waste Disposal amount (TPD)
Mixed municipal solid waste 471.71
Sorted organic (municipal) waste 32.02
Construction and demolition waste 17.32
Soil 15.39
Soil mixed with waste 10.62
Bulky Waste 9.92
Slaughterhouse waste 6.88
Industrial waste 4.31
Saw dust 0.77
Industrial sludge waste 0.52
Sanitary waste 0.17
Polythene & Styrofoam 0.15
Wood trunk 0.09
Special waste 0.03
Non toxic bulk waste 0.02
The management of Karadiyana dumpsite charged a fee to dispose waste at the dumpsite. The tiping
fee structure is shown in.
Type of waste Tipping Fee (Rs/ Tonne)
MSW waste 500
Bulky waste 650
Soil with waste 650
Wood trunk 650
0
500
1000
1500
2000
2500
3000
01 October 2014
08 October 2014
15 October 2014
22 October 2014
29 October 2014
05 November 2014
12 November 2014
19 November 2014
26 November 2014
03 December 2014
10 December 2014
17 December 2014
24 December 2014
31 December 2014
07 January 2015
14 January 2015
21 January 2015
28 January 2015
04 February 2015
11 February 2015
18 February 2015
25 February 2015
04 March
2015
11 March
2015
18 March
2015
25 March
2015
01 April 2015
08 April 2015
15 April 2015
22 April 2015
29 April 2015
06 May 2015
13 May 2015
20 May 2015
27 May 2015
03 June 2015
10 June 2015
17 June 2015
24 June 2015
01 July 2015
08 July 2015
15 July 2015
22 July 2015
29 July 2015
05 August 2015
12 August 2015
19 August 2015
26 August 2015
02 September 2015
09 September 2015
16 September 2015
23 September 2015
30 September 2015
07 October 2015
14 October 2015
21 October 2015
Total disposal (TP
D)
(234)

The data collection survey of solid waste management in Sri Lanka Main Report‐ Moratuwa Municipal Council
17
Type of waste Tipping Fee (Rs/ Tonne)
Slaughter house waste 1550
Industrial waste 1550
Polythene & Styrofoam waste 1550
Sorted organic waste 225
4.3 Site infrastructure facilities
The Karadiyana dumpsite has most of the typical management infrastructure facilities available at a
landfill (Figure 4‐5). Those were purchased and installed by Waste Management Authority of
Western Province during the site rehabilitation works from year 2010.
Figure 4‐5 Major site infrastructure facilities at Karadiyana Dumpsite
(235)

The data collection survey of solid waste management in Sri Lanka Main Report‐ Moratuwa Municipal Council
18
Additional, there is a facility for organic waste composting (Windrow Composting). The composting
plant was built through the fund allocated by Western Provincial Council (Rs. 80 million) and the
Pilisaru program of the Environment Ministry (Rs. 27 million). The composting plant will is still under
construction and modification although the major components are already been made available.
After completion of the composting project infrastructure, WMA‐WP expect to process 100 tonnes
of organic waste per day for composting.
As shown in Figure 4‐6 , Site management has employed a fleet of machineries for waste handling at
the site.
Figure 4‐6 Fleet of machineries work at Karadiyana dumpsite
(236)

The data collection survey of solid
waste m
anagem
ent in Sri Lanka
Main Rep
ort‐ Moratuwa Municipal Council
19
4.3.1
Current condition of final disposal site and its surroundings
1
Current condition of final disposal site and its surroundings
1.1
Disposal
method
and
structure
Incoming waste loads (tractors, compactors and trucks) are weighted and recorded
at the entrance gate. Each
vehicle has been issued
a ticket from the weighbridge w
hich w
ill be rep
orted
back to relevant municipality/
organization
Selected
veh
icles which contain soil and construction w
aste are unloaded on a sep
arate area. Rest of the
waste trucks are directed to active filling area/ cell.
All other M
SW collection veh
icles emptied
its waste at the dumpsite. No specific control measures apply for
selection of dumping area. Thus, Open Dumping is practiced.
All other wastes are dumped on the ground and spread
using bulldozer and excavators
Waste pickers are allowed
to pickup recyclable m
aterial during the unloading and spreading of waste
1.2
Soil‐covering
In general, daily covering of waste by soil is not practiced
However, soil and construction wastes are used to m
ake temporally access/roads on the dump
1.3
Land owner
Ownership lies with a privet owner but the and has been leased out (for 33 years) to W
MA‐W
P
1.4
Residual area
Approximately 25 ha area
has already been covered with waste out the total land area (37 hectares).
1.5
Leachate water
No leachate collection and treatment system
Leachate and surface water flow towards the stream flow around the dumpsite
1.6
Waste picker
At present, 9 peo
ple including 1 women
pick materials for selling
Plastic, Metal, Cardboard, wires, beer cans, and arrack bottles are collected
. Collected
materials are sold by
managem
ent of Karadiyana
(WMA‐W
P) and a
share
is allocated for collectors. Collectors income
is
approximately Rs. 10, 000 per m
onth
1.7
Scattering
waste,
smoke,
Waste is dumped on designated
areas on the dumping site
Scattering and blowing out of waste were not observed
due to proper disposal and covering practices
No fire and smoke witness at the dumpsite during the observation
(237)

The data collection survey of solid
waste m
anagem
ent in Sri Lanka
Main Rep
ort‐ Moratuwa Municipal Council
20
1
Current condition of final disposal site and its surroundings
fire, offen
sive odor, anim
als
Occasionally, offen
sive odors come out from active dumping area. Then authority uses odor control chemicals
Dogs, cattle are frequen
t in the dump site. However, authority take maxim
um effort to control the entry of
anim
als but face difficulties due to lack of fencing around the dumpsite
4.3.2
Operation and M
anagement of final disposal site
2
Operation and M
anagement of final disposal site
2.1
Environmental
Protect
License
and
Environmental Clearance
None
2.2
Personnel
1‐Project M
anager –Permanen
t position (project m
anager is working under the Zone
Manager of WMA‐W
P. The overall managem
ent is done by Chairm
en and Director f
WMA‐W
P)
1‐Human
Resources M
anager –Perman
ent position
1‐Accountant – permanent position but vacant at present
2‐ Human
resource managem
ent assistants‐ Permanen
t positions
1‐ Site supervisor–Permanen
t position
2‐ Machine operators–P
ermanen
t position
9‐Labors‐ Permanen
t position
43‐Contract/ Casual labors‐ but only 17‐24 of them are employed daily
2.3
Operation vehicles, their maintenances
and
drivers
3 bulldozers (2 bulldozers on ren
t)
2 excavators (both excavators on ren
t basis)
1 backhoe loader
1 four wheel tractors
1 dump truck
1 double‐cab
for office use and 1 van
has been hired for general purposes
(238)

The data collection survey of solid
waste m
anagem
ent in Sri Lanka
Main Rep
ort‐ Moratuwa Municipal Council
21
2
Operation and M
anagement of final disposal site
2.4
Weighbridge
Available and functioning properly
2.5
Waste collection data
Daily record is available in
digital form
2.6
Supervisory m
ethod
Gen
eral planning and supervision come under W
MA‐W
P (Chairm
an & director). Those
three officers are regularly inspecting the site and instruct the site M
anager for necessary
actions. M
anager is responsible for coordinating with Authority and m
unicipalities for
solving daily m
anagem
ent issues as well as other contingency m
atters.
Site M
anager is responsible for daily operations and long term
planning
3.0
Waste amount to final disposal site (24 hours, 7
days)
A summary is shown in
Table 4‐2 and Table 4‐3
4.0
Adverse im
pact nearby residen
ces
Odor is the man
nuisance for residen
ce around the dumpsite
Then
, the irritation caused by waste collection veh
icles is also a problem for nearby
residen
ce
Dust emission during the dry season is a problem for vehicles/peo
ple who use the
Karadiyana road
5.0
Implemen
tation
status
of
geological,
topographic and EIA survey for
new final
disposal site
There are several proposals for establishmen
t of Waste to Energy project at the site. The
WMA‐W
P has come into an agreemen
t with a privet investmen
t company.
The EIA has been submitted in
2012, but the approval has not been granted yet.
A sam
ple project rep
ort on Karadiyana WtoE is attached
as Annex i
6.0
Progress situation for new
final disposal site
None
7.0
Court case
Residen
ce around the dumpsite has taken
legal actions against the Karadiyana Dumpsite
Managemen
t at M
agistrate Court, and the legal order has been issued
to W
MA‐W
p to
rectify the issues
(239)

The data collection survey of solid
waste m
anagem
ent in Sri Lanka
Main Rep
ort‐ Moratuwa Municipal Council
22
2
Operation and M
anagement of final disposal site
No official records are available up to date since the court case is still going on
(240)

Annex
MORATUWA MUNICIPAL COUNCIL
(241)

Response to Public Opinion Survey for Household Moratuwa MC
Page 1 of 7
Response to Public Opinion Survey for Household
Sinhala97%
Muslim1%
Tamil
1% Other
1%
Ethnicity
Buddhist
59%
Islam3%
Hindu1%
Christian 37%
Other0%
Religion
Garbage
collection76%
Storm
water drainage22%
Water supply2%
Please specify the priority for your daily life regarding the improvement of the following
aspects?
Yes100%
No0%
Are there garbage collection services in your area?
Yes97%
No
3%
Do you use these services?
Placing outside53%
Carrying to collection point11%
Carrying to collection truck3%
Other3%
Irrelevant30%
How is your garbage collected?
(242)

Response to Public Opinion Survey for Household Moratuwa MC
Page 2 of 7
Response to Public Opinion Survey for Household
2‐25m
74%
26‐50m
15%
51‐100m
5%
100‐
250m5%
>250m
1%Don't know0%
How far do you have to walk to reach collection point?
Daily8%
> 4 times/Wk
1%
2‐3 times/Wk
62%
Once/Wk
16%
<
Once/Wk3%
Irregular8%
Don't know1%
Irrelevant1%
How often is your garbage collected?
Yes
49%No49%
Don't know2%
Is the garbage collection service done at a fixed time on the collection day?
Very satisfied44%
Somewha
t satisfied34%
Less than satisfied14%
Not
satisfied at all
8%
Are you satisfied with the collection service?
Not properly done15%
Frequency too low
22%
Is irregular15%
Too early/ too late22%
Bad workers' behaviour
13%
Workers demand
allowance4%
Allowance is expensive
1%
Service not fair1% Point if too far
0%Other7%
What are reasons for dissatisfaction?
(243)

Response to Public Opinion Survey for Household Moratuwa MC
Page 3 of 7
Response to Public Opinion Survey for Household
Yes19%
No
81%
Have you ever complained about the garbage collection service to the authorities in the last
three years?
19%
81%
Do you want to receive a garbage collection service? (only for persons who do not have garbage collection services in the area)
Discharge outside28%
Specific place2%
Open dump2%
Request a collection truck1%
Self‐dispose3%
Composting3%
Give for recycling1%
Other (collection truck/ common bin)
60%
How do you dispose of garbage generated in your premises?
As soon
as22%
Once daily28%
Once 2‐3
days49%
Less
frequent1%
How often do you dispose of garbage generated in your premises?
Adult
male11%
Adult female73%
Servant
9%
Other
7%
Who mainly handles wastes at home?
(244)

Response to Public Opinion Survey for Household Moratuwa MC
Page 4 of 7
Response to Public Opinion Survey for Household
Very much willing55%
Somewhat willing10%
Less willing1%
Not willing1%
Doing already33%
Willingness to cooperate in separate garbage collection system
Reduce landfill amount
25%
Protect
environment
64%
Can earn
money0%
Others11%
If you are willing to cooperate, why do you think recycling is important?
Yes84%
No12%
Don't
know4%
Is there someone who comes around to collect or buy your reusable or recyclable materials?
Yes
11%
No89%
Do you take for recyclable materials to shops for refund or sale?
Yes
11%
No
89%
Are you using kitchen and/or garden waste for compost?
< Half
80%
Half
6%
> Half
7%
All
7%
If you do composting, how much of kitchen waste used for composting?
(245)

Response to Public Opinion Survey for Household Moratuwa MC
Page 5 of 7
Response to Public Opinion Survey for Household
< Half69%
Half
12%
> Half0%
All19%
If you do composting, how much of garden waste used for composting?
Sell0%
Own use
100%
What do you do with produced compost?
Don’t like to pay
61%
Willing to pay39%
Suppose that you are satisfied with the service of Municipal solid waste management, either as is or as a result of improvement. Think for a moment about the largest amount of money that your household would be willing to pay each month as a garbage colle
Yes
50%No
43%
Don't
know7%
Do you have any community‐based organizations to solve not only the waste problems but also other community
problems?
Yes22%
No70%
Don't know8%
Have you ever discussed the methods of proper garbage handling and discharge at the
meetings?
(246)

Response to Public Opinion Survey for Household Moratuwa MC
Page 6 of 7
Response to Public Opinion Survey for Household
Yes71%
No
29%
Have you ever been taught methods of proper garbage handling and discharge?
Parents1%
Community3%
School
4%
Local Gov.
45%Central
Gov.31%
NGOs
0%
Others
16%
If you have learned , who taught proper garbage handling methods?
Very necessary
80%
Somewhat
necessary
13%
Not very necessary
5%
Not
necessary at all2%
Do you think a campaign to raise awareness of people for maintaining the cleaner city and
environment is necessary?
(247)

Kesbewa UC 1.8
(249)この前に合紙 この前に合紙

The data collection survey of solid waste management in Sri Lanka Main Report‐ Kesbewa Urban Council
i
Table of content
1 Introduction .................................................................................................................................... 1
1.1 Background conditions of Kesbewa Urban Council ................................................................ 1
2 Waste Generation Survey (WGS) .................................................................................................... 4
2.1 Waste Generation Survey Results ........................................................................................... 5
3 Public Opinion Survey (POS) ........................................................................................................... 8
3.1 Public opinion survey methodology ....................................................................................... 8
3.2 Results of Public Opinion Survey ............................................................................................ 9
(250)

The data collection survey of solid waste management in Sri Lanka Main Report‐ Kesbewa Urban Council
ii
List of Tables
Table 1‐1 Basic fact sheet of Kesbewa Urban Council ............................................................................ 1
Table 1‐2 Land use pattern of Kesbewa UC area (UDA‐2012) ................................................................ 2
Table 2‐1 Type of data collected for WGS in Kesbewa UC ..................................................................... 4
Table 2‐2 Population statistics of villages in KUC area ........................................................................... 5
Table 2‐3 Number of government and privet institutions within Kesbewa UC ...................................... 6
Table 2‐5 Types and number of business establishments in KUC area .................................................. 6
Table 3‐1 Category and number of samples for Public Opinion Survey ................................................. 8
Table 3‐2 Average and standard deviation values of income and family size ........................................ 9
(251)

The data collection survey of solid waste management in Sri Lanka Main Report‐ Kesbewa Urban Council
iii
List of Figures
Figure 1‐1 Ward and GN map of Kesbewa UC area ................................................................................ 3
Figure 3‐1 Method of garbage discharge by residence in KUC area ....................................................... 9
Figure 3‐2 Willingness of residence for a source separated garbage collection system in Kesbewa UC
.............................................................................................................................................................. 10
(252)

The data collection survey of solid waste management in Sri Lanka Main Report‐ Kesbewa Urban Council
1
1 Introduction
The purpose of this survey is to obtain the current data regarding Solid Waste Management (SWM)
at Kesbewa Urban Council (KUC). The data collection survey was conducted from 23th October to
29th October, 2015 by a team of expert dispatched by Waste To Energy Technologies Limited.
This report consists of brief summaries of survey methods and results. The additional primary data
and records are available as soft copies. The preliminary data collection was conducted through
three comprehensive surveys which are;
i. Waste Generation Survey (WGS) is to gather information on waste generation sources at
KUC based on secondary data available at KUC and other relevant organizations.
ii. Public Opinion Survey (POS) is gather information on public opinion on current waste
management in KUC. The POS was conducted through a questionnaire survey that covers
different types of waste generators in the KUC area.
iii. Final Disposal Site Survey (FDSS) is to collection data on final MSW disposal site of KUC
based on secondary data as well as field recordings & visits to the site. DMUC commonly
shares Karadiyana final disposal facility which is discussed in “Data collection Survey
Report‐ Moratuwa UC”.
1.1 Background conditions of Kesbewa Urban Council
Kesbewa Urban Council (KUC) encompasses 50.39 km2 in the Colombo district located in the
Western province in Sri Lanka. KUC lies on the Colombo‐Horana main road about 20 km away from
the commercial capital of Sri Lanka and is part of the Colombo urban fringe that has been rapidly
increasing in population. It is also characterized by high and rapid conversion of agricultural to urban
uses.
The KUC is located in the Low country Wet zone which is classified based on the altitude from the
mean sea level and annual rainfall. The KUC area is characterized by four rainy seasons; the first
Inter‐monsoon period from March to April, the Southwest Monsoon period from May to September,
the Second inter‐monsoon period from October and November and the Northeast monsoon period
from December to February. During the Southwest monsoon period, the area receives more than
500 mm rainfall, while during the second inter‐monsoon and the northeast monsoon periods the
area receives more than 200 mm average rainfall in some months.
The average air temperature of the KUC area for last 5 years (2008 to 2013) is 28.05 °C, ranging from
31.33 °C (Maximum) temperature to 24.50 °C (Minimum) with some significant deviations. During
the Southwest Monsoon period (May to September) average temperature is relatively low when
compared with the 1st inter monsoon period and the northeast monsoon period. The hottest season
of the KUC is January to March.
Table 1‐1 Basic fact sheet of Kesbewa Urban Council
Item Description
Province Western Province of Sri Lanka
(253)
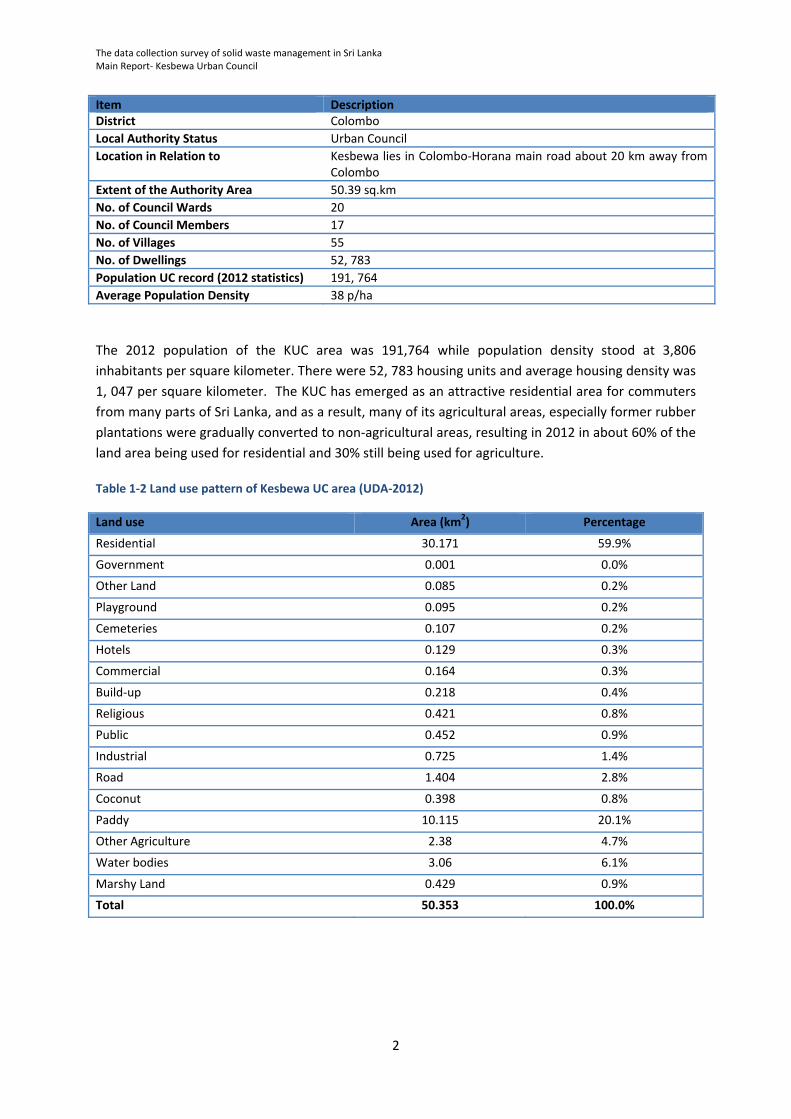
The data collection survey of solid waste management in Sri Lanka Main Report‐ Kesbewa Urban Council
2
Item DescriptionDistrict Colombo
Local Authority Status Urban Council
Location in Relation to Kesbewa lies in Colombo‐Horana main road about 20 km away fromColombo
Extent of the Authority Area 50.39 sq.km
No. of Council Wards 20
No. of Council Members 17
No. of Villages 55
No. of Dwellings 52, 783
Population UC record (2012 statistics) 191, 764
Average Population Density 38 p/ha
The 2012 population of the KUC area was 191,764 while population density stood at 3,806
inhabitants per square kilometer. There were 52, 783 housing units and average housing density was
1, 047 per square kilometer. The KUC has emerged as an attractive residential area for commuters
from many parts of Sri Lanka, and as a result, many of its agricultural areas, especially former rubber
plantations were gradually converted to non‐agricultural areas, resulting in 2012 in about 60% of the
land area being used for residential and 30% still being used for agriculture.
Table 1‐2 Land use pattern of Kesbewa UC area (UDA‐2012)
Land use Area (km2) Percentage
Residential 30.171 59.9%
Government 0.001 0.0%
Other Land 0.085 0.2%
Playground 0.095 0.2%
Cemeteries 0.107 0.2%
Hotels 0.129 0.3%
Commercial 0.164 0.3%
Build‐up 0.218 0.4%
Religious 0.421 0.8%
Public 0.452 0.9%
Industrial 0.725 1.4%
Road 1.404 2.8%
Coconut 0.398 0.8%
Paddy 10.115 20.1%
Other Agriculture 2.38 4.7%
Water bodies 3.06 6.1%
Marshy Land 0.429 0.9%
Total 50.353 100.0%
(254)

The data collection survey of solid
waste m
anagem
ent in Sri Lanka
Main Rep
ort‐ Kesbew
a Urban
Council
3
Figure 1‐1 W
ard and GN m
ap of Kesbewa UC area
(255)

The data collection survey of solid waste management in Sri Lanka Main Report‐ Kesbewa Urban Council
4
2 Waste Generation Survey (WGS)
In order to obtain general information on waste generation amounts, the data available at waste
management section of the Health Department, Works Department and Revenue Department of
KUC was used. Some of the data was available in the form of formal records and reports which were
treated as the most precise secondary data while the data collected from official interviews with
KUC officers was treated as verification data. Thus, the survey data was collected through different
methods;
a) Recording and compiling of published and verified data by KUC,
b) Reading and recording of unpublished & non‐confidential data available at KUC,
c) Recording and official statistics available at Kesbewa Divisional Secretariat office, and
d) Official person‐to‐person interview with relevant officers at KUC for verification of data.
The numerical data was collected as specified in following Table 2‐1.
Table 2‐1 Type of data collected for WGS in Kesbewa UC
Source Description
Household Each number of following category households was surveyed;1) High income level, 2) Middle income level and 3) Low income level.
Commercial Each number of following category restaurants was surveyed;1) Large size restaurants, 2) Middle size restaurants and 3) Small size restaurants. Each number of following category shops was surveyed; 1)Organic shops (large) 2)Organic shops (middle) 3)Organic shops (small) 4)Non‐Organic shops (large) 5)Non‐Organic shops (middle) 6)Non‐Organic shops (small)
Hotels Each number of following category hotels was surveyed;1) Large size hotels 2) Middle size hotels and 3) Small size hotels.
Markets Number of stalls and types
Institutions Each number of following institute was surveyed;1) Schools 2) Hospitals (government) 3) Hospitals (private) 4) Public office 5) Bank/private office 6) Buddhist temples 7) Hindu temples 8) Mosques 9) Churches 10) Navy/Police/ Army bases 11) Others
Industries Wastes from any industries.
(256)
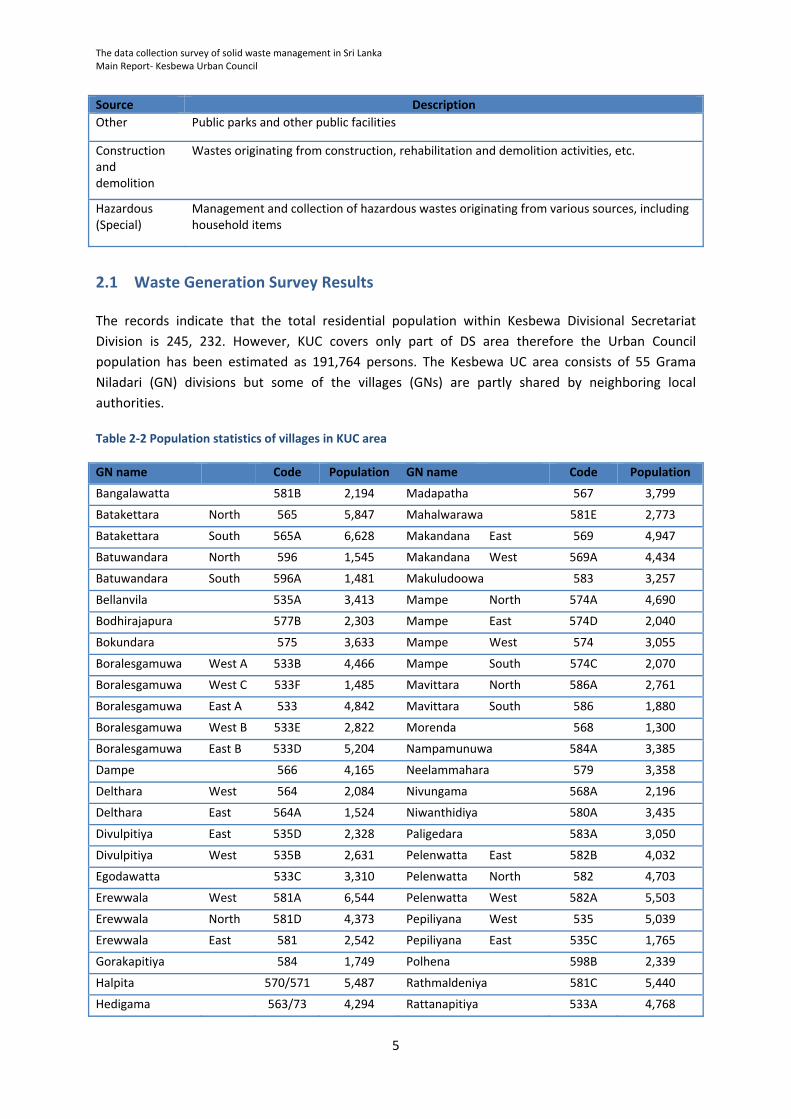
The data collection survey of solid waste management in Sri Lanka Main Report‐ Kesbewa Urban Council
5
Source Description
Other Public parks and other public facilities
Construction and demolition
Wastes originating from construction, rehabilitation and demolition activities, etc.
Hazardous (Special)
Management and collection of hazardous wastes originating from various sources, including household items
2.1 Waste Generation Survey Results
The records indicate that the total residential population within Kesbewa Divisional Secretariat
Division is 245, 232. However, KUC covers only part of DS area therefore the Urban Council
population has been estimated as 191,764 persons. The Kesbewa UC area consists of 55 Grama
Niladari (GN) divisions but some of the villages (GNs) are partly shared by neighboring local
authorities.
Table 2‐2 Population statistics of villages in KUC area
GN name Code Population GN name Code Population
Bangalawatta 581B 2,194 Madapatha 567 3,799
Batakettara North 565 5,847 Mahalwarawa 581E 2,773
Batakettara South 565A 6,628 Makandana East 569 4,947
Batuwandara North 596 1,545 Makandana West 569A 4,434
Batuwandara South 596A 1,481 Makuludoowa 583 3,257
Bellanvila 535A 3,413 Mampe North 574A 4,690
Bodhirajapura 577B 2,303 Mampe East 574D 2,040
Bokundara 575 3,633 Mampe West 574 3,055
Boralesgamuwa West A 533B 4,466 Mampe South 574C 2,070
Boralesgamuwa West C 533F 1,485 Mavittara North 586A 2,761
Boralesgamuwa East A 533 4,842 Mavittara South 586 1,880
Boralesgamuwa West B 533E 2,822 Morenda 568 1,300
Boralesgamuwa East B 533D 5,204 Nampamunuwa 584A 3,385
Dampe 566 4,165 Neelammahara 579 3,358
Delthara West 564 2,084 Nivungama 568A 2,196
Delthara East 564A 1,524 Niwanthidiya 580A 3,435
Divulpitiya East 535D 2,328 Paligedara 583A 3,050
Divulpitiya West 535B 2,631 Pelenwatta East 582B 4,032
Egodawatta 533C 3,310 Pelenwatta North 582 4,703
Erewwala West 581A 6,544 Pelenwatta West 582A 5,503
Erewwala North 581D 4,373 Pepiliyana West 535 5,039
Erewwala East 581 2,542 Pepiliyana East 535C 1,765
Gorakapitiya 584 1,749 Polhena 598B 2,339
Halpita 570/571 5,487 Rathmaldeniya 581C 5,440
Hedigama 563/73 4,294 Rattanapitiya 533A 4,768
(257)

The data collection survey of solid waste management in Sri Lanka Main Report‐ Kesbewa Urban Council
6
GN name Code Population GN name Code Population
Honnanthara North 585 3,522 Regidel Watta 598A 1,270
Honnanthara South 585A 3,939 Suwarapola East 562A 2,779
Horathuduwa 570/71A 1,604 Suwarapola West 562C 1,387
Jamburaliya 597 3,184 Thumbovila South 576B 3,303
Kahapola 598 3,283 Thumbovila North 576A 4,037
Kaliyammahara 580 3,042 Thumbovila West 576 2,697
Katuwawala North 578 3,697 Vishwakalawa 574B 2,045
Katuwawala South 578A 1,489 Werahera North 577 1,977
Kesbewa North 572 4,279 Werahera South 577A 5,213
Kesbewa East 572B 2,019 Wewala West 562B 4,949
Kesbewa South 572A 6,316 Wewala East 562 2,655
Kolamunna 563/73A 3,633 Total 245,232
Following Table 2‐3 shows the number of government and privet/non‐government establishments
within Kesbewa UC.
Table 2‐3 Number of government and privet institutions within Kesbewa UC
Type of institute No. of units
Schools 20
Hospitals 1
Medical Clinics 57
District Secretariat office 1
Divisional secretary offices 1
Post office 8
Police stations 1
Higher education institutes 63
A major portion of MSW is generated from commercial sector in the city. Following Table 2‐4 shows
the number of different commercial (business) establishments in KUC area.
Table 2‐4 Types and number of business establishments in KUC area
Type of business No. of units Type of business No. of units
Large restaurants 37 Press/printing 34
Small restaurants 46 Guest House 28
Vegetable/ Fruit shops 289 Building equipment 27
Glossary shops 606 factory 72
General wholesale shops 30 Food production 13
Textile trading shops 87 Chemical production 7
Electronic equipment shop 99 Reception Hall 8
Electrical equipment shop 52 Communications 74
(258)

The data collection survey of solid waste management in Sri Lanka Main Report‐ Kesbewa Urban Council
7
Type of business No. of units Type of business No. of units
Furniture sales shops 24 Education Center 63
Hardware shops 140 Wholesale 30
Vehicle spare parts shops 13 Financial Center 32
Vehicle repair garages 134 Pawn Center 18
Saw mills 120 bar 7
Vegetable sales shops 289 Office 177
Fish sales stalls 40 Book/Paper Shop 90
Barber shops 40 Oil Station 12
Beauty salon 83 Jewellery 20
Pharmacy 44 Optical Center 9
Large hotels 74 Studio 17
Garments 57 Show room 2
Furniture 3 Metal 19
Saw mills 120 Factories ( Bag etc) 69
Bakery 58 Cab service 19
Ice cream shops 14 Learners 3
Chemical Fertilizer 3 Ceramic Shops 15
Laundry 5 Plastic Shop 6
Vehicle Service 17 Flower shop 15
Mills 86 Battery Service 8
Gas Station 25 Funeral Directors 3
Farm 6 Day care Center 8
Welding /lath 73 Food city 5
(259)
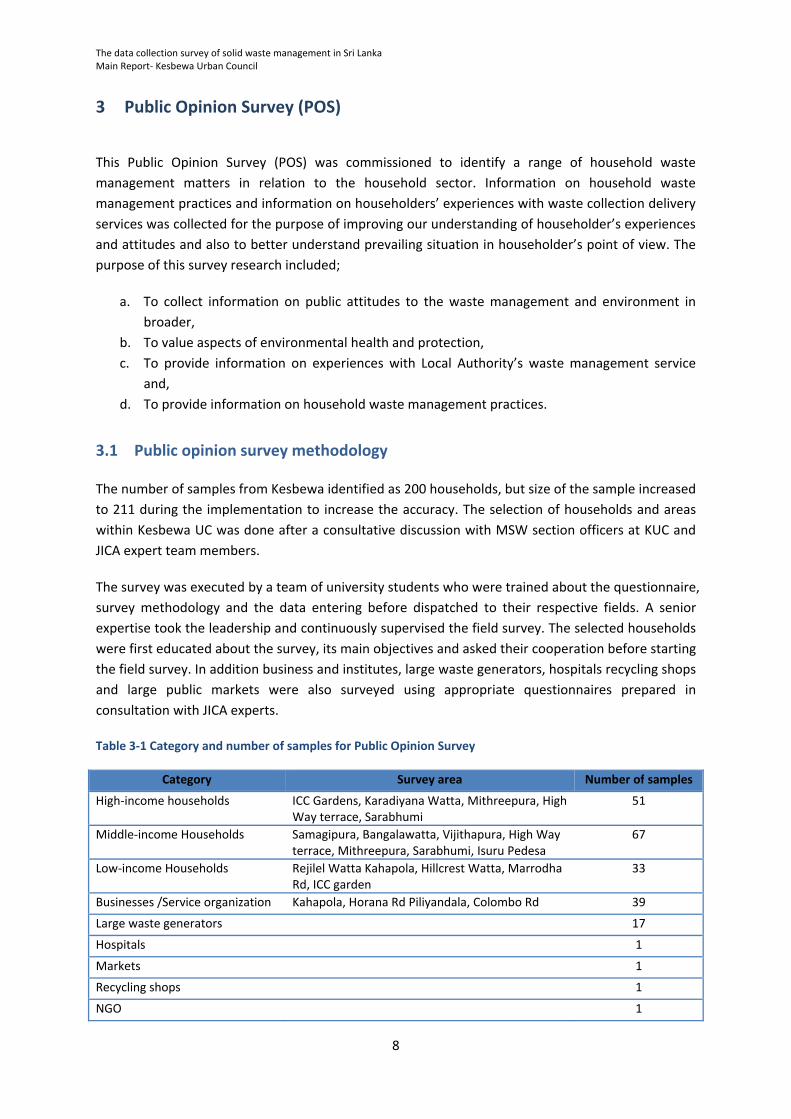
The data collection survey of solid waste management in Sri Lanka Main Report‐ Kesbewa Urban Council
8
3 Public Opinion Survey (POS)
This Public Opinion Survey (POS) was commissioned to identify a range of household waste
management matters in relation to the household sector. Information on household waste
management practices and information on householders’ experiences with waste collection delivery
services was collected for the purpose of improving our understanding of householder’s experiences
and attitudes and also to better understand prevailing situation in householder’s point of view. The
purpose of this survey research included;
a. To collect information on public attitudes to the waste management and environment in
broader,
b. To value aspects of environmental health and protection,
c. To provide information on experiences with Local Authority’s waste management service
and,
d. To provide information on household waste management practices.
3.1 Public opinion survey methodology
The number of samples from Kesbewa identified as 200 households, but size of the sample increased
to 211 during the implementation to increase the accuracy. The selection of households and areas
within Kesbewa UC was done after a consultative discussion with MSW section officers at KUC and
JICA expert team members.
The survey was executed by a team of university students who were trained about the questionnaire,
survey methodology and the data entering before dispatched to their respective fields. A senior
expertise took the leadership and continuously supervised the field survey. The selected households
were first educated about the survey, its main objectives and asked their cooperation before starting
the field survey. In addition business and institutes, large waste generators, hospitals recycling shops
and large public markets were also surveyed using appropriate questionnaires prepared in
consultation with JICA experts.
Table 3‐1 Category and number of samples for Public Opinion Survey
Category Survey area Number of samples
High‐income households ICC Gardens, Karadiyana Watta, Mithreepura, High Way terrace, Sarabhumi
51
Middle‐income Households Samagipura, Bangalawatta, Vijithapura, High Way terrace, Mithreepura, Sarabhumi, Isuru Pedesa
67
Low‐income Households Rejilel Watta Kahapola, Hillcrest Watta, Marrodha Rd, ICC garden
33
Businesses /Service organization Kahapola, Horana Rd Piliyandala, Colombo Rd 39
Large waste generators 17
Hospitals 1
Markets 1
Recycling shops 1
NGO 1
(260)

The data collection survey of solid waste management in Sri Lanka Main Report‐ Kesbewa Urban Council
9
Category Survey area Number of samples
Total 211
The questionnaires were available in all languages (English/Sinhala/Tamil); however the
questionnaire form was filled by the interviewer based on interviewees’ response. The collected
information was recorded in digital form using Microsoft Excel and reviewed for accuracy. The data
was analyzed in detail for different objectives that generate an overview of the survey.
3.2 Results of Public Opinion Survey
95% of the surveyed households are Sinhalese, with 5 % of Muslims. Data on the average
number of people per household and monthly income is set out in below Table 3‐2.
Table 3‐2 Average and standard deviation values of income and family size
Category Family size Income (Rs/month)
High 4.1 ± 1.0 219. 314 ± 285, 156
Middle 4.4 ± 1.2 45, 224 ± 11, 650
Low 4.6 ± 1.6 26, 167 ± 9,358
No of workers Income (Rs/month)
Business 2.4 ± 2.9 893, 590 ± 1, 527, 887
In Kesbewa UC, 100 % of surveyed households are provided with a garbage collection service,
and all of them use this service. Moreever, 64 % of surveyed households are “very satisfied”
with present SWM service provision, while 28 % are “somewhat satisfied”.
Figure 3‐1 Method of garbage discharge by residence in KUC area
Placing outside19%
Carrying to collection point13%
Carrying to collection truck57%
Other5%
Irrelevant6%
How is your garbage collected?
(261)

The data collection survey of solid waste management in Sri Lanka Main Report‐ Kesbewa Urban Council
10
Households’ main methods of waste discharge are shown in Figure 3‐1. The most common
methods are carrying garbage to collection truck (77%) and discharging it outside their
premises for house to house collection (23 %).
Only 33 % of surveyed households receive a daily garbage collection service and 26 % stated
received the service 2‐3 times/week while 36 % revived the service once in a week.
However, 23 % discharge waste as soon as it generates, while 59% discharge their garbage
daily and 18 % discharge 2‐3 times per week.
In general, adult male is responsible for waste discharge in 54 % surveyed households with
31 % adult female share from the rest.
As shown in Figure 3‐2, only 8 % of households separate their garbage into organic and
inorganic waste at the source of generation. Furthermore, 38 % of surveyed households are
not/less willing to cooperate with source separation for recycling. Rests of the household
are either very much willing (26 %) or somewhat willing (28 %) to cooperate in source
separated garbage collection system.
Further, 82 % of surveyed households stated that there are recyclable collectors or someone
who comes to collect their reusable or recyclable materials. Hence, informal recycling
system is well established in Kesbewa UC area.
Figure 3‐2 Willingness of residence for a source separated garbage collection system in Kesbewa UC
None of the surveyed households use kitchen/garden waste for composting.
Not many surveyed households (10 %) have ever discussed proper garbage discharge
methods at the community level.
62 % households stated that SWM awareness programmes are very necessary while 38 %
stated “somewhat necessary”. None of surveyed households stated that awareness
campaigns are not necessary or not needed at all.
Only 15 % of household do not like to pay for an improved SWM service. The average WTP
(willingness to pay) for improved SWM services is 38 ± 52 Rs/month per household.
Very much willing26%
Somewhat willing28%
Less willing5%
Not willing33%
Doing already8%
Willingness to cooperate in separate garbage collection system
(262)

The data collection survey of solid waste management in Sri Lanka Main Report‐ Kesbewa Urban Council
11
Out of all surveyed households, 38 % stated that they sale/give‐off Glass & Bottle for
recycling and 68 % of residence sale/give‐off Plastics for recycling. Also, 11 % of households
sale/ give‐off Tin/can for recycling. Cardboard and paper recycling were as high as 84 % and
35 % respectively.
(263)

Annex
KESBEWA URBAN COUNCIL
(264)

Response to Public Opinion Survey for Household Kesbewa UC
Page 1 of 7
Response to Public Opinion Survey for Household
Sinhala95%
Muslim
5%
Tamil0% Other
0%
Ethnicity
Buddhist93%
Islam5%
Hindu
0% Christian
2% Other0%
Religion
Garbage collection
75%
Storm water
drainage25%
Water supply0%
Please specify the priority for your daily life regarding the improvement of the following
aspects?
Yes99%
No1%
Are there garbage collection services in your area?
Yes
90%
No10%
Do you use these services?
Placing
outside19%
Carrying
to collection
point13%
Carrying
to collection truck57%
Other5%
Irrelevant6%
How is your garbage collected?
(265)
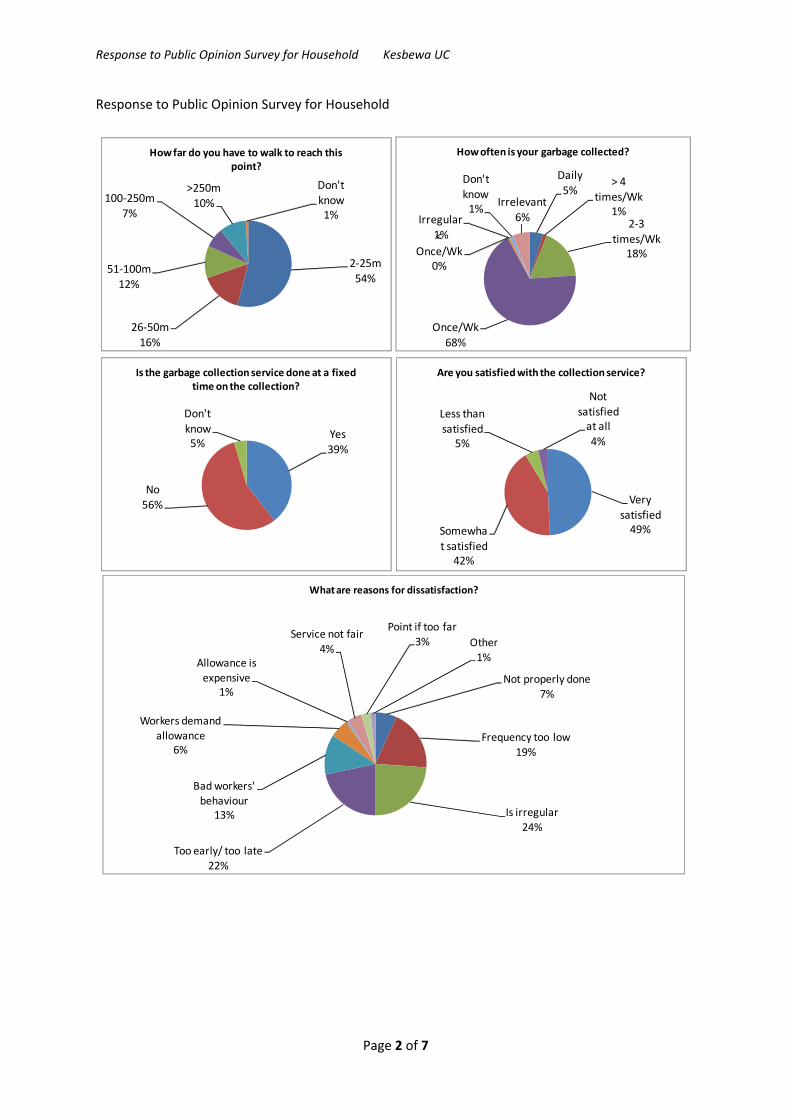
Response to Public Opinion Survey for Household Kesbewa UC
Page 2 of 7
Response to Public Opinion Survey for Household
2‐25m
54%
26‐50m16%
51‐100m12%
100‐250m7%
>250m10%
Don't know1%
How far do you have to walk to reach this point?
Daily5%
> 4 times/Wk
1%2‐3
times/Wk18%
Once/Wk
68%
< Once/Wk
0%
Irregular1%
Don't know1%
Irrelevant
6%
How often is your garbage collected?
Yes39%
No56%
Don't
know5%
Is the garbage collection service done at a fixed time on the collection?
Very
satisfied49%Somewha
t satisfied42%
Less than satisfied
5%
Not satisfied at all4%
Are you satisfied with the collection service?
Not properly done
7%
Frequency too low
19%
Is irregular
24%
Too early/ too late
22%
Bad workers' behaviour
13%
Workers demand allowance
6%
Allowance is
expensive1%
Service not fair
4%
Point if too far
3% Other
1%
What are reasons for dissatisfaction?
(266)

Response to Public Opinion Survey for Household Kesbewa UC
Page 3 of 7
Response to Public Opinion Survey for Household
Yes
13%
No87%
Have you ever complained about the garbage collection service to the authorities in the last
three years?
Yes
80%
No20%
Do you want to receive a garbage collection service? (only for persons who do not have garbage collection services in the area)
Discharge outside17%
Specific place
16%
Open dump1%
Request a collection truck0%
Self‐dispose
25%
Composting
14%
Give for recycling
0%
Other (collection truck/ common bin)
27%
How do you dispose off garbage generated in your premises?
As soon as
46%
Once daily23%
Once 2‐3
days31%
Less frequent
0%
How often do you dispose off garbage generated in your premises
Adult male9%
Adult female83%
Servant4%
Other4%
Who mainly handles wastes at home?
(267)

Response to Public Opinion Survey for Household Kesbewa UC
Page 4 of 7
Response to Public Opinion Survey for Household
Very
much willing60%Somewha
t willing19%
Less willing3%
Not
willing8%
Doing
already10%
Willingness to cooperate in separate garbage collection system
Reduce
landfill amount
42%
Protect environm
ent55%
Can earn
money0%
Others
3%
If you are willing to cooperate, why do you think recycling is important?
Yes
81%
No
19%
Don't
know0%
Is there someone who comes around to collect or buy your reusable or recyclable materials?
Yes
5%
No
95%
Do you take for recyclable materials to shops for refund or sale?
Yes
30%
No70%
Are you using kitchen/garden waste for composting?
< Half
50%
Half
6%
> Half
3%
All
41%
If you do composting, how much of kitchen waste used for composting?
(268)

Response to Public Opinion Survey for Household Kesbewa UC
Page 5 of 7
Response to Public Opinion Survey for Household
< Half37%
Half4%
> Half
2%
All
57%
If you do composting, how much of garden waste used for composting?
Sell0%
Own use100%
What do you do with produced compost?
Yes75%
No18%
Don't know7%
Do you have any community‐based organizations to solve not only the waste problems but also other
community problems?
Yes49%
No34%
Don't know17%
Have you ever discussed the methods of proper garbage handling and discharge at
the meetings?
Don’t like to pay71%
Willing to pay
29%
Suppose that you are satisfied with the service of Municipal solid waste management, either as is or as a result of improvement. Think for a moment about the largest amount of money that your household would be willing to pay each month as a
garbage collection fee
(269)

Response to Public Opinion Survey for Household Kesbewa UC
Page 6 of 7
Response to Public Opinion Survey for Household
Yes80%
No
20%
Have you ever been taught method of proper garbage handling & disposal?
Parents2%
Community
21%
School
3%
Local Gov.35%
Central Gov.8%
NGOs1%
Others30%
If you have learned , who taught proper garbage handling methods?
Very
necessary79%
Somewha
t necessary
19%
Not very
necessary1%
Not
necessary at all
1%
Do you think a campaign to raise awareness of people for maintaining the cleaner city and
environment is necessary?
(270)

Katunayake Seeduwa UC 1.9
(271)この前に合紙 この前に合紙

The data collection survey of solid waste management in Sri Lanka Main Report‐ Katunayake‐Seeduwa Urban Council
i
Table of content
1 Introduction .................................................................................................................................... 1
1.1 Background conditions of Katunayake‐Seeduwa Urban Council ............................................ 1
2 Waste Generation Survey (WGS) .................................................................................................... 2
2.1 Waste Generation Survey Results ........................................................................................... 3
3 Public Opinion Survey (POS) ........................................................................................................... 6
3.1 Public opinion survey methodology ....................................................................................... 6
3.2 Results of Public Opinion Survey ............................................................................................ 7
4 Final disposal site survey (FDS) ..................................................................................................... 10
4.1 Introduction the FDS of Katunayake‐Seeduwa UC ............................................................... 10
4.1.1 Survey Method .............................................................................................................. 10
4.1.2 Target of Survey ............................................................................................................ 10
4.1.3 Data Sampling ............................................................................................................... 10
4.2 Current condition of final disposal site and its surroundings ............................................... 11
4.2.1 Katunayake‐Seeduwa waste disposal site .................................................................... 11
4.2.2 History and evolution of the dumpsite ......................................................................... 12
4.2.3 Management and authority of Katunayake‐Seeduwa Dumpsite ................................. 13
4.2.4 Extend and landform ..................................................................................................... 13
4.2.5 Waste receiving and disposal ........................................................................................ 14
4.3 Site infrastructure facilities ................................................................................................... 14
4.3.1 Current condition of final disposal site and its surroundings ....................................... 16
4.3.2 Operation and Management of final disposal site ....................................................... 17
(272)

The data collection survey of solid waste management in Sri Lanka Main Report‐ Katunayake‐Seeduwa Urban Council
ii
List of Tables
Table 1‐1 Basic fact sheet of Katunayake‐Seeduwa Urban Council ....................................................... 1
Table 2‐1 Type of data collected for WGS in Katunayake‐Seeduwa UC ................................................ 2
Table 2‐2 Population statistics of villages in KSUC area (Source: Census and statistics 2012) ............... 3
Table 2‐3 Type and number of municipal establishment own by Katunayake‐Seeduwa UC ................ 3
Table 2‐4 Number of government and privet institutions within Katunayake‐Seeduwa UC ................. 4
Table 2‐5 Types and number of business establishments in KSUC area ................................................. 4
Table 2‐6 Type and number of vehicles own by KSUC ............................................................................ 5
Table 3‐1 Category and number of samples for Public Opinion Survey ................................................. 6
Table 3‐2 Average and standard deviation values of income and family size ........................................ 7
Table 4‐1 Data collected during the final disposal site survey ............................................................. 10
Table 4‐2 Sources and quantities of waste disposed at Katunayake‐Seeduwa MSW dumpsite .......... 14
(273)

The data collection survey of solid waste management in Sri Lanka Main Report‐ Katunayake‐Seeduwa Urban Council
iii
List of Figures
Figure 3‐1 Method of garbage discharge by residence in KSUC area ..................................................... 7
Figure 3‐2 Willingness of residence for a source separated garbage collection system in Katunayake‐
Seeduwa UC ............................................................................................................................................ 8
Figure 4‐1 Location of Katunayake‐Seeduwa dumpsite ....................................................................... 11
Figure 4‐2 Katunayake‐Seeduwa dumpsite and environment around the dumpsite .......................... 11
Figure 4‐3 Historical evolution of Katunayake‐Seeduwa dumpsite ...................................................... 12
Figure 4‐4 Katunayake‐Seeduwa dumpsite and environment within 500 m radius from center ........ 13
Figure 4‐5 Bulldozer is employed for waste handling at KSUC dumpsite ............................................. 14
Figure 4‐6 Activities and environment around KSUC dumpsite ........................................................... 15
(274)

The data collection survey of solid waste management in Sri Lanka Main Report‐ Katunayake‐Seeduwa Urban Council
1
1 Introduction
The purpose of this survey is to obtain the current data regarding Solid Waste Management (SWM)
at Katunayake‐Seeduwa Urban Council (KSUC). The data collection survey was conducted from 30th
October to 04th November, 2015 by a team of expert dispatched by Waste To Energy Technologies
Limited.
This report consists of brief summaries of survey methods and results. The additional primary data
and records are available as soft copies. The preliminary data collection was conducted through
three comprehensive surveys which are;
i. Waste Generation Survey (WGS) is to gather information on waste generation sources at
KSUC based on secondary data available at KSUC and other relevant organizations.
ii. Public Opinion Survey (POS) is gather information on public opinion on current waste
management in KSUC. The POS was conducted through a questionnaire survey that covers
different types of waste generators in the KSUC area.
iii. Final Disposal Site Survey (FDSS) is to collection data on final MSW disposal site of KSUC
based on secondary data as well as field recordings & visits to the site.
1.1 Background conditions of Katunayake‐Seeduwa Urban Council
Katunayake‐Seeduwa town is located in the Gampaha District of the Western Province on the
Northern direction of City of Colombo. It is bounded by Negombo Municipal Council to the North,
Katana Pradeshiya Sabha to East, Ja‐Ela and Wattala Pradeshiya Sabhas on south. Indian Ocean lies
on the West.
Table 1‐1 Basic fact sheet of Katunayake‐Seeduwa Urban Council
Item Description
Province Western Province of Sri Lanka
District Gampaha
Local Authority Status Urban Council
Location in Relation to Katunayake‐Seeduwa is located North of Colombo City along the Colombo‐ Puttlam (A3) Highway
No. of Council Wards 12
No. of Council Members 9
No. of Villages 16
No. of Dwellings 8, 156
Population UC record (2012 statistics) 59, 281
(275)

The data collection survey of solid waste management in Sri Lanka Main Report‐ Katunayake‐Seeduwa Urban Council
2
2 Waste Generation Survey (WGS)
In order to obtain general information on waste generation amounts, the data available at waste
management section of the Health Department, Works Department and Revenue Department of
KSUC was used. Some of the data was available in the form of formal records and reports which
were treated as the most precise secondary data while the data collected from official interviews
with KSUC officers was treated as verification data. Thus, the survey data was collected through
different methods;
a) Recording and compiling of published and verified data by KSUC,
b) Reading and recording of unpublished & non‐confidential data available at KSUC,
c) Recording and official statistics available at Katunayake‐Seeduwa Divisional Secretariat office,
and
d) Official person‐to‐person interview with relevant officers at KSUC for verification of data.
The numerical data was collected as specified in following Table 2‐1.
Table 2‐1 Type of data collected for WGS in Katunayake‐Seeduwa UC
Source Description
Household Each number of following category households was surveyed;1) High income level, 2) Middle income level and 3) Low income level.
Commercial Each number of following category restaurants was surveyed;1) Large size restaurants, 2) Middle size restaurants and 3) Small size restaurants. Each number of following category shops was surveyed; 1)Organic shops (large) 2)Organic shops (middle) 3)Organic shops (small) 4)Non‐Organic shops (large) 5)Non‐Organic shops (middle) 6)Non‐Organic shops (small)
Hotels Each number of following category hotels was surveyed;1) Large size hotels 2) Middle size hotels and 3) Small size hotels.
Markets Number of stalls and types
Institutions Each number of following institute was surveyed;1) Schools 2) Hospitals (government) 3) Hospitals (private) 4) Public office 5) Bank/private office 6) Buddhist temples 7) Hindu temples 8) Mosques 9) Churches 10) Navy/Police/ Army bases
(276)

The data collection survey of solid waste management in Sri Lanka Main Report‐ Katunayake‐Seeduwa Urban Council
3
Source Description
11) Others
Industries Wastes from any industries.
Other Public parks and other public facilities
Construction and demolition
Wastes originating from construction, rehabilitation and demolition activities, etc.
Hazardous (Special)
Management and collection of hazardous wastes originating from various sources, including household items
2.1 Waste Generation Survey Results
The records indicate that the total residential population within KSUC is 59, 281. The Katunayake‐
Seeduwa UC area consists of 16 Grama Niladari (GN) divisions as shown in below Table 2‐2 .
Table 2‐2 Population statistics of villages in KSUC area (Source: Census and statistics 2012)
GN name GN code Total population
Air Force Camp 150 2,733
Evariwatta 149 6,804
Kurana‐Katunayake West 142B 3,138
Kurana‐Katunayake North 142 2,701
Kurana‐Katunayake South 142A 1,814
Katunayaka North 143 2,177
Katunayaka Suth 143A 5,738
Liyanagemulla North 144A 5,898
Liyanagemulla South 144 4,824
Amandoluwa 148 8,538
Seeduwa 147 5,210
Mookalangamuwa West 145B 3,041
Mookalangamuwa East 145A 2,402
Bandarawatta East 145C 1,915
Bandarawatta West 145 4,127
Ambalammulla 146 2,400
As shown in following Table 2‐3, Katunayake‐Seeduwa UC own and control a number of public
properties and institutes.
Table 2‐3 Type and number of municipal establishment own by Katunayake‐Seeduwa UC
Type of public property No. of units
Libraries 3
Municipal parks 1
Play grounds 5
(277)

The data collection survey of solid waste management in Sri Lanka Main Report‐ Katunayake‐Seeduwa Urban Council
4
Type of public property No. of units
Cemetery 5
Fish markets 1
Meat stall/ markets 6
Pola premises 4
Community centres 3
Following Table 2‐4 shows the number of government and privet/non‐government establishments
within Katunayake‐Seeduwa UC.
Table 2‐4 Number of government and privet institutions within Katunayake‐Seeduwa UC
Type of institute No. of units
Schools 11
Hospitals 4
Privet Hospitals 2
Medical clinics 3
District Secretariat office 1
Divisional secretary offices 1
Post office 6
Other Government offices 44
Police stations 1
Higher education institutes 4
Banks 9
Buddhist temples 9
Hindu Kovils 15
A major portion of MSW is generated from commercial sector in the city. Following Table 2‐5 shows
the number of different commercial (business) establishments in KSUC area.
Table 2‐5 Types and number of business establishments in KSUC area
Type of business No of units Type of business No of units
Large size restaurants 14 Bakery 11
Middle size restaurants and 9 Lerner 3
Vegetable/ Fruit shops 31 Education center 4
Glossary shops 140 Filling station 2
Textile trading shops 15 Communications 22
Electrical equipment shops 25 Vehicle service stations 11
Furniture shops 13 Printing/press 3
Hardware shops 30 Office 31
Vehicle spare parts shops 23 Hostel 20
Vehicle repair garages 14 Funeral service 2
(278)

The data collection survey of solid waste management in Sri Lanka Main Report‐ Katunayake‐Seeduwa Urban Council
5
Type of business No of units Type of business No of units
Saw mills 7 Food Production 21
Vegetable sales shops 17 Guest house 9
Fruit sales shops 14 Lath works 13
Fish sales stalls 3 Auto A/C Repair 4
Meat sales stalls 4 Super market 6
Barber shops 18 Chemical Production 4
Pharmacy 10 Gas 7
Large size hotels 7 Grinding mills 5
Small size hotels 12 Production 8
Garments/ Tailoring 20 Plastic Factory 3
Furniture 13 Jewellery 5
Saw mills 7 Plastic sales Shops 25
Medical center 2 Book Shop 14
Farm shop 2 Studio 10
Bar 5 Optical 3
Engineering service 8 Cab Service 7
Race Spots 3
In addition, Katunayake‐Seeduwa UC own fleet of vehicles used for MSW service. Following Table
2‐6 shows a list of vehicles own by KSUC.
Table 2‐6 Type and number of vehicles own by KSUC
Type of vehicle Total
Four wheel Tractor & Trailers 09
Three‐wheel trucks 2
Handcarts 10
(279)

The data collection survey of solid waste management in Sri Lanka Main Report‐ Katunayake‐Seeduwa Urban Council
6
3 Public Opinion Survey (POS)
This Public Opinion Survey (POS) was commissioned to identify a range of household waste
management matters in relation to the household sector. Information on household waste
management practices and information on householders’ experiences with waste collection delivery
services was collected for the purpose of improving our understanding of householder’s experiences
and attitudes and also to better understand prevailing situation in householder’s point of view. The
purpose of this survey research included;
a. To collect information on public attitudes to the waste management and environment in
broader,
b. To value aspects of environmental health and protection,
c. To provide information on experiences with Local Authority’s waste management service
and,
d. To provide information on household waste management practices.
3.1 Public opinion survey methodology
The number of samples from Katunayake‐Seeduwa identified as 200 households, but size of the
sample increased to 202 during the implementation to increase the accuracy. The selection of
households and areas within Katunayake‐Seeduwa UC was done after a consultative discussion with
MSW section officers at KSUC and JICA expert team members.
The survey was executed by a team of university students who were trained about the questionnaire,
survey methodology and the data entering before dispatched to their respective fields. A senior
expertise took the leadership and continuously supervised the field survey. The selected households
were first educated about the survey, its main objectives and asked their cooperation before starting
the field survey. In addition business and institutes, large waste generators, hospitals recycling shops
and large public markets were also surveyed using appropriate questionnaires prepared in
consultation with JICA experts.
Table 3‐1 Category and number of samples for Public Opinion Survey
Category Survey Area Number of samples
High‐income households Liyanagemulla, Main Rd, Gama Meda Rd, Welabada Rd
46
Middle‐income Households Liyanagemulla, Mukalangamuwa, St. Joseph St, Seeduwa South, Ambalanmulla, Main Rd
59
Low‐income Households Bandarawatta, Mukalangamuwa, Main Road, Ambalanmulla, St. Joseph St
46
Businesses /Service organization Seeduwa, Ambalanmulla, Main Rd 42
Large waste generators 9
Markets 1
Recycling shops 1
Total 204
(280)

The data collection survey of solid waste management in Sri Lanka Main Report‐ Katunayake‐Seeduwa Urban Council
7
The questionnaires were available in all languages (English/Sinhala/Tamil); however the
questionnaire form was filled by the interviewer based on interviewees’ response. The collected
information was recorded in digital form using Microsoft Excel and reviewed for accuracy. The data
was analyzed in detail for different objectives that generate an overview of the survey.
3.2 Results of Public Opinion Survey
99% of the surveyed households are Sinhalese, with 1 % of Muslims. Data on the average
number of people per household and monthly income is set out in below Table 3‐2.
Table 3‐2 Average and standard deviation values of income and family size
Category Family size Income (Rs/month)
High 5.5 ± 5.0 184, 348 ± 151, 623
Middle 4.0 ± 1.2 75, 237 ± 125, 615
Low 4.5 ± 1.7 33, 957 ± 10, 681
No of workers Income (Rs/month)
Business 2.3 ± 1.3 927, 619 ± 733, 335
In Katunayake‐Seeduwa UC, 99 % of surveyed households are provided with a garbage
collection service, of which 93 % stated they use this service. Only 48 % of surveyed
households are “very satisfied” with present SWM service provision, while 33 % are
“somewhat satisfied”. About 19 % of surveyed households are either “not satisfied at all” or
“less than satisfied”.
Figure 3‐1 Method of garbage discharge by residence in KSUC area
Placing outside56%
Carrying to collection point8%
Carrying to collection truck32%
Other1%
Irrelevant3%
How is your garbage collected?
(281)

The data collection survey of solid waste management in Sri Lanka Main Report‐ Katunayake‐Seeduwa Urban Council
8
Households’ main methods of waste discharge are shown in Figure 3‐1. The most common
methods are discharging it outside their premises for house to house collection (56 %) and
carrying garbage to collection truck (32 %).
Only 26 % of surveyed households receive a daily garbage collection service, 30 % stated
that they received the service 2‐3 times/week and 20 % receive the service once in a week.
Similarly, 48% discharge their garbage daily, 12 % discharge their garbage 2‐3 times per
week, and 23 % as soon as it is generated.
In general, adult females handle waste in about 77 % of surveyed households.
As shown in Figure 3‐2, only 8 % of households separate their garbage into organic and
inorganic waste at the source of generation. Only 7 % of surveyed households are not/less
willing to cooperate with source separation for recycling. Rests of the household are very
much willing (74 %) and somewhat willing (11 %) to cooperate in source separated garbage
collection system.
Further, 70 % of surveyed households stated that there are recyclable collectors or someone
who comes to collect their reusable or recyclable materials. Hence, informal recycling
system is well established in Katunayake‐Seeduwa UC area.
Figure 3‐2 Willingness of residence for a source separated garbage collection system in Katunayake‐Seeduwa UC
Only 22 % of surveyed households use kitchen/garden waste for composting and used the
finished compost for their own garden.
Not many surveyed households (79 %) have ever discussed proper garbage discharge
methods at the community level.
85 % households stated that SWM awareness programmes are very necessary while 12 %
stated “somewhat necessary”. Only 3 % of surveyed households stated that awareness
campaigns are not necessary or not needed at all.
Very much willing74%
Somewhat willing11%
Less willing1%
Not willing6%
Doing already8%
Willingness to cooperate in separate garbage collection system
(282)

The data collection survey of solid waste management in Sri Lanka Main Report‐ Katunayake‐Seeduwa Urban Council
9
66 % of household do not like to pay for SWM service mainly because of the revenue tax
they paid for KSUC. The average WTP (willingness to pay) for improved SWM services is 64 ±
127 Rs/month per household.
Out of all surveyed households, 42 % stated that they sale/give‐off Glass & Bottle for
recycling and 56 % of residence sale/give‐off Plastics for recycling. Also, 28 % of household
sale/ give‐off can & metal for recycling. Cardboard and paper recycling were 28 % and 41 %
respectively.
(283)

The data collection survey of solid waste management in Sri Lanka Main Report‐ Katunayake‐Seeduwa Urban Council
10
4 Final disposal site survey (FDS)
4.1 Introduction the FDS of Katunayake‐Seeduwa UC
4.1.1 Survey Method
The data and information in this report were collected from various sources including published
reports, verified data from Katunayake‐Seeduwa Urban Council, Supervisor of Katunayake‐Seeduwa
Waste Disposal site and direct interview with workers at disposal site.
4.1.2 Target of Survey
The survey is focus on obtaining general information on waste receiving, handling, disposal, facility
management, environmental monitoring and legal adherences.
4.1.3 Data Sampling
The numerical data was collected as specified in following Table 4‐1.
Table 4‐1 Data collected during the final disposal site survey
Survey Items Method
1 Current condition of final disposal site and its surroundings
Disposal method and structure Records, visual observation
Soil‐covering Records, visual observation
Land owner Records
Residual area Records, visual observation
Leachate water Records, visual observation
Waste picker Records, visual observation, interview
Scattering waste, smoke, fire, offensive odour, animals and so on
Records, visual observation
2 Operation and Management of final disposal site
Environmental Protect License and Environmental Clearance
Record
Personnel Records, interview
Operation vehicles, their maintenances and drivers Records, interview
Weighbridge Records, interview
Waste collection data Records, interview
Supervisory method Records, interview
3 Waste amount to final disposal site (24 hours, 7 days) Records, Survey
4 Adverse impact near by residences Records, Survey
5 Implementation status of geological, topographic and EIA survey
for new final disposal site
Records, interview
6 Progress situation for new final disposal site Records, interview
7 Court case Records, interview
(284)

The data collection survey of solid waste management in Sri Lanka Main Report‐ Katunayake‐Seeduwa Urban Council
11
4.2 Current condition of final disposal site and its surroundings
4.2.1 Katunayake‐Seeduwa waste disposal site
Katunayake‐Seeduwa waste disposal site is one of the MSW dumpsite locate in a very sensitive
environmental setup which is at the edge of Negombo Lagoon. The Katunayake‐Seeduwa site is
situated approximately 2.5 km away from Katunayake‐Seeduwa city center. The site boarded to
Negombo Lagoon on the East and Colombo‐Katunayake Expressway on the West (Figure 4‐1 and
Figure 4‐2).
Figure 4‐1 Location of Katunayake‐Seeduwa dumpsite
Figure 4‐2 Katunayake‐Seeduwa dumpsite and environment around the dumpsite
(285)

The data collection survey of solid waste management in Sri Lanka Main Report‐ Katunayake‐Seeduwa Urban Council
12
4.2.2 History and evolution of the dumpsite
The available records showed the dumpsite was first started in early 90’s. Starting from 90’s, the
site was commonly shared by KSUC and few privet organizations such as Sri Lanka Airline catering
Service tec. The historical evolution of the dumpsite is illustrated in Figure 4‐3. As evident of
historical aria views and interviews with site workers, there was a large area covered with waste. At
the beginning, there were no roads into the site, therefore garbage was dumped along the access
road and temporarily service roads build during the expressway construction.
Historically, the area was paddy fields; however the agricultural practices were abundant due to
flood waters (induced by soil filling for expressway) and saltwater intrusion. The major portion of the
land belongs to Sri Lanka Land Reclamation & Development Corporation (SLLR&DC) with privately
own a minor portion.
Figure 4‐3 Historical evolution of Katunayake‐Seeduwa dumpsite
(286)

The data collection survey of solid waste management in Sri Lanka Main Report‐ Katunayake‐Seeduwa Urban Council
13
The access to the dumpsite was repaired and rebuilt during the expressway construction. This
include a overhead bridge on the Expressway and a temporally screen facing the expressway.
4.2.3 Management and authority of Katunayake‐Seeduwa Dumpsite
The dumpsite is operated and managed by the KSUC. The site has minimum infrastructure facilities,
therefore the dumping and control supervision of dumpsite are at minimal level.
4.2.4 Extend and landform
Final disposal site is located at Ambalanmulla, within Katunayake‐Seeduwa UC, at about 1 km away
from the A3 highway on its west. The extent of the final waste disposal site is 20 acres including a
small portion of privately own land. The closet proximity to residence is around 600 m from the site
except the single dwelling lies at the edge of the dumpsite. The Negombo Lagoon is approximately
500 m west to the site.
Figure 4‐4 Katunayake‐Seeduwa dumpsite and environment within 500 m radius from center
Except the active dumping areas, surrounding area is covered with shrubs and wetland flora with
extensive growth of wetland plants (mangroves) on the vicinity. The landform is a flat terrain except
the areas where the waste has been dumped. However, the area is almost entirely surrounded by
standing waters in streams around the site.
(287)

The data collection survey of solid waste management in Sri Lanka Main Report‐ Katunayake‐Seeduwa Urban Council
14
4.2.5 Waste receiving and disposal
The existing dumpsite is commonly shared by several Local Authority and few privet organizations as
shown in following Table 4‐2 .
Table 4‐2 Sources and quantities of waste disposed at Katunayake‐Seeduwa MSW dumpsite
Date 4‐wheel tractor 3‐wheel truck MSW disposal Food waste picked up
(Loads) (Loads) (tonnes/day) (kg/day)
2/11/2015 23 6 58
3/11/2015 23 6 58
4/11/2015 21 4 53 250
5/11/2015 21 5 53 400
6/11/2015 23 6 58 400
7/11/2015 22 5 56 400
8/11/2015 9 4 23
The MSW disposal is approximately 53‐58 tonnes per day which is delivered by 9 tractors with 20‐23
trips. In addition, three‐wheeler trucks also deliver 4‐6 loads of waste per day.
A notable feature is that part of food & kitchen waste delivered to site is sorted out and picked up by
waste pickers as animal feed. The Katunayake‐Seeduwa area is popular for pig farming, and the
waste pickers collect approximately 400 kg of food waste per day.
4.3 Site infrastructure facilities
The Katunayake‐Seeduwa dumpsite has minimum site infrastructure facilities. Figure 4‐6 shows
dumpsite and environment around the dumpsite. A privately hired bulldozer is employed at the site
for waste handling (spreading).
Figure 4‐5 Bulldozer is employed for waste handling at KSUC dumpsite
(288)

The data collection survey of solid waste management in Sri Lanka Main Report‐ Katunayake‐Seeduwa Urban Council
15
Figure 4‐6 Activities and environment around KSUC dumpsite
(289)
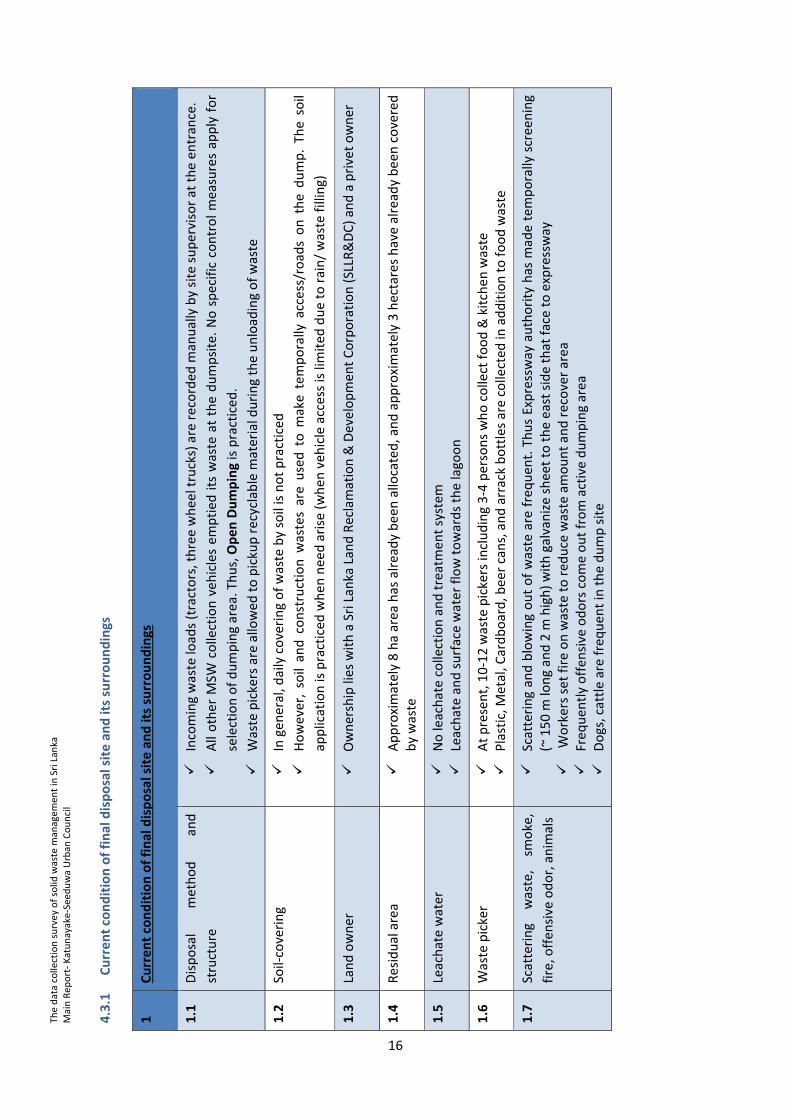
The data collection survey of solid
waste m
anagem
ent in Sri Lanka
Main Rep
ort‐ Katunayake‐Seed
uwa Urban
Council
16
4.3.1
Current condition of final disposal site and its surroundings
1
Current condition of final disposal site and its surroundings
1.1
Disposal
method
and
structure
Incoming waste loads (tractors, three wheel trucks) are recorded
manually by site supervisor at the en
trance.
All other M
SW collection veh
icles emptied
its waste at the dumpsite. No specific control measures apply for
selection of dumping area. Thus, Open Dumping is practiced.
Waste pickers are allowed
to pickup recyclable m
aterial during the unloading of waste
1.2
Soil‐covering
In general, daily covering of waste by soil is not practiced
However, soil and construction w
astes are used to m
ake temporally access/roads on the dump. Th
e soil
application is practiced
when
need arise (when
veh
icle access is limited
due to rain/ waste filling)
1.3
Land owner
Ownership lies with a Sri Lanka Land Reclamation & Developmen
t Corporation (SLLR&DC) and a privet owner
1.4
Residual area
Approximately 8 ha area
has already been
allocated, and approximately 3 hectares have already been
covered
by waste
1.5
Leachate water
No leachate collection and treatment system
Leachate and surface water flow towards the lagoon
1.6
Waste picker
At present, 10‐12 waste pickers including 3‐4 persons who collect food & kitchen waste
Plastic, M
etal, Cardboard, beer cans, and arrack bottles are collected
in addition to food waste
1.7
Scattering
waste,
smoke,
fire, offen
sive odor, anim
als
Scattering and blowing out of waste are frequen
t. Thus Expressway authority has m
ade temporally screen
ing
(~ 150 m
long and 2 m
high) with galvanize sheet to the east side that face to expressway
W
orkers set fire on waste to red
uce waste amount and recover area
Freq
uently offen
sive odors come out from active dumping area
Dogs, cattle are frequen
t in the dump site
(290)

The data collection survey of solid
waste m
anagem
ent in Sri Lanka
Main Rep
ort‐ Katunayake‐Seed
uwa Urban
Council
17
4.3.2
Operation and M
anagement of final disposal site
2
Operation and M
anagement of final disposal site
2.1
Environmental
Protect
License
and
Environmental Clearance
None
2.2
Personnel
1‐Site supervisor
2.3
Operation vehicles, their maintenances
and
drivers
1 bulldozer (CAT D4) is hired
and dispatched
by KSU
C for waste spreading. The bulldozer
works 6 hours per day on average
2.4
Weighbridge
None
2.5
Waste collection data
Daily record is available (manual recording of vehicle number)
2.6
Supervisory m
ethod
Gen
eral planning and supervision come under Chief‐PHI of KSU
C.
Site supervisor is responsible for daily operations and veh
icle entry recording
3.0
Waste amount to final disposal site (24 hours, 7
days)
A summary is shown in
Table 4‐2
4.0
Adverse im
pact nearby residen
ces
Odor and smoke are the man
nuisance for residen
ce around the dumpsite
Then
, the irritation caused by waste collection veh
icles is also a problem for nearby
residen
ce along the road
5.0
Implemen
tation
status
of
geological,
topographic and EIA survey for
new final
disposal site
There is a proposal to construct a compost plant at the site by a privet company; Holcim
Cem
ent Pvt Ltd. H
owever the proposal w
as abundant due to unsuitable soil form
ation/
ground condition beneath the dumpsite.
6.0
Progress situation for new
final disposal site
None
7.0
Court case
None
(291)

Annex
KATUNAYAKE SEEDUWA URBAN COUNCIL
(292)

Response to Public Opinion Survey for Household Katunayake Seeduwa UC
Page 1 of 7
Response to Public Opinion Survey for Household
Sinhala
99%
Muslim
1%
Tamil
0% Other0%
Ethnicity
Buddhist
35%
Islam
1%
Hindu0%
Christian
64%
Other
0%
Religion
Garbage collection
86%
Storm
water13%
Water
supply1%
Please specify the priority for your daily life regarding the improvement of the following
aspects?
Yes
99%
No
1%
Are there garbage collection services in your area?
Yes
93%
No
7%
Do you use these services?
Placing
outside56%
Caring to collection point
8%
Caring to
collection truck32%
Other1%
Irrelevant
3%
How is your garbage collected?
Placing
outside56%
Carrying
to collection
point8%
Carrying
to collection
truck32%
Other
1%
Irrelevant
3%
How is your garbage collected?
(293)
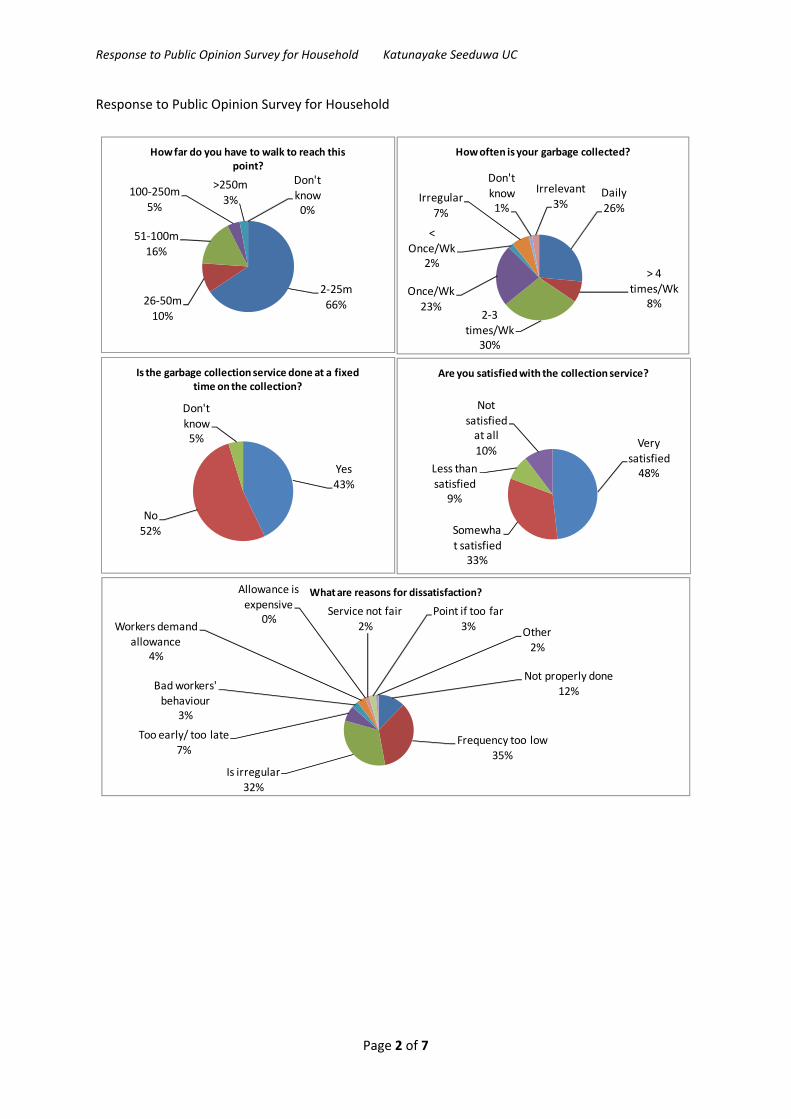
Response to Public Opinion Survey for Household Katunayake Seeduwa UC
Page 2 of 7
Response to Public Opinion Survey for Household
2‐25m
66%26‐50m10%
51‐100m
16%
100‐250m
5%
>250m
3%
Don't know0%
How far do you have to walk to reach this point?
Daily
26%
> 4 times/Wk
8%2‐3
times/Wk30%
Once/Wk
23%
< Once/Wk
2%
Irregular
7%
Don't
know1%
Irrelevant3%
How often is your garbage collected?
Yes43%
No52%
Don't
know5%
Is the garbage collection service done at a fixed time on the collection?
Very
satisfied48%
Somewha
t satisfied33%
Less than satisfied
9%
Not
satisfied at all
10%
Are you satisfied with the collection service?
Not properly done
12%
Frequency too low
35%
Is irregular
32%
Too early/ too late
7%
Bad workers'
behaviour3%
Workers demand
allowance4%
Allowance is
expensive0%
Service not fair
2%
Point if too far
3% Other
2%
What are reasons for dissatisfaction?
(294)

Response to Public Opinion Survey for Household Katunayake Seeduwa UC
Page 3 of 7
Response to Public Opinion Survey for Household
Yes18%
No82%
Have you ever complained about the garbage collection service to the authorities in the last
three years?
Yes
67%
No
33%
Do you want to receive a garbage collection service? (only for persons who do not have garbage collection services in the area)
Discharge outside22%
Specific place
11%
Open dump4%
Request a collection
truck0%
Self‐dispose
24%
Composting7%
Give for recycling
1%
Other (collection
truck/ common bin)31%
How do you dispose off garbage generated in your premises?
As soon as23%
Once daily48%
Once 2‐3 days12%
Less frequent17%
How often do you dispose off garbage generated in your premises?
Adult
male19%
Adult
female77%
Servant3%
Other1%
Who mainly handles wastes at home?
(295)

Response to Public Opinion Survey for Household Katunayake Seeduwa UC
Page 4 of 7
Response to Public Opinion Survey for Household
Very much willing74%
Somewhat willing11%
Less willing1%
Not
willing6%
Doing already8%
Willingness to cooperate in separate garbage collection system
Reduce landfill amount25%
Protect environm
ent57%
Can earn money4%
Others14%
If you are willing to cooperate, why do you think recycling is important?
Yes70%
No27%
Don't know3%
Is there someone who comes around to collect or buy your reusable or recyclable materials?
Yes8%
No92%
Do you take for recyclable materials to shops for refund or sale?
Yes
22%
No78%
Are you using kitchen/garden waste for composting?
< Half32%
Half14%> Half
4%
All50%
If you do composting, how much of kitchen waste used for composting?
(296)
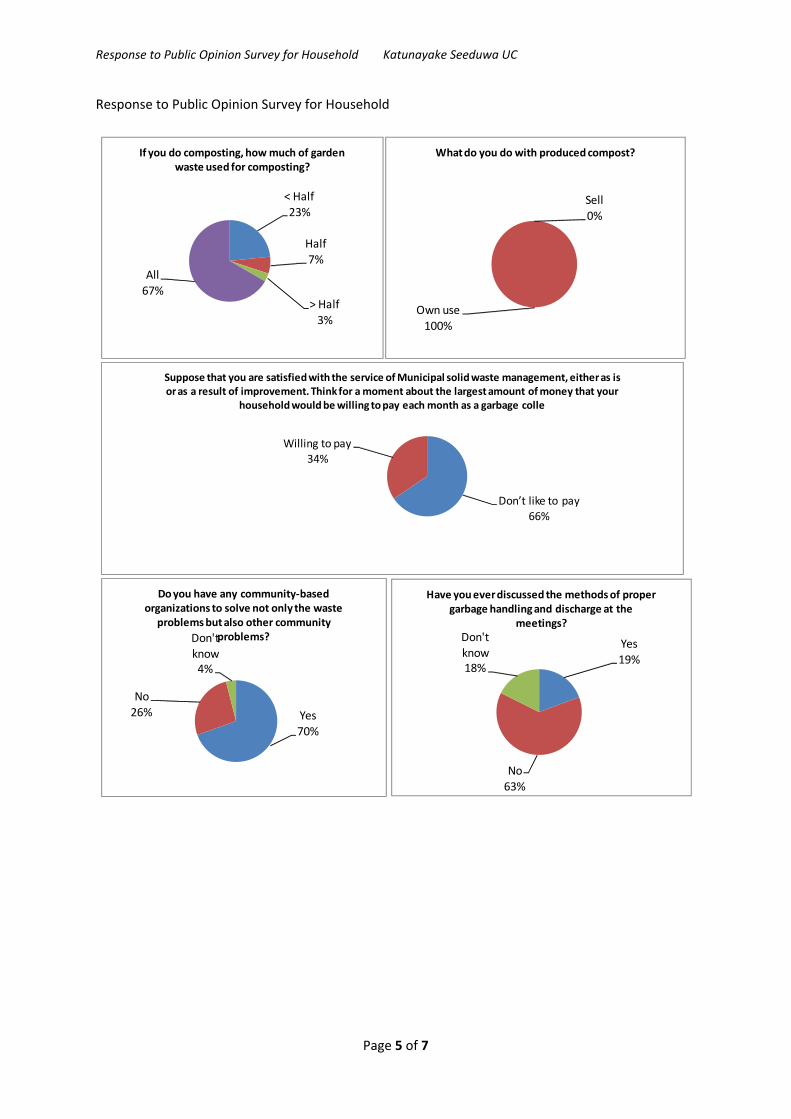
Response to Public Opinion Survey for Household Katunayake Seeduwa UC
Page 5 of 7
Response to Public Opinion Survey for Household
< Half23%
Half
7%
> Half
3%
All
67%
If you do composting, how much of garden waste used for composting?
Sell
0%
Own use
100%
What do you do with produced compost?
Don’t like to pay
66%
Willing to pay34%
Suppose that you are satisfied with the service of Municipal solid waste management, either as is or as a result of improvement. Think for a moment about the largest amount of money that your
household would be willing to pay each month as a garbage colle
Yes
70%
No
26%
Don't know4%
Do you have any community‐based organizations to solve not only the waste
problems but also other community problems?
Yes
19%
No63%
Don't know18%
Have you ever discussed the methods of proper garbage handling and discharge at the
meetings?
(297)

Response to Public Opinion Survey for Household Katunayake Seeduwa UC
Page 6 of 7
Response to Public Opinion Survey for Household
Yes42%
No58%
Have you ever been taught method of proper garbage handling &
disposal? Parents15% Commun
ity10%
School8%
Local Gov.22%
Central Gov.1%
NGOs
0%
Others44%
If you have learned , who taught proper garbage handling methods?
Very necessary
85%
Somewhat
necessary12%
Not very necessary
3%
Not necessary at all0%
Do you think a campaign to raise awareness of people for maintaining the cleaner city and
environment is necessary?
(298)

Dehiwala Mt. Lavinia MC 1.10
(299)この前に合紙 この前に合紙

The data collection survey of solid waste management in Sri Lanka Main Report‐ Dehiwala Mt. Lavinia Municipal Council
i
Table of content
1 Introduction .................................................................................................................................... 1
1.1 Background conditions of Dehiwala Mt. Lavinia Municipal Council ....................................... 1
2 Waste Composition Survey (WCS) .................................................................................................. 4
2.1 Methods of waste composition Survey .................................................................................. 4
2.1.1 Classification of Wastes at Disposal Facility .................................................................... 4
2.1.2 Sampling frequency ........................................................................................................ 4
2.1.3 Bulk‐Sampling for WCS ................................................................................................... 4
2.1.4 Measurement of physical composition........................................................................... 6
2.2 Waste composition survey results .......................................................................................... 8
2.2.1 Results of chemical composition survey ......................................................................... 9
3 Waste Generation Survey (WGS) .................................................................................................. 11
3.1 Waste Generation Survey Results ......................................................................................... 12
4 Public Opinion Survey (POS) ......................................................................................................... 17
4.1 Public opinion survey methodology ..................................................................................... 17
4.2 Results of Public Opinion Survey .......................................................................................... 18
(300)

The data collection survey of solid waste management in Sri Lanka Main Report‐ Dehiwala Mt. Lavinia Municipal Council
ii
List of Tables
Table 2‐1 Summary results of MSW physical composition survey in Dehiwala Mt. Lavinia MC ............ 8
Table 3‐1 Type of data collected for WGS in Dehiwala Mt. Lavinia MC ............................................... 11
Table 3‐2 Household population (GN level) within Dehiwala Mt. Lavinia MC area ............................. 12
Table 3‐3 Type and number of municipal establishment own by Dehiwala Mt. Lavinia MC ............... 12
Table 3‐4 Number of government and privet institutions within Dehiwala Mt. Lavinia MC ............... 13
Table 3‐5 Type and number of business premises in DMMC area ....................................................... 14
Table 3‐6 Number of business and non‐business premises in each ward of DMMC area ................... 16
Table 4‐1 Category and number of samples for Public Opinion Survey ............................................... 17
Table 4‐2 Average and standard deviation values of income and family size ...................................... 18
(301)

The data collection survey of solid waste management in Sri Lanka Main Report‐ Dehiwala Mt. Lavinia Municipal Council
iii
List of Figures
Figure 1‐1 A map of Dehiwala Mt Lavinia Municipality area .................................................................. 2
Figure 2‐1 Sampling for WCS at DMMC, (a) manually unloading the profile sample and (b) unloaded
sample ..................................................................................................................................................... 4
Figure 2‐2 Particle size reduction, mixing and preparation of working sample by coning & quartering
technique ................................................................................................................................................ 5
Figure 2‐3 Procedure of analysis of physical composition ...................................................................... 6
Figure 2‐4 Dried waste samples at laboratory is ready for sealed packing after water content analysis
................................................................................................................................................................ 7
Figure 2‐5 Average physical composition of MSW in Dehiwala Mt. Lavinia MC .................................... 9
Figure 4‐1 Method of garbage discharge by residence in MMC area .................................................. 18
Figure 4‐2 Willingness of residence for a source separated garbage collection system in Dehiwala Mt.
Lavinia MC ............................................................................................................................................. 19
(302)
The data collection survey of solid waste management in Sri Lanka Main Report‐ Dehiwala Mt. Lavinia Municipal Council
1
1 Introduction
The purpose of this survey is to obtain the current data regarding Solid Waste Management (SWM)
at Dehiwala Mt. Lavinia Municipal Council (DMMC). The data collection survey was conducted from
19th October to 23rd October, 2015 by a team of expert dispatched by Waste To Energy Technologies
Limited.
This report consists of brief summaries of survey methods and results. The additional primary data
and records are available as soft copies. The preliminary data collection was conducted through four
comprehensive surveys which are;
i. Waste Composition Survey (WCS) is to gather information on Physical Composition of MSW
collected by DMMC.
ii. Waste Generation Survey (WGS) is to gather information on waste generation sources at
DMMC based on secondary data available at DMMC and other relevant organizations.
iii. Public Opinion Survey (POS) is gather information on public opinion on current waste
management in DMMC. The POS was conducted through a questionnaire survey that covers
different types of waste generators in the DMMC area.
iv. Final Disposal Site Survey (FDSS) is to collection data on final MSW disposal site of MMC
based on secondary data as well as field recordings & visits to the site. DMMC commonly
shares Karadiyana final disposal facility which is discussed in “Data collection Survey
Report‐ Moratuwa MC”.
1.1 Background conditions of Dehiwala Mt. Lavinia Municipal Council
Dehiwala Mount Lavinia Municipal (DMMC) is the second largest Municipality in Sri Lanka, and
covers an extent of 2, 109 hectaretares. It lies south of the Colombo Municipal Council area and
separated from it by the Dehiwala canal which forms the northern boundary of DMMC. Its southern
limits lie in Borupana Road and the eastern boundary is Weras Ganga with its canal system and
including some areas to its east (Pepiliyana, Gangodawila and Kohuwala).
As shown in Figure 1‐1, DMMC is composed of 29 wards whose extents vary from 29 hectares
(Galkissa) the smallest and the largest 305.6 hectares (Kandawala).
Dehiwela, Mount Lavinia attained Municipal status in December 1959. An area map of 1937 shows
Dehiwela Mount Lavinia as a Local body of 6 wards extending over a land extent of only 16.3 sq. Km
(1, 630 hectares). Due to rapid urban growth and for administrative reasons this area was extended
and divided into 19 wards in 1959 and given Municipal status. Later in 1967, the Municipal area of
approximately 2, 109 hectare was apportioned into 29 wards as it exists today.
As the DMMC area lies on the coastal plain the land is mostly flat and undulating towards the inland
areas to MSL 30. Soils are made of red yellow podozols (Laterite) and Regosols with low Humic Gleys
in valleys and stream beds. A significant feature is the large extent of wet lands around the Weras
Ganga (river) and Bolgoda Lake the two major water bodies. The Bellanwila and Attidiya marshes are
noteworthy for their bio‐diversity and as such are considered as an Ecological protected zone. Lying
(303)

The data collection survey of solid waste management in Sri Lanka Main Report‐ Dehiwala Mt. Lavinia Municipal Council
2
in the wet zone, the DMMC area receives an average annual rainfall between 2000 to 3000 mm
mainly during the south west monsoon and the inter‐monsoon periods. Mean average day
temperature is around 28°c and average maximum between 30.5 to 31°c Minimum night
temperature varies from 26°c to 27°c.
Figure 1‐1 A map of Dehiwala Mt Lavinia Municipality area
Dehiwela Mount Lavinia and Sri Jayawardenapura Kotte being two large suburban centers of the city
of Colombo function together as one large urban agglomeration in the Region (Western Province).
(304)

The data collection survey of solid waste management in Sri Lanka Main Report‐ Dehiwala Mt. Lavinia Municipal Council
3
The overspill from the City in residential and commercial uses of land has rapidly urbanized these
suburban centers. Dehiwela Mount Lavinia MC (DMMC) and Sri Jayawardenpaura MC (SDMMC)
along with Colombo MC (CMC) form the most urbanized part of the core area of the Colombo
Metropolitan Region (CMR). In the hierarchy of towns in the CMR, DMMC ranks 2nd next to the
capital city (CMC). This is an indication of the status of the MC in terms of its service functions in the
region. A good road network and transport system links it to the rest of the region and other parts
the country.
The lands in the city of Dehiwela Mount Lavinia are predominantly in mixed residential uses. The
properties along main highways (Galle Road) and Dehiwela ‐ Nugegoda roads are almost entirely
used for commercial activities. A few public institutions and industries are interspersed in the ribbon
development as characteristic of the urban places in Sri Lanka.
Dehiwela Mt. Lavinia MC area is a place where a great deal of commercial and trade activities take
place. The town, being part of the large urban agglomeration, the Greater Colombo Area, it has
accommodated the expansion of commercial activities of the country’s capital city. Many large scale
industries are also found in Ratmalana/Attidiya areas to the South of the town. Tourism and the
Hotel Trade are other significant economic activities.
(305)

The data collection survey of solid waste management in Sri Lanka Main Report‐ Dehiwala Mt. Lavinia Municipal Council
4
2 Waste Composition Survey (WCS)
The primary purpose of this survey is to ensure a standard approach to waste physical composition
analysis for the purposes of understanding the composition of waste delivered to final disposal
facility which was collected from DMMC area. Information generated by WCAs will be useful to
DMMC as well as administrators/policy makers to improve the efficiency and overall effectiveness of
waste management systems.
All the MSW collected within DMMC is disposed off at the Karadiyama MSW dumpsite. Thus, the
WCS survey was conducted at Karadiyana dumpsite.
2.1 Methods of waste composition Survey
2.1.1 Classification of Wastes at Disposal Facility
This study was conducted to assess the physical composition of MSW samples collected from DMMC
and delivered to the final disposal facility by collection vehicles.
2.1.2 Sampling frequency
The WCA was carried out for a full waste collection cycle starting from Monday (15th October 2015)
to Sunday (21st October 2015).
2.1.3 Bulk‐Sampling for WCS
An effective WCA programme must be based on waste samples that are representative of the target
area as a whole (usually a whole local authority), be sufficient to take account of variation in waste
arising whilst also being affordable within the project budget. A good sampling strategy is essential
to achieving this difficult balance. Thus it is needed to ensure that a ‘good’ sample is obtained within
the constraints of time and cost.
Figure 2‐1 Sampling for WCS at DMMC, (a) manually unloading the profile sample and (b) unloaded sample
(306)
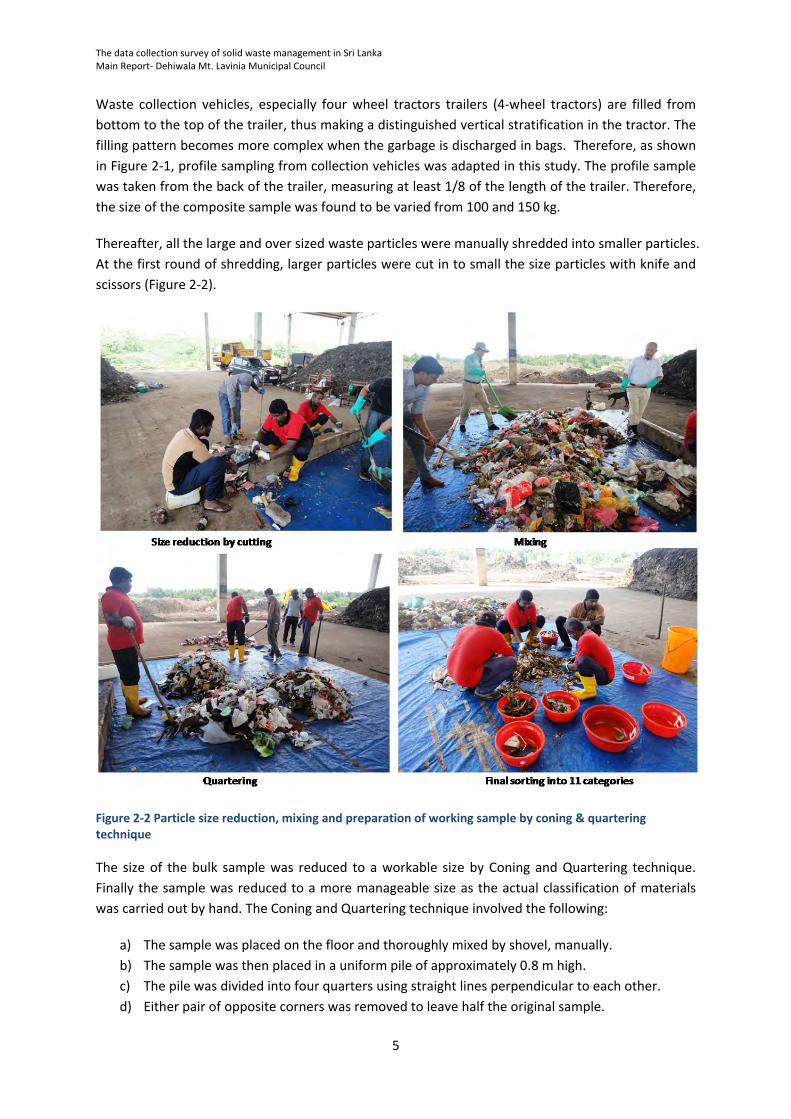
The data collection survey of solid waste management in Sri Lanka Main Report‐ Dehiwala Mt. Lavinia Municipal Council
5
Waste collection vehicles, especially four wheel tractors trailers (4‐wheel tractors) are filled from
bottom to the top of the trailer, thus making a distinguished vertical stratification in the tractor. The
filling pattern becomes more complex when the garbage is discharged in bags. Therefore, as shown
in Figure 2‐1, profile sampling from collection vehicles was adapted in this study. The profile sample
was taken from the back of the trailer, measuring at least 1/8 of the length of the trailer. Therefore,
the size of the composite sample was found to be varied from 100 and 150 kg.
Thereafter, all the large and over sized waste particles were manually shredded into smaller particles.
At the first round of shredding, larger particles were cut in to small the size particles with knife and
scissors (Figure 2‐2).
Figure 2‐2 Particle size reduction, mixing and preparation of working sample by coning & quartering technique
The size of the bulk sample was reduced to a workable size by Coning and Quartering technique.
Finally the sample was reduced to a more manageable size as the actual classification of materials
was carried out by hand. The Coning and Quartering technique involved the following:
a) The sample was placed on the floor and thoroughly mixed by shovel, manually.
b) The sample was then placed in a uniform pile of approximately 0.8 m high.
c) The pile was divided into four quarters using straight lines perpendicular to each other.
d) Either pair of opposite corners was removed to leave half the original sample.
(307)

The data collection survey of solid waste management in Sri Lanka Main Report‐ Dehiwala Mt. Lavinia Municipal Council
6
e) The process was repeated three times until the desired sample was obtained.
2.1.4 Measurement of physical composition
2.1.4.1 Specific gravity of waste
To measure the bulk density of a sample, the following procedure was followed:
a) Weighed and recorded a volumetrically celebrated bucket of known volume (50 L)
b) Poured the sample into the bucket until it was overflowing
c) Settled the contents of the bucket by dropping it three times from a height of 10 cm
d) After settling the waste, waste‐filled bucket volume was measured
e) Weight the bucket and its contents was recorded
f) The bulk density was estimated by dividing the waste weight by filled volume, as kg/ m3.
Figure 2‐3 Procedure of analysis of physical composition
2.1.4.2 Physical composition analysis procedure
Once the sample size was determined and a reduced or workable sample was obtained, the
following procedure was carried out.
a) Sorted reduced sample and pick out larger items first e.g. glass, paper, plastics.
(308)

The data collection survey of solid waste management in Sri Lanka Main Report‐ Dehiwala Mt. Lavinia Municipal Council
7
b) Separated waste into following categories,
i. Kitchen waste
ii. Paper
iii. Textiles
iv. Grass & Wood
v. Soft Plastic
vi. Hard Plastic
vii. Rubber & leather
viii. Metals
ix. Glass
x. Stones & Ceramics
xi. Others
c) Weighed the separated waste using an accurate top loading balance and recorded on
standard form
d) Any remaining material which did not fall into any of prescribed categories was passed
through a 4 mm mesh sieve and classified as ‘components smaller than 4 mm mesh’.
2.1.4.3 Chemical Waste Composition analysis procedure
Three components analysis for the category from I to VII shown above was carried out in two steps.
First fresh samples were immediately transported to Environmental Engineering Laboratory at
University of Dehiwala Mt. Lavinia which was a 10 minutes drive from the Karadiyana site. Then
samples were immediately placed in an oven and dried at 80 ‐100 °C for 48 hours to estimate water
content.
Figure 2‐4 Dried waste samples at laboratory is ready for sealed packing after water content analysis
Thereafter, dried samples were transported to Solid Waste Management Research Unit of University
of Peradeniya for analysis of;
Ash content
Volatile solid content
C/N ratio analysis (only for category from I and IV)
(309)

The data collection survey of solid waste management in Sri Lanka Main Report‐ Dehiwala Mt. Lavinia Municipal Council
8
2.2 Waste composition survey results
A summary of the results of the waste composition survey conducted in DMMC are tabulated below.
Table 2‐1 Summary results of MSW physical composition survey in Dehiwala Mt. Lavinia MC
Sample BD KW PP TEX GR S‐PL H‐PL R&L ME GL ST OTH
Date Percentage (%)
15/10 Sam‐1 404.8 35.7 8.5 7.6 22.7 12.0 3.5 0.3 1.4 2.5 5.9 0.2
Sam‐2 335.2 52.2 19.4 4.7 8.6 9.4 0.5 1.7 0.4 0.8 2.2 0.1
16/10 Sam‐1 366.3 45.4 17.3 4.4 14.3 12.4 1.6 0.1 0.7 2.7 0.9 0.1
Sam‐2 371.8 65.6 7.6 0.8 16.2 8.0 1.1 0.1 0.2 0.4 0.0 0.0
17/10 Sam‐1 414.5 44.5 11.5 5.7 26.9 8.6 0.8 0.3 0.5 0.4 0.8 0.0
Sam‐2 436.0 65.0 7.3 3.0 7.2 10.4 0.6 0.1 0.7 1.9 3.6 0.2
18/10 Sam‐1 353.7 77.6 5.6 4.9 8.7 3.0 0.0 0.0 0.1 0.1 0.0 0.0
Sam‐2 403.4 55.4 9.8 2.5 20.8 7.9 0.9 1.5 0.4 0.8 0.0 0.1
Sam‐3 443.8 70.0 10.3 0.7 3.6 13.6 0.6 0.0 0.5 0.3 0.4 0.0
19/10 Sam‐1 366.3 35.5 21.7 11.7 11.8 10.7 2.5 1.8 1.3 0.5 1.9 0.6
Sam‐2 440.8 41.0 10.5 2.1 22.6 6.1 1.8 1.4 0.3 0.5 13.6 0.0
20/10 Sam‐1 588.9 62.2 13.1 3.4 8.3 8.7 1.4 0.7 0.6 1.1 0.5 0.1
Sam‐2 366.3 53.3 11.8 1.5 21.7 4.6 1.2 0.3 0.8 0.9 3.9 0.0
21/10 Sam‐1 261.6 53.3 14.5 6.4 6.2 11.8 1.3 0.4 1.8 4.0 0.0 0.3
Sam‐2 326.1 31.5 34.6 5.4 11.4 10.1 2.6 0.1 0.8 1.7 1.5 0.3
Average 392.0 52.5 13.6 4.3 14.1 9.1 1.4 0.6 0.7 1.2 2.3 0.1
Stranded Deviation 73.2 13.7 7.4 2.9 7.3 2.9 0.9 0.7 0.5 1.1 3.6 0.2
Mean Error 18.9 3.5 1.9 0.8 1.9 0.8 0.2 0.2 0.1 0.3 0.9 0.0
Median 371.8 53.3 11.5 4.4 11.8 9.4 1.2 0.3 0.6 0.8 0.9 0.1
BD‐ Bulk density (kg m‐3), KW‐ Kitchen waste, PP‐ Paper, TEX‐ Textile, GR‐Grass & wood, S‐Pl‐ Soft plastics, H‐PL‐ Hard plastics, R&L‐ Rubber & leather, ME‐ Metal, GL‐ Blass & bottles, ST‐ Stones & ceramics, OTH‐ Other
The analysis showed that the amount of food & kitchen waste is the highest portion (31.5‐ 77.6 %).
However, the amount of garden waste in the collection is comparatively low which ranged from
3.6 % to 26.9 %. Another notable feature is the very low amount of stones & ceramics (0.0 – 13.6 %).
The average waste composition derived from the 15 samples is shown in Figure 2‐5.
(310)

The data collection survey of solid waste management in Sri Lanka Main Report‐ Dehiwala Mt. Lavinia Municipal Council
9
Figure 2‐5 Average physical composition of MSW in Dehiwala Mt. Lavinia MC
The above figures shows that collected waste are suitable for composting. However, it is noted that
mixed waste collected from commercial areas contain some industrial (ink, paints, electronic waste
etc.) as well as hazardous waste (medical waste, chemicals etc.) in small quantities. Therefore,
precautions should be made to segregate such types of hazardous waste at the source.
It also showed that the percentages of more profitable recyclable materials (hard plastic, metal, and
glass) are reasonably low (0.7 – 1.4 %), while the percentages of less profitable materials (paper, soft
plastic, textile) are much higher (9.1 – 13.6 %).
2.2.1 Results of chemical composition survey
A summary of chemical composition survey is shown in following table.
Date Type MC VS C N C:N
Percentage (%) Ratio
16/10/2015 Mixed waste‐ S1 52.2%
19/10/2015 Mixed waste‐ S2 55.8%
20/10/2015 Mixed waste‐ S3 43.5%
Average 50.5%
16/10/2015 Kitchen waste‐S1 61.2% 72.3% 40.2% 2.4% 16.8
19/10/2015 Kitchen waste‐S2 68.9% 74.6% 41.4% 1.6% 26.4
20/10/2015 Kitchen waste‐S3 64.6% 82.0% 45.6% 1.4% 32.7
Average 64.9% 76.3% 42.4% 1.8% 25.3
(311)
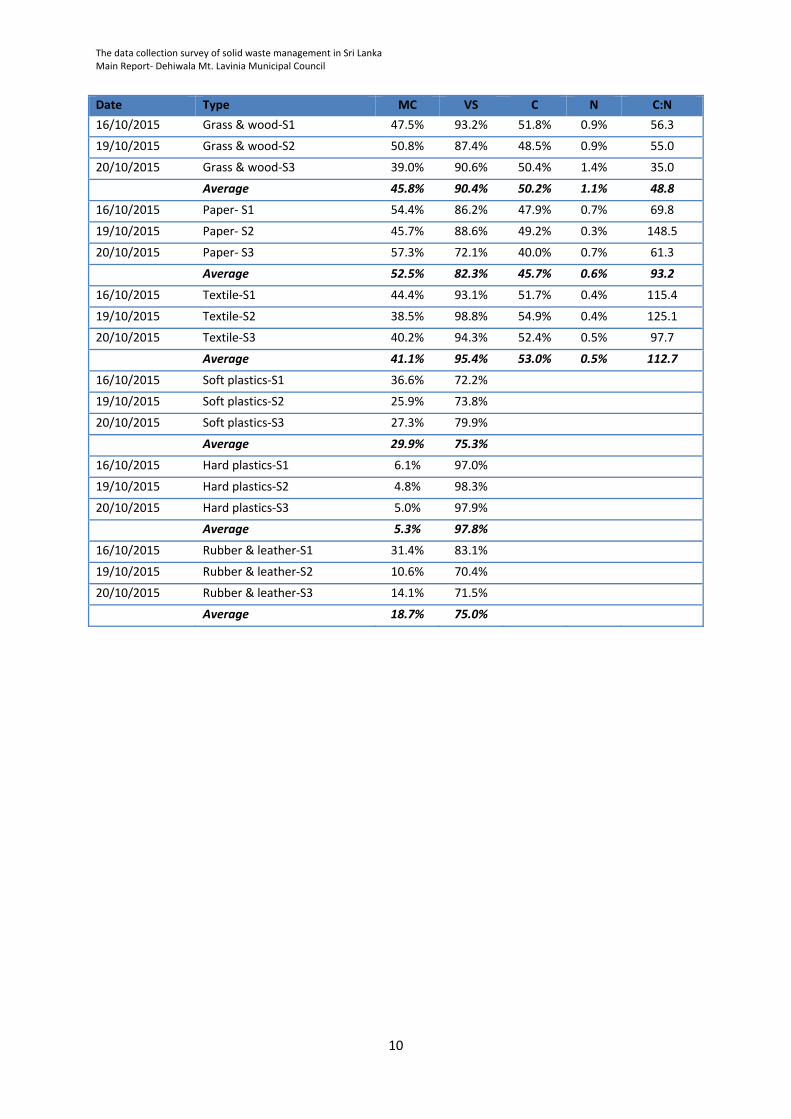
The data collection survey of solid waste management in Sri Lanka Main Report‐ Dehiwala Mt. Lavinia Municipal Council
10
Date Type MC VS C N C:N
16/10/2015 Grass & wood‐S1 47.5% 93.2% 51.8% 0.9% 56.3
19/10/2015 Grass & wood‐S2 50.8% 87.4% 48.5% 0.9% 55.0
20/10/2015 Grass & wood‐S3 39.0% 90.6% 50.4% 1.4% 35.0
Average 45.8% 90.4% 50.2% 1.1% 48.8
16/10/2015 Paper‐ S1 54.4% 86.2% 47.9% 0.7% 69.8
19/10/2015 Paper‐ S2 45.7% 88.6% 49.2% 0.3% 148.5
20/10/2015 Paper‐ S3 57.3% 72.1% 40.0% 0.7% 61.3
Average 52.5% 82.3% 45.7% 0.6% 93.2
16/10/2015 Textile‐S1 44.4% 93.1% 51.7% 0.4% 115.4
19/10/2015 Textile‐S2 38.5% 98.8% 54.9% 0.4% 125.1
20/10/2015 Textile‐S3 40.2% 94.3% 52.4% 0.5% 97.7
Average 41.1% 95.4% 53.0% 0.5% 112.7
16/10/2015 Soft plastics‐S1 36.6% 72.2%
19/10/2015 Soft plastics‐S2 25.9% 73.8%
20/10/2015 Soft plastics‐S3 27.3% 79.9%
Average 29.9% 75.3%
16/10/2015 Hard plastics‐S1 6.1% 97.0%
19/10/2015 Hard plastics‐S2 4.8% 98.3%
20/10/2015 Hard plastics‐S3 5.0% 97.9%
Average 5.3% 97.8%
16/10/2015 Rubber & leather‐S1 31.4% 83.1%
19/10/2015 Rubber & leather‐S2 10.6% 70.4%
20/10/2015 Rubber & leather‐S3 14.1% 71.5%
Average 18.7% 75.0%
(312)

The data collection survey of solid waste management in Sri Lanka Main Report‐ Dehiwala Mt. Lavinia Municipal Council
11
3 Waste Generation Survey (WGS)
In order to obtain general information on waste generation amounts, the data available at Waste
Management Section, Works Department and Revenue Department of DMMC was used. Some of
the data was available in the form of formal records and reports which were treated as the most
precise secondary data while the data collected from official interviews with DMMC officers was
treated as verification data. Thus, the survey data was collected through different methods;
a) Recording and compiling of published and verified data by DMMC,
b) Reading and recording of unpublished & non‐confidential data available at DMMC,
c) Recording and official statistics available at District Secretariat, Dehiwala Mt. Lavinia, and
d) Official person‐to‐person interview with relevant officers at DMMC for verification of data.
The numerical data was collected as specified in following Table 3‐1.
Table 3‐1 Type of data collected for WGS in Dehiwala Mt. Lavinia MC
Source Description
Household Each number of following category households was surveyed;1) High income level, 2) Middle income level and 3) Low income level.
Commercial Each number of following category restaurants was surveyed;1) Large size restaurants, 2) Middle size restaurants and 3) Small size restaurants. Each number of following category shops was surveyed; 1)Organic shops (large) 2)Organic shops (middle) 3)Organic shops (small) 4)Non‐Organic shops (large) 5)Non‐Organic shops (middle) 6)Non‐Organic shops (small)
Hotels Each number of following category hotels was surveyed;1) Large size hotels 2) Middle size hotels and 3) Small size hotels.
Markets Number of stalls and types
Institutions Each number of following institute was surveyed;1) Schools 2) Hospitals (government) 3) Hospitals (private) 4) Public office 5) Bank/private office 6) Buddhist temples 7) Hindu temples 8) Mosques 9) Churches 10) Navy/Police/ Army bases 11) Others
Industries Wastes from any industries.
(313)

The data collection survey of solid waste management in Sri Lanka Main Report‐ Dehiwala Mt. Lavinia Municipal Council
12
Source Description
Other Public parks and other public facilities
Construction and demolition
Wastes originating from construction, rehabilitation and demolition activities, etc.
Hazardous (Special)
Management and collection of hazardous wastes originating from various sources, including household items
3.1 Waste Generation Survey Results
The records indicate that the total residential population within DMMC is 176, 846 (Source:
Divisional Secretariat 2015). The Dehiwala Mt. Lavinia MC area consists of 29 Wards as shown in
below Table 3‐2.
Table 3‐2 Household population (GN level) within Dehiwala Mt. Lavinia MC area
Ward Population Ward Population
Wilawala 6,192 Kawdana west 6,467
Dhutugamunu 4,615 Mount‐Lavinia 4,196
Kohuwala 5,596 Watarappala 6,256
Hathbodhiya 5,918 Kawdana 4,003
Saranankara 6,258 Katukurunduwatta 12,166
Galawala 5,631 Vidyalaya 4,196
Dehiwala west 5,154 Piriwena 4,984
Kalubowila 5,573 Wathumulla 4,531
Nedimala 8,884 Wedikanda 7,524
Dehiwala east 6,712 Aththidiya North 8,837
Udyana 5,815 Aththidiya south 7,616
Malwatta 3,506 Rathmalana west 5,692
Karagampitiya 5,527 Rathmalana east 655
Kawdana east 4,003 Viharaya 6,473
Jayathilaka 4,348 Kandawala 9,518
As shown in following, Dehiwala Mt. Lavinia MC own and control a larger number of public
properties and institutes.
Table 3‐3 Type and number of municipal establishment own by Dehiwala Mt. Lavinia MC
Public institute/premises No. units
People's Gardens 1
Cinema halls 5
Public market owned by council 8
Weekly fairs 4
Meat stalls 5
(314)

The data collection survey of solid waste management in Sri Lanka Main Report‐ Dehiwala Mt. Lavinia Municipal Council
13
Public institute/premises No. units
Public play ground 11
Libraries 5
reading rooms 9
Community center 25
Auditorium 1
Cemeteries 4
Crematorium 4
Fire Brigade Center 1
Pavilions 8
Fitness center 16
Council pre schools 14
Council Ayurveda Dispensaries 4
Maternity 12
Lavatories 7
Children parks 20
Bathing rooms 17
Dehiwala Mt. Lavinia city host most of the government and privet sector institutes in the Southern
Colombo region. Following table shows the number of government and privet/non‐government
establishments within Dehiwala Mt. Lavinia.
Table 3‐4 Number of government and privet institutions within Dehiwala Mt. Lavinia MC
Public institutes No. of units
Public Schools 32
Government Hospital 6
Privet Hospitals/ Decal center 22
Police Station 4
Privet schools 7
Railway stations 3
Post office 5
A major portion of MSW is generated from commercial sector in the city. Following Table 3‐5 shows
the number of different commercial (business) establishments in DMMC area.
(315)

The data collection survey of solid
waste m
anagem
ent in Sri Lanka
Main Rep
ort‐ Deh
iwala Mt. Lavinia M
unicipal Council
14
Table 3‐5 Type an
d number of business premises in
DMMC area
Type
Wards
Other
Total
1
2
3
45
67
89
10
11
12
13
14
15
16
17
18
19
20
21
22
23
24
25
26
27
28
29
Non‐occupied
1
1
11
1
11
21
10
Guest House
3
1
1
17
11
12
3
429
13
22
14
76
Restaurant
1
4
2
11
71
22
21
216
24
11
12
15
59
Bar
1
1
2
Meat Shops
2
1
11
11
1
11
11
12
Beauty Care
1
2
11
14
11
2
21
11
19
Salon
1
2
5
25
52
54
19
43
11
1
14
15
22
33
16
79
Gas Seller
1
1
1
11
11
11
1
11
13
12
3
22
Anim
al Foods
1
1
Med
ical Cen
ter
1
3
11
2
11
11
2
14
Automobile work Shops
2
3
6
46
12
14
1
31
15
210
52
Printers and Press
2
1
3
12
61
12
1
14
21
12
45
40
Assem
bling
1
12
Recycling shops
22
11
6
Industries
6
3
11
21
21
22
21
91
11
15
24
17
4
78
Service center
1
2
2
12
22
31
11
21
21
4
28
Veh
icle spare parts
1
1
2
11
13
2
11
1
15
Jewellery
11
13
6
Galleries
1
11
2
12
8
Grinding mills
21
11
11
21
10
Accommodation
1
3
48
Stores
2
2
2
12
13
32
51
11
12
33
11
43
10
2
56
Bakery and pastry shop
1
2
1
11
21
13
32
41
15
11
21
14
39
Electric equipmen
t sell
2
1
3
Electric rapier
1
1
31
12
1
111
Construction M
aterial
1
21
1
11
29
Farm
13
21
32
23
21
21
13
19
37
Film
hall
1
11
1
4
Fish shop
11
22
12
9
Filling shed
2
2
11
11
1
9
Fiberglas workshop
1
1
(316)

The data collection survey of solid
waste m
anagem
ent in Sri Lanka
Main Rep
ort‐ Deh
iwala Mt. Lavinia M
unicipal Council
15
Type
Wards
Other
Total
1
2
3
45
67
89
10
11
12
13
14
15
16
17
18
19
20
21
22
23
24
25
26
27
28
29
Fitness center
1
1
2
Funeral service
1
21
1
16
Welding shop
1
11
14
2
21
13
Garage
2
2
34
12
3
11
21
21
21
28
Tailor shop
1
1
13
11
1
9
Iron work/lath work
1
12
11
11
1
21
11
12
2
19
Garmen
t factory
1
1
11
11
11
11
11
1
13
Laundry
1
11
1
13
1
9
Hardware
1
1
21
1
1
7
Food cen
ter
3
6
31
15
22
12
62
12
10
21
11
11
12
10
67
Hotel
2
6
3
21
52
25
21
2
110
11
32
33
57
Studios
1
1
Office
1
1
Fruit and vegetable
1
1
Education cen
ter
1
1
Pest control chem
ical
3
3
Plastic m
anufacturing
3
22
11
11
21
16
21
Furniture show room
11
1
14
Timber stores
1
1
11
4
Furniture work shop
1
1
11
1
11
7
Super m
arket
3
1
22
21
3
21
12
13
24
Total
35
38
50
23
25
27
30
38
44
10
59
43
19
19
46
25
19
87
25
24
41
26
11
20
43
27
114
65
88 1022
(317)

The data collection survey of solid waste management in Sri Lanka Main Report‐ Dehiwala Mt. Lavinia Municipal Council
16
Following Table 3‐6 shows the number of premises (buildings) within the DMMC area which are
classified as business and non‐business (residential etc.).
Table 3‐6 Number of business and non‐business premises in each ward of DMMC area
Ward number Ward Name Business premises Non Business premises
1 Wilawala 286 1900
2 Dhutugamunu 691 2043
3 Kohuwala 500 2712
4 Kalubowila 231 2077
5 Hathbodhiya 301 2410
6 Saranankara 195 2321
7 Galawala 233 2029
8 Dehiwala west 266 2515
9 Dehiwala east 232 2449
10 Udyana 135 2028
11 Nedimala 341 3227
12 Malwatta 222 1582
13 Jayathilaka 717 1917
14 Karagampitiya 240 2093
15 Kadawana east 350 3451
16 Kadawana west 246 2879
17 Mount lavinia 204 2001
18 Vidyalaya 565 1866
19 Watarappola 273 2304
20 Katukurunduwatta 277 4310
21 Attidiya north 358 3266
22 Watumulla 320 2264
23 Wedikanda 220 2960
24 Pirivena 326 2097
25 Attidiya south 398 2779
26 Vihara 336 2670
27 Rathmalana west 78 1872
28 Rathmalana east 451 2143
29 Kandawala 636 3250
Total 9628 71415
(318)

The data collection survey of solid waste management in Sri Lanka Main Report‐ Dehiwala Mt. Lavinia Municipal Council
17
4 Public Opinion Survey (POS)
This Public Opinion Survey (POS) was commissioned to identify a range of household waste
management matters in relation to the household sector. Information on household waste
management practices and information on householders’ experiences with waste collection delivery
services was collected for the purpose of improving our understanding of householder’s experiences
and attitudes and also to better understand prevailing situation in householder’s point of view. The
purpose of this survey research included;
a. To collect information on public attitudes to the waste management and environment in
broader,
b. To value aspects of environmental health and protection,
c. To provide information on experiences with Local Authority’s waste management service
and,
d. To provide information on household waste management practices.
4.1 Public opinion survey methodology
The number of samples from Dehiwala Mt. Lavinia identified as 200 samples which are described in
detail Table 4‐1. The selection of households and areas within Dehiwala Mt. Lavinia MC was done
after a consultative discussion with Municipal Authority, MSW section officers at DMMC and JICA
expert team members. Dehiwala Mt. Lavinia MC has 29 wards as SWM areas. Samples were selected
from representative zones approximately in equal numbers.
The survey was executed by a team of university students who were trained about the questionnaire,
survey methodology and the data entering before dispatched to their respective fields. A senior
expertise took the leadership and continuously supervised the field survey. The selected households
were first educated about the survey, its main objectives and asked their cooperation before starting
the field survey. In addition business and institutes, large waste generators, hospitals recycling shops
and large public markets were also surveyed using appropriate questionnaires prepared in
consultation with JICA experts.
Table 4‐1 Category and number of samples for Public Opinion Survey
Category Sampling area Number of samples
High‐income households De Seram Rd, Barnes Avenue, 1st Lane Galle Rd, Mihidu Mawata, St Joseph Rd, Wasala Rd, Galle Rd
50
Middle‐income Households Rev.Wimalasiri Mw, Kalubovila, Hena Para, Melder Rd, Watarappala Rd, Piriwena Rd, Raja Mawata
50
Low‐income Households Apple Watta, Bodhiyawatta, Dheewara Niwasa, Bhathiya Mw, Walauwatta
50
Businesses /Service organization Galle Rd, Dehiwala Rd Kalubovila, High‐level Rd 43
Large waste generators 8
Markets 1
Hospitals 1
Recycling shops 1
NGO 1
(319)

The data collection survey of solid waste management in Sri Lanka Main Report‐ Dehiwala Mt. Lavinia Municipal Council
18
Category Sampling area Number of samplesTotal 205
The questionnaires were available in all languages (English/Sinhala/Tamil); however the
questionnaire form was filled by the interviewer based on interviewees’ response. The collected
information was recorded in digital form using Microsoft Excel and reviewed for accuracy. The data
was analyzed in detail for different objectives that generate an overview of the survey.
4.2 Results of Public Opinion Survey
87% of the surveyed households are Sinhalese, with 7 % of Muslims, 6 % Tamils. Data on the
average number of people per household and monthly income is set out in below Table 4‐2.
Table 4‐2 Average and standard deviation values of income and family size
Category Family size Income (Rs/month)
High 4.1 ± 1.2 129, 740 ± 57, 887
Middle 4.7 ± 2.9 62, 360 ± 25, 793
Low 5.4 ± 1.9 28, 560 ± 32, 644
No of workers Income (Rs/month)
Business 5.0 ± 7.0 21, 644, 884 ± 83,955, 819
In Dehiwala Mt. Lavinia MC, 100 % of surveyed households are provided with a garbage
collection service, of which 97% stated they use this service. Only 24 % of surveyed
households are “very satisfied” with present SWM service provision, while 51 % are
“somewhat satisfied”.
Figure 4‐1 Method of garbage discharge by residence in MMC area
Placing outside22%
Carrying to collection point
2%
Carrying to collection truck
74%
Other2% Irrelevant
0%
How is your garbage collected?
(320)

The data collection survey of solid waste management in Sri Lanka Main Report‐ Dehiwala Mt. Lavinia Municipal Council
19
Households’ main methods of waste discharge are shown in Figure 4‐1. The most common
methods are carrying garbage to collection truck (74%) and discharging it outside their
premises for house to house collection (22 %).
Only 09 % of surveyed households receive a daily garbage collection service while 47 %
stated that they received the service 2‐3 times/week. Similarly, 23% discharge their garbage
2‐3 times per week, but 39 % as soon as it is generated and 34 % discharge their garbage
daily.
In general, adult females handle waste in about 63 % of surveyed households and the duty is
covered by servants in 19% of households. In high income households servant’s contribution
is as high as 32%.
As shown in Figure 4‐2, on average 21 % of households separate their garbage into organic
and inorganic waste at the source of generation but only 4 % of high‐income households are
doing so. About 19 % of surveyed households are not/less willing to cooperate with source
separation for recycling. Further, 33 % are very much willing and 10% are somewhat willing
to cooperate in source separated garbage collection system.
Also, 79 % of surveyed households stated that there are recyclable collectors or someone
who comes to collect their reusable or recyclable materials. Hence, informal recycling
system is well established in Dehiwala Mt. Lavinia MC area.
Figure 4‐2 Willingness of residence for a source separated garbage collection system in Dehiwala Mt. Lavinia MC
Only 3 % of surveyed households use kitchen/garden waste for composting and used the
finished compost for their own garden.
Not many surveyed households (87 %) have ever discussed proper garbage discharge
methods at the community level.
Very much willing33%
Somewhat willing27%
Less willing5%
Not willing14%
Doing already21%
Willingness to cooperate in separate garbage collection system
(321)

The data collection survey of solid waste management in Sri Lanka Main Report‐ Dehiwala Mt. Lavinia Municipal Council
20
73 % households stated that SWM awareness programmes are very necessary while 25 %
stated “somewhat necessary”. Only 2 % of surveyed households stated that awareness
campaigns are not necessary or not needed at all.
60 % of household do not like to pay for SWM service mainly because of the revenue tax
they paid for DMMC. The average WTP (willingness to pay) for improved SWM services is 75
± 132 Rs/month per household.
Out of all surveyed households, 35 % stated that they sale/give‐off Glass & Bottle for
recycling and 35 % of residence sale/give‐off Plastics for recycling. Also, 14 % of household’s
sale/ give‐off can & metal for recycling. Cardboard and paper recycling were 6 % and 21 %
respectively.
(322)

Annex
DEHIWALA Mt. LAVINIA MUNICIPAL COUNCIL
(323)

Response to Public Opinion Survey for Household Dehiwala Mt. Lavinia MC
Page 1 of 7
Response to Public Opinion Survey for Household
Sinhala87%
Muslim
7%
Tamil6% Other
0%
Ethnicity
Buddhist67%
Islam
7%
Hindu5%
Christian 21%
Other
0%
Religion
Garbage
collection77%
Storm
water18%
Water
supply5%
Please specify the priority for your daily life regarding the improvement of the following
aspects?
Yes100%
No0%
Are there garbage collection services in your area?
Yes97%
No3%
Do you use these services?
Placing outside22%
Carrying to collection point
2%
Carrying to collection truck
74%
Other2% Irrelevant
0%
How is your garbage collected?
(324)

Response to Public Opinion Survey for Household Dehiwala Mt. Lavinia MC
Page 2 of 7
Response to Public Opinion Survey for Household
2‐25m70%
26‐50m20%
51‐100m8%
100‐
250m2%
>250m0%
Don't know0%
How far do you have to walk to reach collection point?
Daily
9%
> 4
times/Wk2%
2‐3
times/Wk47%
Once/Wk
28%
< Once/Wk
8%
Irregular5%
Don't know0%
Irrelevant
1%
How often is your garbage collected?
Yes23%
No76%
Don't know1%
Is the garbage collection service done at a fixed time on the collection day?
Very satisfied24%
Somewhat satisfied
51%
Less than satisfied20%
Not satisfied at all5%
Are you satisfied with the collection service?
Not properly done
18%
Frequency too low20%
Is irregular27%
Too early/ too late17%
Bad workers'
behaviour7%
Workers demand
allowance3%
Allowance is expensive
0%
Service not fair
1% Point if too far0%
Other7%
What are reasons for dissatisfaction?
(325)

Response to Public Opinion Survey for Household Dehiwala Mt. Lavinia MC
Page 3 of 7
Response to Public Opinion Survey for Household
Yes11%
No
89%
Have you ever complained about the garbage collection service to the authorities in the last
three years?
Yes
100%
No
0%
Do you want to receive a garbage collection service? (only for persons who do not have garbage collection services in the area)
Discharge outside
31%
Specific place
17%
Open dump
3%Request a collection
truck2%
Self‐dispose4%
Composting
1%
Give for recycling
0%
Other (collection
truck/ common bin)42%
How do you dispose off garbage generated in your premises?
As soon as39%
Once daily34%
Once 2‐3 days25%
Less frequent
2%
How often do you dispose off garbage generated in your premises?
Adult male7%
Adult female63%
Servant19%
Other11%
Who mainly handles wastes at home?
(326)

Response to Public Opinion Survey for Household Dehiwala Mt. Lavinia MC
Page 4 of 7
Response to Public Opinion Survey for Household
Very
much willing33%
Somewhat willing27%
Less willing5%
Not willing14%
Doing already21%
Willingness to cooperate in separate garbage collection system
Reduce landfill amount25%
Protect environm
ent61%
Can earn money2%
Others12%
If you are willing to cooperate, why do you think recycling is important?
Yes
79%
No
17%
Don't
know4%
Is there someone who comes around to collect or buy your reusable or recyclable materials?
Yes11%
No89%
Do you take for recyclable materials to shops for refund or sale?
Yes
3%
No
97%
Are you using kitchen/garden waste for composting?
< Half33%
Half0%
> Half
0%
All
67%
If you do composting, how much of kitchen waste used for composting?
(327)

Response to Public Opinion Survey for Household Dehiwala Mt. Lavinia MC
Page 5 of 7
Response to Public Opinion Survey for Household
< Half
25%
Half
0%
> Half0%All
75%
If you do composting, how much of garden waste used for composting?
Sell
0%
Own use100%
What do you do with produced compost?
Don’t like60%
Willing to pay40%
Suppose that you are satisfied with the service of Municipal solid waste management, either as is or as a result of improvement. Think for a moment about the largest amount of money that
your household would be willing to pay each month as a garbage colle
Yes42%
No
38%
Don't know20%
Do you have any community‐based organizations to solve not only the waste
problems but also other community problems? Yes
13%
No44%
Don't know43%
Have you ever discussed the methods of proper garbage handling and discharge at the
meetings?
(328)

Response to Public Opinion Survey for Household Dehiwala Mt. Lavinia MC
Page 6 of 7
Response to Public Opinion Survey for Household
Yes85%
No15%
Have you ever been taught methods of proper garbage handling and discharge?
Parents
4%
Communi
ty6%
School
7%
Local
Gov.44%
Central
Gov.12%
NGOs
1%
Others
26%
If you have learned , who taught proper garbage handling methods?
Very necessary
73%
Somewhat
necessary25%
Not very necessary
2%
Not necessary at all0%
Do you think a campaign to raise awareness of people for maintaining the cleaner city and
environment is necessary?
(329)