Embed Size (px)
Citation preview

Data Digest
2019-20
I R M ▪ O P
2019-2020
Data Digest Original Release Date: March 2020
Notes:
This document may be updated throughout the year. Reports that have been added, updated, or revised since the original release date above will display a “released” or “updated” date at the bottom of the page.
Questions about information contained in the Data Digest should be directed to:
Information & Resource Management, Office of the Executive Vice President & Provost
University of Iowa 111 Jessup Hall Phone: 319-335-3565 5 West Jefferson Street E-Mail: [email protected] City, IA 52240 URL: provost.uiowa.edu/data-digest
Welcome to the University of Iowa Data Digest.
The Data Digest provides comprehensive quantitative information about various aspects of the university, including students, faculty, staff, and budget. Please note that many measures can be counted in a variety of different ways, depending on definitions of what to include, timeframe, and other variables. Source and technical notes at the end of this document should help to clarify what choices were made in producing these reports.
We welcome your feedback about the Digest and how we can improve it to help to meet your data needs.
Information & Resource Management Office of the Provost
Table of Contents
Information and Resource Management, Office of the Provost
STUDENTS .................................................................................................................... 5 Fall Semester Headcount Enrollment by Student Level ........................................... 6 Fall Semester Headcount Enrollment by Gender ..................................................... 8 Fall Semester Headcount Enrollment by Racial/Ethnic Category .......................... 10 Fall Semester Headcount Enrollment by Residency .............................................. 12
Undergraduate Students .................................................................................... 13 Graduate Students............................................................................................. 14 Professional and Postgraduate Students ........................................................... 15
Fall Semester Headcount Enrollment by Geographic Origin .................................. 16 Fall Semester Headcount Enrollment by Full Time and Part Time ......................... 17 Fall Semester Headcount Enrollment by Enrolled Credit Hours ............................. 19 Fall Semester Headcount Enrollment by Age ........................................................ 20 Fall Semester Undergraduate Headcount Enrollment by First Generation
Status and Gender............................................................................................. 22 Fall Semester Undergraduate Headcount Enrollment by First Generation
Status and Racial/Ethnic Category .................................................................... 23 Fall Semester Headcount – New Students ............................................................ 24
Fall Semester Headcount – New First-Year Students ........................................ 25 Fall Semester Student FTE by Student Level ........................................................ 29 Headcount of Fall Semester New Freshmen Applicants ........................................ 31 Retention and Graduation Rates of New First Time Full Time Students
By Fall Semester Entrance Cohort..................................................................... 32 By Gender and Fall Semester Entrance Cohort ................................................. 33 By Underrepresented Minority Status and Fall Semester Entrance Cohort ........ 34 By Race/Ethnicity and Fall Semester Entrance Cohort ...................................... 35 By Title IV Financial Aid Participation and Fall Semester Entrance Cohort ........ 36 By First-Generation Status and Fall Semester Entrance Cohort ........................ 37
Number of Degree Programs Completed by Student Level ................................... 38 Number of Degree Programs Completed by Gender and by Student Level ........... 39 Five Largest Majors by Degrees Conferred ........................................................... 40 Distribution of Alumni by State ............................................................................... 41
FACULTY & STAFF ..................................................................................................... 42 November 1 Faculty FTE ....................................................................................... 43
November 1 Faculty FTE by Fund Group .......................................................... 44 Headcount of Faculty by Faculty Category and Gender ........................................ 45 Headcount of Faculty by Faculty Category, Rank, and Gender ............................. 46 Headcount of Faculty by Race/Ethnicity ................................................................ 49 Employment Profile FTE – November 2018 .......................................................... 52 Employment Profile Headcount – November 2018 ................................................ 53 Average Faculty Salaries by Professorial Rank ..................................................... 54 Median Average Faculty Salaries by Professorial Rank ........................................ 55
INSTRUCTION ............................................................................................................. 56 Fiscal Year Student Credit Hours by Student Level ............................................... 57 Fiscal Year Student Credit Hours by Section Type and Primary
Instructor Category ............................................................................................ 58 Fiscal Year Student Credit Hours by Section Management Type and
Primary Instructor Category ............................................................................... 59
Fall Semester Program of Study Count by Primary Student Level and Declaration Type ........................................................................................ 60
RESEARCH ................................................................................................................. 61 Extramural Awards ................................................................................................ 62 Federal Research Awards by Agency ................................................................... 63 Non-Federal Research Awards by Source ............................................................ 64 Technology Transfer ............................................................................................. 65 Research & Development Expenditures at Public Big Ten Universities ................ 66
FINANCE ..................................................................................................................... 67 University of Iowa Revenue .................................................................................. 68 University of Iowa Operating Expenses by Function ............................................. 69 University of Iowa General Education Fund Budget - Revenues ........................... 70 University of Iowa General Education Fund Budget - Expenditures ...................... 71 Academic Year Tuition & Required Fees at Public Big Ten Universities ............... 72 Trends in Academic Year Tuition and Required Fees ........................................... 73 Undergraduate Cost of Attendance per Academic Year ........................................ 74 Student Financial Aid Awards by Type .................................................................. 75 Endowment Pool ................................................................................................... 77
COLLEGES.................................................................................................................. 78 Fall Semester Headcount Enrollment by College and by Student Level ................ 79 Degree Program Completions by College ............................................................. 81 Alumni by College ................................................................................................. 82 Fiscal Year Student Credit Hours by College of Student’s Primary
Program of Study and by Student Level ............................................................ 83 Fiscal Year Student Credit Hours by Administrative Home College
and by Student Level ........................................................................................ 85 November 1 Faculty FTE by Faculty Category and by Organization ..................... 87 Headcount of Faculty by Faculty Category and by College ................................... 90 Extramural Awards by College .............................................................................. 92 Federal Research Awards by College ................................................................... 93 Non-Federal Research Awards by College ........................................................... 94 Fiscal Year Gross Expenditures by Organization, All Funds ................................. 95 Fiscal Year Gross Expenditures by Organization, General Education
Funds ................................................................................................................ 96 PROGRAMS ................................................................................................................ 97
Academic Degree Programs Offered .................................................................... 98 Fall Semester Enrollment by Objective and Program of Study .............................. 99 Number of Degree Programs Completed by Objective and Program of Study .... 113
ADDITIONAL FACTS AND FIGURES ....................................................................... 121 Library Statistics.................................................................................................. 122 Association of Research Libraries Rankings, University of Iowa Libraries........... 123 Land and Facilities .............................................................................................. 124 Fall Classroom/Lab Utilization Summary............................................................. 125
PEER COMPARISONS .............................................................................................. 126 INSTITUTIONAL DATA RESOURCES ...................................................................... 129 DEFINITIONS AND TECHNICAL NOTES ................................................................. 131

Students
Fall Semester Headcount Enrollment by Student Level ........................................... 6 Fall Semester Headcount Enrollment by Gender ..................................................... 8 Fall Semester Headcount Enrollment by Racial/Ethnic Category .......................... 10 Fall Semester Headcount Enrollment by Residency .............................................. 12
Undergraduate Students .................................................................................... 13 Graduate Students............................................................................................. 14 Professional and Postgraduate Students ........................................................... 15
Fall Semester Headcount Enrollment by Geographic Origin .................................. 16 Fall Semester Headcount Enrollment by Full Time and Part Time ......................... 17 Fall Semester Headcount Enrollment by Enrolled Credit Hours ............................. 19 Fall Semester Headcount Enrollment by Age ........................................................ 20 Fall Semester Undergraduate Headcount Enrollment by First Generation
Status and Gender............................................................................................. 22 Fall Semester Undergraduate Headcount Enrollment by First Generation
Status and Racial/Ethnic Category .................................................................... 23 Fall Semester Headcount – New Students ............................................................ 24
Fall Semester Headcount – New First-Year Students ........................................ 25 Fall Semester Student FTE by Student Level ........................................................ 29 Headcount of Fall Semester New Freshmen Applicants ........................................ 31 Retention and Graduation Rates of New First Time Full Time Students
By Fall Semester Entrance Cohort..................................................................... 32 By Gender and Fall Semester Entrance Cohort ................................................. 33 By Underrepresented Minority Status and Fall Semester Entrance Cohort ........ 34 By Race/Ethnicity and Fall Semester Entrance Cohort ...................................... 35 By Title IV Financial Aid Participation and Fall Semester Entrance Cohort ........ 36 By First-Generation Status and Fall Semester Entrance Cohort ........................ 37
Number of Degree Programs Completed by Student Level ................................... 38 Number of Degree Programs Completed by Gender and by Student Level ........... 39 Five Largest Majors by Degrees Conferred ........................................................... 40 Distribution of Alumni by State ............................................................................... 41
5

Fall Semester Headcount Enrollment by Student LevelStudent Level 2010 2011 2012 2013 2014 2015 2016 2017 2018 2019Undergraduate 21,128 21,528 21,921 21,904 22,289 23,300 24,430 24,503 23,989 23,482
Freshmen 5,564 5,740 5,592 5,700 5,759 6,349 6,712 5,933 5,493 5,372Sophomores 4,451 4,531 4,798 4,641 4,721 4,697 5,292 5,674 5,167 5,071Juniors 4,994 5,259 5,319 5,282 5,240 5,203 5,251 5,951 6,152 5,685Seniors 5,349 5,358 5,538 5,616 5,713 5,678 5,682 5,730 6,533 6,718Unclassified 770 640 674 665 856 1,373 1,493 1,215 644 636
Graduate 6,375 6,290 6,206 5,939 5,804 5,688 5,698 5,816 5,826 5,900Master's 3,001 2,915 2,787 2,692 2,661 2,610 2,657 2,845 2,860 3,081Doctoral 2,872 2,873 2,894 2,784 2,635 2,576 2,502 2,427 2,383 2,363Other 502 502 525 463 508 502 539 544 583 456
Professional 1,966 1,955 1,923 1,835 1,812 1,799 1,837 1,847 1,841 1,858Dentistry (DDS) 315 318 318 322 328 322 323 329 331 334Law (JD) 576 558 526 420 392 392 428 419 422 431Medicine (MD) 637 638 644 662 662 657 658 668 663 667Pharmacy (PharmD) 438 441 435 431 430 428 428 431 425 426
Postgraduate 1,308 1,372 1,370 1,318 1,417 1,306 1,323 1,398 1,292 1,295Residents 782 801 817 799 862 783 822 906 806 823Fellows 197 205 206 189 195 176 185 195 195 191Post-Doctoral 329 366 347 330 360 347 316 297 291 281
Total 30,777 31,145 31,420 30,996 31,322 32,093 33,288 33,564 32,948 32,535Percent Undergraduate 68.6% 69.1% 69.8% 70.7% 71.2% 72.6% 73.4% 73.0% 72.8% 72.2%Percent Graduate 20.7% 20.2% 19.8% 19.2% 18.5% 17.7% 17.1% 17.3% 17.7% 18.1%Percent Professional 6.4% 6.3% 6.1% 5.9% 5.8% 5.6% 5.5% 5.5% 5.6% 5.7%Percent Postgraduate 4.2% 4.4% 4.4% 4.3% 4.5% 4.1% 4.0% 4.2% 3.9% 4.0%Source: MAUI/Registrar's data warehouse (see Note 1). See Note 2 regarding discrepancies with census-date reporting for fall 2011.See Note 3 regarding the removal of Iowa Intensive English Program (IIEP)-only students from the student headcounts, in all years.
Under-graduate
72%
Graduate18%
Professional6%
Postgraduate4%
Enrollment by Student LevelFall 2019
-10%
-5%
0%
5%
10%
2010 2011 2012 2013 2014 2015 2016 2017 2016 2019
Perc
ent
Annual Percent Change in Headcount Enrollment
Undergraduate Graduate Professional
Information and Resource Management, Office of the Provost 6
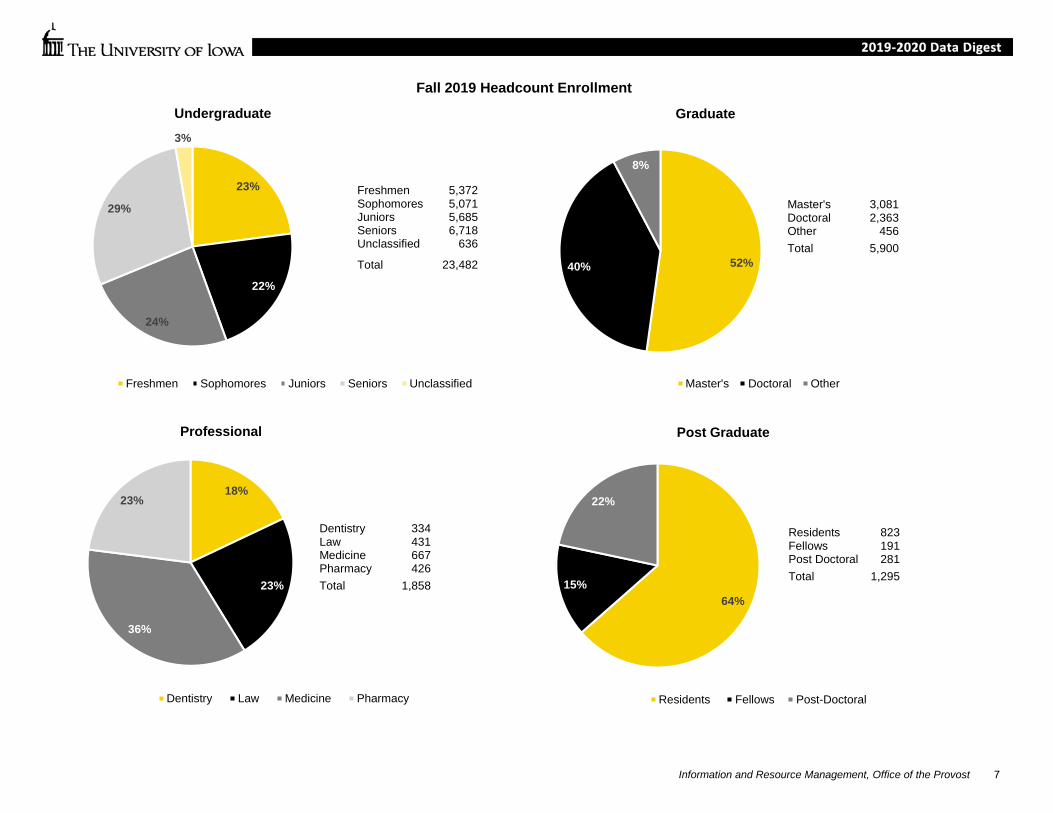
23%
22%
24%
29%
3%
Undergraduate
Freshmen Sophomores Juniors Seniors Unclassified
52%40%
8%
Graduate
Master's Doctoral Other
Master's 3,081Doctoral 2,363Other 456Total 5,900
18%
23%
36%
23%
Professional
Dentistry Law Medicine Pharmacy
Dentistry 334Law 431Medicine 667Pharmacy 426Total 1,858
64%15%
22%
Post Graduate
Residents Fellows Post-Doctoral
Residents 823Fellows 191 Post Doctoral 281Total 1,295
Freshmen 5,372 Sophomores 5,071Juniors 5,685Seniors 6,718Unclassified 636
Total 23,482
Fall 2019 Headcount Enrollment
Information and Resource Management, Office of the Provost 7

Fall Semester Headcount Enrollment by Gender
Student Level 2010 2011 2012 2013 2014 2015 2016 2017 2018 2019Undergraduate 21,128 21,528 21,921 21,904 22,289 23,300 24,430 24,503 23,989 23,482
Men 10,155 10,397 10,584 10,504 10,743 11,177 11,553 11,512 11,135 10,784Women 10,973 11,131 11,337 11,398 11,536 12,103 12,831 12,942 12,798 12,603Prefer Not to Answer/Other 0 0 0 2 10 20 46 49 56 95Percent Women 51.9% 51.7% 51.7% 52.0% 51.8% 51.9% 52.5% 52.8% 53.3% 53.7%
Graduate 6,375 6,290 6,206 5,939 5,804 5,688 5,698 5,816 5,826 5,900Men 2,970 2,922 2,928 2,874 2,794 2,759 2,780 2,787 2,730 2,756Women 3,405 3,368 3,278 3,065 3,010 2,924 2,908 3,005 3,072 3,115Prefer Not to Answer/Other 0 0 0 0 0 5 10 24 24 29Percent Women 53.4% 53.5% 52.8% 51.6% 51.9% 51.4% 51.0% 51.7% 52.7% 52.8%
Professional 1,966 1,955 1,923 1,835 1,812 1,799 1,837 1,847 1,841 1,858Men 991 1,001 997 948 921 905 927 914 918 907Women 975 954 926 887 891 892 905 929 919 948Prefer Not to Answer/Other 0 0 0 0 0 2 5 4 4 3Percent Women 49.6% 48.8% 48.2% 48.3% 49.2% 49.6% 49.3% 50.3% 49.9% 51.0%
Postgraduate 1,308 1,372 1,370 1,318 1,417 1,306 1,323 1,398 1,292 1,295Men 784 824 803 767 831 745 754 799 760 755Women 524 548 567 551 586 561 569 599 532 540Prefer Not to Answer/Other 0 0 0 0 0 0 0 0 0 0Percent Women 40.1% 39.9% 41.4% 41.8% 41.4% 43.0% 43.0% 42.8% 41.2% 41.7%
Total 30,777 31,145 31,420 30,996 31,322 32,093 33,288 33,564 32,948 32,535Men 14,900 15,144 15,312 15,093 15,289 15,586 16,014 16,012 15,543 15,202Women 15,877 16,001 16,108 15,901 16,023 16,480 17,213 17,475 17,321 17,206Prefer Not to Answer/Other 0 0 0 2 10 27 61 77 84 127Percent Women 51.6% 51.4% 51.3% 51.3% 51.2% 51.4% 51.7% 52.1% 52.6% 52.9%
Source: MAUI/Registrar's data warehouse (see Note 1). Note: "Prefer Not to Answer/Other" includes all students who chose not to identify their sex as either male or female, whether by selecting "transgender" (or not reporting) in fall 2013 through fall 2015, or by selecting "prefer not to answer" starting in fall 2016. See Note 5 regarding change in gender reporting effective 2016.
Information and Resource Management, Office of the Provost 8
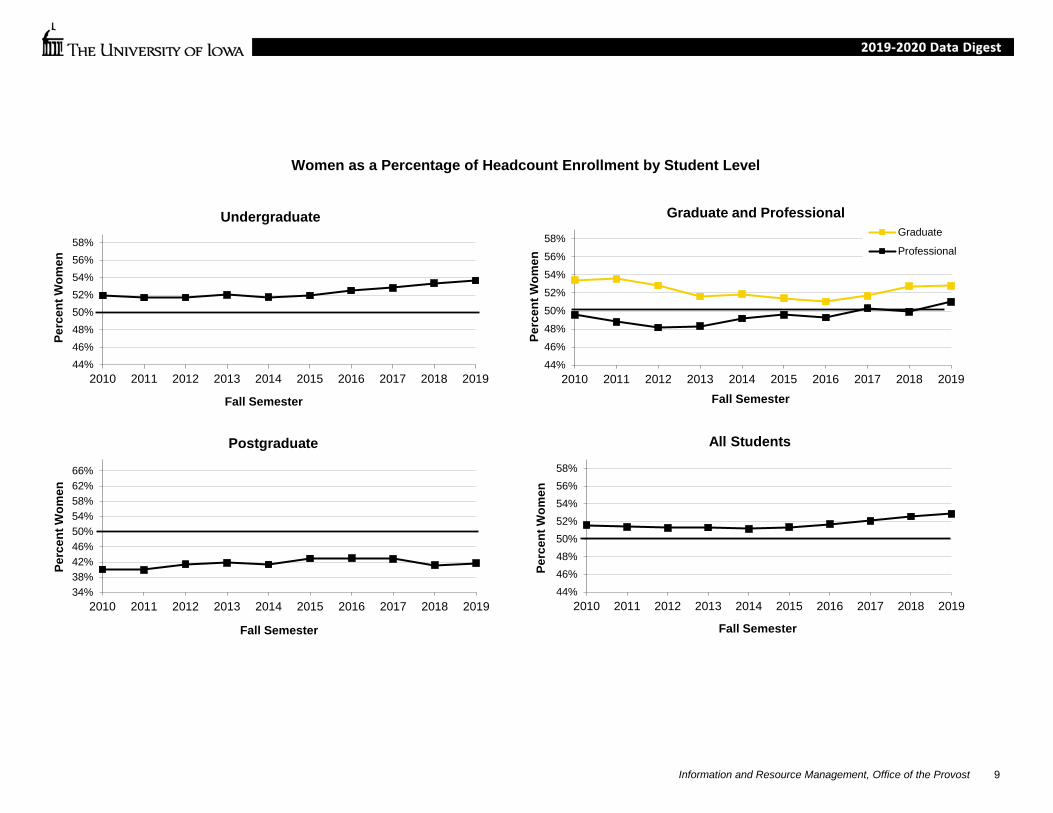
Women as a Percentage of Headcount Enrollment by Student Level
44%46%48%50%52%54%56%58%
2010 2011 2012 2013 2014 2015 2016 2017 2018 2019
Perc
ent W
omen
Fall Semester
All Students
44%46%48%50%52%54%56%58%
2010 2011 2012 2013 2014 2015 2016 2017 2018 2019
Perc
ent W
omen
Fall Semester
Undergraduate
44%46%48%50%52%54%56%58%
2010 2011 2012 2013 2014 2015 2016 2017 2018 2019
Perc
ent W
omen
Fall Semester
Graduate and ProfessionalGraduate
Professional
34%38%42%46%50%54%58%62%66%
2010 2011 2012 2013 2014 2015 2016 2017 2018 2019
Perc
ent W
omen
Fall Semester
Postgraduate
Information and Resource Management, Office of the Provost 9
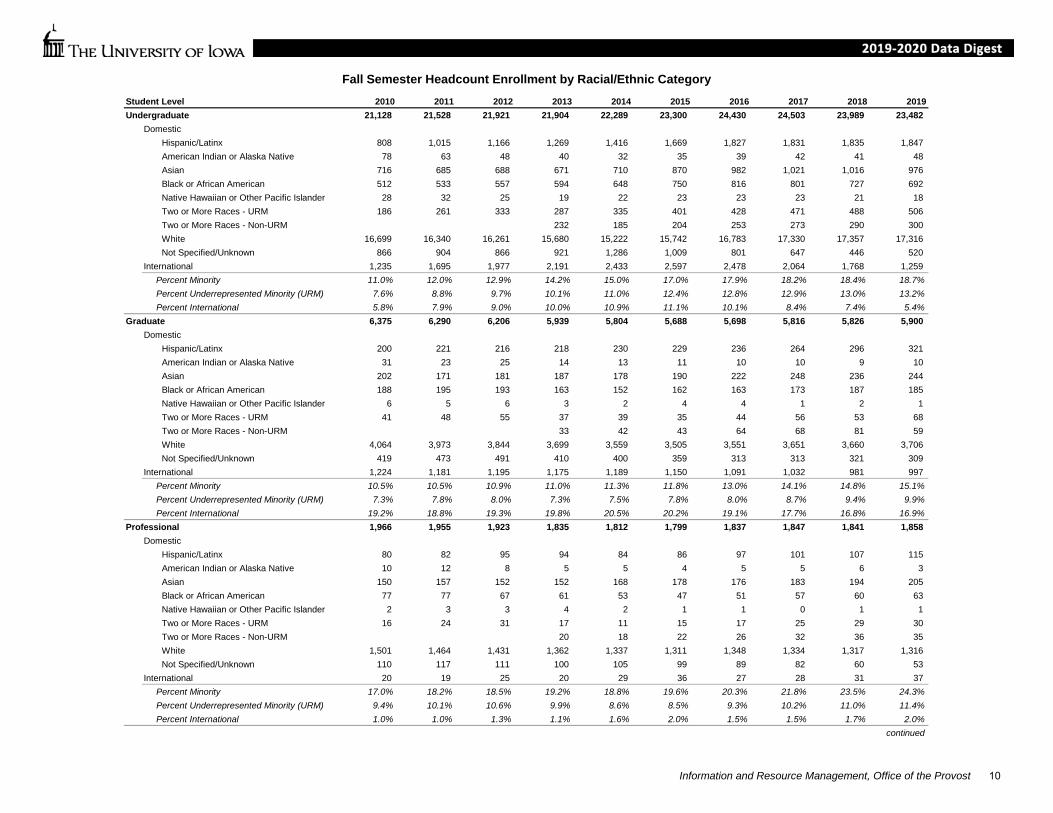
Student Level 2010 2011 2012 2013 2014 2015 2016 2017 2018 2019Undergraduate 21,128 21,528 21,921 21,904 22,289 23,300 24,430 24,503 23,989 23,482
DomesticHispanic/Latinx 808 1,015 1,166 1,269 1,416 1,669 1,827 1,831 1,835 1,847American Indian or Alaska Native 78 63 48 40 32 35 39 42 41 48Asian 716 685 688 671 710 870 982 1,021 1,016 976Black or African American 512 533 557 594 648 750 816 801 727 692Native Hawaiian or Other Pacific Islander 28 32 25 19 22 23 23 23 21 18Two or More Races - URM 186 261 333 287 335 401 428 471 488 506Two or More Races - Non-URM 232 185 204 253 273 290 300White 16,699 16,340 16,261 15,680 15,222 15,742 16,783 17,330 17,357 17,316Not Specified/Unknown 866 904 866 921 1,286 1,009 801 647 446 520
International 1,235 1,695 1,977 2,191 2,433 2,597 2,478 2,064 1,768 1,259Percent Minority 11.0% 12.0% 12.9% 14.2% 15.0% 17.0% 17.9% 18.2% 18.4% 18.7%Percent Underrepresented Minority (URM) 7.6% 8.8% 9.7% 10.1% 11.0% 12.4% 12.8% 12.9% 13.0% 13.2%Percent International 5.8% 7.9% 9.0% 10.0% 10.9% 11.1% 10.1% 8.4% 7.4% 5.4%
Graduate 6,375 6,290 6,206 5,939 5,804 5,688 5,698 5,816 5,826 5,900Domestic
Hispanic/Latinx 200 221 216 218 230 229 236 264 296 321American Indian or Alaska Native 31 23 25 14 13 11 10 10 9 10Asian 202 171 181 187 178 190 222 248 236 244Black or African American 188 195 193 163 152 162 163 173 187 185Native Hawaiian or Other Pacific Islander 6 5 6 3 2 4 4 1 2 1Two or More Races - URM 41 48 55 37 39 35 44 56 53 68Two or More Races - Non-URM 33 42 43 64 68 81 59White 4,064 3,973 3,844 3,699 3,559 3,505 3,551 3,651 3,660 3,706Not Specified/Unknown 419 473 491 410 400 359 313 313 321 309
International 1,224 1,181 1,195 1,175 1,189 1,150 1,091 1,032 981 997Percent Minority 10.5% 10.5% 10.9% 11.0% 11.3% 11.8% 13.0% 14.1% 14.8% 15.1%Percent Underrepresented Minority (URM) 7.3% 7.8% 8.0% 7.3% 7.5% 7.8% 8.0% 8.7% 9.4% 9.9%Percent International 19.2% 18.8% 19.3% 19.8% 20.5% 20.2% 19.1% 17.7% 16.8% 16.9%
Professional 1,966 1,955 1,923 1,835 1,812 1,799 1,837 1,847 1,841 1,858Domestic
Hispanic/Latinx 80 82 95 94 84 86 97 101 107 115American Indian or Alaska Native 10 12 8 5 5 4 5 5 6 3Asian 150 157 152 152 168 178 176 183 194 205Black or African American 77 77 67 61 53 47 51 57 60 63Native Hawaiian or Other Pacific Islander 2 3 3 4 2 1 1 0 1 1Two or More Races - URM 16 24 31 17 11 15 17 25 29 30Two or More Races - Non-URM 20 18 22 26 32 36 35White 1,501 1,464 1,431 1,362 1,337 1,311 1,348 1,334 1,317 1,316Not Specified/Unknown 110 117 111 100 105 99 89 82 60 53
International 20 19 25 20 29 36 27 28 31 37Percent Minority 17.0% 18.2% 18.5% 19.2% 18.8% 19.6% 20.3% 21.8% 23.5% 24.3%Percent Underrepresented Minority (URM) 9.4% 10.1% 10.6% 9.9% 8.6% 8.5% 9.3% 10.2% 11.0% 11.4%Percent International 1.0% 1.0% 1.3% 1.1% 1.6% 2.0% 1.5% 1.5% 1.7% 2.0%
continued
Fall Semester Headcount Enrollment by Racial/Ethnic Category
Information and Resource Management, Office of the Provost 10
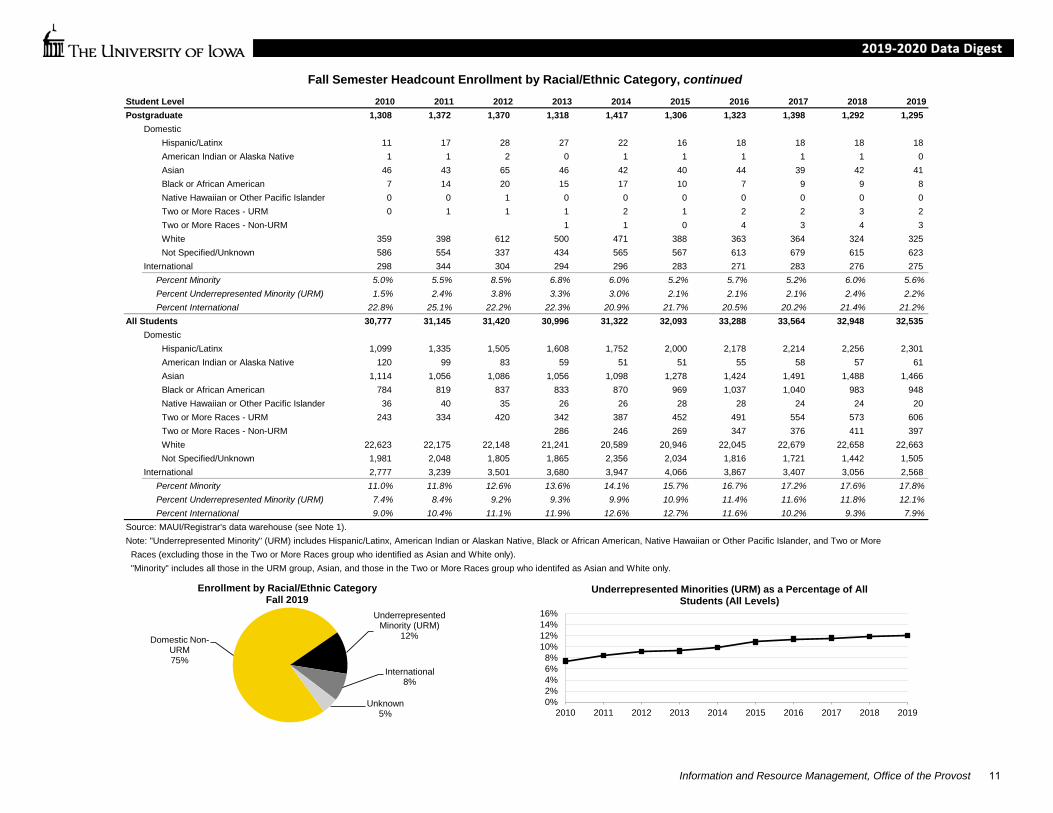
Student Level 2010 2011 2012 2013 2014 2015 2016 2017 2018 2019Postgraduate 1,308 1,372 1,370 1,318 1,417 1,306 1,323 1,398 1,292 1,295
DomesticHispanic/Latinx 11 17 28 27 22 16 18 18 18 18American Indian or Alaska Native 1 1 2 0 1 1 1 1 1 0Asian 46 43 65 46 42 40 44 39 42 41Black or African American 7 14 20 15 17 10 7 9 9 8Native Hawaiian or Other Pacific Islander 0 0 1 0 0 0 0 0 0 0Two or More Races - URM 0 1 1 1 2 1 2 2 3 2Two or More Races - Non-URM 1 1 0 4 3 4 3White 359 398 612 500 471 388 363 364 324 325Not Specified/Unknown 586 554 337 434 565 567 613 679 615 623
International 298 344 304 294 296 283 271 283 276 275Percent Minority 5.0% 5.5% 8.5% 6.8% 6.0% 5.2% 5.7% 5.2% 6.0% 5.6%Percent Underrepresented Minority (URM) 1.5% 2.4% 3.8% 3.3% 3.0% 2.1% 2.1% 2.1% 2.4% 2.2%Percent International 22.8% 25.1% 22.2% 22.3% 20.9% 21.7% 20.5% 20.2% 21.4% 21.2%
All Students 30,777 31,145 31,420 30,996 31,322 32,093 33,288 33,564 32,948 32,535Domestic
Hispanic/Latinx 1,099 1,335 1,505 1,608 1,752 2,000 2,178 2,214 2,256 2,301American Indian or Alaska Native 120 99 83 59 51 51 55 58 57 61Asian 1,114 1,056 1,086 1,056 1,098 1,278 1,424 1,491 1,488 1,466Black or African American 784 819 837 833 870 969 1,037 1,040 983 948Native Hawaiian or Other Pacific Islander 36 40 35 26 26 28 28 24 24 20Two or More Races - URM 243 334 420 342 387 452 491 554 573 606Two or More Races - Non-URM 286 246 269 347 376 411 397White 22,623 22,175 22,148 21,241 20,589 20,946 22,045 22,679 22,658 22,663Not Specified/Unknown 1,981 2,048 1,805 1,865 2,356 2,034 1,816 1,721 1,442 1,505
International 2,777 3,239 3,501 3,680 3,947 4,066 3,867 3,407 3,056 2,568Percent Minority 11.0% 11.8% 12.6% 13.6% 14.1% 15.7% 16.7% 17.2% 17.6% 17.8%Percent Underrepresented Minority (URM) 7.4% 8.4% 9.2% 9.3% 9.9% 10.9% 11.4% 11.6% 11.8% 12.1%Percent International 9.0% 10.4% 11.1% 11.9% 12.6% 12.7% 11.6% 10.2% 9.3% 7.9%
Source: MAUI/Registrar's data warehouse (see Note 1). Note: "Underrepresented Minority" (URM) includes Hispanic/Latinx, American Indian or Alaskan Native, Black or African American, Native Hawaiian or Other Pacific Islander, and Two or More Races (excluding those in the Two or More Races group who identified as Asian and White only). "Minority" includes all those in the URM group, Asian, and those in the Two or More Races group who identifed as Asian and White only.
Fall Semester Headcount Enrollment by Racial/Ethnic Category, continued
Domestic Non-URM75%
Underrepresented Minority (URM)
12%
International8%
Unknown5%
Enrollment by Racial/Ethnic CategoryFall 2019
0%2%4%6%8%
10%12%14%16%
2010 2011 2012 2013 2014 2015 2016 2017 2018 2019
Underrepresented Minorities (URM) as a Percentage of All Students (All Levels)
Information and Resource Management, Office of the Provost 11

Fall Semester Student Headcount Enrollment by Residency - All Students2010 2011 2012 2013 2014 2015 2016 2017 2018 2019
Undergraduate 21,128 21,528 21,921 21,904 22,289 23,300 24,430 24,503 23,989 23,482Iowa Resident 12,578 12,215 12,192 12,012 12,139 12,758 13,314 14,160 14,658 14,623Non-Resident 8,550 9,313 9,729 9,892 10,150 10,542 11,116 10,343 9,331 8,859Percent Resident 59.5% 56.7% 55.6% 54.8% 54.5% 54.8% 54.5% 57.8% 61.1% 62.3%
Graduate 6,375 6,290 6,206 5,939 5,804 5,688 5,698 5,816 5,826 5,900Iowa Resident 2,882 2,820 2,868 2,681 2,618 2,605 2,669 2,770 2,854 2,889Non-Resident 3,493 3,470 3,338 3,258 3,186 3,083 3,029 3,046 2,972 3,011Percent Resident 45.2% 44.8% 46.2% 45.1% 45.1% 45.8% 46.8% 47.6% 49.0% 49.0%
Professional 1,966 1,955 1,923 1,835 1,812 1,799 1,837 1,847 1,841 1,858Iowa Resident 1,231 1,222 1,260 1,206 1,169 1,143 1,138 1,155 1,175 1,180Non-Resident 735 733 663 629 643 656 699 692 666 678Percent Resident 62.6% 62.5% 65.5% 65.7% 64.5% 63.5% 61.9% 62.5% 63.8% 63.5%
Postgraduate 1,308 1,372 1,370 1,318 1,417 1,306 1,323 1,398 1,292 1,295Iowa Resident 909 948 1,066 1,024 1,121 1,023 1,052 1,115 1,016 1,020Non-Resident 399 424 304 294 296 283 271 283 276 275Percent Resident 69.5% 69.1% 77.8% 77.7% 79.1% 78.3% 79.5% 79.8% 78.6% 78.8%
All Students 30,777 31,145 31,420 30,996 31,322 32,093 33,288 33,564 32,948 32,535Iowa Resident 17,600 17,205 17,386 16,923 17,047 17,529 18,173 19,200 19,703 19,712Non-Resident 13,177 13,940 14,034 14,073 14,275 14,564 15,115 14,364 13,245 12,823Percent Resident 57.2% 55.2% 55.3% 54.6% 54.4% 54.6% 54.6% 57.2% 59.8% 60.6%
Source: MAUI/Registrar's data warehouse (see Note 1)
25%
30%
35%
40%
45%
50%
2010 2011 2012 2013 2014 2015 2016 2017 2018 2019
Perc
ent
Percent of All StudentsWho are Non-Resident, by Fall Semester
.
Information and Resource Management, Office of the Provost 12
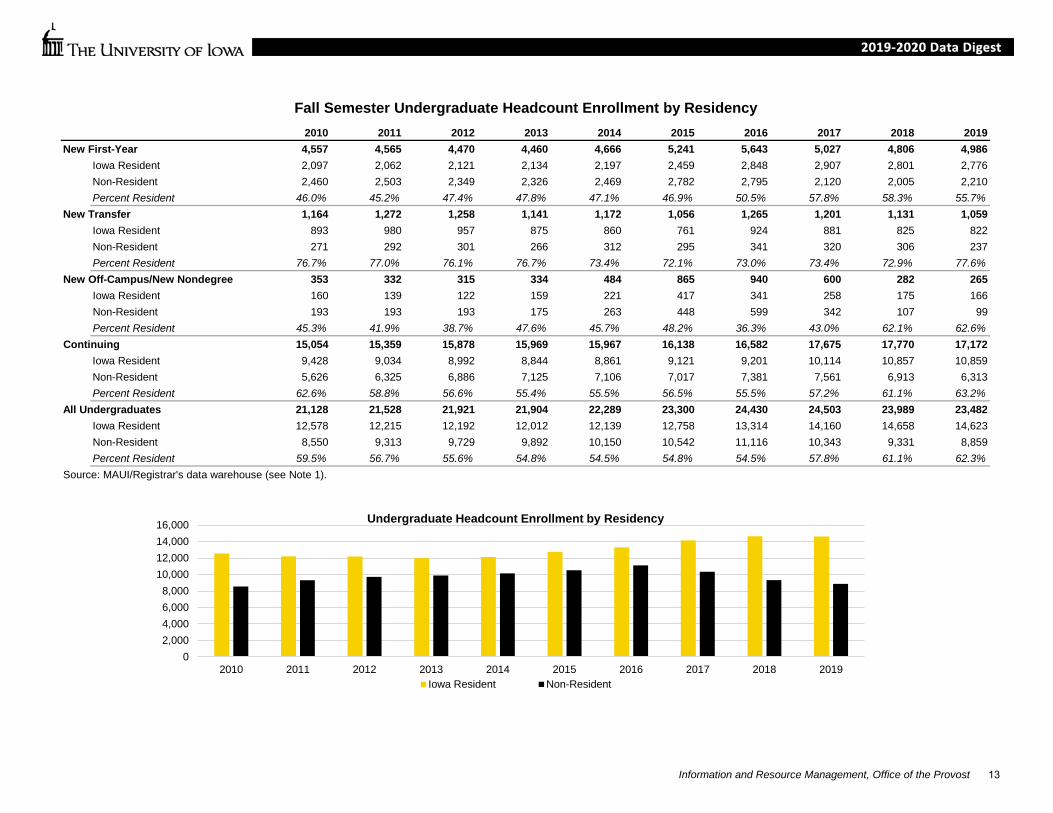
Fall Semester Undergraduate Headcount Enrollment by Residency2010 2011 2012 2013 2014 2015 2016 2017 2018 2019
New First-Year 4,557 4,565 4,470 4,460 4,666 5,241 5,643 5,027 4,806 4,986Iowa Resident 2,097 2,062 2,121 2,134 2,197 2,459 2,848 2,907 2,801 2,776Non-Resident 2,460 2,503 2,349 2,326 2,469 2,782 2,795 2,120 2,005 2,210Percent Resident 46.0% 45.2% 47.4% 47.8% 47.1% 46.9% 50.5% 57.8% 58.3% 55.7%
New Transfer 1,164 1,272 1,258 1,141 1,172 1,056 1,265 1,201 1,131 1,059Iowa Resident 893 980 957 875 860 761 924 881 825 822Non-Resident 271 292 301 266 312 295 341 320 306 237Percent Resident 76.7% 77.0% 76.1% 76.7% 73.4% 72.1% 73.0% 73.4% 72.9% 77.6%
New Off-Campus/New Nondegree 353 332 315 334 484 865 940 600 282 265Iowa Resident 160 139 122 159 221 417 341 258 175 166Non-Resident 193 193 193 175 263 448 599 342 107 99Percent Resident 45.3% 41.9% 38.7% 47.6% 45.7% 48.2% 36.3% 43.0% 62.1% 62.6%
Continuing 15,054 15,359 15,878 15,969 15,967 16,138 16,582 17,675 17,770 17,172Iowa Resident 9,428 9,034 8,992 8,844 8,861 9,121 9,201 10,114 10,857 10,859Non-Resident 5,626 6,325 6,886 7,125 7,106 7,017 7,381 7,561 6,913 6,313Percent Resident 62.6% 58.8% 56.6% 55.4% 55.5% 56.5% 55.5% 57.2% 61.1% 63.2%
All Undergraduates 21,128 21,528 21,921 21,904 22,289 23,300 24,430 24,503 23,989 23,482Iowa Resident 12,578 12,215 12,192 12,012 12,139 12,758 13,314 14,160 14,658 14,623Non-Resident 8,550 9,313 9,729 9,892 10,150 10,542 11,116 10,343 9,331 8,859Percent Resident 59.5% 56.7% 55.6% 54.8% 54.5% 54.8% 54.5% 57.8% 61.1% 62.3%
Source: MAUI/Registrar's data warehouse (see Note 1).
02,0004,0006,0008,000
10,00012,00014,00016,000
2010 2011 2012 2013 2014 2015 2016 2017 2018 2019
Undergraduate Headcount Enrollment by Residency
Iowa Resident Non-Resident
Information and Resource Management, Office of the Provost 13

Fall Semester Graduate Student Headcount Enrollment by Residency2010 2011 2012 2013 2014 2015 2016 2017 2018 2019
New Students 1,258 1,152 1,174 1,067 1,121 1,104 1,138 1,189 1,123 1,116Iowa Resident 415 384 394 405 438 401 420 464 440 430Non-Resident 843 768 780 662 683 703 718 725 683 686Percent Resident 33.0% 33.3% 33.6% 38.0% 39.1% 36.3% 36.9% 39.0% 39.2% 38.5%
UI Transfer Students 294 296 291 295 304 366 360 371 385 413Iowa Resident 235 243 240 240 228 300 296 293 296 310Non-Resident 59 53 51 55 76 66 64 78 89 103Percent Resident 79.9% 82.1% 82.5% 81.4% 75.0% 82.0% 82.2% 79.0% 76.9% 75.1%
Continuing Students 4,823 4,842 4,741 4,577 4,379 4,218 4,200 4,256 4,318 4,371Iowa Resident 2,232 2,193 2,234 2,036 1,952 1,904 1,953 2,013 2,118 2,149Non-Resident 2,591 2,649 2,507 2,541 2,427 2,314 2,247 2,243 2,200 2,222Percent Resident 46.3% 45.3% 47.1% 44.5% 44.6% 45.1% 46.5% 47.3% 49.1% 49.2%
All Graduate Students 6,375 6,290 6,206 5,939 5,804 5,688 5,698 5,816 5,826 5,900Iowa Resident 2,882 2,820 2,868 2,681 2,618 2,605 2,669 2,770 2,854 2,889Non-Resident 3,493 3,470 3,338 3,258 3,186 3,083 3,029 3,046 2,972 3,011Percent Resident 45.2% 44.8% 46.2% 45.1% 45.1% 45.8% 46.8% 47.6% 49.0% 49.0%
Source: MAUI/Registrar's data warehouse (see Note 1)
0%
10%
20%
30%
40%
50%
60%
2010 2011 2012 2013 2014 2015 2016 2017 2018 2019
Perc
ent
Percent of All Graduate StudentsWho are Non-Resident, by Fall Semester
Non-Resident International.
Information and Resource Management, Office of the Provost 14

Fall Semester Professional and Postgraduate Student Headcount Enrollment by Residency2010 2011 2012 2013 2014 2015 2016 2017 2018 2019
New Professional Students 356 337 283 230 298 308 299 300 316 297Iowa Resident 165 166 148 123 147 144 141 148 169 141Non-Resident 191 171 135 107 151 164 158 152 147 156Percent Resident 46.3% 49.3% 52.3% 53.5% 49.3% 46.8% 47.2% 49.3% 53.5% 47.5%
UI Transfer Professional Students 179 170 157 149 142 144 142 154 138 174Iowa Resident 166 152 138 127 117 121 126 132 122 138Non-Resident 13 18 19 22 25 23 16 22 16 36Percent Resident 92.7% 89.4% 87.9% 85.2% 82.4% 84.0% 88.7% 85.7% 88.4% 79.3%
Continuing Professional Students 1,431 1,448 1,483 1,456 1,372 1,347 1,396 1,393 1,387 1,387Iowa Resident 900 904 974 956 905 878 871 875 884 901Non-Resident 531 544 509 500 467 469 525 518 503 486Percent Resident 62.9% 62.4% 65.7% 65.7% 66.0% 65.2% 62.4% 62.8% 63.7% 65.0%
All Professional Students 1,966 1,955 1,923 1,835 1,812 1,799 1,837 1,847 1,841 1,858Iowa Resident 1,231 1,222 1,260 1,206 1,169 1,143 1,138 1,155 1,175 1,180Non-Resident 735 733 663 629 643 656 699 692 666 678Percent Resident 62.6% 62.5% 65.5% 65.7% 64.5% 63.5% 61.9% 62.5% 63.8% 63.5%
Postgraduate Students 1,308 1,372 1,370 1,318 1,417 1,306 1,323 1,398 1,292 1,295Iowa Resident 909 948 1,066 1,024 1,121 1,023 1,052 1,115 1,016 1,020Non-Resident 399 424 304 294 296 283 271 283 276 275Percent Resident 69.5% 69.1% 77.8% 77.7% 79.1% 78.3% 79.5% 79.8% 78.6% 78.8%
Source: MAUI/Registrar's data warehouse (see Note 1)
0
500
1,000
1,500
2,000
2,500
2010 2011 2012 2013 2014 2015 2016 2017 2018 2019
Hea
dcou
nt
Professional Students by Residencyin Fall Semesters
Non-Resident
Iowa Resident
.
0
200
400
600
800
1,000
1,200
1,400
1,600
2010 2011 2012 2013 2014 2015 2016 2017 2018 2019
Hea
dcou
nt
PostgraduateStudents by Residencyin Fall Semesters
Non-Resident
Iowa Resident
.
Information and Resource Management, Office of the Provost 15

2010 2011 2012 2013 2014 2015 2016 2017 2018 2019Undergraduate 21,128 21,528 21,921 21,904 22,289 23,300 24,430 24,503 23,989 23,482
Iowa 12,576 12,215 12,192 12,012 12,139 12,758 13,314 14,160 14,658 14,623States Adjoining Iowa 6,493 6,744 6,857 6,706 6,678 6,762 7,225 6,912 6,279 6,292Other States 821 873 891 988 1,030 1,177 1,402 1,354 1,267 1,295U.S. Territories 3 1 4 7 9 6 11 13 17 13Other Countries 1,235 1,695 1,977 2,191 2,433 2,597 2,478 2,064 1,768 1,259
Graduate 6,375 6,290 6,206 5,939 5,804 5,688 5,698 5,816 5,826 5,900Iowa 2,882 2,820 2,868 2,681 2,618 2,605 2,669 2,770 2,854 2,889States Adjoining Iowa 964 970 874 858 845 817 798 811 790 769Other States 1,285 1,295 1,247 1,203 1,129 1,093 1,118 1,187 1,181 1,233U.S. Territories 20 24 22 22 23 23 22 16 20 12Other Countries 1,224 1,181 1,195 1,175 1,189 1,150 1,091 1,032 981 997
Professional 1,966 1,955 1,923 1,835 1,812 1,799 1,837 1,847 1,841 1,858Iowa 1,231 1,222 1,260 1,206 1,169 1,143 1,138 1,155 1,175 1,180States Adjoining Iowa 363 352 316 302 297 288 300 300 277 289Other States 352 362 322 306 316 330 368 361 355 348U.S. Territories 0 0 0 1 1 2 4 3 3 4Other Countries 20 19 25 20 29 36 27 28 31 37
Postgraduate 1,308 1,372 1,370 1,318 1,417 1,306 1,323 1,398 1,292 1,295Iowa 909 948 1,066 1,024 1,121 1,023 1,052 1,115 1,016 1,020States Adjoining Iowa 25 22 0 0 0 0 0 0 0 0Other States 76 58 0 0 0 0 0 0 0 0U.S. Territories 0 0 0 0 0 0 0 0 0 0Other Countries 298 344 304 294 296 283 271 283 276 275
All Students 30,777 31,145 31,420 30,996 31,322 32,093 33,288 33,564 32,948 32,535Iowa 17,598 17,205 17,386 16,923 17,047 17,529 18,173 19,200 19,703 19,712States Adjoining Iowa 7,845 8,088 8,047 7,866 7,820 7,867 8,323 8,023 7,346 7,350Other States 2,534 2,588 2,460 2,497 2,475 2,600 2,888 2,902 2,803 2,876U.S. Territories 23 25 26 30 33 31 37 32 40 29Other Countries 2,777 3,239 3,501 3,680 3,947 4,066 3,867 3,407 3,056 2,568
Source: MAUI/Registrar's data warehouse (see Note 1). See note regarding differences in count of residents as compared to Heacount Enrollment by Residency.Note: International status, residency status, and residency state are derived from distinct fields in the student information system and were not perfectly aligned prior to MAUI implementation in fall 2013, resulting in small variations among reports that include residency and/or international status. See notes on Reporting Variations for detail.
Fall Semester Student Headcount Enrollment by Geographic Origin
Information and Resource Management, Office of the Provost 16

Fall Semester Headcount Enrollment by Full Time and Part TimeStudent Level 2010 2011 2012 2013 2014 2015 2016 2017 2018 2019Undergraduate Full Time 18,994 19,354 19,526 19,491 19,546 19,911 20,868 21,222 21,690 21,212
Part Time 2,134 2,174 2,395 2,413 2,743 3,389 3,562 3,281 2,299 2,270Freshman Full Time 5,410 5,528 5,322 5,397 5,327 5,788 6,123 5,445 5,311 5,251
Part Time 154 212 270 303 432 561 589 488 182 121Sophomore Full Time 4,276 4,357 4,597 4,417 4,477 4,446 5,012 5,370 4,940 4,826
Part Time 175 174 201 224 244 251 280 304 227 245Junior Full Time 4,556 4,830 4,831 4,845 4,811 4,774 4,800 5,463 5,736 5,272
Part Time 438 429 488 437 429 429 451 488 416 413Senior Full Time 4,520 4,443 4,586 4,616 4,750 4,702 4,744 4,788 5,556 5,728
Part Time 829 915 952 1,000 963 976 938 942 977 990Unclassified Full Time 232 196 190 216 181 201 189 156 147 135
Part Time 538 444 484 449 675 1,172 1,304 1,059 497 501Graduate Full Time 3,325 3,258 3,203 3,161 3,104 2,953 2,964 2,953 2,948 3,020
Part Time 3,050 3,032 3,003 2,778 2,700 2,735 2,734 2,863 2,878 2,880Master's Full Time 1,888 1,810 1,794 1,738 1,701 1,641 1,616 1,604 1,564 1,671
Part Time 1,113 1,105 993 954 960 969 1,041 1,241 1,296 1,410Doctoral Full Time 1,414 1,412 1,383 1,388 1,373 1,287 1,323 1,317 1,356 1,298
Part Time 1,458 1,461 1,511 1,396 1,262 1,289 1,179 1,110 1,027 1,065Other Full Time 23 36 26 35 30 25 25 32 28 51
Part Time 479 466 499 428 478 477 514 512 555 405Professional Full Time 1,867 1,841 1,825 1,752 1,743 1,729 1,761 1,766 1,745 1,768
Part Time 99 114 98 83 69 70 76 81 96 90Postgraduate Full Time 1,308 1,372 1,370 1,318 1,417 1,306 1,323 1,398 1,292 1,295
Part Time 0 0 0 0 0 0 0 0 0 0Total Full Time 25,494 25,825 25,924 25,722 25,810 25,899 26,916 27,339 27,675 27,295
Part Time 5,283 5,320 5,496 5,274 5,512 6,194 6,372 6,225 5,273 5,240Total 30,777 31,145 31,420 30,996 31,322 32,093 33,288 33,564 32,948 32,535
Source: MAUI/Registrar's data warehouse (see Note 1). continued
Information and Resource Management, Office of the Provost 17
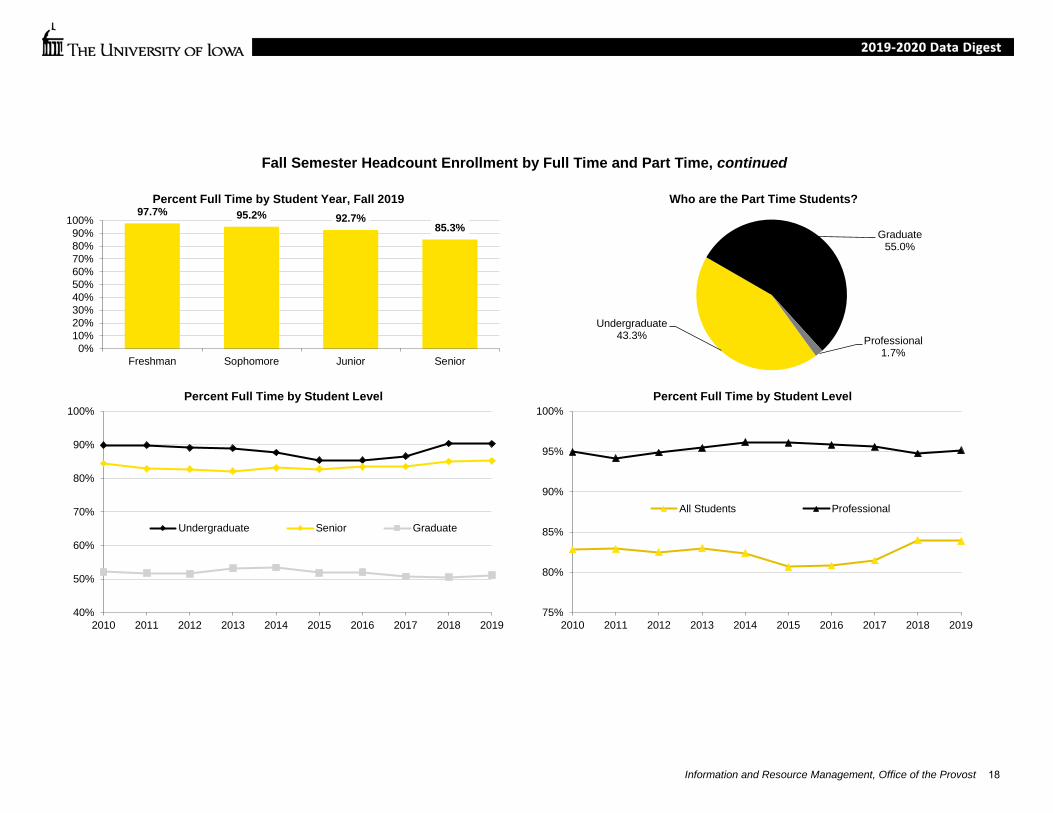
Fall Semester Headcount Enrollment by Full Time and Part Time, continued
40%
50%
60%
70%
80%
90%
100%
2010 2011 2012 2013 2014 2015 2016 2017 2018 2019
Percent Full Time by Student Level
Undergraduate Senior Graduate
Undergraduate43.3%
Graduate55.0%
Professional1.7%
Who are the Part Time Students?
75%
80%
85%
90%
95%
100%
2010 2011 2012 2013 2014 2015 2016 2017 2018 2019
Percent Full Time by Student Level
All Students Professional
97.7% 95.2% 92.7%85.3%
0%10%20%30%40%50%60%70%80%90%
100%
Freshman Sophomore Junior Senior
Percent Full Time by Student Year, Fall 2019
Information and Resource Management, Office of the Provost 18
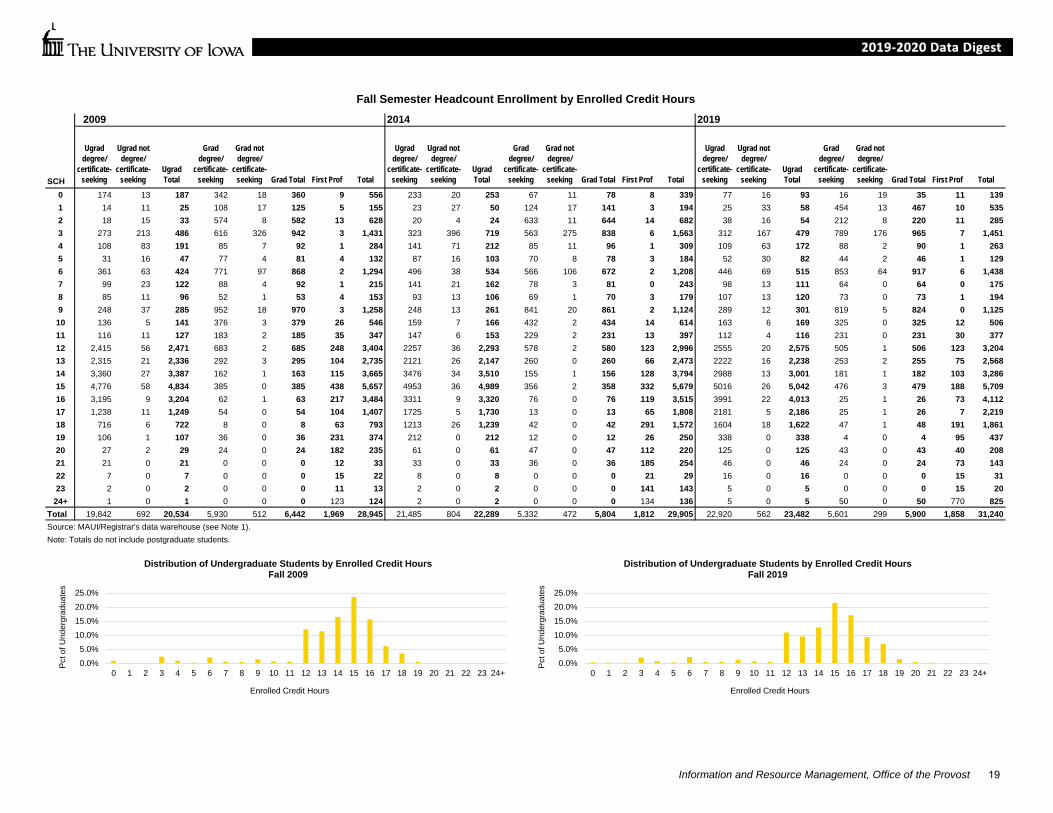
Fall Semester Headcount Enrollment by Enrolled Credit Hours2009 2014 2019
SCH
Ugrad degree/
certificate-seeking
Ugrad not degree/
certificate- seeking
Ugrad Total
Grad degree/
certificate-seeking
Grad not degree/
certificate-seeking Grad Total First Prof Total
Ugrad degree/
certificate-seeking
Ugrad not degree/
certificate- seeking
Ugrad Total
Grad degree/
certificate-seeking
Grad not degree/
certificate-seeking Grad Total First Prof Total
Ugrad degree/
certificate-seeking
Ugrad not degree/
certificate- seeking
Ugrad Total
Grad degree/
certificate-seeking
Grad not degree/
certificate-seeking Grad Total First Prof Total
0 174 13 187 342 18 360 9 556 233 20 253 67 11 78 8 339 77 16 93 16 19 35 11 1391 14 11 25 108 17 125 5 155 23 27 50 124 17 141 3 194 25 33 58 454 13 467 10 5352 18 15 33 574 8 582 13 628 20 4 24 633 11 644 14 682 38 16 54 212 8 220 11 2853 273 213 486 616 326 942 3 1,431 323 396 719 563 275 838 6 1,563 312 167 479 789 176 965 7 1,4514 108 83 191 85 7 92 1 284 141 71 212 85 11 96 1 309 109 63 172 88 2 90 1 2635 31 16 47 77 4 81 4 132 87 16 103 70 8 78 3 184 52 30 82 44 2 46 1 1296 361 63 424 771 97 868 2 1,294 496 38 534 566 106 672 2 1,208 446 69 515 853 64 917 6 1,4387 99 23 122 88 4 92 1 215 141 21 162 78 3 81 0 243 98 13 111 64 0 64 0 1758 85 11 96 52 1 53 4 153 93 13 106 69 1 70 3 179 107 13 120 73 0 73 1 1949 248 37 285 952 18 970 3 1,258 248 13 261 841 20 861 2 1,124 289 12 301 819 5 824 0 1,12510 136 5 141 376 3 379 26 546 159 7 166 432 2 434 14 614 163 6 169 325 0 325 12 50611 116 11 127 183 2 185 35 347 147 6 153 229 2 231 13 397 112 4 116 231 0 231 30 37712 2,415 56 2,471 683 2 685 248 3,404 2257 36 2,293 578 2 580 123 2,996 2555 20 2,575 505 1 506 123 3,20413 2,315 21 2,336 292 3 295 104 2,735 2121 26 2,147 260 0 260 66 2,473 2222 16 2,238 253 2 255 75 2,56814 3,360 27 3,387 162 1 163 115 3,665 3476 34 3,510 155 1 156 128 3,794 2988 13 3,001 181 1 182 103 3,28615 4,776 58 4,834 385 0 385 438 5,657 4953 36 4,989 356 2 358 332 5,679 5016 26 5,042 476 3 479 188 5,70916 3,195 9 3,204 62 1 63 217 3,484 3311 9 3,320 76 0 76 119 3,515 3991 22 4,013 25 1 26 73 4,11217 1,238 11 1,249 54 0 54 104 1,407 1725 5 1,730 13 0 13 65 1,808 2181 5 2,186 25 1 26 7 2,21918 716 6 722 8 0 8 63 793 1213 26 1,239 42 0 42 291 1,572 1604 18 1,622 47 1 48 191 1,86119 106 1 107 36 0 36 231 374 212 0 212 12 0 12 26 250 338 0 338 4 0 4 95 43720 27 2 29 24 0 24 182 235 61 0 61 47 0 47 112 220 125 0 125 43 0 43 40 20821 21 0 21 0 0 0 12 33 33 0 33 36 0 36 185 254 46 0 46 24 0 24 73 14322 7 0 7 0 0 0 15 22 8 0 8 0 0 0 21 29 16 0 16 0 0 0 15 3123 2 0 2 0 0 0 11 13 2 0 2 0 0 0 141 143 5 0 5 0 0 0 15 20
24+ 1 0 1 0 0 0 123 124 2 0 2 0 0 0 134 136 5 0 5 50 0 50 770 825Total 19,842 692 20,534 5,930 512 6,442 1,969 28,945 21,485 804 22,289 5,332 472 5,804 1,812 29,905 22,920 562 23,482 5,601 299 5,900 1,858 31,240Source: MAUI/Registrar's data warehouse (see Note 1).Note: Totals do not include postgraduate students.
0.0%5.0%
10.0%15.0%20.0%25.0%
0 1 2 3 4 5 6 7 8 9 10 11 12 13 14 15 16 17 18 19 20 21 22 23 24+
Pct o
f Und
ergr
adua
tes
Enrolled Credit Hours
Distribution of Undergraduate Students by Enrolled Credit HoursFall 2019
0.0%5.0%
10.0%15.0%20.0%25.0%
0 1 2 3 4 5 6 7 8 9 10 11 12 13 14 15 16 17 18 19 20 21 22 23 24+
Pct o
f Und
ergr
adua
tes
Enrolled Credit Hours
Distribution of Undergraduate Students by Enrolled Credit HoursFall 2009
Information and Resource Management, Office of the Provost 19
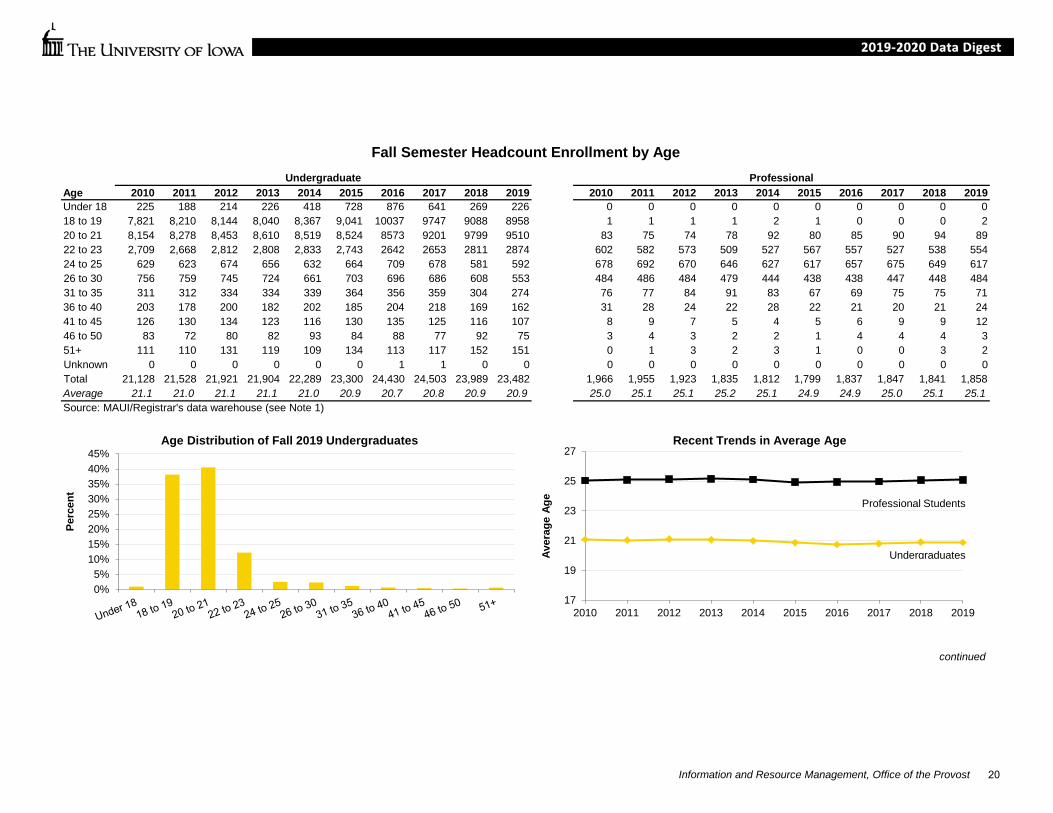
Fall Semester Headcount Enrollment by Age
Age 2010 2011 2012 2013 2014 2015 2016 2017 2018 2019 2010 2011 2012 2013 2014 2015 2016 2017 2018 2019Under 18 225 188 214 226 418 728 876 641 269 226 0 0 0 0 0 0 0 0 0 018 to 19 7,821 8,210 8,144 8,040 8,367 9,041 10037 9747 9088 8958 1 1 1 1 2 1 0 0 0 220 to 21 8,154 8,278 8,453 8,610 8,519 8,524 8573 9201 9799 9510 83 75 74 78 92 80 85 90 94 8922 to 23 2,709 2,668 2,812 2,808 2,833 2,743 2642 2653 2811 2874 602 582 573 509 527 567 557 527 538 55424 to 25 629 623 674 656 632 664 709 678 581 592 678 692 670 646 627 617 657 675 649 61726 to 30 756 759 745 724 661 703 696 686 608 553 484 486 484 479 444 438 438 447 448 48431 to 35 311 312 334 334 339 364 356 359 304 274 76 77 84 91 83 67 69 75 75 7136 to 40 203 178 200 182 202 185 204 218 169 162 31 28 24 22 28 22 21 20 21 2441 to 45 126 130 134 123 116 130 135 125 116 107 8 9 7 5 4 5 6 9 9 1246 to 50 83 72 80 82 93 84 88 77 92 75 3 4 3 2 2 1 4 4 4 351+ 111 110 131 119 109 134 113 117 152 151 0 1 3 2 3 1 0 0 3 2Unknown 0 0 0 0 0 0 1 1 0 0 0 0 0 0 0 0 0 0 0 0Total 21,128 21,528 21,921 21,904 22,289 23,300 24,430 24,503 23,989 23,482 1,966 1,955 1,923 1,835 1,812 1,799 1,837 1,847 1,841 1,858Average 21.1 21.0 21.1 21.1 21.0 20.9 20.7 20.8 20.9 20.9 25.0 25.1 25.1 25.2 25.1 24.9 24.9 25.0 25.1 25.1Source: MAUI/Registrar's data warehouse (see Note 1)
continued
Undergraduate Professional
17
19
21
23
25
27
2010 2011 2012 2013 2014 2015 2016 2017 2018 2019
Aver
age
Age
Recent Trends in Average Age
0%5%
10%15%20%25%30%35%40%45%
Perc
ent
Age Distribution of Fall 2019 Undergraduates
Undergraduates
Professional Students
Information and Resource Management, Office of the Provost 20
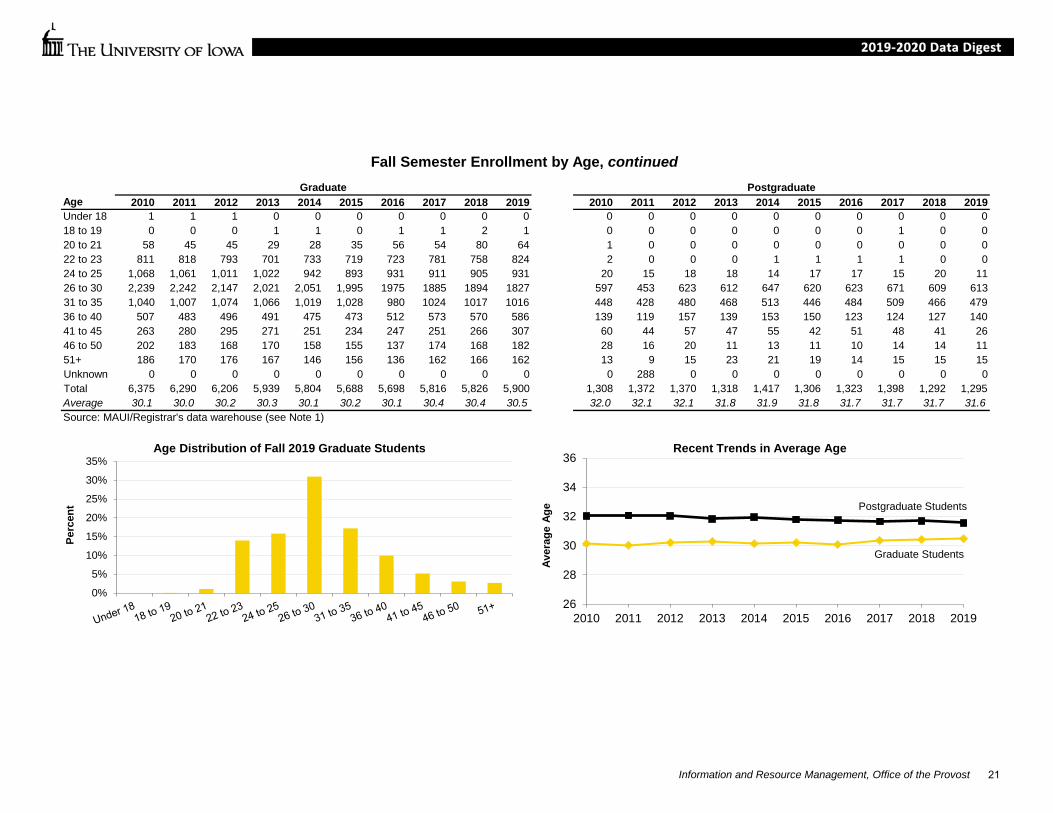
Fall Semester Enrollment by Age, continued
Age 2010 2011 2012 2013 2014 2015 2016 2017 2018 2019 2010 2011 2012 2013 2014 2015 2016 2017 2018 2019Under 18 1 1 1 0 0 0 0 0 0 0 0 0 0 0 0 0 0 0 0 018 to 19 0 0 0 1 1 0 1 1 2 1 0 0 0 0 0 0 0 1 0 020 to 21 58 45 45 29 28 35 56 54 80 64 1 0 0 0 0 0 0 0 0 022 to 23 811 818 793 701 733 719 723 781 758 824 2 0 0 0 1 1 1 1 0 024 to 25 1,068 1,061 1,011 1,022 942 893 931 911 905 931 20 15 18 18 14 17 17 15 20 1126 to 30 2,239 2,242 2,147 2,021 2,051 1,995 1975 1885 1894 1827 597 453 623 612 647 620 623 671 609 61331 to 35 1,040 1,007 1,074 1,066 1,019 1,028 980 1024 1017 1016 448 428 480 468 513 446 484 509 466 47936 to 40 507 483 496 491 475 473 512 573 570 586 139 119 157 139 153 150 123 124 127 14041 to 45 263 280 295 271 251 234 247 251 266 307 60 44 57 47 55 42 51 48 41 2646 to 50 202 183 168 170 158 155 137 174 168 182 28 16 20 11 13 11 10 14 14 1151+ 186 170 176 167 146 156 136 162 166 162 13 9 15 23 21 19 14 15 15 15Unknown 0 0 0 0 0 0 0 0 0 0 0 288 0 0 0 0 0 0 0 0Total 6,375 6,290 6,206 5,939 5,804 5,688 5,698 5,816 5,826 5,900 1,308 1,372 1,370 1,318 1,417 1,306 1,323 1,398 1,292 1,295Average 30.1 30.0 30.2 30.3 30.1 30.2 30.1 30.4 30.4 30.5 32.0 32.1 32.1 31.8 31.9 31.8 31.7 31.7 31.7 31.6Source: MAUI/Registrar's data warehouse (see Note 1)
Graduate Postgraduate
26
28
30
32
34
36
2010 2011 2012 2013 2014 2015 2016 2017 2018 2019
Aver
age
Age
Recent Trends in Average Age
0%
5%
10%
15%
20%
25%
30%
35%
Perc
ent
Age Distribution of Fall 2019 Graduate Students
Postgraduate Students
Graduate Students
Information and Resource Management, Office of the Provost 21

Fall Semester Undergraduate Headcount Enrollment by First Generation Status and GenderFirst Generation Status 2013 2014 2015 2016 2017 2018 2019
First-Generation 3,112 4,311 5,205 5,717 5,760 5,610 5,386 Men 1,319 1,849 2,236 2,424 2,425 2,346 2,231 Women 1,792 2,457 2,961 3,282 3,323 3,247 3,134 Prefer Not to Answer/Other 1 5 8 11 12 17 21 Percent Women 57.6% 57.0% 56.9% 57.4% 57.7% 57.9% 58.2%
Not First-Generation 18,792 17,978 18,095 18,713 18,743 18,379 18,096Men 9,185 8,894 8,941 9,129 9,087 8,789 8,553 Women 9,606 9,079 9,142 9,549 9,619 9,551 9,469 Prefer Not to Answer/Other 1 5 12 35 37 39 74 Percent Women 51.1% 50.5% 50.5% 51.0% 51.3% 52.0% 52.3%
Total 21,904 22,289 23,300 24,430 24,503 23,989 23,482 Men 10,504 10,743 11,177 11,553 11,512 11,135 10,784 Women 11,398 11,536 12,103 12,831 12,942 12,798 12,603 Prefer Not to Answer/Other 2 10 20 46 49 56 95 Percent Women 52.0% 51.8% 51.9% 52.5% 52.8% 53.3% 53.7%Percent First-Generation 14.2% 19.3% 22.3% 23.4% 23.5% 23.4% 22.9%
Source: MAUI/Registrar's data warehouse (see Note 1). Note: "Prefer Not to Answer/Other" includes all students who chose not to identify their sex as either male or female, whether by selecting "transgender" (or not reporting)in fall 2013 through fall 2015, or by selecting "prefer not to answer" starting in fall 2016. See Note 5 regarding change in gender reporting effective 2016."Not First-Generation" includes international students, who are not asked to report first-generation status.
46%48%50%52%54%56%58%60%
2013 2014 2015 2016 2017 2018 2019
Women as a Percentage of Undergraduate Students
First-Generation Not First-Generation Total
Information and Resource Management, Office of the Provost 22
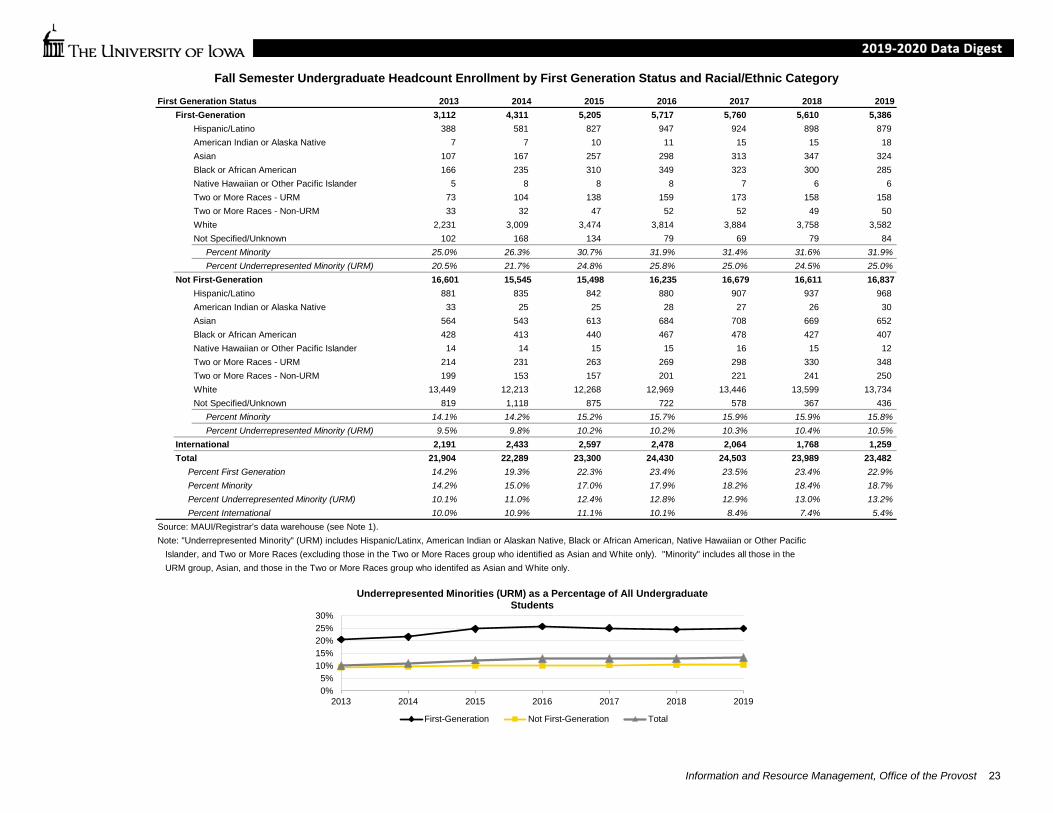
Fall Semester Undergraduate Headcount Enrollment by First Generation Status and Racial/Ethnic Category
First Generation Status 2013 2014 2015 2016 2017 2018 2019First-Generation 3,112 4,311 5,205 5,717 5,760 5,610 5,386
Hispanic/Latino 388 581 827 947 924 898 879 American Indian or Alaska Native 7 7 10 11 15 15 18 Asian 107 167 257 298 313 347 324 Black or African American 166 235 310 349 323 300 285 Native Hawaiian or Other Pacific Islander 5 8 8 8 7 6 6 Two or More Races - URM 73 104 138 159 173 158 158 Two or More Races - Non-URM 33 32 47 52 52 49 50 White 2,231 3,009 3,474 3,814 3,884 3,758 3,582 Not Specified/Unknown 102 168 134 79 69 79 84
Percent Minority 25.0% 26.3% 30.7% 31.9% 31.4% 31.6% 31.9%Percent Underrepresented Minority (URM) 20.5% 21.7% 24.8% 25.8% 25.0% 24.5% 25.0%
Not First-Generation 16,601 15,545 15,498 16,235 16,679 16,611 16,837Hispanic/Latino 881 835 842 880 907 937 968 American Indian or Alaska Native 33 25 25 28 27 26 30 Asian 564 543 613 684 708 669 652 Black or African American 428 413 440 467 478 427 407 Native Hawaiian or Other Pacific Islander 14 14 15 15 16 15 12 Two or More Races - URM 214 231 263 269 298 330 348 Two or More Races - Non-URM 199 153 157 201 221 241 250 White 13,449 12,213 12,268 12,969 13,446 13,599 13,734 Not Specified/Unknown 819 1,118 875 722 578 367 436
Percent Minority 14.1% 14.2% 15.2% 15.7% 15.9% 15.9% 15.8%Percent Underrepresented Minority (URM) 9.5% 9.8% 10.2% 10.2% 10.3% 10.4% 10.5%
International 2,191 2,433 2,597 2,478 2,064 1,768 1,259 Total 21,904 22,289 23,300 24,430 24,503 23,989 23,482
Percent First Generation 14.2% 19.3% 22.3% 23.4% 23.5% 23.4% 22.9%Percent Minority 14.2% 15.0% 17.0% 17.9% 18.2% 18.4% 18.7%Percent Underrepresented Minority (URM) 10.1% 11.0% 12.4% 12.8% 12.9% 13.0% 13.2%Percent International 10.0% 10.9% 11.1% 10.1% 8.4% 7.4% 5.4%
Source: MAUI/Registrar's data warehouse (see Note 1). Note: "Underrepresented Minority" (URM) includes Hispanic/Latinx, American Indian or Alaskan Native, Black or African American, Native Hawaiian or Other Pacific Islander, and Two or More Races (excluding those in the Two or More Races group who identified as Asian and White only). "Minority" includes all those in the URM group, Asian, and those in the Two or More Races group who identifed as Asian and White only.
0%5%
10%15%20%25%30%
2013 2014 2015 2016 2017 2018 2019
Underrepresented Minorities (URM) as a Percentage of All Undergraduate Students
First-Generation Not First-Generation Total
Information and Resource Management, Office of the Provost 23
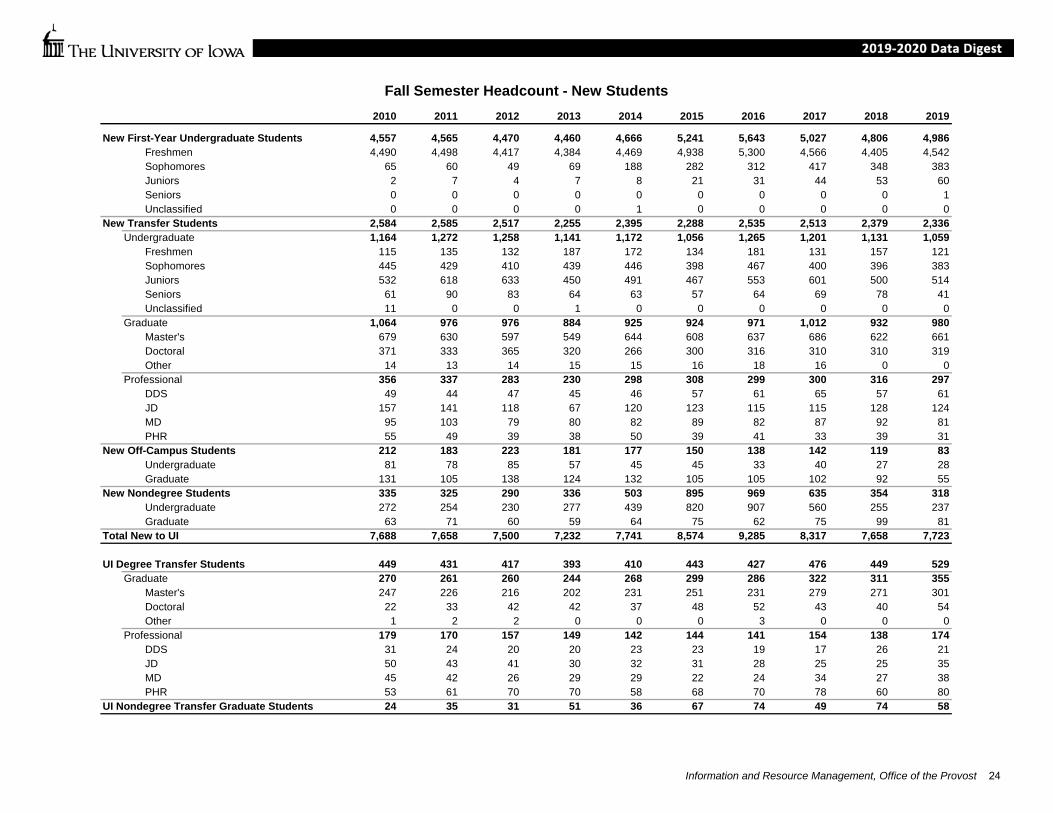
Fall Semester Headcount - New Students2010 2011 2012 2013 2014 2015 2016 2017 2018 2019
New First-Year Undergraduate Students 4,557 4,565 4,470 4,460 4,666 5,241 5,643 5,027 4,806 4,986Freshmen 4,490 4,498 4,417 4,384 4,469 4,938 5,300 4,566 4,405 4,542Sophomores 65 60 49 69 188 282 312 417 348 383Juniors 2 7 4 7 8 21 31 44 53 60Seniors 0 0 0 0 0 0 0 0 0 1Unclassified 0 0 0 0 1 0 0 0 0 0
New Transfer Students 2,584 2,585 2,517 2,255 2,395 2,288 2,535 2,513 2,379 2,336Undergraduate 1,164 1,272 1,258 1,141 1,172 1,056 1,265 1,201 1,131 1,059
Freshmen 115 135 132 187 172 134 181 131 157 121Sophomores 445 429 410 439 446 398 467 400 396 383Juniors 532 618 633 450 491 467 553 601 500 514Seniors 61 90 83 64 63 57 64 69 78 41Unclassified 11 0 0 1 0 0 0 0 0 0
Graduate 1,064 976 976 884 925 924 971 1,012 932 980Master's 679 630 597 549 644 608 637 686 622 661Doctoral 371 333 365 320 266 300 316 310 310 319Other 14 13 14 15 15 16 18 16 0 0
Professional 356 337 283 230 298 308 299 300 316 297DDS 49 44 47 45 46 57 61 65 57 61JD 157 141 118 67 120 123 115 115 128 124MD 95 103 79 80 82 89 82 87 92 81PHR 55 49 39 38 50 39 41 33 39 31
New Off-Campus Students 212 183 223 181 177 150 138 142 119 83Undergraduate 81 78 85 57 45 45 33 40 27 28Graduate 131 105 138 124 132 105 105 102 92 55
New Nondegree Students 335 325 290 336 503 895 969 635 354 318Undergraduate 272 254 230 277 439 820 907 560 255 237Graduate 63 71 60 59 64 75 62 75 99 81
Total New to UI 7,688 7,658 7,500 7,232 7,741 8,574 9,285 8,317 7,658 7,723
UI Degree Transfer Students 449 431 417 393 410 443 427 476 449 529Graduate 270 261 260 244 268 299 286 322 311 355
Master's 247 226 216 202 231 251 231 279 271 301Doctoral 22 33 42 42 37 48 52 43 40 54Other 1 2 2 0 0 0 3 0 0 0
Professional 179 170 157 149 142 144 141 154 138 174DDS 31 24 20 20 23 23 19 17 26 21JD 50 43 41 30 32 31 28 25 25 35MD 45 42 26 29 29 22 24 34 27 38PHR 53 61 70 70 58 68 70 78 60 80
UI Nondegree Transfer Graduate Students 24 35 31 51 36 67 74 49 74 58
Information and Resource Management, Office of the Provost 24

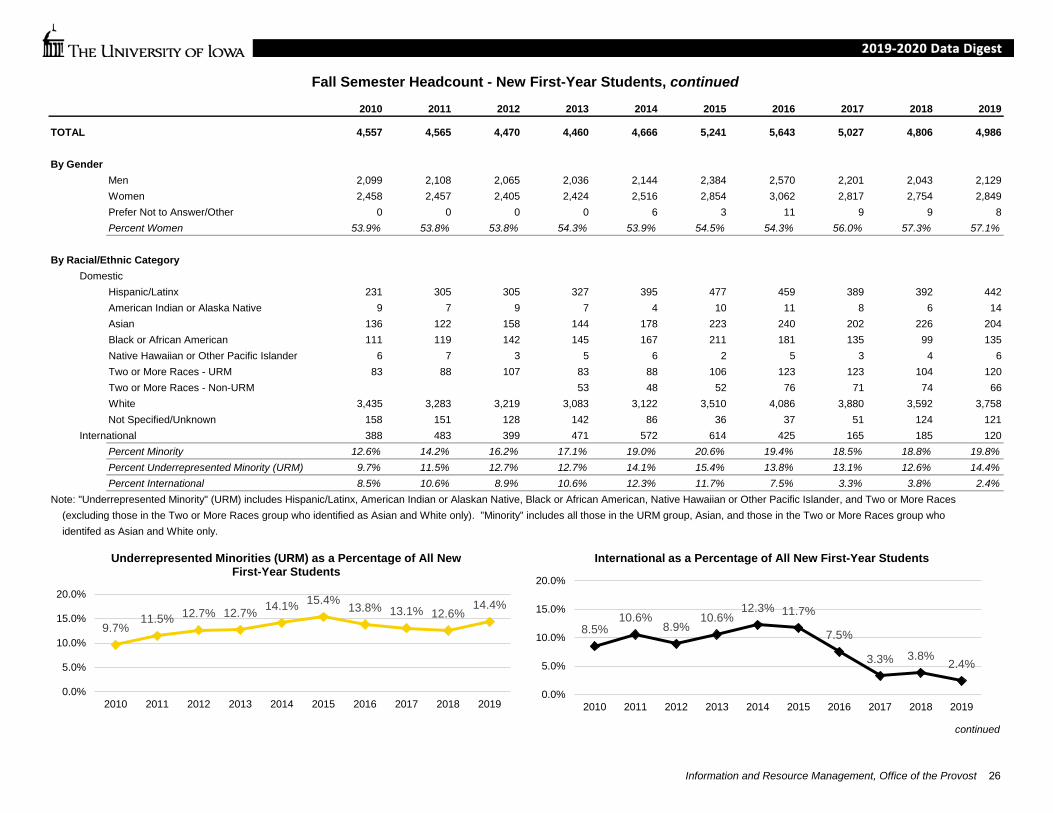
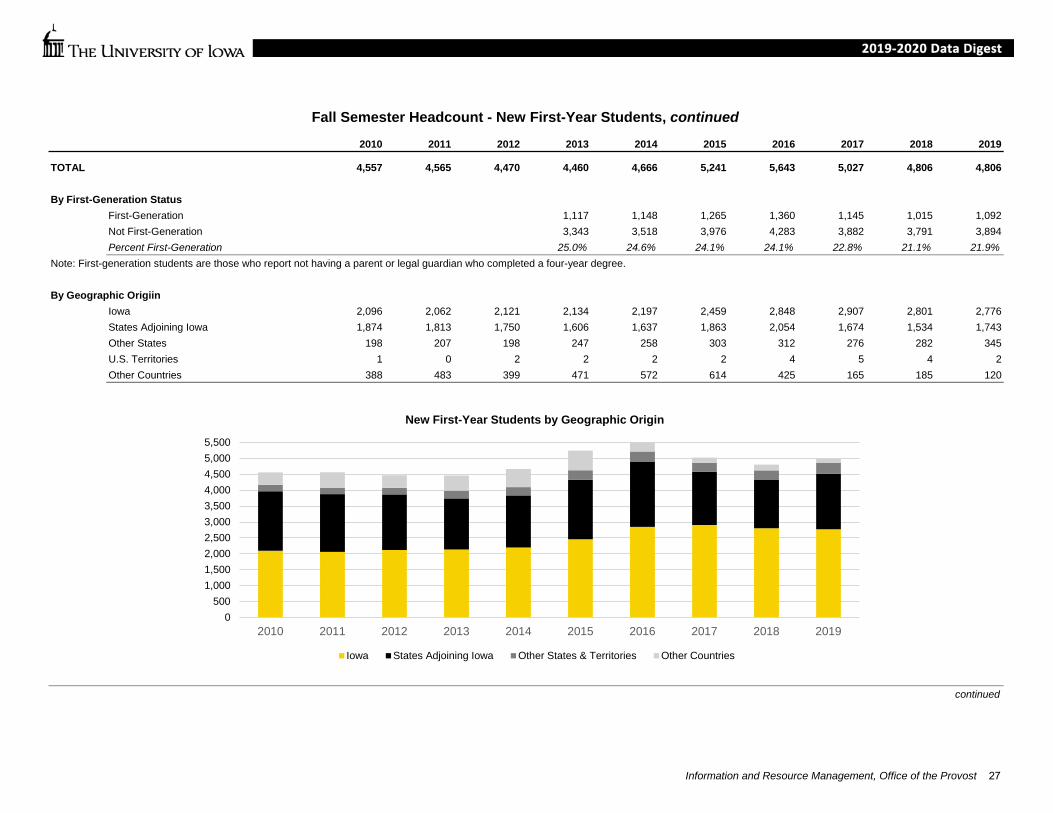
Fall Semester Headcount - New First-Year Students2010 2011 2012 2013 2014 2015 2016 2017 2018 2019
TOTAL 4,557 4,565 4,470 4,460 4,666 5,241 5,643 5,027 4,806 4,986
By CollegeLiberal Arts & Sciences 3,905 3,925 3,814 3,738 3,811 4,208 4,419 3,942 3,705 3,868Tippie College of Business 139 162 169 193 277 399 492 479 490 507Education 0 0 0 0 0 0 0 14 16 11Engineering 459 430 437 465 514 561 629 485 466 498Nursing 54 48 50 64 64 73 71 72 79 81Public Health 0 0 0 0 0 0 32 35 50 21
By Full- or Part-TimeFull-Time 4,457 4,433 4,293 4,270 4,347 4,848 5,226 4,709 4,726 4,925Part-Time 100 132 177 190 319 393 417 318 80 61Percent Full-Time 97.8% 97.1% 96.0% 95.7% 93.2% 92.5% 92.6% 93.7% 98.3% 98.8%
By ResidencyIowa Resident 2,097 2,062 2,121 2,134 2,197 2,459 2,848 2,907 2,801 2,776Non-Resident 2,460 2,503 2,349 2,326 2,469 2,782 2,795 2,120 2,005 2,210Percent Resident 46.0% 45.2% 47.4% 47.8% 47.1% 46.9% 50.5% 57.8% 58.3% 55.7%
continued
Liberal Arts & Sciences
85.7%
Tippie College of Business
3.1%
Engineering10.1%
Nursing1.2%
Fall 2010 Headcount Enrollment of New First-Year Students
Liberal Arts & Sciences
77.6%
Tippie College of Business
10.2% Education0.2%
Engineering10.0%
Nursing1.6%
Public Health0.4%
Fall 2019 Headcount Enrollment of New First-Year Students
Information and Resource Management, Office of the Provost 25
Fall Semester Headcount - New First-Year Students, continued
2010 2011 2012 2013 2014 2015 2016 2017 2018 2019
TOTAL 4,557 4,565 4,470 4,460 4,666 5,241 5,643 5,027 4,806 4,986
By GenderMen 2,099 2,108 2,065 2,036 2,144 2,384 2,570 2,201 2,043 2,129Women 2,458 2,457 2,405 2,424 2,516 2,854 3,062 2,817 2,754 2,849Prefer Not to Answer/Other 0 0 0 0 6 3 11 9 9 8Percent Women 53.9% 53.8% 53.8% 54.3% 53.9% 54.5% 54.3% 56.0% 57.3% 57.1%
By Racial/Ethnic CategoryDomestic
Hispanic/Latinx 231 305 305 327 395 477 459 389 392 442American Indian or Alaska Native 9 7 9 7 4 10 11 8 6 14Asian 136 122 158 144 178 223 240 202 226 204Black or African American 111 119 142 145 167 211 181 135 99 135Native Hawaiian or Other Pacific Islander 6 7 3 5 6 2 5 3 4 6Two or More Races - URM 83 88 107 83 88 106 123 123 104 120Two or More Races - Non-URM 53 48 52 76 71 74 66White 3,435 3,283 3,219 3,083 3,122 3,510 4,086 3,880 3,592 3,758Not Specified/Unknown 158 151 128 142 86 36 37 51 124 121
International 388 483 399 471 572 614 425 165 185 120Percent Minority 12.6% 14.2% 16.2% 17.1% 19.0% 20.6% 19.4% 18.5% 18.8% 19.8%Percent Underrepresented Minority (URM) 9.7% 11.5% 12.7% 12.7% 14.1% 15.4% 13.8% 13.1% 12.6% 14.4%Percent International 8.5% 10.6% 8.9% 10.6% 12.3% 11.7% 7.5% 3.3% 3.8% 2.4%
Note: "Underrepresented Minority" (URM) includes Hispanic/Latinx, American Indian or Alaskan Native, Black or African American, Native Hawaiian or Other Pacific Islander, and Two or More Races (excluding those in the Two or More Races group who identified as Asian and White only). "Minority" includes all those in the URM group, Asian, and those in the Two or More Races group who identifed as Asian and White only.
continued
9.7%11.5% 12.7% 12.7% 14.1% 15.4% 13.8% 13.1% 12.6%
14.4%
0.0%
5.0%
10.0%
15.0%
20.0%
2010 2011 2012 2013 2014 2015 2016 2017 2018 2019
Underrepresented Minorities (URM) as a Percentage of All New First-Year Students
8.5%10.6%
8.9%10.6%
12.3% 11.7%
7.5%
3.3% 3.8%2.4%
0.0%
5.0%
10.0%
15.0%
20.0%
2010 2011 2012 2013 2014 2015 2016 2017 2018 2019
International as a Percentage of All New First-Year Students
Information and Resource Management, Office of the Provost 26
Fall Semester Headcount - New First-Year Students, continued
2010 2011 2012 2013 2014 2015 2016 2017 2018 2019
TOTAL 4,557 4,565 4,470 4,460 4,666 5,241 5,643 5,027 4,806 4,806
By First-Generation StatusFirst-Generation 1,117 1,148 1,265 1,360 1,145 1,015 1,092Not First-Generation 3,343 3,518 3,976 4,283 3,882 3,791 3,894Percent First-Generation 25.0% 24.6% 24.1% 24.1% 22.8% 21.1% 21.9%
Note: First-generation students are those who report not having a parent or legal guardian who completed a four-year degree.
By Geographic OrigiinIowa 2,096 2,062 2,121 2,134 2,197 2,459 2,848 2,907 2,801 2,776States Adjoining Iowa 1,874 1,813 1,750 1,606 1,637 1,863 2,054 1,674 1,534 1,743Other States 198 207 198 247 258 303 312 276 282 345U.S. Territories 1 0 2 2 2 2 4 5 4 2Other Countries 388 483 399 471 572 614 425 165 185 120
continued
0500
1,0001,5002,0002,5003,0003,5004,0004,5005,0005,500
2010 2011 2012 2013 2014 2015 2016 2017 2018 2019
New First-Year Students by Geographic Origin
Iowa States Adjoining Iowa Other States & Territories Other Countries
Information and Resource Management, Office of the Provost 27

Fall Semester Headcount - New First-Year Students, continued
2010 2011 2012 2013 2014 2015 2016 2017 2018 2019
TOTAL 4,557 4,565 4,470 4,460 4,666 5,241 5,643 5,029 4,806 4,806
By Enrolled Credit Hours0 37 74 62 49 137 138 69 3 10 141 to 11 63 58 115 131 182 255 348 315 70 4712 183 108 127 172 143 70 150 104 118 9713 320 255 282 261 283 127 205 184 220 18214 899 899 1,056 952 982 472 598 515 599 58615 1,519 1,623 1,412 1,390 1,354 1,142 1,254 1,094 1,154 1,21016 994 1,069 932 987 928 1,374 1,334 1,261 1,234 1,31317 368 344 337 357 441 944 925 904 794 83318 149 116 116 135 179 509 526 455 424 46219 22 17 29 21 25 167 170 145 144 16420+ 3 2 2 5 12 43 64 47 39 78
0.0%
10.0%
20.0%
30.0%
40.0%
0 1 to 11 12 13 14 15 16 17 18 19 20+
Pct o
f New
Stu
dent
s
Enrolled Credit Hours
Distribution of New First-Year Students by Enrolled Credit Hours - Fall 2010
0.0%
10.0%
20.0%
30.0%
40.0%
0 1 to 11 12 13 14 15 16 17 18 19 20+
Pct o
f New
Stu
dent
s
Enrolled Credit Hours
Distribution of New First-Year Students by Enrolled Credit Hours - Fall 2019
Information and Resource Management, Office of the Provost 28

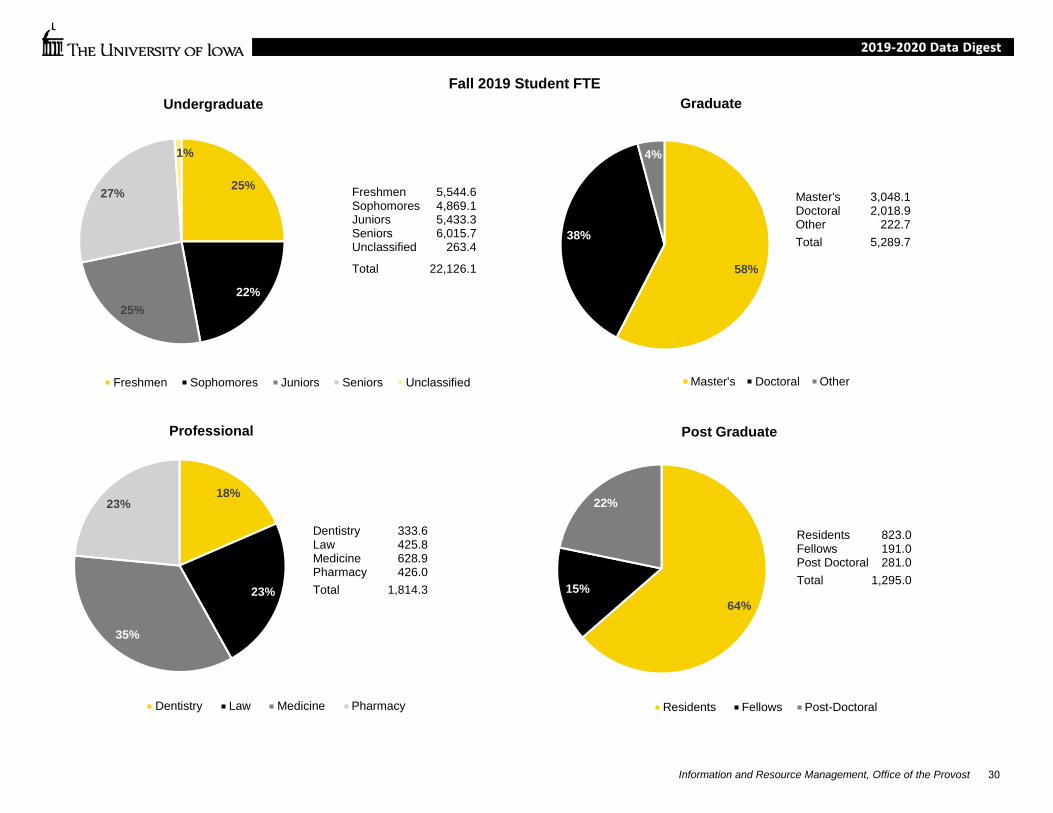
Fall Semester Student FTE by Student LevelStudent Level 2010 2011 2012 2013 2014 2015 2016 2017 2018 2019Undergraduate 19,442.8 19,870.3 20,097.9 20,183.1 20,329.8 21,148.6 22,093.5 22,472.0 22,589.5 22,126.1
Freshmen 5,456.3 5,605.1 5,402.7 5,500.6 5,464.1 6,238.2 6,563.7 5,869.1 5,585.3 5,544.6Sophomores 4,279.2 4,373.6 4,638.1 4,466.8 4,544.1 4,530.4 5,111.5 5,488.9 4,981.7 4,869.1Juniors 4,655.7 4,926.5 4,945.4 4,997.1 4,957.8 4,961.2 4,989.4 5,686.3 5,895.9 5,433.3Seniors 4,694.7 4,673.5 4,821.7 4,911.1 5,029.6 5,009.1 5,024.3 5,075.0 5,851.2 6,015.7Unclassified 357.0 291.7 290.0 307.4 334.3 409.7 404.6 352.7 275.4 263.4
Graduate 5,527.0 5,435.2 5,409.3 5,238.9 5,161.7 4,945.2 5,012.1 5,083.8 5,155.6 5,289.7Master's 3,078.7 2,966.9 2,920.1 2,776.5 2,773.8 2,725.9 2,747.8 2,832.4 2,837.4 3,048.1Doctoral 2,239.9 2,248.2 2,265.6 2,252.1 2,167.6 2,000.7 2,021.2 2,010.3 2,065.9 2,018.9Other 208.4 220.1 223.6 210.3 220.4 218.6 243.0 241.1 252.3 222.7
Professional 1,928.6 1,907.0 1,878.2 1,790.8 1,776.8 1,758.8 1,795.7 1,801.2 1,791.0 1,814.3Dentistry (DDS) 312.8 311.1 315.8 320.1 325.0 318.3 321.3 324.8 330.1 333.6Law (JD) 568.9 549.4 519.7 415.4 388.3 388.3 422.8 414.4 415.2 425.8Medicine (MD) 608.8 605.6 607.8 624.3 633.4 624.2 623.6 630.9 621.0 628.9Pharmacy (PharmD) 438.0 440.9 435.0 431.0 430.0 428.0 428.0 431.0 424.7 426.0
Postgraduate 1,308.0 1,372.0 1,370.0 1,318.0 1,417.0 1,306.0 1,323.0 1,398.0 1,292.0 1,295.0Residents 782.0 801.0 817.0 799.0 862.0 783.0 822.0 906.0 806.0 823.0Fellows 197.0 205.0 206.0 189.0 195.0 176.0 185.0 195.0 195.0 191.0Post-Doctoral 329.0 366.0 347.0 330.0 360.0 347.0 316.0 297.0 291.0 281.0
Total 28,206.4 28,584.5 28,755.4 28,530.7 28,685.3 29,158.6 30,224.2 30,755.0 30,828.1 30,525.1Percent Undergraduate 68.9% 69.5% 69.9% 70.7% 70.9% 72.5% 73.1% 73.1% 73.3% 72.5%Percent Graduate 19.6% 19.0% 18.8% 18.4% 18.0% 17.0% 16.6% 16.5% 16.7% 17.3%Percent Professional 6.8% 6.7% 6.5% 6.3% 6.2% 6.0% 5.9% 5.9% 5.8% 5.9%Percent Postgraduate 4.6% 4.8% 4.8% 4.6% 4.9% 4.5% 4.4% 4.5% 4.2% 4.2%Source: MAUI/Registrar's data warehouse (see Note 1). See Definitions for calculation of student FTE.
Under-graduate
73%
Graduate17%
Professional6%
Postgraduate4%
Student FTE by Student LevelFall 2019
-10%
-5%
0%
5%
10%
2010 2011 2012 2013 2014 2015 2016 2017 2018 2019
Perc
ent
Annual Percent Change in FTE
Undergraduate Graduate Professional
Information and Resource Management, Office of the Provost 29
25%
22%25%
27%
1%
Undergraduate
Freshmen Sophomores Juniors Seniors Unclassified
58%
38%
4%
Graduate
Master's Doctoral Other
Master's 3,048.1Doctoral 2,018.9Other 222.7Total 5,289.7
18%
23%
35%
23%
Professional
Dentistry Law Medicine Pharmacy
Dentistry 333.6Law 425.8Medicine 628.9Pharmacy 426.0Total 1,814.3
64%15%
22%
Post Graduate
Residents Fellows Post-Doctoral
Residents 823.0Fellows 191.0 Post Doctoral 281.0Total 1,295.0
Freshmen 5,544.6 Sophomores 4,869.1Juniors 5,433.3Seniors 6,015.7Unclassified 263.4
Total 22,126.1
Fall 2019 Student FTE
Information and Resource Management, Office of the Provost 30

Headcount of Fall Semester New Freshmen Applicants2010 2011 2012 2013 2014 2015 2016 2017 2018 2019
Applicants 17,220 18,939 19,430 21,644 24,097 26,222 28,525 27,734 26,706 25,928Admitted 14,434 15,105 15,240 17,363 19,506 21,171 23,996 23,862 22,077 21,404Enrolled 4,557 4,565 4,470 4,460 4,666 5,241 5,643 5,027 4,806 4,986
Percent of Applicants Who Were Admitted 83.8% 79.8% 78.4% 80.2% 80.9% 80.7% 84.1% 86.0% 82.7% 82.6%
Percent of Admitted Who Enrolled 31.6% 30.2% 29.3% 25.7% 23.9% 24.8% 23.5% 21.1% 21.8% 23.3%Source: MAUI/Admissions data warehouse (see Note 1) as reported in the Student Profile.
12,000
14,000
16,000
18,000
20,000
22,000
24,000
26,000
28,000
30,000
2010 2011 2012 2013 2014 2015 2016 2017 2018 2019
Hea
dcou
nt
Fall Semester
Number of New Freshman Applicants
0%
10%
20%
30%
40%
50%
60%
70%
80%
90%
2010 2011 2012 2013 2014 2015 2016 2017 2018 2019
Perc
ent
Fall Semester
Percent Admitted and Percent Enrolled% of Applicants Admitted% of Admitted who Enrolled
Information and Resource Management, Office of the Provost 31
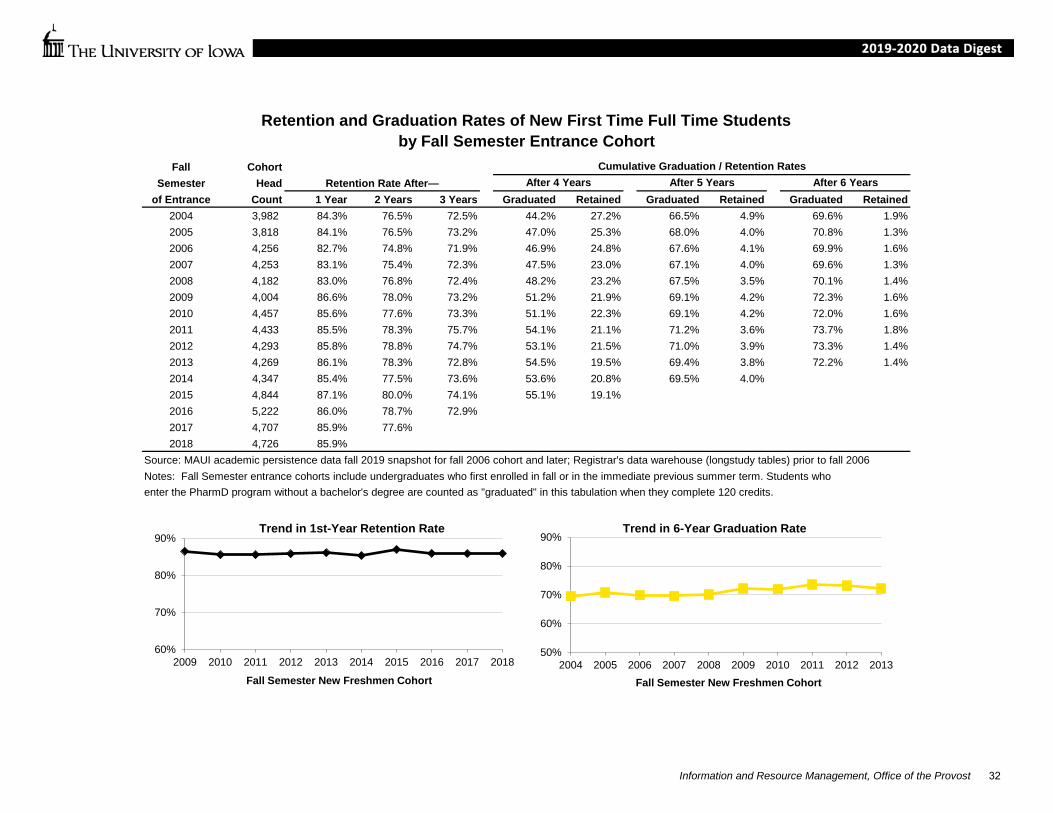
by Fall Semester Entrance CohortFall Cohort Cumulative Graduation / Retention Rates
Semester Head After 4 Years After 5 Years After 6 Yearsof Entrance Count 1 Year 2 Years 3 Years Graduated Retained Graduated Retained Graduated Retained
2004 3,982 84.3% 76.5% 72.5% 44.2% 27.2% 66.5% 4.9% 69.6% 1.9%2005 3,818 84.1% 76.5% 73.2% 47.0% 25.3% 68.0% 4.0% 70.8% 1.3%2006 4,256 82.7% 74.8% 71.9% 46.9% 24.8% 67.6% 4.1% 69.9% 1.6%2007 4,253 83.1% 75.4% 72.3% 47.5% 23.0% 67.1% 4.0% 69.6% 1.3%2008 4,182 83.0% 76.8% 72.4% 48.2% 23.2% 67.5% 3.5% 70.1% 1.4%2009 4,004 86.6% 78.0% 73.2% 51.2% 21.9% 69.1% 4.2% 72.3% 1.6%2010 4,457 85.6% 77.6% 73.3% 51.1% 22.3% 69.1% 4.2% 72.0% 1.6%2011 4,433 85.5% 78.3% 75.7% 54.1% 21.1% 71.2% 3.6% 73.7% 1.8%2012 4,293 85.8% 78.8% 74.7% 53.1% 21.5% 71.0% 3.9% 73.3% 1.4%2013 4,269 86.1% 78.3% 72.8% 54.5% 19.5% 69.4% 3.8% 72.2% 1.4%2014 4,347 85.4% 77.5% 73.6% 53.6% 20.8% 69.5% 4.0%2015 4,844 87.1% 80.0% 74.1% 55.1% 19.1%2016 5,222 86.0% 78.7% 72.9%2017 4,707 85.9% 77.6%2018 4,726 85.9%
Source: MAUI academic persistence data fall 2019 snapshot for fall 2006 cohort and later; Registrar's data warehouse (longstudy tables) prior to fall 2006Notes: Fall Semester entrance cohorts include undergraduates who first enrolled in fall or in the immediate previous summer term. Students who enter the PharmD program without a bachelor's degree are counted as "graduated" in this tabulation when they complete 120 credits.
Retention and Graduation Rates of New First Time Full Time Students
Retention Rate After—
50%
60%
70%
80%
90%
2004 2005 2006 2007 2008 2009 2010 2011 2012 2013Fall Semester New Freshmen Cohort
Trend in 6-Year Graduation Rate
60%
70%
80%
90%
2009 2010 2011 2012 2013 2014 2015 2016 2017 2018
Fall Semester New Freshmen Cohort
Trend in 1st-Year Retention Rate
Information and Resource Management, Office of the Provost 32

Fall Cumulative Graduation RateSemester After 4 Years After 5 Years After 6 Years
of Entrance Female Male Female Male Female Male Female Male Female Male2004 2,226 1,756 83.1% 85.8% 48.0% 39.4% 66.9% 66.1% 69.5% 69.6%2005 2,149 1,669 83.2% 85.2% 50.8% 42.1% 69.4% 66.3% 71.8% 69.6%2006 2,299 1,957 82.8% 82.6% 49.3% 44.0% 67.9% 67.2% 69.8% 70.0%2007 2,322 1,931 82.3% 84.2% 50.7% 43.7% 67.4% 66.6% 69.6% 69.8%2008 2,192 1,990 81.7% 84.4% 53.0% 42.9% 69.3% 65.4% 71.5% 68.6%2009 2,155 1,849 87.7% 85.3% 57.4% 43.9% 71.7% 66.0% 74.2% 70.0%2010 2,404 2,053 85.0% 86.2% 56.8% 44.4% 71.0% 66.9% 73.3% 70.6%2011 2,401 2,032 85.5% 85.6% 59.4% 47.8% 74.1% 67.8% 76.1% 70.8%2012 2,317 1,976 86.1% 85.5% 58.6% 46.7% 73.5% 67.9% 75.7% 70.4%2013 2,336 1,933 85.8% 86.4% 58.5% 49.8% 71.7% 66.5% 73.7% 70.4%2014 2,371 1,976 85.7% 85.0% 58.1% 48.1% 71.6% 67.1%2015 2,655 2,189 87.6% 86.3% 60.2% 49.0%2016 2,858 2,364 86.6% 85.3%2017 2,664 2,043 86.0% 85.7%2018 2,710 2,016 86.0% 85.8%
Source: MAUI academic persistence data fall 2019 snapshot for fall 2006 cohort and later; Registrar's data warehouse (longstudy tables) prior to fall 2006
enter the PharmD program without a bachelor's degree are counted as "graduated" in this tabulation when they complete 120 credits. Counts for students who reported gender as "Prefer Not to Answer/Other" are included in the "Male" column.
Retention and Graduation Rates of New First Time Full Time Studentsby Gender and Fall Semester Entrance Cohort
Cohort Retention Rate AfterHeadcount 1 Year
Notes: Fall Semester entrance cohorts include undergraduates who first enrolled in fall or in the immediate previous summer term. Students who
60.0%
70.0%
80.0%
90.0%
2009 2010 2011 2012 2013 2014 2015 2016 2017 2018
Trend in 1st-Year Retention Rate
Female Male
50.0%
60.0%
70.0%
80.0%
90.0%
2004 2005 2006 2007 2008 2009 2010 2011 2012 2013
Trend in 6-Year Graduation Rate
Female Male
Information and Resource Management, Office of the Provost 33

Fall Cumulative Graduation RateSemester After 4 Years After 5 Years After 6 Years
of Entrance URM Not URM URM Not URM URM Not URM URM Not URM URM Not URM2004 194 3,788 80.4% 84.5% 35.6% 44.6% 56.2% 67.1% 59.8% 70.1%2005 200 3,618 83.0% 84.2% 30.0% 47.9% 54.0% 68.8% 57.5% 71.6%2006 215 4,041 78.6% 82.9% 28.8% 47.8% 50.7% 68.5% 56.7% 70.6%2007 252 4,001 83.3% 83.1% 37.3% 48.2% 62.7% 67.3% 65.1% 69.9%2008 262 3,920 79.0% 83.3% 38.2% 48.9% 55.3% 68.3% 57.3% 71.0%2009 338 3,666 87.0% 86.6% 42.6% 52.0% 61.2% 69.8% 64.5% 73.0%2010 439 4,018 84.5% 85.7% 44.0% 51.8% 61.0% 70.0% 64.5% 72.8%2011 520 3,913 81.3% 86.1% 43.3% 55.5% 61.7% 72.4% 64.6% 74.9%2012 560 3,733 82.9% 86.3% 44.3% 54.4% 62.0% 72.3% 65.4% 74.5%2013 554 3,715 84.8% 86.3% 45.8% 55.8% 60.1% 70.7% 62.3% 73.7%2014 638 3,709 85.7% 85.3% 47.2% 54.7% 61.9% 70.9%2015 790 4,054 82.3% 88.0% 45.4% 57.0%2016 730 4,492 80.0% 87.0%2017 624 4,083 81.7% 86.5%2018 597 4,129 82.2% 86.5%
Source: MAUI academic persistence data fall 2019 snapshot for fall 2006 cohort and later; Registrar's data warehouse (longstudy tables) prior to fall 2006
enter the PharmD program without a bachelor's degree are counted as "graduated" in this tabulation when they complete 120 credits. "Underrepresented Minority" (URM) includes Hispanic/Latinx, American Indian or Alaskan Native, Black or African American, Native Hawaiian or Other Pacific Islander, and Two or More Races (excluding those in the Two or More Races group who identified as Asian and White only).
Retention and Graduation Rates of New First Time Full Time Studentsby Underrepresented Minority (URM) Status and Fall Semester Entrance Cohort
Cohort Retention Rate AfterHeadcount 1 Year
Notes: Fall Semester entrance cohorts include undergraduates who first enrolled in fall or in the immediate previous summer term. Students who
60.0%
70.0%
80.0%
90.0%
2009 2010 2011 2012 2013 2014 2015 2016 2017 2018
Trend in 1st-Year Retention Rate
URM Not URM
50.0%
60.0%
70.0%
80.0%
90.0%
2004 2005 2006 2007 2008 2009 2010 2011 2012 2013
Trend in 6-Year Graduation Rate
URM Not URM
Information and Resource Management, Office of the Provost 34

Race/
Ethnicity 2009 2010 2011 2012 2013 2014 2015 2016 2017 2018
Hispanic/Latino 87.2% 85.7% 83.2% 85.0% 84.3% 87.9% 83.1% 80.9% 83.5% 81.9%
American Indian or Alaska Native 100.0% 88.9% 100.0% 66.7% 85.7% 75.0% 100.0% 72.7% 100.0% 66.7%
Asian 84.7% 87.3% 85.0% 87.7% 84.6% 88.4% 88.5% 85.3% 88.0% 86.6%
Black or African American 85.2% 81.1% 74.1% 79.3% 87.9% 81.3% 80.2% 77.6% 77.0% 86.5%
Native Hawaiian or Other Pacific Islander 71.4% 83.3% 85.7% 33.3% 100.0% 100.0% 100.0% 100.0% 66.7% 75.0%
Two or More Races - URM 89.6% 85.5% 82.8% 84.1% 80.7% 83.9% 80.8% 80.0% 80.3% 80.8%
Two or More Races - Non-URM 84.6% 91.1% 78.0% 88.9% 87.0% 85.1%
White 86.5% 84.9% 85.6% 86.3% 86.2% 84.9% 87.7% 86.7% 86.3% 86.4%
Not Specified/Unknown 82.6% 88.0% 87.8% 84.1% 84.2% 84.0% 79.4% 85.7% 90.2% 88.7%
International 89.8% 91.4% 90.2% 86.4% 89.1% 86.6% 91.8% 90.5% 89.4% 87.1%
Race/
Ethnicity 2004 2005 2006 2007 2008 2009 2010 2011 2012 2013
Hispanic/Latino 62.4% 59.6% 63.6% 66.9% 61.9% 66.5% 69.6% 66.3% 70.4% 66.8%
American Indian or Alaska Native 60.9% 46.2% 54.2% 77.8% 66.7% 71.4% 55.6% 28.6% 11.1% 28.6%
Asian 65.6% 58.6% 72.0% 70.3% 72.3% 66.9% 67.9% 70.8% 73.5% 68.5%
Black or African American 57.0% 56.6% 48.1% 60.7% 49.0% 61.4% 53.2% 58.6% 56.4% 55.7%
Native Hawaiian or Other Pacific Islander 57.1% 66.7% 71.4% 33.3% 60.0%
Two or More Races - URM 62.5% 66.3% 69.0% 68.2% 59.0%
Two or More Races - Non-URM 67.3%
White 70.3% 71.8% 70.5% 70.4% 70.7% 73.1% 72.8% 75.0% 74.7% 73.6%
Not Specified/Unknown 64.7% 75.3% 71.4% 60.5% 74.4% 76.1% 70.3% 74.3% 76.2% 71.9%
International 73.3% 82.5% 71.4% 64.2% 72.8% 73.5% 76.3% 75.0% 71.8% 77.7%
Source: MAUI academic persistence data fall 2019 snapshot for fall 2006 cohort and later; Registrar's data warehouse (longstudy tables) prior to fall 2006
who enter the PharmD program without a bachelor's degree are counted as "graduated" in this tabulation when they complete 120 credits. "Underrepresented Minority" (URM) includes Hispanic/Latinx, American Indian or Alaskan Native, Black or African American, Native Hawaiian or Other Pacific Islander, and Two or More Races (excluding those in the Two or More Races group who identified as Asian and White only).
Entering Fall Cohort
Notes: Fall Semester entrance cohorts include undergraduates who first enrolled in fall or in the immediate previous summer term. Students
Retention and Graduation Rates of New First Time Full Time Studentsby Race/Ethnicity and Fall Semester Entrance Cohort
Retention Rate After 1 Year
Entering Fall Cohort
Graduation Rate After 6 Years
Information and Resource Management, Office of the Provost 35

Title IV Financial Aid Participation 2009 2010 2011 2012 2013 2014 2015 2016 2017 2018
Pell Grant 82.7% 78.7% 78.8% 80.6% 78.3% 79.1% 80.3% 80.2% 79.4% 80.7%
Federal Subsidized (No Pell) 84.9% 83.3% 81.8% 84.4% 83.0% 82.7% 81.4% 81.1% 81.9% 82.0%
Federal Unsubsidized (No Pell or Sub Loan) 88.8% 88.0% 87.4% 85.7% 87.9% 87.0% 89.5% 88.0% 89.0% 84.5%
Students not in one of the 3 categories above 87.8% 88.3% 89.1% 88.7% 89.4% 88.4% 90.9% 89.5% 88.4% 88.6%
Title IV Financial Aid Participation 2006 2007 2008 2009 2010 2011 2012 2013 2014 2015
Pell Grant 35.0% 35.2% 38.6% 38.7% 41.1% 45.0% 43.3% 44.1% 43.1% 45.0%
Federal Subsidized (No Pell) 40.0% 42.7% 44.6% 48.8% 50.1% 50.7% 52.9% 51.1% 52.0% 48.2%
Federal Unsubsidized (No Pell or Sub Loan) 49.4% 48.6% 47.5% 52.3% 51.9% 54.5% 56.1% 54.9% 56.2% 57.6%
Students not in one of the 3 categories above 51.6% 53.0% 52.1% 56.0% 54.9% 58.8% 56.5% 59.3% 57.6% 60.7%
Title IV Financial Aid Participation 2004 2005 2006 2007 2008 2009 2010 2011 2012 2013Pell Grant 57.2% 59.7% 57.0% 60.3% 60.8% 63.9% 58.9% 63.6% 63.6% 59.5%
Federal Subsidized (No Pell) 66.5% 65.4% 62.5% 65.2% 64.5% 68.3% 69.4% 69.9% 70.8% 69.1%
Federal Unsubsidized (No Pell or Sub Loan) 70.7% 74.1% 73.3% 71.5% 71.5% 74.2% 74.4% 75.4% 75.0% 74.1%
Students not in one of the 3 categories above 74.0% 74.8% 74.8% 73.8% 74.1% 76.1% 77.3% 78.4% 77.9% 77.2%
Source: MAUI academic persistence data fall 2019 snapshot for fall 2006 cohort and later; Registrar's data warehouse (longstudy tables) prior to fall 2006
Notes: Fall Semester entrance cohorts include undergraduates who first enrolled in fall or in the immediate previous summer term. Studentswho enter the PharmD program without a bachelor's degree are counted as "graduated" in this tabulation when they complete 120 credits.
Graduation Rate After 6 Years
Entering Fall Cohort
Retention and Graduation Rates of New First Time Full Time Studentsby Title IV Financial Aid Participation and Fall Semester Entrance Cohort
Retention Rate After 1 Year
Entering Fall Cohort
Graduation Rate After 4 YearsEntering Fall Cohort
Information and Resource Management, Office of the Provost 36
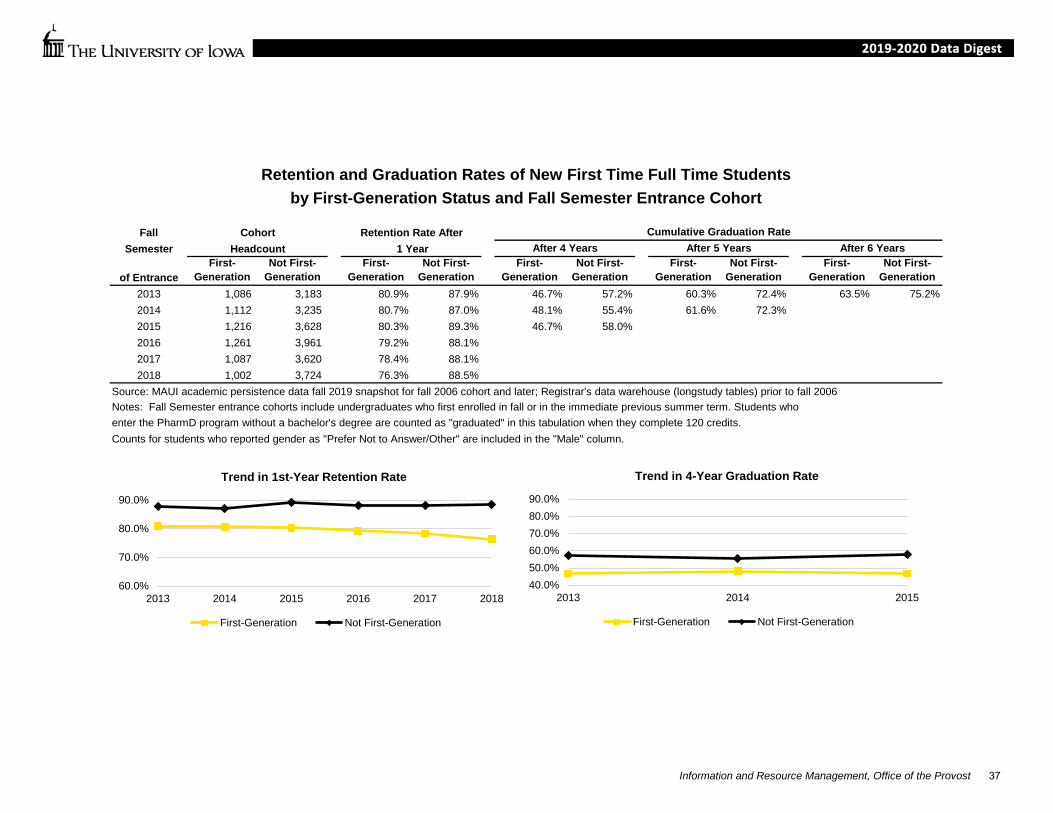
Fall Cumulative Graduation RateSemester After 4 Years After 5 Years After 6 Years
of EntranceFirst-
GenerationNot First-
GenerationFirst-
GenerationNot First-
GenerationFirst-
GenerationNot First-
GenerationFirst-
GenerationNot First-
GenerationFirst-
GenerationNot First-
Generation2013 1,086 3,183 80.9% 87.9% 46.7% 57.2% 60.3% 72.4% 63.5% 75.2%2014 1,112 3,235 80.7% 87.0% 48.1% 55.4% 61.6% 72.3%2015 1,216 3,628 80.3% 89.3% 46.7% 58.0%2016 1,261 3,961 79.2% 88.1%2017 1,087 3,620 78.4% 88.1%2018 1,002 3,724 76.3% 88.5%
Source: MAUI academic persistence data fall 2019 snapshot for fall 2006 cohort and later; Registrar's data warehouse (longstudy tables) prior to fall 2006
enter the PharmD program without a bachelor's degree are counted as "graduated" in this tabulation when they complete 120 credits. Counts for students who reported gender as "Prefer Not to Answer/Other" are included in the "Male" column.
Headcount 1 Year
Notes: Fall Semester entrance cohorts include undergraduates who first enrolled in fall or in the immediate previous summer term. Students who
Retention and Graduation Rates of New First Time Full Time Studentsby First-Generation Status and Fall Semester Entrance Cohort
Cohort Retention Rate After
60.0%
70.0%
80.0%
90.0%
2013 2014 2015 2016 2017 2018
Trend in 1st-Year Retention Rate
First-Generation Not First-Generation
40.0%50.0%60.0%70.0%80.0%90.0%
2013 2014 2015
Trend in 4-Year Graduation Rate
First-Generation Not First-Generation
Information and Resource Management, Office of the Provost 37
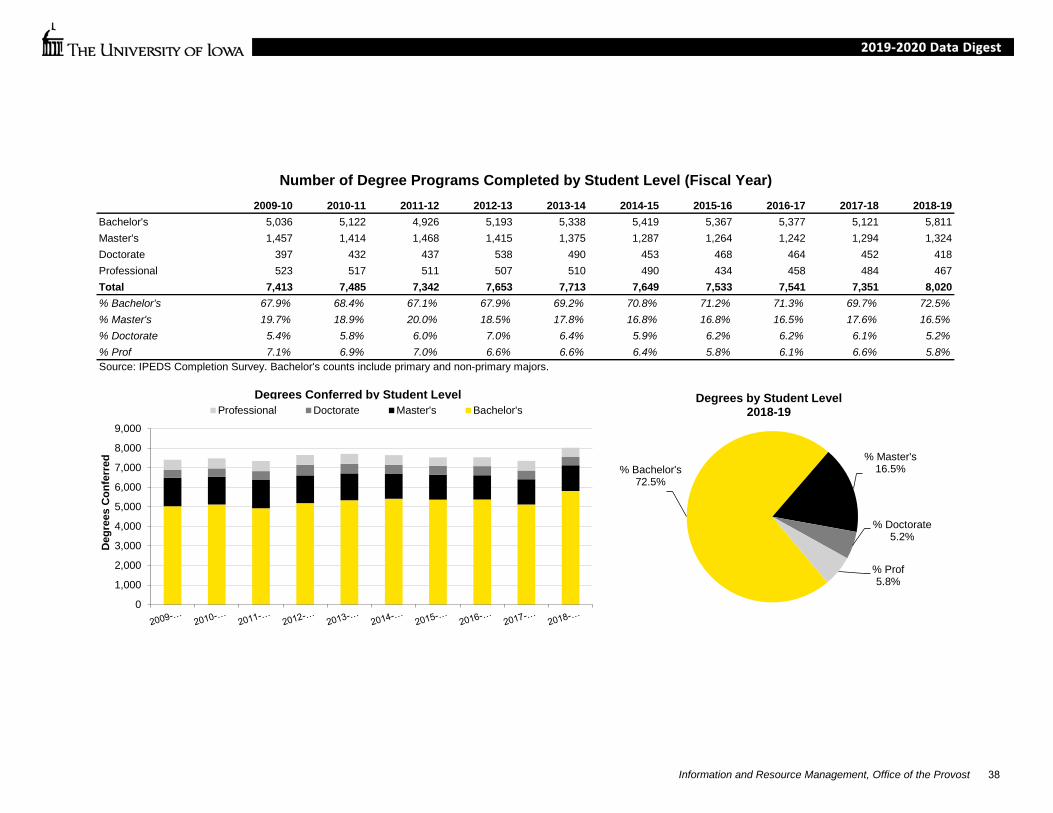
Number of Degree Programs Completed by Student Level (Fiscal Year)2009-10 2010-11 2011-12 2012-13 2013-14 2014-15 2015-16 2016-17 2017-18 2018-19
Bachelor's 5,036 5,122 4,926 5,193 5,338 5,419 5,367 5,377 5,121 5,811Master's 1,457 1,414 1,468 1,415 1,375 1,287 1,264 1,242 1,294 1,324Doctorate 397 432 437 538 490 453 468 464 452 418Professional 523 517 511 507 510 490 434 458 484 467Total 7,413 7,485 7,342 7,653 7,713 7,649 7,533 7,541 7,351 8,020% Bachelor's 67.9% 68.4% 67.1% 67.9% 69.2% 70.8% 71.2% 71.3% 69.7% 72.5%% Master's 19.7% 18.9% 20.0% 18.5% 17.8% 16.8% 16.8% 16.5% 17.6% 16.5%% Doctorate 5.4% 5.8% 6.0% 7.0% 6.4% 5.9% 6.2% 6.2% 6.1% 5.2%% Prof 7.1% 6.9% 7.0% 6.6% 6.6% 6.4% 5.8% 6.1% 6.6% 5.8%Source: IPEDS Completion Survey. Bachelor's counts include primary and non-primary majors.
% Bachelor's72.5%
% Master's16.5%
% Doctorate5.2%
% Prof5.8%
Degrees by Student Level 2018-19
0
1,000
2,000
3,000
4,000
5,000
6,000
7,000
8,000
9,000
Deg
rees
Con
ferr
ed
Degrees Conferred by Student LevelProfessional Doctorate Master's Bachelor's
Information and Resource Management, Office of the Provost 38
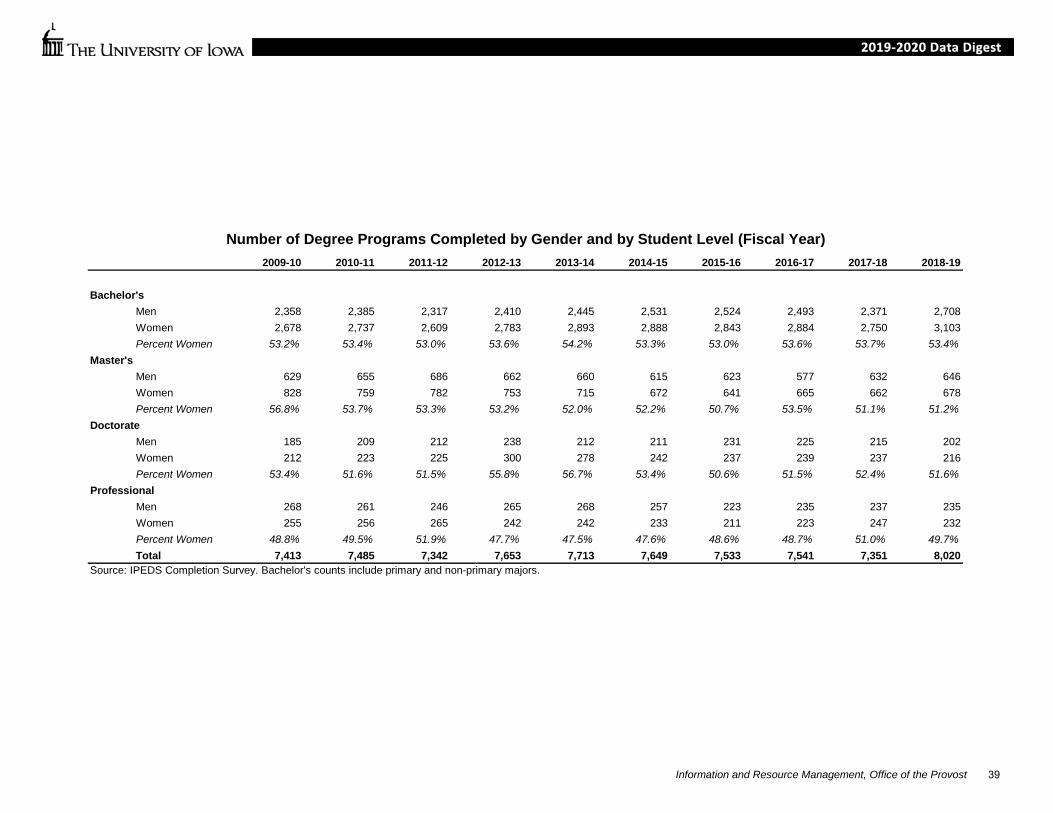
Number of Degree Programs Completed by Gender and by Student Level (Fiscal Year)2009-10 2010-11 2011-12 2012-13 2013-14 2014-15 2015-16 2016-17 2017-18 2018-19
Bachelor'sMen 2,358 2,385 2,317 2,410 2,445 2,531 2,524 2,493 2,371 2,708Women 2,678 2,737 2,609 2,783 2,893 2,888 2,843 2,884 2,750 3,103Percent Women 53.2% 53.4% 53.0% 53.6% 54.2% 53.3% 53.0% 53.6% 53.7% 53.4%
Master'sMen 629 655 686 662 660 615 623 577 632 646Women 828 759 782 753 715 672 641 665 662 678Percent Women 56.8% 53.7% 53.3% 53.2% 52.0% 52.2% 50.7% 53.5% 51.1% 51.2%
DoctorateMen 185 209 212 238 212 211 231 225 215 202Women 212 223 225 300 278 242 237 239 237 216Percent Women 53.4% 51.6% 51.5% 55.8% 56.7% 53.4% 50.6% 51.5% 52.4% 51.6%
ProfessionalMen 268 261 246 265 268 257 223 235 237 235Women 255 256 265 242 242 233 211 223 247 232Percent Women 48.8% 49.5% 51.9% 47.7% 47.5% 47.6% 48.6% 48.7% 51.0% 49.7%Total 7,413 7,485 7,342 7,653 7,713 7,649 7,533 7,541 7,351 8,020
Source: IPEDS Completion Survey. Bachelor's counts include primary and non-primary majors.
Information and Resource Management, Office of the Provost 39

2014-2015 2015-2016 2016-17 2017-18 2018-19Major # Major # Major # Major # Major #
Bachelor's
Finance 458 Finance 405 Finance 376 Finance 349 Finance 408
Psychology 293 Psychology 302 Psychology 283 Psychology 266 Health and Human Physiology 309
Communication Studies 255 Communication Studies 255 Health and Human Physiology 257 Health and Human Physiology 253 Psychology 254
Health and Human Physiology 254 Health and Human Physiology 251 Communication Studies 238 Human Physiology (BS) 195 Enterprise Leadership 204
English 216 Human Physiology (BS) 229 Human Physiology 208 Communication Studies 191 Human Physiology (BS) 199
Master's
MBA Program 358 MBA Program 353 MBA Program 283 MBA Program 346 MBA Program 342
English 73 Social work 95 Social Work 97 Social Work 67 Social Work 86
Social Work 67 English 64 English 72 MPH Program 66 MPH Program 71
MPH Program 57 MPH Program 58 MPH Program 55 English 51 English 67
Teaching and Learning 42 Art 41 Library and Information Science/Art 37 Library and Information Science 40 Teaching and Learning 55
Doctorate
Nursing 48 Physical Therapy (DPT) 37 Nursing 61 Nursing 53 Physical Therapy (DPT) 38
Physical Therapy (DPT) 35 Nursing 35 Physical Therapy (DPT) 38 Physical Therapy (DPT) 39 Nursing 36
Music 26 Music 27 Chemistry 22 Music 24 Music 29
Psychological and Quantitative Foundations 22 Psychological and Quantitative
Foundations 22 Psychological and Quantitative Foundations 21 Chemistry 19 Psychological and Quantitative
Foundations 24
English 16 Chemistry 19 Music 20 Psychological and Quantitative Foundations 18 Chemistry 23
Source: MAUI/Registrar's data warehouse (see Note 1)
Five Largest Majors by Degrees Conferred
Information and Resource Management, Office of the Provost 40

Distribution of Alumni by State
Source: UI Living Alumni Statistical Report, February 10, 2020
U.S. States: 273,371Military Bases: 115Puerto Rico: 123Guam: 14Virgin Islands: 26Other U.S. Territories/
Associated States: 13Foreign: 9.169Unknown: 522
Total Alumni: 279,530
Undergraduate degree (one or more): 200,017Graduate degree (one or more): 108,507Multiple degrees: 98,034
Information and Resource Management, Office of the Provost 41

Faculty & Staff
November 1 Faculty FTE ....................................................................................... 43 November 1 Faculty FTE by Fund Group .......................................................... 44 Headcount of Faculty by Faculty Category and Gender ........................................ 45 Headcount of Faculty by Faculty Category, Rank, and Gender ............................. 46 Headcount of Faculty by Race/Ethnicity ................................................................ 49 Employment Profile FTE – November 2018 .......................................................... 52 Employment Profile Headcount – November 2018 ................................................ 53 Average Faculty Salaries by Professorial Rank ..................................................... 54 Median Average Faculty Salaries by Professorial Rank ........................................ 55
42
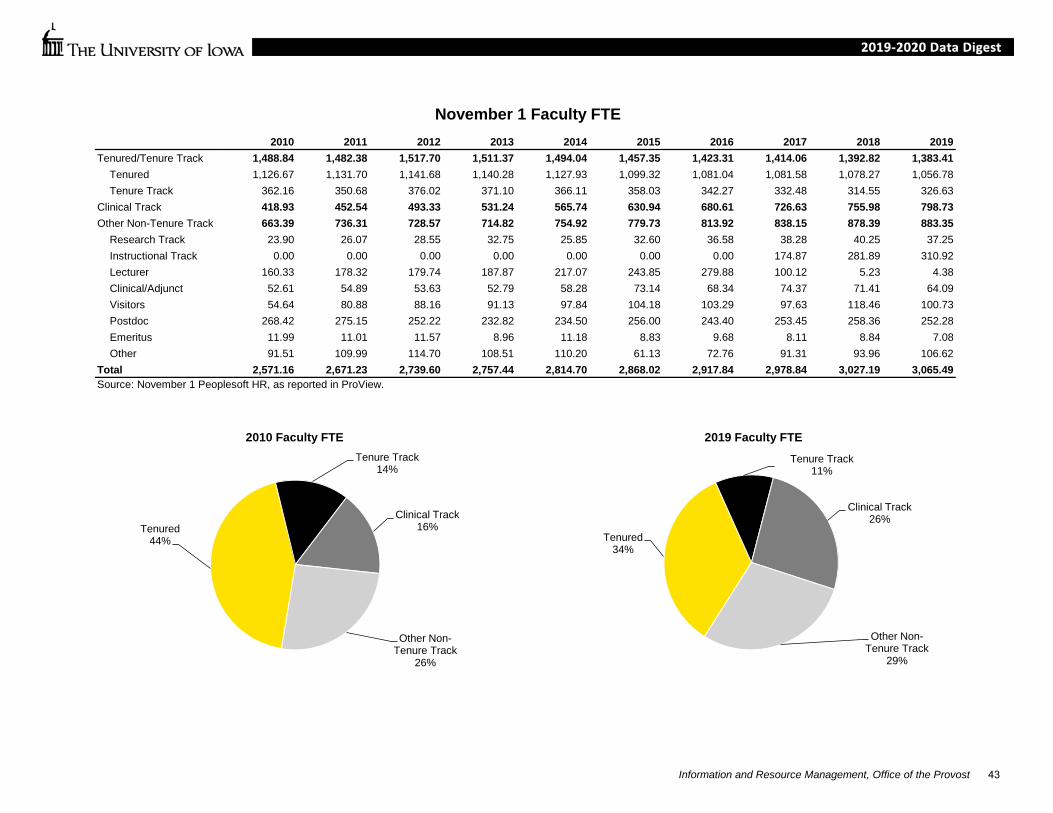
November 1 Faculty FTE2010 2011 2012 2013 2014 2015 2016 2017 2018 2019
Tenured/Tenure Track 1,488.84 1,482.38 1,517.70 1,511.37 1,494.04 1,457.35 1,423.31 1,414.06 1,392.82 1,383.41Tenured 1,126.67 1,131.70 1,141.68 1,140.28 1,127.93 1,099.32 1,081.04 1,081.58 1,078.27 1,056.78Tenure Track 362.16 350.68 376.02 371.10 366.11 358.03 342.27 332.48 314.55 326.63
Clinical Track 418.93 452.54 493.33 531.24 565.74 630.94 680.61 726.63 755.98 798.73Other Non-Tenure Track 663.39 736.31 728.57 714.82 754.92 779.73 813.92 838.15 878.39 883.35
Research Track 23.90 26.07 28.55 32.75 25.85 32.60 36.58 38.28 40.25 37.25Instructional Track 0.00 0.00 0.00 0.00 0.00 0.00 0.00 174.87 281.89 310.92Lecturer 160.33 178.32 179.74 187.87 217.07 243.85 279.88 100.12 5.23 4.38Clinical/Adjunct 52.61 54.89 53.63 52.79 58.28 73.14 68.34 74.37 71.41 64.09Visitors 54.64 80.88 88.16 91.13 97.84 104.18 103.29 97.63 118.46 100.73Postdoc 268.42 275.15 252.22 232.82 234.50 256.00 243.40 253.45 258.36 252.28Emeritus 11.99 11.01 11.57 8.96 11.18 8.83 9.68 8.11 8.84 7.08Other 91.51 109.99 114.70 108.51 110.20 61.13 72.76 91.31 93.96 106.62
Total 2,571.16 2,671.23 2,739.60 2,757.44 2,814.70 2,868.02 2,917.84 2,978.84 3,027.19 3,065.49Source: November 1 Peoplesoft HR, as reported in ProView.
Tenured44%
Tenure Track14%
Clinical Track16%
Other Non-Tenure Track
26%
2010 Faculty FTE
Tenured34%
Tenure Track11%
Clinical Track26%
Other Non-Tenure Track
29%
2019 Faculty FTE
Information and Resource Management, Office of the Provost 43

November 1 Faculty FTE by Fund GroupFall 2019
Fund Name Tenured Tenure TrackClinical
TrackOther Non-
Tenure Track Total Tenured Tenure TrackClinical
TrackOther Non-
Tenure Track TotalGeneral Education Funds 753.09 229.01 138.29 224.67 1,345.06 711.57 219.74 172.43 458.17 1,561.92
Organized Activities Funds 173.31 59.74 255.45 169.62 658.12 168.22 56.33 588.94 153.64 967.13Stores Services Rev Funds 5.39 1.25 8.20 2.90 17.75 2.36 1.38 12.20 5.77 21.72
Auxiliary Funds 0.47 0.00 0.00 0.00 0.47 0.05 0.00 0.00 0.40 0.45Restricted Funds 194.02 72.16 16.98 266.20 549.37 174.21 49.18 25.16 265.37 513.92
Agency Funds 0.39 0.00 0.00 0.00 0.39 0.36 0.00 0.00 0.00 0.36Total 1,126.67 362.16 418.93 663.39 2,571.16 1,056.78 326.63 798.73 883.35 3,065.49
Fall 2010
Source: November 1 Peoplesoft HR, as reported in ProView. Fall 2008 total faculty FTE includes 0.13 FTE in Health Care funds not shown here.
General Education Funds52%
Organized Activities Funds
26%
Stores Services Rev Funds
1%
Gifts & Endowments
16%
2010 Faculty and Staff FTE
General Education Funds51%
Organized Activities Funds
31%
Stores Services Rev Funds
1%
Restricted Funds17%
2019 Faculty and Staff FTE
Information and Resource Management, Office of the Provost 44
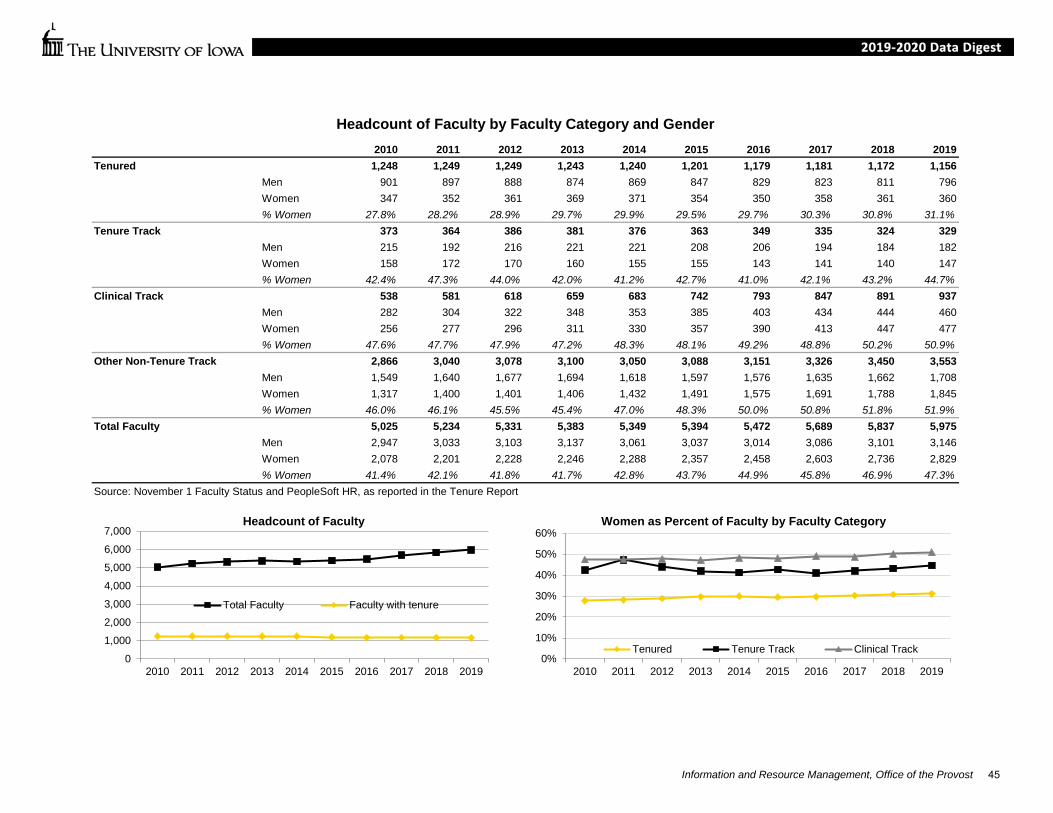
2010 2011 2012 2013 2014 2015 2016 2017 2018 2019Tenured 1,248 1,249 1,249 1,243 1,240 1,201 1,179 1,181 1,172 1,156
Men 901 897 888 874 869 847 829 823 811 796Women 347 352 361 369 371 354 350 358 361 360% Women 27.8% 28.2% 28.9% 29.7% 29.9% 29.5% 29.7% 30.3% 30.8% 31.1%
Tenure Track 373 364 386 381 376 363 349 335 324 329Men 215 192 216 221 221 208 206 194 184 182Women 158 172 170 160 155 155 143 141 140 147% Women 42.4% 47.3% 44.0% 42.0% 41.2% 42.7% 41.0% 42.1% 43.2% 44.7%
Clinical Track 538 581 618 659 683 742 793 847 891 937Men 282 304 322 348 353 385 403 434 444 460Women 256 277 296 311 330 357 390 413 447 477% Women 47.6% 47.7% 47.9% 47.2% 48.3% 48.1% 49.2% 48.8% 50.2% 50.9%
Other Non-Tenure Track 2,866 3,040 3,078 3,100 3,050 3,088 3,151 3,326 3,450 3,553Men 1,549 1,640 1,677 1,694 1,618 1,597 1,576 1,635 1,662 1,708Women 1,317 1,400 1,401 1,406 1,432 1,491 1,575 1,691 1,788 1,845% Women 46.0% 46.1% 45.5% 45.4% 47.0% 48.3% 50.0% 50.8% 51.8% 51.9%
Total Faculty 5,025 5,234 5,331 5,383 5,349 5,394 5,472 5,689 5,837 5,975Men 2,947 3,033 3,103 3,137 3,061 3,037 3,014 3,086 3,101 3,146Women 2,078 2,201 2,228 2,246 2,288 2,357 2,458 2,603 2,736 2,829% Women 41.4% 42.1% 41.8% 41.7% 42.8% 43.7% 44.9% 45.8% 46.9% 47.3%
Source: November 1 Faculty Status and PeopleSoft HR, as reported in the Tenure Report
Headcount of Faculty by Faculty Category and Gender
0%
10%
20%
30%
40%
50%
60%
2010 2011 2012 2013 2014 2015 2016 2017 2018 2019
Women as Percent of Faculty by Faculty Category
Tenured Tenure Track Clinical Track0
1,0002,0003,0004,0005,0006,0007,000
2010 2011 2012 2013 2014 2015 2016 2017 2018 2019
Headcount of Faculty
Total Faculty Faculty with tenure
Information and Resource Management, Office of the Provost 45

2010 2011 2012 2013 2014 2015 2016 2017 2018 2019Tenured/Tenure Track 1,621 1,613 1,635 1,624 1,616 1,564 1,528 1,516 1,496 1,485
Professor 813 792 789 782 777 759 748 752 737 724Men 631 613 606 599 592 580 575 570 555 538Women 182 179 183 183 185 179 173 182 182 186% Women 22.4% 22.6% 23.2% 23.4% 23.8% 23.6% 23.1% 24.2% 24.7% 25.7%
Associate Professor 457 478 486 491 493 465 451 454 462 457Men 285 295 297 293 295 281 266 270 274 276Women 172 183 189 198 198 184 185 184 188 181% Women 37.6% 38.3% 38.9% 40.3% 40.2% 39.6% 41.0% 40.5% 40.7% 39.6%
Assistant Professor 351 343 359 351 345 340 329 310 297 304Men 200 181 201 203 202 194 194 177 166 164Women 151 162 158 148 143 146 135 133 131 140% Women 43.0% 47.2% 44.0% 42.2% 41.4% 42.9% 41.0% 42.9% 44.1% 46.1%
Instructor 0 0 1 0 1 0 0 0 0 0Men 0 0 0 0 1 0 0 0 0 0Women 0 0 1 0 0 0 0 0 0 0% Women 0.0% 0.0% 100.0% 0.0% 0.0% 0.0% 0.0% 0.0% 0.0% 0.0%
Clinical Track 538 581 618 659 683 742 793 847 891 937Professor 101 108 111 125 133 141 147 170 182 189
Men 66 70 75 83 90 90 92 107 115 120Women 35 38 36 42 43 51 55 63 67 69% Women 34.7% 35.2% 32.4% 33.6% 32.3% 36.2% 37.4% 37.1% 36.8% 36.5%
Associate Professor 177 185 206 207 211 212 239 241 263 279Men 95 99 111 117 113 112 128 124 137 142Women 82 86 95 90 98 100 111 117 126 137% Women 46.3% 46.5% 46.1% 43.5% 46.4% 47.2% 46.4% 48.5% 47.9% 49.1%
Assistant Professor 254 282 292 321 333 386 402 431 441 465Men 120 134 134 146 149 182 181 201 190 197Women 134 148 158 175 184 204 221 230 251 268% Women 52.8% 52.5% 54.1% 54.5% 55.3% 52.8% 55.0% 53.4% 56.9% 57.6%
Instructor 6 6 9 6 6 3 5 5 5 4Men 1 1 2 2 1 1 2 2 2 1Women 5 5 7 4 5 2 3 3 3 3% Women 83.3% 83.3% 77.8% 66.7% 83.3% 66.7% 60.0% 60.0% 60.0% 75.0%
continued
Headcount of Faculty by Faculty Category, Rank, and Gender
Information and Resource Management, Office of the Provost 246

2010 2011 2012 2013 2014 2015 2016 2017 2018 2019Other Non-Tenure Track 2,866 3,040 3,078 3,100 3,050 3,088 3,151 3,326 3,450 3,553
Professor 153 172 165 176 161 156 156 158 165 179Men 129 141 136 142 133 130 127 126 132 140Women 24 31 29 34 28 26 29 32 33 39% Women 15.7% 18.0% 17.6% 19.3% 17.4% 16.7% 18.6% 20.3% 20.0% 21.8%
Associate Professor 229 227 247 236 227 240 225 237 280 288Men 164 160 179 171 170 174 159 154 168 167Women 65 67 68 65 57 66 66 83 112 121% Women 28.4% 29.5% 27.5% 27.5% 25.1% 27.5% 29.3% 35.0% 40.0% 42.0%
Assistant Professor 1,122 1,172 1,206 1,215 1,186 1,218 1,255 1,355 1,386 1,377Men 654 676 688 677 645 651 649 686 693 697Women 468 496 518 538 541 567 606 669 693 680% Women 41.7% 42.3% 43.0% 44.3% 45.6% 46.6% 48.3% 49.4% 50.0% 49.4%
Instructor 662 672 641 635 689 705 711 785 807 815Men 264 260 252 264 294 287 272 314 311 322Women 398 412 389 371 395 418 439 471 496 493% Women 60.1% 61.3% 60.7% 58.4% 57.3% 59.3% 61.7% 60.0% 61.5% 60.5%
Lecturer 481 548 556 572 548 558 574 549 574 606Men 224 268 280 298 257 260 255 237 241 248Women 257 280 276 274 291 298 319 312 333 358% Women 53.4% 51.1% 49.6% 47.9% 53.1% 53.4% 55.6% 56.8% 58.0% 59.1%
Associate 133 165 182 208 203 182 196 213 207 254Men 74 91 100 117 106 87 104 110 109 128Women 59 74 82 91 97 95 92 103 98 126% Women 44.4% 44.8% 45.1% 43.8% 47.8% 52.2% 46.9% 48.4% 47.3% 49.6%
Assistant in Instruction 86 84 81 58 36 29 34 29 31 34Men 40 44 42 25 13 8 10 8 8 6Women 46 40 39 33 23 21 24 21 23 28% Women 53.5% 47.6% 48.1% 56.9% 63.9% 72.4% 70.6% 72.4% 74.2% 82.4%
continued
Headcount of Faculty by Faculty Category, Rank, and Gender, continued
Information and Resource Management, Office of the Provost 347
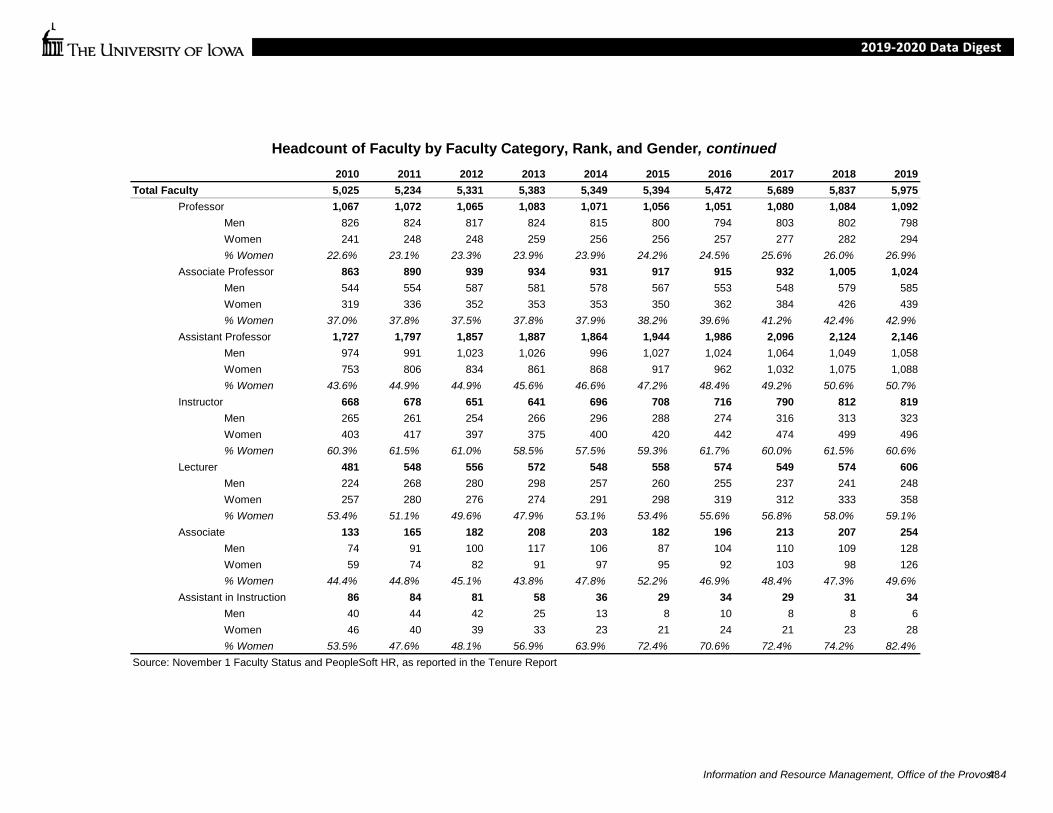
2010 2011 2012 2013 2014 2015 2016 2017 2018 2019Total Faculty 5,025 5,234 5,331 5,383 5,349 5,394 5,472 5,689 5,837 5,975
Professor 1,067 1,072 1,065 1,083 1,071 1,056 1,051 1,080 1,084 1,092Men 826 824 817 824 815 800 794 803 802 798Women 241 248 248 259 256 256 257 277 282 294% Women 22.6% 23.1% 23.3% 23.9% 23.9% 24.2% 24.5% 25.6% 26.0% 26.9%
Associate Professor 863 890 939 934 931 917 915 932 1,005 1,024Men 544 554 587 581 578 567 553 548 579 585Women 319 336 352 353 353 350 362 384 426 439% Women 37.0% 37.8% 37.5% 37.8% 37.9% 38.2% 39.6% 41.2% 42.4% 42.9%
Assistant Professor 1,727 1,797 1,857 1,887 1,864 1,944 1,986 2,096 2,124 2,146Men 974 991 1,023 1,026 996 1,027 1,024 1,064 1,049 1,058Women 753 806 834 861 868 917 962 1,032 1,075 1,088% Women 43.6% 44.9% 44.9% 45.6% 46.6% 47.2% 48.4% 49.2% 50.6% 50.7%
Instructor 668 678 651 641 696 708 716 790 812 819Men 265 261 254 266 296 288 274 316 313 323Women 403 417 397 375 400 420 442 474 499 496% Women 60.3% 61.5% 61.0% 58.5% 57.5% 59.3% 61.7% 60.0% 61.5% 60.6%
Lecturer 481 548 556 572 548 558 574 549 574 606Men 224 268 280 298 257 260 255 237 241 248Women 257 280 276 274 291 298 319 312 333 358% Women 53.4% 51.1% 49.6% 47.9% 53.1% 53.4% 55.6% 56.8% 58.0% 59.1%
Associate 133 165 182 208 203 182 196 213 207 254Men 74 91 100 117 106 87 104 110 109 128Women 59 74 82 91 97 95 92 103 98 126% Women 44.4% 44.8% 45.1% 43.8% 47.8% 52.2% 46.9% 48.4% 47.3% 49.6%
Assistant in Instruction 86 84 81 58 36 29 34 29 31 34Men 40 44 42 25 13 8 10 8 8 6Women 46 40 39 33 23 21 24 21 23 28% Women 53.5% 47.6% 48.1% 56.9% 63.9% 72.4% 70.6% 72.4% 74.2% 82.4%
Source: November 1 Faculty Status and PeopleSoft HR, as reported in the Tenure Report
Headcount of Faculty by Faculty Category, Rank, and Gender, continued
Information and Resource Management, Office of the Provost 448

Headcount of Faculty by Race/Ethnicity2010 2011 2012 2013 2014 2015 2016 2017 2018 2019
Tenured 1,248 1,249 1,249 1,243 1,240 1,201 1,179 1,181 1,172 1,156Hispanic/Latinx 34 37 42 42 47 45 45 48 49 48American Indian or Alaska Native 5 4 4 4 3 3 3 3 3 2Asian 107 108 108 113 115 116 119 130 141 144Black or African American 25 25 26 29 28 26 25 29 25 24Native Hawaiian or Other Pacific Islander 0 0 0 0 0 0 0 0 0 0Two or More Races - URM 5 6 6 6 6 5 5 5 4 4Two or More Races - Non-URM 0 0 0 0 0 0 1 1 1 2White 1,060 1,054 1,047 1,035 1,027 989 964 944 927 908Not Specified/Unknown 12 14 13 13 14 17 15 18 21 19Nonresident Alien/International 0 1 3 1 0 0 2 3 1 5
Percent Minority 14.1% 14.4% 14.9% 15.6% 16.0% 16.2% 16.8% 18.3% 19.0% 19.4%Percent Underrepresented Minority (URM) 5.5% 5.8% 6.2% 6.5% 6.8% 6.6% 6.6% 7.2% 6.9% 6.7%
Tenure Track 373 364 386 381 376 363 349 335 324 329Hispanic/Latinx 21 19 18 19 19 20 16 17 16 16American Indian or Alaska Native 2 3 3 3 1 1 1 0 0 0Asian 70 45 53 56 60 55 53 49 47 49Black or African American 17 17 16 9 7 10 10 6 8 8Native Hawaiian or Other Pacific Islander 0 0 0 0 0 0 0 0 0 0Two or More Races - URM 1 0 1 1 2 2 2 1 4 5Two or More Races - Non-URM 1 1 1 2 2 2 2 2 2 2White 249 229 247 242 237 232 221 215 201 205Not Specified/Unknown 12 9 9 8 8 7 7 9 6 6Nonresident Alien/International 0 41 38 41 40 34 37 36 40 38
Percent Minority 30.0% 23.4% 23.8% 23.6% 24.2% 24.8% 24.1% 22.4% 23.8% 24.3%Percent Underrepresented Minority (URM) 11.0% 10.7% 9.8% 8.4% 7.7% 9.1% 8.3% 7.2% 8.6% 8.8%
Tenured/Tenure Track Total 1,621 1,613 1,635 1,624 1,616 1,564 1,528 1,516 1,496 1,485Hispanic/Latinx 55 56 60 61 66 65 61 65 65 64American Indian or Alaska Native 7 7 7 7 4 4 4 3 3 2Asian 177 153 161 169 175 171 172 179 188 193Black or African American 42 42 42 38 35 36 35 35 33 32Native Hawaiian or Other Pacific Islander 0 0 0 0 0 0 0 0 0 0Two or More Races - URM 6 6 7 7 8 7 7 6 8 9Two or More Races - Non-URM 1 1 1 2 2 2 3 3 3 4White 1,309 1,283 1,294 1,277 1,264 1,221 1,185 1,159 1,128 1,113Not Specified/Unknown 24 23 22 21 22 24 22 27 27 25Nonresident Alien/International 0 42 41 42 40 34 39 39 41 43
Percent Minority 17.8% 16.4% 17.0% 17.5% 17.9% 18.2% 18.5% 19.2% 20.1% 20.5%Percent Underrepresented Minority (URM) 6.8% 6.9% 7.1% 7.0% 7.0% 7.2% 7.0% 7.2% 7.3% 7.2%
continued
Information and Resource Management, Office of the Provost 49
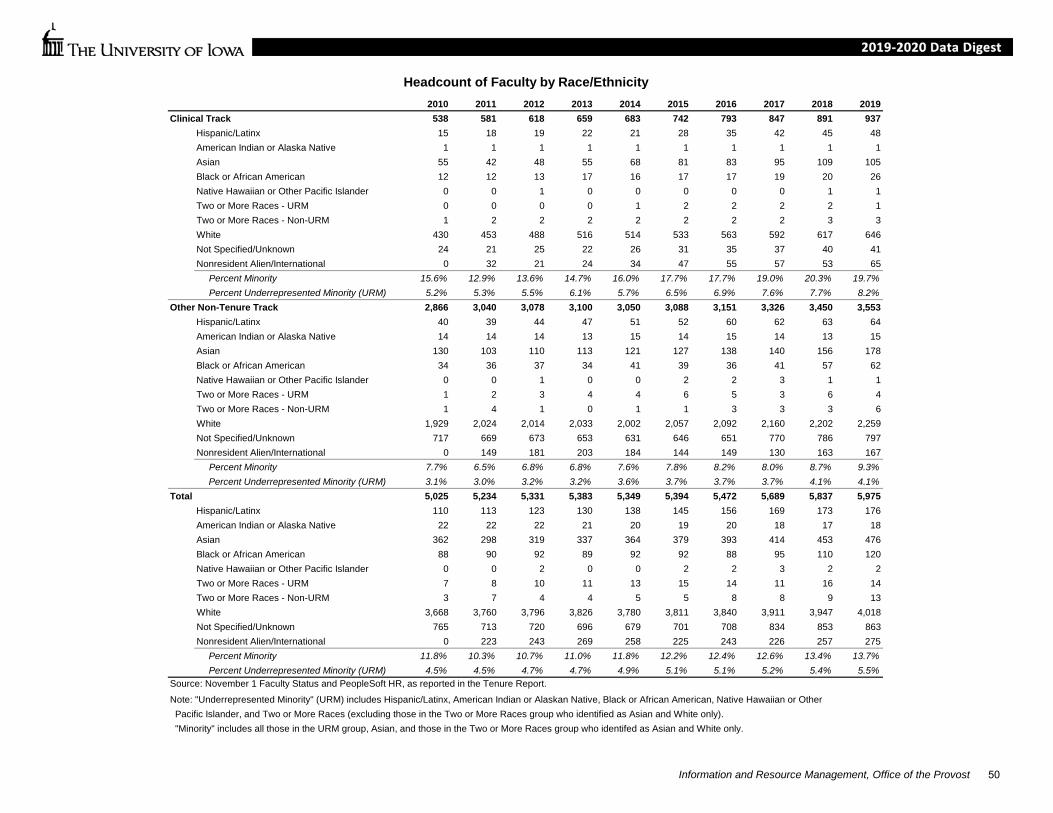
Headcount of Faculty by Race/Ethnicity2010 2011 2012 2013 2014 2015 2016 2017 2018 2019
Clinical Track 538 581 618 659 683 742 793 847 891 937Hispanic/Latinx 15 18 19 22 21 28 35 42 45 48American Indian or Alaska Native 1 1 1 1 1 1 1 1 1 1Asian 55 42 48 55 68 81 83 95 109 105Black or African American 12 12 13 17 16 17 17 19 20 26Native Hawaiian or Other Pacific Islander 0 0 1 0 0 0 0 0 1 1Two or More Races - URM 0 0 0 0 1 2 2 2 2 1Two or More Races - Non-URM 1 2 2 2 2 2 2 2 3 3White 430 453 488 516 514 533 563 592 617 646Not Specified/Unknown 24 21 25 22 26 31 35 37 40 41Nonresident Alien/International 0 32 21 24 34 47 55 57 53 65
Percent Minority 15.6% 12.9% 13.6% 14.7% 16.0% 17.7% 17.7% 19.0% 20.3% 19.7%Percent Underrepresented Minority (URM) 5.2% 5.3% 5.5% 6.1% 5.7% 6.5% 6.9% 7.6% 7.7% 8.2%
Other Non-Tenure Track 2,866 3,040 3,078 3,100 3,050 3,088 3,151 3,326 3,450 3,553Hispanic/Latinx 40 39 44 47 51 52 60 62 63 64American Indian or Alaska Native 14 14 14 13 15 14 15 14 13 15Asian 130 103 110 113 121 127 138 140 156 178Black or African American 34 36 37 34 41 39 36 41 57 62Native Hawaiian or Other Pacific Islander 0 0 1 0 0 2 2 3 1 1Two or More Races - URM 1 2 3 4 4 6 5 3 6 4Two or More Races - Non-URM 1 4 1 0 1 1 3 3 3 6White 1,929 2,024 2,014 2,033 2,002 2,057 2,092 2,160 2,202 2,259Not Specified/Unknown 717 669 673 653 631 646 651 770 786 797Nonresident Alien/International 0 149 181 203 184 144 149 130 163 167
Percent Minority 7.7% 6.5% 6.8% 6.8% 7.6% 7.8% 8.2% 8.0% 8.7% 9.3%Percent Underrepresented Minority (URM) 3.1% 3.0% 3.2% 3.2% 3.6% 3.7% 3.7% 3.7% 4.1% 4.1%
Total 5,025 5,234 5,331 5,383 5,349 5,394 5,472 5,689 5,837 5,975Hispanic/Latinx 110 113 123 130 138 145 156 169 173 176American Indian or Alaska Native 22 22 22 21 20 19 20 18 17 18Asian 362 298 319 337 364 379 393 414 453 476Black or African American 88 90 92 89 92 92 88 95 110 120Native Hawaiian or Other Pacific Islander 0 0 2 0 0 2 2 3 2 2Two or More Races - URM 7 8 10 11 13 15 14 11 16 14Two or More Races - Non-URM 3 7 4 4 5 5 8 8 9 13White 3,668 3,760 3,796 3,826 3,780 3,811 3,840 3,911 3,947 4,018Not Specified/Unknown 765 713 720 696 679 701 708 834 853 863Nonresident Alien/International 0 223 243 269 258 225 243 226 257 275
Percent Minority 11.8% 10.3% 10.7% 11.0% 11.8% 12.2% 12.4% 12.6% 13.4% 13.7%Percent Underrepresented Minority (URM) 4.5% 4.5% 4.7% 4.7% 4.9% 5.1% 5.1% 5.2% 5.4% 5.5%
Note: "Underrepresented Minority" (URM) includes Hispanic/Latinx, American Indian or Alaskan Native, Black or African American, Native Hawaiian or Other Pacific Islander, and Two or More Races (excluding those in the Two or More Races group who identified as Asian and White only). "Minority" includes all those in the URM group, Asian, and those in the Two or More Races group who identifed as Asian and White only.
Source: November 1 Faculty Status and PeopleSoft HR, as reported in the Tenure Report.
Information and Resource Management, Office of the Provost 50
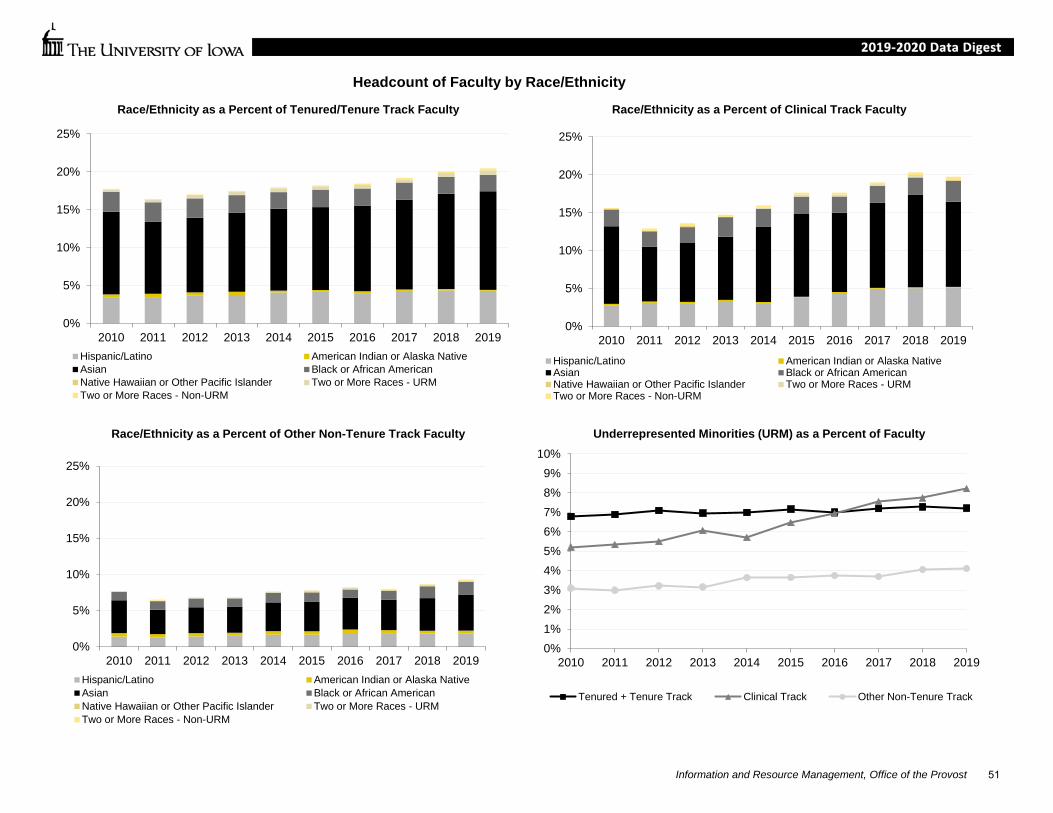
Headcount of Faculty by Race/Ethnicity
0%
5%
10%
15%
20%
25%
2010 2011 2012 2013 2014 2015 2016 2017 2018 2019
Race/Ethnicity as a Percent of Other Non-Tenure Track Faculty
Hispanic/Latino American Indian or Alaska NativeAsian Black or African AmericanNative Hawaiian or Other Pacific Islander Two or More Races - URMTwo or More Races - Non-URM
0%1%2%3%4%5%6%7%8%9%
10%
2010 2011 2012 2013 2014 2015 2016 2017 2018 2019
Underrepresented Minorities (URM) as a Percent of Faculty
Tenured + Tenure Track Clinical Track Other Non-Tenure Track
0%
5%
10%
15%
20%
25%
2010 2011 2012 2013 2014 2015 2016 2017 2018 2019
Race/Ethnicity as a Percent of Clinical Track Faculty
Hispanic/Latino American Indian or Alaska NativeAsian Black or African AmericanNative Hawaiian or Other Pacific Islander Two or More Races - URMTwo or More Races - Non-URM
0%
5%
10%
15%
20%
25%
2010 2011 2012 2013 2014 2015 2016 2017 2018 2019
Race/Ethnicity as a Percent of Tenured/Tenure Track Faculty
Hispanic/Latino American Indian or Alaska NativeAsian Black or African AmericanNative Hawaiian or Other Pacific Islander Two or More Races - URMTwo or More Races - Non-URM
Information and Resource Management, Office of the Provost 51
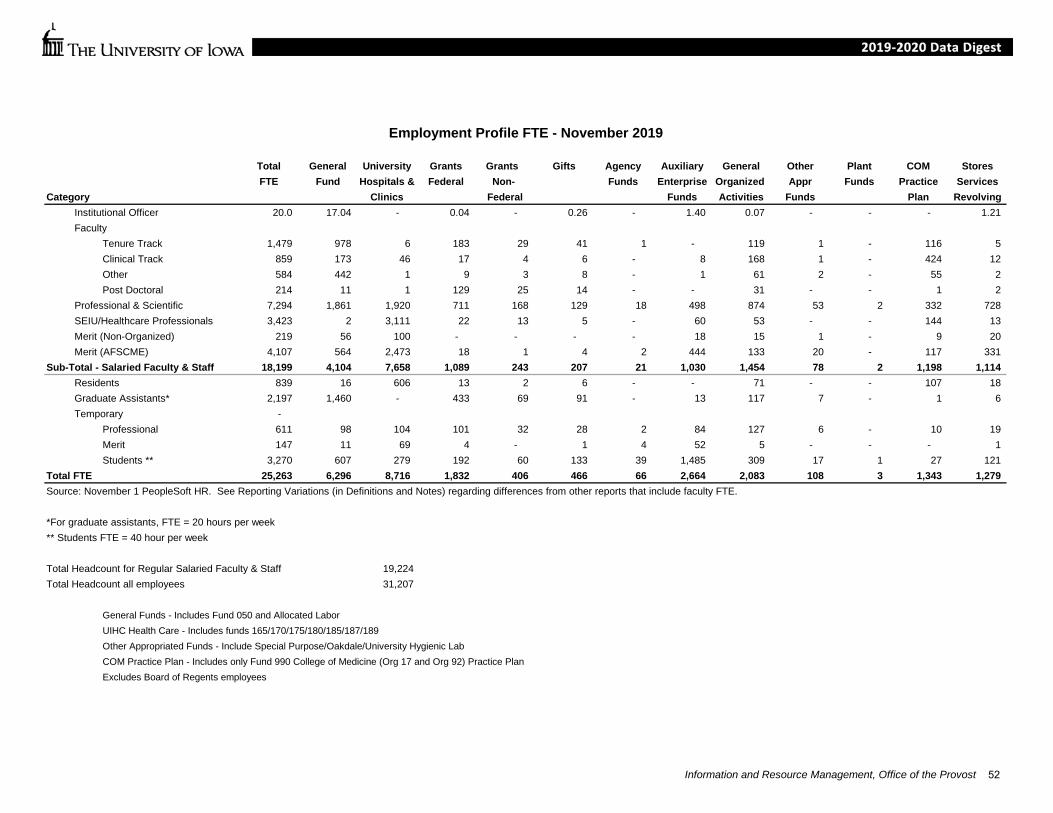
Total General University Grants Grants Gifts Agency Auxiliary General Other Plant COM StoresFTE Fund Hospitals & Federal Non- Funds Enterprise Organized Appr Funds Practice Services
Category Clinics Federal Funds Activities Funds Plan RevolvingInstitutional Officer 20.0 17.04 - 0.04 - 0.26 - 1.40 0.07 - - - 1.21 Faculty
Tenure Track 1,479 978 6 183 29 41 1 - 119 1 - 116 5 Clinical Track 859 173 46 17 4 6 - 8 168 1 - 424 12 Other 584 442 1 9 3 8 - 1 61 2 - 55 2 Post Doctoral 214 11 1 129 25 14 - - 31 - - 1 2
Professional & Scientific 7,294 1,861 1,920 711 168 129 18 498 874 53 2 332 728 SEIU/Healthcare Professionals 3,423 2 3,111 22 13 5 - 60 53 - - 144 13 Merit (Non-Organized) 219 56 100 - - - - 18 15 1 - 9 20 Merit (AFSCME) 4,107 564 2,473 18 1 4 2 444 133 20 - 117 331
Sub-Total - Salaried Faculty & Staff 18,199 4,104 7,658 1,089 243 207 21 1,030 1,454 78 2 1,198 1,114 Residents 839 16 606 13 2 6 - - 71 - - 107 18 Graduate Assistants* 2,197 1,460 - 433 69 91 - 13 117 7 - 1 6 Temporary -
Professional 611 98 104 101 32 28 2 84 127 6 - 10 19 Merit 147 11 69 4 - 1 4 52 5 - - - 1 Students ** 3,270 607 279 192 60 133 39 1,485 309 17 1 27 121
Total FTE 25,263 6,296 8,716 1,832 406 466 66 2,664 2,083 108 3 1,343 1,279 Source: November 1 PeopleSoft HR. See Reporting Variations (in Definitions and Notes) regarding differences from other reports that include faculty FTE.
*For graduate assistants, FTE = 20 hours per week** Students FTE = 40 hour per week
Total Headcount for Regular Salaried Faculty & Staff 19,224 Total Headcount all employees 31,207
General Funds - Includes Fund 050 and Allocated LaborUIHC Health Care - Includes funds 165/170/175/180/185/187/189Other Appropriated Funds - Include Special Purpose/Oakdale/University Hygienic LabCOM Practice Plan - Includes only Fund 990 College of Medicine (Org 17 and Org 92) Practice PlanExcludes Board of Regents employees
Employment Profile FTE - November 2019
Information and Resource Management, Office of the Provost 52

Total General University Grants Grants Gifts Agency Auxiliary General Other Plant COM StoresCount Fund Hospitals & Federal Non- Funds Enterprise Organized Appr Funds Practice Services
Category - Regular Clinics Federal Funds Activities Funds Plan RevolvingInstitutional Officer 20.0 17.03 - 0.04 - 0.27 - 1.40 0.02 - - - 1.21 Faculty
Tenure Track 1,602 1,086 7 182 31 43 1 - 122 2 - 122 6 Clinical Track 922 202 48 19 4 7 - 8 174 1 - 447 12 Other 561 420 1 7 3 6 - - 67 2 - 53 2
Professional & Scientific 7,463 1,910 1,957 736 170 136 18 502 899 54 2 337 742 SEIU/Healthcare Professionals 3,947 2 3,606 23 15 5 - 70 59 - - 153 14 Merit (Non-Organized) 222 57 101 - - - - 18 16 1 - 9 20 Merit (AFSCME) 4,487 576 2,806 20 1 4 2 459 144 21 - 117 337
Sub-Total - Regular Faculty & Staff 19,224 4,270 8,526 987 224 201 21 1,058 1,481 81 2 1,238 1,134 Category - Temporary
213 11 1 127 26 14 - - 31 - - 1 2 Residents 859 16 616 13 2 6 - - 72 - - 116 18 Graduate Assistants 2,697 1,870 - 459 78 115 - 15 144 8 - 1 7 Faculty 439 347 1 5 1 7 - 1 57 2 - 17 1
1,108 191 202 160 52 50 3 153 231 12 - 18 36 286 21 133 8 - 1 7 103 11 - - - 2
6,381 1,161 557 365 111 246 77 2,954 582 33 1 53 241 Total Headcount 31,207 7,887 10,036 2,124 494 640 108 4,284 2,609 136 3 1,444 1,441 Source: November 1 PeopleSoft HR. See Reporting Variations (in Definitions and Notes) regarding differences from other reports that include faculty headcounts.
Primary Job only - This is calculated daily based on Job Type and % of time on each job recordGeneral Funds - Includes Fund 050 and Allocated LaborUIHC Health Care - Includes funds 165/170/175/180/185/187/189Other Appropriated Funds - Include Special Purpose/Oakdale/University Hygienic LabCOM Practice Plan - Includes only Fund 990 College of Medicine (Org 17 and 92) Practice PlanExcludes BOR employees
Employment Profile Headcount - November 2019
Post Doctoral
ProfessionalMeritStudents
Information and Resource Management, Office of the Provost 53
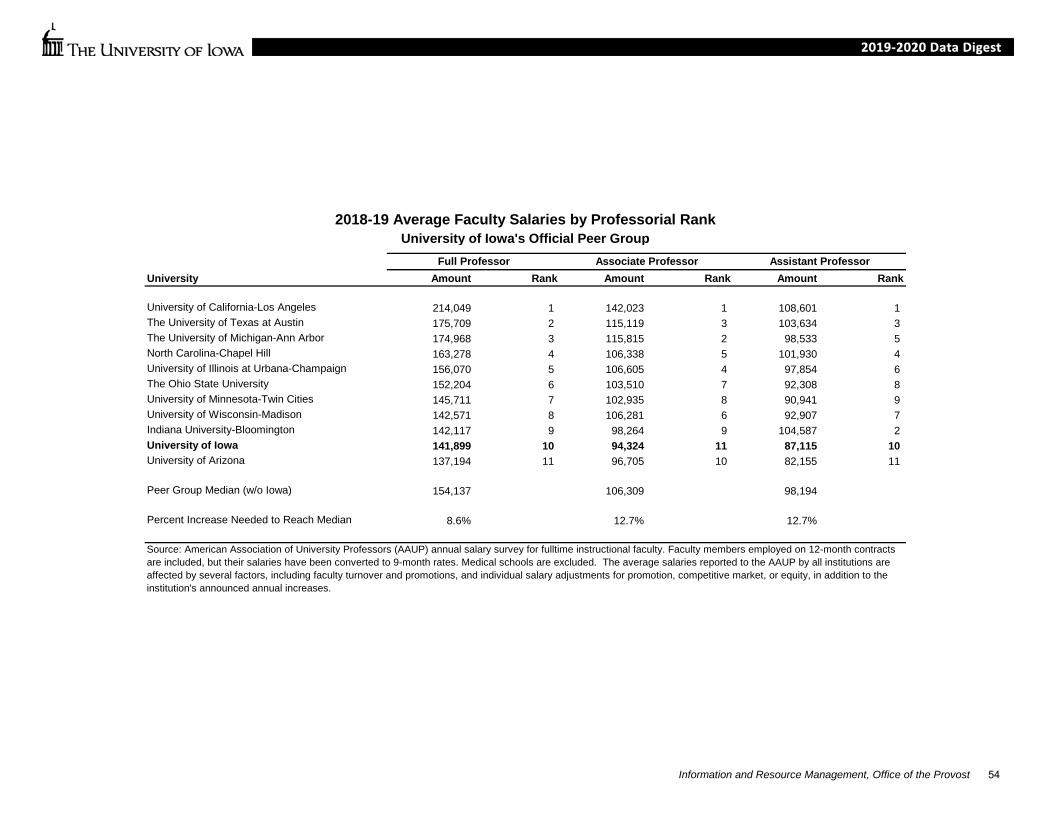
Full Professor Associate Professor Assistant ProfessorUniversity Amount Rank Amount Rank Amount Rank
University of California-Los Angeles 214,049 1 142,023 1 108,601 1 The University of Texas at Austin 175,709 2 115,119 3 103,634 3 The University of Michigan-Ann Arbor 174,968 3 115,815 2 98,533 5 North Carolina-Chapel Hill 163,278 4 106,338 5 101,930 4 University of Illinois at Urbana-Champaign 156,070 5 106,605 4 97,854 6 The Ohio State University 152,204 6 103,510 7 92,308 8 University of Minnesota-Twin Cities 145,711 7 102,935 8 90,941 9 University of Wisconsin-Madison 142,571 8 106,281 6 92,907 7 Indiana University-Bloomington 142,117 9 98,264 9 104,587 2 University of Iowa 141,899 10 94,324 11 87,115 10 University of Arizona 137,194 11 96,705 10 82,155 11
Peer Group Median (w/o Iowa) 154,137 106,309 98,194
Percent Increase Needed to Reach Median 8.6% 12.7% 12.7%
2018-19 Average Faculty Salaries by Professorial RankUniversity of Iowa's Official Peer Group
Source: American Association of University Professors (AAUP) annual salary survey for fulltime instructional faculty. Faculty members employed on 12-month contracts are included, but their salaries have been converted to 9-month rates. Medical schools are excluded. The average salaries reported to the AAUP by all institutions are affected by several factors, including faculty turnover and promotions, and individual salary adjustments for promotion, competitive market, or equity, in addition to the institution's announced annual increases.
Information and Resource Management, Office of the Provost 54
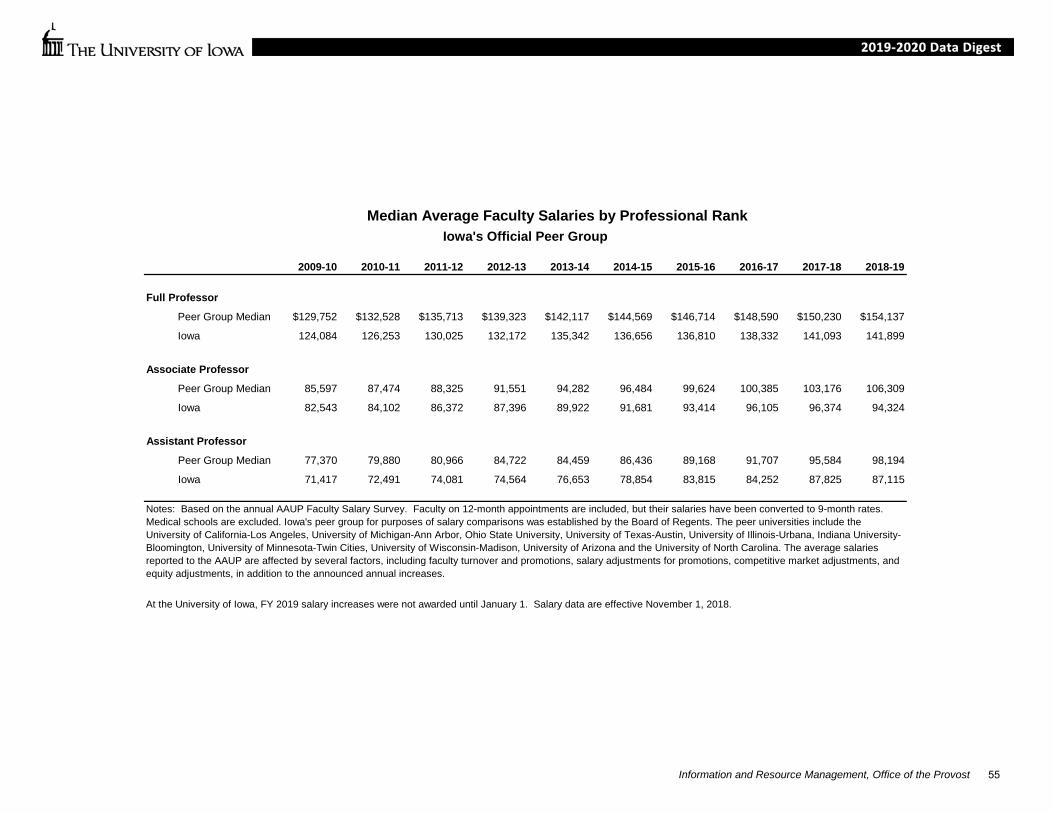
Median Average Faculty Salaries by Professional Rank
2009-10 2010-11 2011-12 2012-13 2013-14 2014-15 2015-16 2016-17 2017-18 2018-19
Full Professor
Peer Group Median $129,752 $132,528 $135,713 $139,323 $142,117 $144,569 $146,714 $148,590 $150,230 $154,137
Iowa 124,084 126,253 130,025 132,172 135,342 136,656 136,810 138,332 141,093 141,899
Associate Professor
Peer Group Median 85,597 87,474 88,325 91,551 94,282 96,484 99,624 100,385 103,176 106,309
Iowa 82,543 84,102 86,372 87,396 89,922 91,681 93,414 96,105 96,374 94,324
Assistant Professor
Peer Group Median 77,370 79,880 80,966 84,722 84,459 86,436 89,168 91,707 95,584 98,194
Iowa 71,417 72,491 74,081 74,564 76,653 78,854 83,815 84,252 87,825 87,115
At the University of Iowa, FY 2019 salary increases were not awarded until January 1. Salary data are effective November 1, 2018.
Iowa's Official Peer Group
Notes: Based on the annual AAUP Faculty Salary Survey. Faculty on 12-month appointments are included, but their salaries have been converted to 9-month rates. Medical schools are excluded. Iowa's peer group for purposes of salary comparisons was established by the Board of Regents. The peer universities include the University of California-Los Angeles, University of Michigan-Ann Arbor, Ohio State University, University of Texas-Austin, University of Illinois-Urbana, Indiana University-Bloomington, University of Minnesota-Twin Cities, University of Wisconsin-Madison, University of Arizona and the University of North Carolina. The average salaries reported to the AAUP are affected by several factors, including faculty turnover and promotions, salary adjustments for promotions, competitive market adjustments, and equity adjustments, in addition to the announced annual increases.
Information and Resource Management, Office of the Provost 55
Instruction
Fiscal Year Student Credit Hours by Student Level ............................................... 57 Fiscal Year Student Credit Hours by Section Type and Primary Instructor Category ............................................................................................ 58 Fiscal Year Student Credit Hours by Section Management Type and Primary Instructor Category ............................................................................... 59 Fall Semester Program of Study Count by Primary Student Level and Declaration Type ......................................................................................... 60
56

Fiscal Year Student Credit Hours by Student Level Fiscal Year
Student Level 2010-11 2011-12 2012-13 2013-14 2014-15 2015-16 2016-17 2017-18 2018-19 2019-20Undergraduate 588,386 600,686 608,359 609,998 615,058 638,941 669,474 681,854 686,583 662,628
Freshmen 139,763 140,978 138,379 137,584 137,459 153,563 160,297 141,127 134,246 133,168Sophomores 127,234 134,642 139,051 135,091 136,562 142,157 158,539 165,678 152,583 145,771Juniors 146,382 151,895 152,161 156,093 155,654 156,351 165,025 181,217 185,044 168,812Seniors 161,003 162,072 167,482 169,071 172,736 172,956 172,041 180,975 203,119 204,392Unclassified 14,004 11,099 11,286 12,159 12,647 13,914 13,572 12,857 11,591 10,485
Graduate 111,733 109,457 107,176 103,736 101,044 96,202 97,608 98,691 100,500 102,497Master's 63,879 62,025 59,165 56,586 55,888 54,216 54,517 55,646 56,953 60,404Doctoral 42,299 42,402 42,926 42,445 39,982 37,190 37,477 37,329 37,819 37,054Other 5,555 5,030 5,085 4,705 5,174 4,796 5,614 5,716 5,728 5,039
Professional 75,553 74,877 74,115 72,880 73,009 72,607 75,637 75,378 75,320 76,108Dentistry (DDS) 17,455 17,178 17,505 17,756 18,216 17,602 18,316 18,576 18,947 18,967Law (JD) 16,422 15,887 14,947 11,747 11,139 11,334 11,993 11,881 12,007 12,143Medicine (MD) 25,460 25,157 25,426 27,018 27,294 27,219 28,408 28,288 27,884 28,149Pharmacy (PharmD) 16,216 16,655 16,237 16,359 16,360 16,452 16,920 16,633 16,482 16,849
Postgraduate 0 7 1 0 0 0 0 0 0 0Total 775,672 785,027 789,651 786,614 789,111 807,750 842,719 855,923 862,403 841,233Source: MAUI/Registrar's data warehouse (see Note 1); enrollment and credit hour data as of census date each session.Note: The fiscal year includes the summer, fall, winter, and spring semesters (e.g., 2017-18 includes summer 2017, fall 2017, winter 2017-18, spring 2018).
0%20%40%60%80%
100%120%140%
10-11 11-12 12-13 13-14 14-15 15-16 16-17 17-18 18-19 19-20
Perc
ent
Student Credit Hours as a Percent of 2010-11 Level
Undergraduate Graduate Professional
Undergraduate79%
Graduate12%
Professional9%
Student Credit Hours by Student Level2019-20
Information and Resource Management, Office of the Provost 57
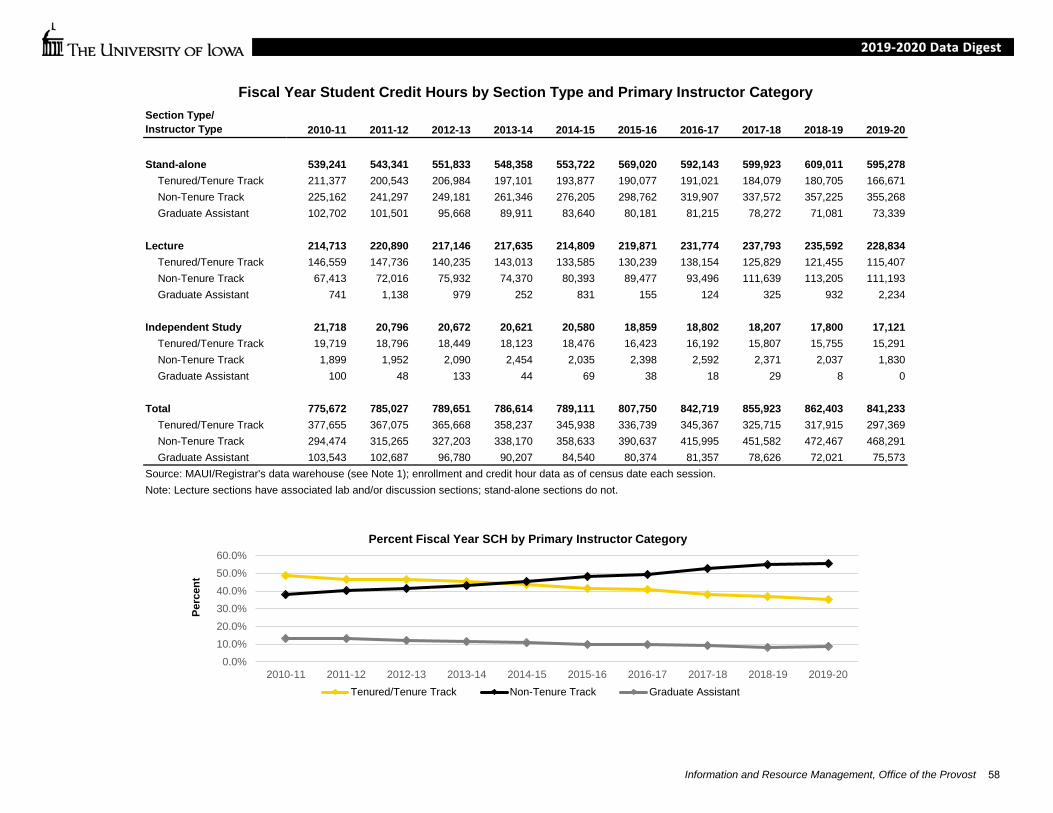
Section Type/Instructor Type 2010-11 2011-12 2012-13 2013-14 2014-15 2015-16 2016-17 2017-18 2018-19 2019-20
Stand-alone 539,241 543,341 551,833 548,358 553,722 569,020 592,143 599,923 609,011 595,278Tenured/Tenure Track 211,377 200,543 206,984 197,101 193,877 190,077 191,021 184,079 180,705 166,671Non-Tenure Track 225,162 241,297 249,181 261,346 276,205 298,762 319,907 337,572 357,225 355,268Graduate Assistant 102,702 101,501 95,668 89,911 83,640 80,181 81,215 78,272 71,081 73,339
Lecture 214,713 220,890 217,146 217,635 214,809 219,871 231,774 237,793 235,592 228,834Tenured/Tenure Track 146,559 147,736 140,235 143,013 133,585 130,239 138,154 125,829 121,455 115,407Non-Tenure Track 67,413 72,016 75,932 74,370 80,393 89,477 93,496 111,639 113,205 111,193Graduate Assistant 741 1,138 979 252 831 155 124 325 932 2,234
Independent Study 21,718 20,796 20,672 20,621 20,580 18,859 18,802 18,207 17,800 17,121Tenured/Tenure Track 19,719 18,796 18,449 18,123 18,476 16,423 16,192 15,807 15,755 15,291Non-Tenure Track 1,899 1,952 2,090 2,454 2,035 2,398 2,592 2,371 2,037 1,830Graduate Assistant 100 48 133 44 69 38 18 29 8 0
Total 775,672 785,027 789,651 786,614 789,111 807,750 842,719 855,923 862,403 841,233Tenured/Tenure Track 377,655 367,075 365,668 358,237 345,938 336,739 345,367 325,715 317,915 297,369Non-Tenure Track 294,474 315,265 327,203 338,170 358,633 390,637 415,995 451,582 472,467 468,291Graduate Assistant 103,543 102,687 96,780 90,207 84,540 80,374 81,357 78,626 72,021 75,573
Source: MAUI/Registrar's data warehouse (see Note 1); enrollment and credit hour data as of census date each session.Note: Lecture sections have associated lab and/or discussion sections; stand-alone sections do not.
Fiscal Year Student Credit Hours by Section Type and Primary Instructor Category
0.0%10.0%20.0%30.0%40.0%50.0%60.0%
2010-11 2011-12 2012-13 2013-14 2014-15 2015-16 2016-17 2017-18 2018-19 2019-20
Perc
ent
Percent Fiscal Year SCH by Primary Instructor Category
Tenured/Tenure Track Non-Tenure Track Graduate Assistant
Information and Resource Management, Office of the Provost 58
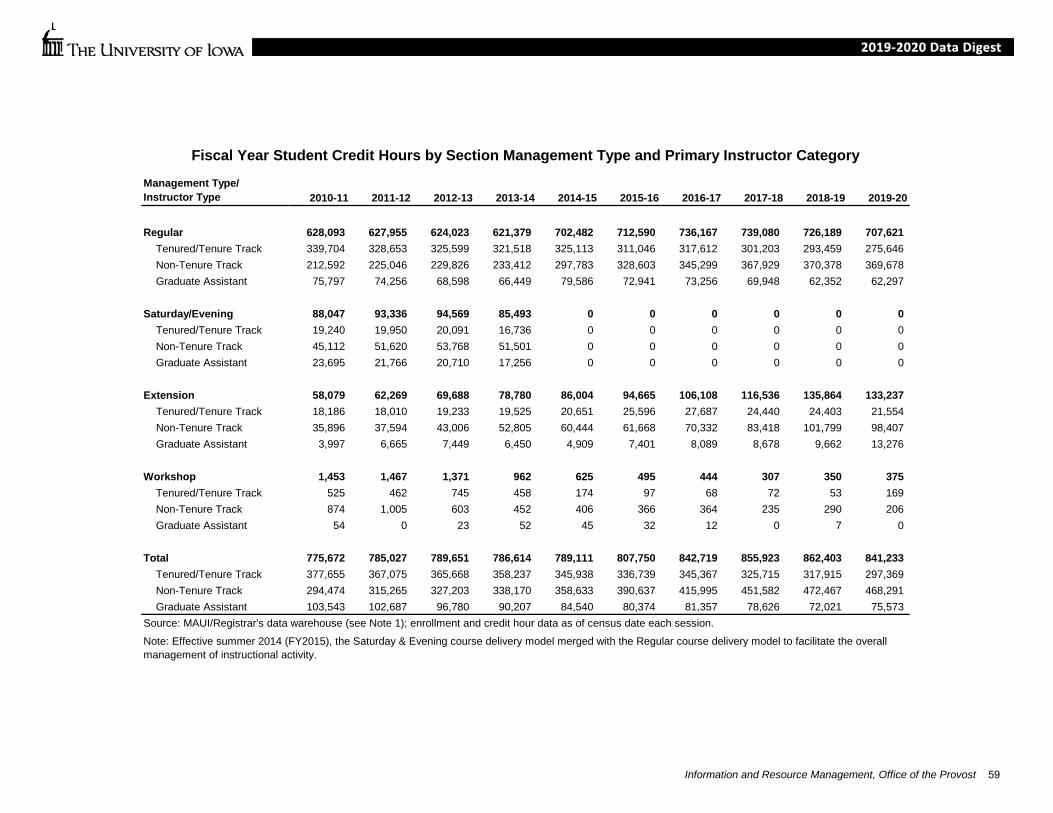
Management Type/ Instructor Type 2010-11 2011-12 2012-13 2013-14 2014-15 2015-16 2016-17 2017-18 2018-19 2019-20
Regular 628,093 627,955 624,023 621,379 702,482 712,590 736,167 739,080 726,189 707,621Tenured/Tenure Track 339,704 328,653 325,599 321,518 325,113 311,046 317,612 301,203 293,459 275,646Non-Tenure Track 212,592 225,046 229,826 233,412 297,783 328,603 345,299 367,929 370,378 369,678Graduate Assistant 75,797 74,256 68,598 66,449 79,586 72,941 73,256 69,948 62,352 62,297
Saturday/Evening 88,047 93,336 94,569 85,493 0 0 0 0 0 0Tenured/Tenure Track 19,240 19,950 20,091 16,736 0 0 0 0 0 0Non-Tenure Track 45,112 51,620 53,768 51,501 0 0 0 0 0 0Graduate Assistant 23,695 21,766 20,710 17,256 0 0 0 0 0 0
Extension 58,079 62,269 69,688 78,780 86,004 94,665 106,108 116,536 135,864 133,237Tenured/Tenure Track 18,186 18,010 19,233 19,525 20,651 25,596 27,687 24,440 24,403 21,554Non-Tenure Track 35,896 37,594 43,006 52,805 60,444 61,668 70,332 83,418 101,799 98,407Graduate Assistant 3,997 6,665 7,449 6,450 4,909 7,401 8,089 8,678 9,662 13,276
Workshop 1,453 1,467 1,371 962 625 495 444 307 350 375Tenured/Tenure Track 525 462 745 458 174 97 68 72 53 169Non-Tenure Track 874 1,005 603 452 406 366 364 235 290 206Graduate Assistant 54 0 23 52 45 32 12 0 7 0
Total 775,672 785,027 789,651 786,614 789,111 807,750 842,719 855,923 862,403 841,233Tenured/Tenure Track 377,655 367,075 365,668 358,237 345,938 336,739 345,367 325,715 317,915 297,369Non-Tenure Track 294,474 315,265 327,203 338,170 358,633 390,637 415,995 451,582 472,467 468,291Graduate Assistant 103,543 102,687 96,780 90,207 84,540 80,374 81,357 78,626 72,021 75,573
Source: MAUI/Registrar's data warehouse (see Note 1); enrollment and credit hour data as of census date each session.
Fiscal Year Student Credit Hours by Section Management Type and Primary Instructor Category
Note: Effective summer 2014 (FY2015), the Saturday & Evening course delivery model merged with the Regular course delivery model to facilitate the overall management of instructional activity.
Information and Resource Management, Office of the Provost 59
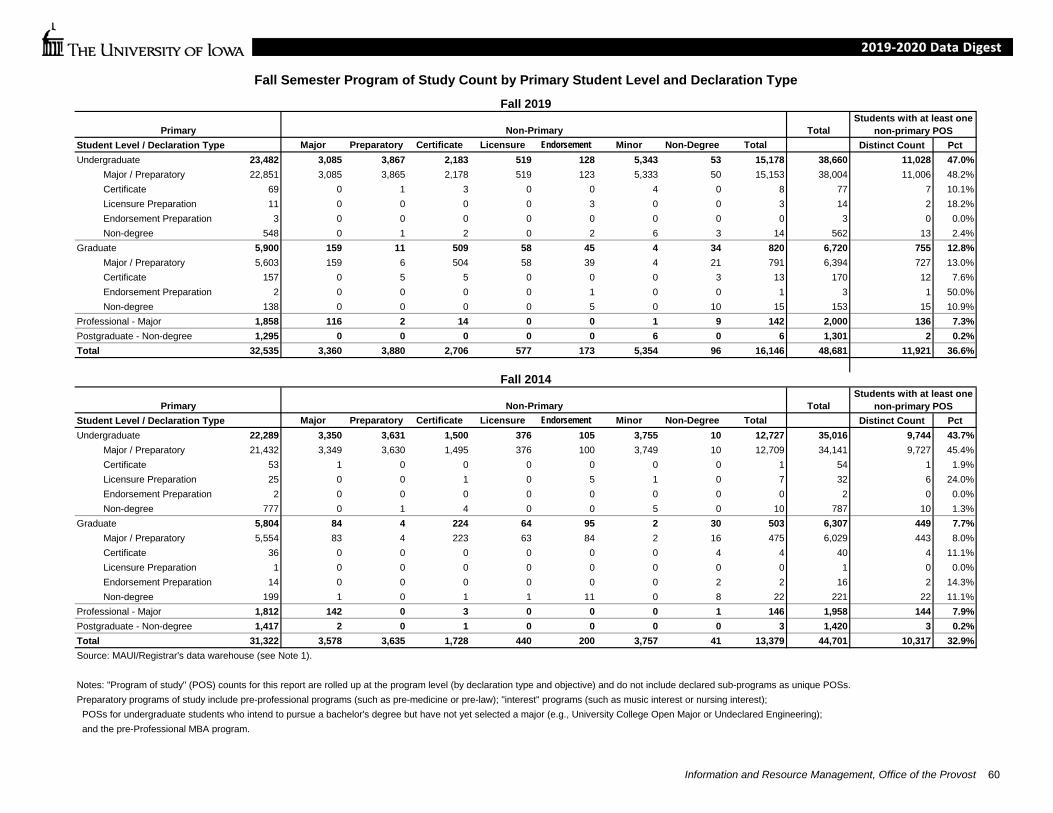
Fall Semester Program of Study Count by Primary Student Level and Declaration TypeFall 2019
Primary Non-Primary TotalStudents with at least one
non-primary POSStudent Level / Declaration Type Major Preparatory Certificate Licensure Endorsement Minor Non-Degree Total Distinct Count PctUndergraduate 23,482 3,085 3,867 2,183 519 128 5,343 53 15,178 38,660 11,028 47.0%
Major / Preparatory 22,851 3,085 3,865 2,178 519 123 5,333 50 15,153 38,004 11,006 48.2%Certificate 69 0 1 3 0 0 4 0 8 77 7 10.1%Licensure Preparation 11 0 0 0 0 3 0 0 3 14 2 18.2%Endorsement Preparation 3 0 0 0 0 0 0 0 0 3 0 0.0%Non-degree 548 0 1 2 0 2 6 3 14 562 13 2.4%
Graduate 5,900 159 11 509 58 45 4 34 820 6,720 755 12.8%Major / Preparatory 5,603 159 6 504 58 39 4 21 791 6,394 727 13.0%Certificate 157 0 5 5 0 0 0 3 13 170 12 7.6%Endorsement Preparation 2 0 0 0 0 1 0 0 1 3 1 50.0%Non-degree 138 0 0 0 0 5 0 10 15 153 15 10.9%
Professional - Major 1,858 116 2 14 0 0 1 9 142 2,000 136 7.3%Postgraduate - Non-degree 1,295 0 0 0 0 0 6 0 6 1,301 2 0.2%Total 32,535 3,360 3,880 2,706 577 173 5,354 96 16,146 48,681 11,921 36.6%
Fall 2014
Primary Non-Primary TotalStudents with at least one
non-primary POSStudent Level / Declaration Type Major Preparatory Certificate Licensure Endorsement Minor Non-Degree Total Distinct Count PctUndergraduate 22,289 3,350 3,631 1,500 376 105 3,755 10 12,727 35,016 9,744 43.7%
Major / Preparatory 21,432 3,349 3,630 1,495 376 100 3,749 10 12,709 34,141 9,727 45.4%Certificate 53 1 0 0 0 0 0 0 1 54 1 1.9%Licensure Preparation 25 0 0 1 0 5 1 0 7 32 6 24.0%Endorsement Preparation 2 0 0 0 0 0 0 0 0 2 0 0.0%Non-degree 777 0 1 4 0 0 5 0 10 787 10 1.3%
Graduate 5,804 84 4 224 64 95 2 30 503 6,307 449 7.7%Major / Preparatory 5,554 83 4 223 63 84 2 16 475 6,029 443 8.0%Certificate 36 0 0 0 0 0 0 4 4 40 4 11.1%Licensure Preparation 1 0 0 0 0 0 0 0 0 1 0 0.0%Endorsement Preparation 14 0 0 0 0 0 0 2 2 16 2 14.3%Non-degree 199 1 0 1 1 11 0 8 22 221 22 11.1%
Professional - Major 1,812 142 0 3 0 0 0 1 146 1,958 144 7.9%Postgraduate - Non-degree 1,417 2 0 1 0 0 0 0 3 1,420 3 0.2%Total 31,322 3,578 3,635 1,728 440 200 3,757 41 13,379 44,701 10,317 32.9%Source: MAUI/Registrar's data warehouse (see Note 1).
Notes: "Program of study" (POS) counts for this report are rolled up at the program level (by declaration type and objective) and do not include declared sub-programs as unique POSs.Preparatory programs of study include pre-professional programs (such as pre-medicine or pre-law); "interest" programs (such as music interest or nursing interest); POSs for undergraduate students who intend to pursue a bachelor's degree but have not yet selected a major (e.g., University College Open Major or Undeclared Engineering); and the pre-Professional MBA program.
Information and Resource Management, Office of the Provost 60
Research
Extramural Awards ................................................................................................ 62 Federal Research Awards by Agency.................................................................... 63 Non-Federal Research Awards by Source ............................................................ 64 Technology Transfer.............................................................................................. 65 Research & Development Expenditures at Public Big Ten Universities ................. 66
61
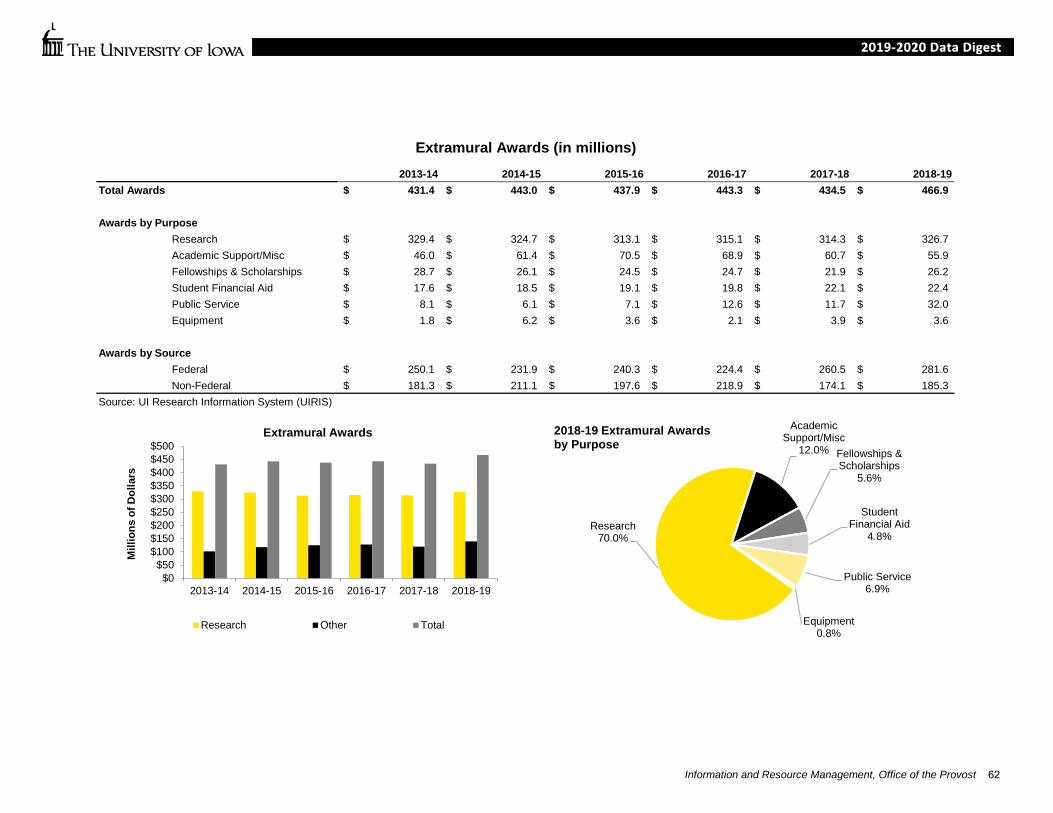
Extramural Awards (in millions)2013-14 2014-15 2015-16 2016-17 2017-18 2018-19
Total Awards 431.4$ 443.0$ 437.9$ 443.3$ 434.5$ 466.9$
Awards by PurposeResearch 329.4$ 324.7$ 313.1$ 315.1$ 314.3$ 326.7$ Academic Support/Misc 46.0$ 61.4$ 70.5$ 68.9$ 60.7$ 55.9$ Fellowships & Scholarships 28.7$ 26.1$ 24.5$ 24.7$ 21.9$ 26.2$ Student Financial Aid 17.6$ 18.5$ 19.1$ 19.8$ 22.1$ 22.4$ Public Service 8.1$ 6.1$ 7.1$ 12.6$ 11.7$ 32.0$ Equipment 1.8$ 6.2$ 3.6$ 2.1$ 3.9$ 3.6$
Awards by SourceFederal 250.1$ 231.9$ 240.3$ 224.4$ 260.5$ 281.6$ Non-Federal 181.3$ 211.1$ 197.6$ 218.9$ 174.1$ 185.3$
Source: UI Research Information System (UIRIS)
$0$50
$100$150$200$250$300$350$400$450$500
2013-14 2014-15 2015-16 2016-17 2017-18 2018-19
Mill
ions
of D
olla
rs
Extramural Awards
Research Other Total
Research70.0%
Academic Support/Misc
12.0% Fellowships & Scholarships
5.6%
Student Financial Aid
4.8%
Public Service6.9%
Equipment0.8%
2018-19 Extramural Awardsby Purpose
Information and Resource Management, Office of the Provost 62
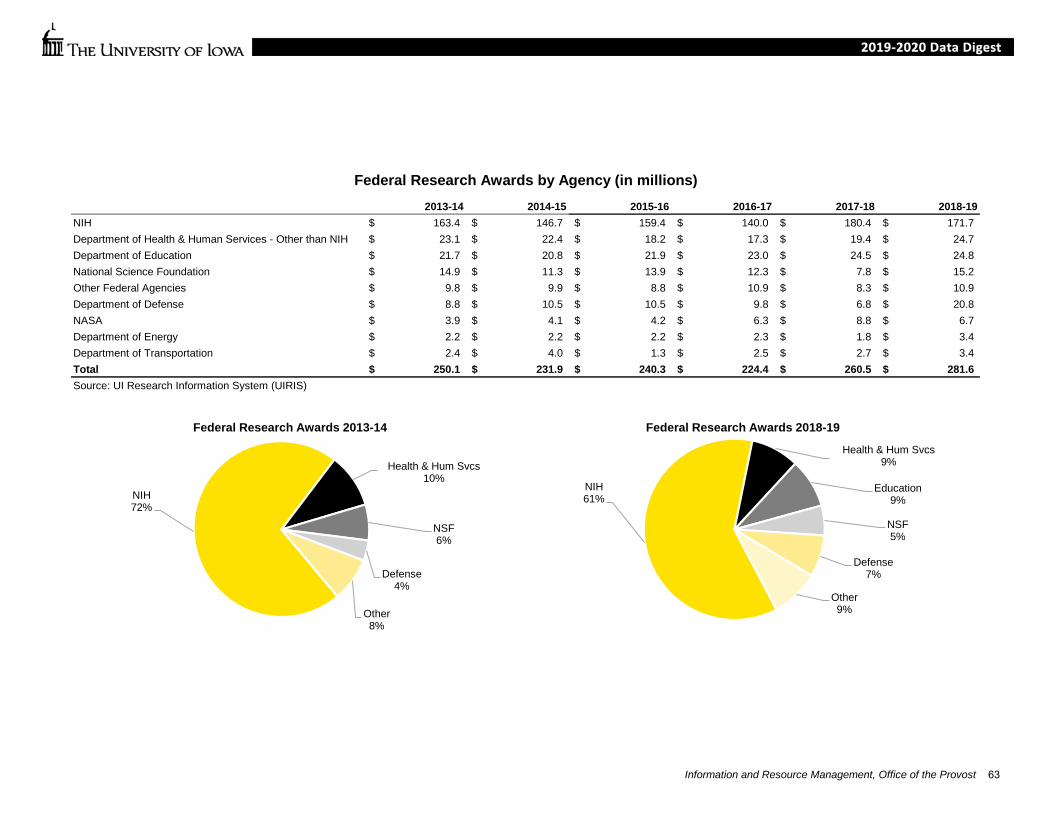
Federal Research Awards by Agency (in millions)2013-14 2014-15 2015-16 2016-17 2017-18 2018-19
NIH 163.4$ 146.7$ 159.4$ 140.0$ 180.4$ 171.7$ Department of Health & Human Services - Other than NIH 23.1$ 22.4$ 18.2$ 17.3$ 19.4$ 24.7$ Department of Education 21.7$ 20.8$ 21.9$ 23.0$ 24.5$ 24.8$ National Science Foundation 14.9$ 11.3$ 13.9$ 12.3$ 7.8$ 15.2$ Other Federal Agencies 9.8$ 9.9$ 8.8$ 10.9$ 8.3$ 10.9$ Department of Defense 8.8$ 10.5$ 10.5$ 9.8$ 6.8$ 20.8$ NASA 3.9$ 4.1$ 4.2$ 6.3$ 8.8$ 6.7$ Department of Energy 2.2$ 2.2$ 2.2$ 2.3$ 1.8$ 3.4$ Department of Transportation 2.4$ 4.0$ 1.3$ 2.5$ 2.7$ 3.4$ Total 250.1$ 231.9$ 240.3$ 224.4$ 260.5$ 281.6$ Source: UI Research Information System (UIRIS)
NIH72%
Health & Hum Svcs10%
NSF6%
Defense4%
Other8%
Federal Research Awards 2013-14
NIH61%
Health & Hum Svcs9%
Education9%
NSF5%
Defense7%
Other9%
Federal Research Awards 2018-19
Information and Resource Management, Office of the Provost 63

Non-Federal Research Awards by Source (in millions)2013-14 2014-15 2015-16 2016-17 2017-18 2018-19
Industry 71.4$ 91.7$ 75.9$ 83.3$ 70.1$ 59.4$ State and Local Governments 32.8$ 47.5$ 41.7$ 55.4$ 30.3$ 47.7$ Non-Profit Organizations 43.8$ 39.0$ 44.9$ 40.0$ 37.4$ 41.9$ Educational Institutions/Hospitals 33.2$ 32.5$ 34.8$ 40.0$ 36.2$ 36.3$ Foreign Governments 0.1$ 0.4$ 0.3$ 0.2$ 0.0$ 0.1$ Individuals 0.0$ 0.0$ 0.0$ 0.0$ 0.0$ -$ Total 181.3$ 211.1$ 197.6$ 218.8$ 174.1$ 185.4$ Source: UI Research Information System (UIRIS)
Industry32%
State and Local Governments
26%
Non-Profit Organizations
23%
Educational Institutions/Hospitals
19%
Non-FederalResearch Awardsin 2018-19Industry
40%
State and Local Governments
18%
Non-Profit Organizations
24%Educational Institutions/Hospitals
18%
Non-FederalResearch Awardsin 2013-14
Information and Resource Management, Office of the Provost 64

Technology TransferDescription 2010 2011 2012 2013 2014 2015 2016 2017 2018 2019
Annual number of:Invention disclosures received 70 68 102 98 139 147 151 93 143 83U. S. patent applications filed 61 62 72 85 90 110 142 83 79 53New applications filed 23 27 40 53 30 58 69 33 38 37U.S. patents issued 32 31 31 24 25 24 25 24 27 22Options/licenses executed 22 23 21 29 32 40 40 60 51 48Number of license and option agreements generating income 129 94 94 65 90 98 148 122 127 85
License revenue (in millions) $26.99 $6.28 $7.23 $1.38 $1.79 $1.50 $2.75 $1.83 $1.73 $1.77Source: UI Research Foundation
$0
$5
$10
$15
$20
$25
$30
0
20
40
60
80
100
120
140
160
2010 2011 2012 2013 2014 2015 2016 2017 2018 2019
Lice
nsin
g In
com
e (m
illion
s)
Annu
al N
umbe
r
Series1 Series2
Series3 Series4
Information and Resource Management, Office of the Provost 65
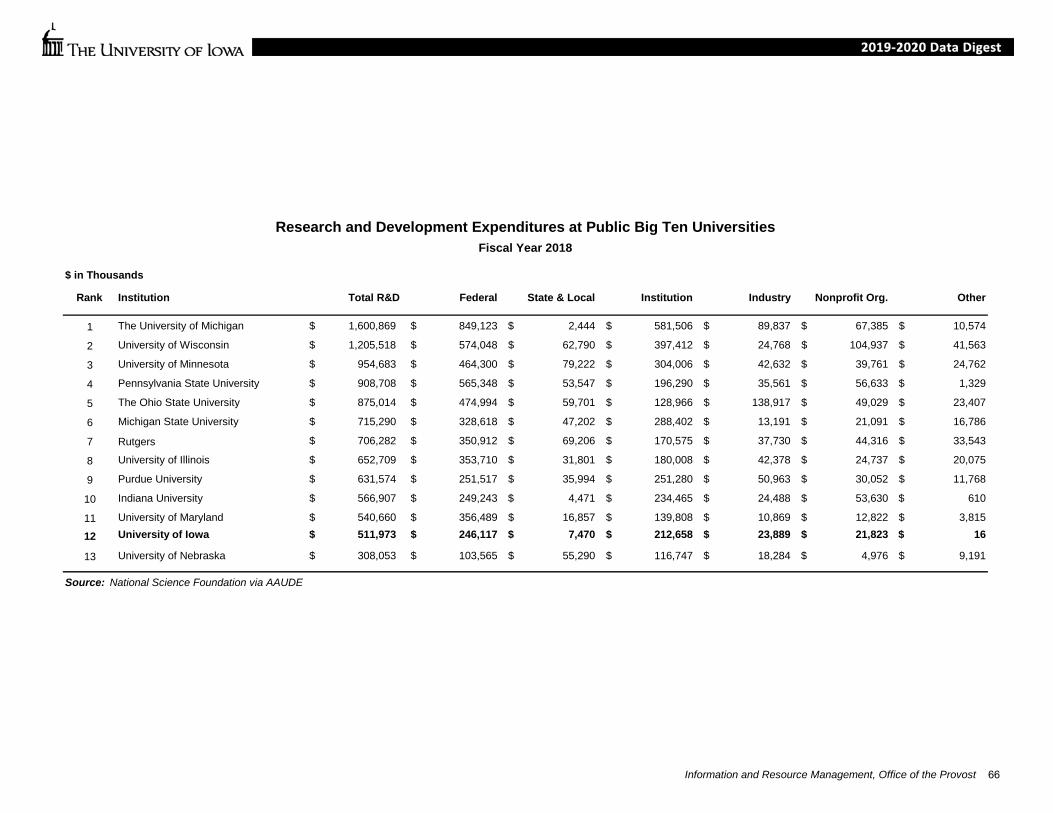
Rank Institution Total R&D Federal State & Local Institution Industry Nonprofit Org. Other
1 The University of Michigan $ 1,600,869 $ 849,123 $ 2,444 $ 581,506 $ 89,837 $ 67,385 $ 10,574
2 University of Wisconsin $ 1,205,518 $ 574,048 $ 62,790 $ 397,412 $ 24,768 $ 104,937 $ 41,563
3 University of Minnesota $ 954,683 $ 464,300 $ 79,222 $ 304,006 $ 42,632 $ 39,761 $ 24,762
4 Pennsylvania State University $ 908,708 $ 565,348 $ 53,547 $ 196,290 $ 35,561 $ 56,633 $ 1,329
5 The Ohio State University $ 875,014 $ 474,994 $ 59,701 $ 128,966 $ 138,917 $ 49,029 $ 23,407
6 Michigan State University $ 715,290 $ 328,618 $ 47,202 $ 288,402 $ 13,191 $ 21,091 $ 16,786
7 Rutgers $ 706,282 $ 350,912 $ 69,206 $ 170,575 $ 37,730 $ 44,316 $ 33,543
8 University of Illinois $ 652,709 $ 353,710 $ 31,801 $ 180,008 $ 42,378 $ 24,737 $ 20,075
9 Purdue University $ 631,574 $ 251,517 $ 35,994 $ 251,280 $ 50,963 $ 30,052 $ 11,768
10 Indiana University $ 566,907 $ 249,243 $ 4,471 $ 234,465 $ 24,488 $ 53,630 $ 610
11 University of Maryland $ 540,660 $ 356,489 $ 16,857 $ 139,808 $ 10,869 $ 12,822 $ 3,815
12 University of Iowa $ 511,973 $ 246,117 $ 7,470 $ 212,658 $ 23,889 $ 21,823 $ 16
13 University of Nebraska $ 308,053 $ 103,565 $ 55,290 $ 116,747 $ 18,284 $ 4,976 $ 9,191
Source: National Science Foundation via AAUDE
Research and Development Expenditures at Public Big Ten UniversitiesFiscal Year 2018
$ in Thousands
Information and Resource Management, Office of the Provost 66

Finance
University of Iowa Revenue ................................................................................... 68 University of Iowa Operating Expenses by Function .............................................. 69 University of Iowa General Education Fund Budget - Revenues ........................... 70 University of Iowa General Education Fund Budget - Expenditures ....................... 71 Academic Year Tuition & Required Fees at Public Big Ten Universities ................ 72 Trends in Academic Year Tuition and Required Fees............................................ 73 Undergraduate Cost of Attendance per Academic Year ........................................ 74 Student Financial Aid Awards by Type .................................................................. 75 Endowment Pool ................................................................................................... 77
67
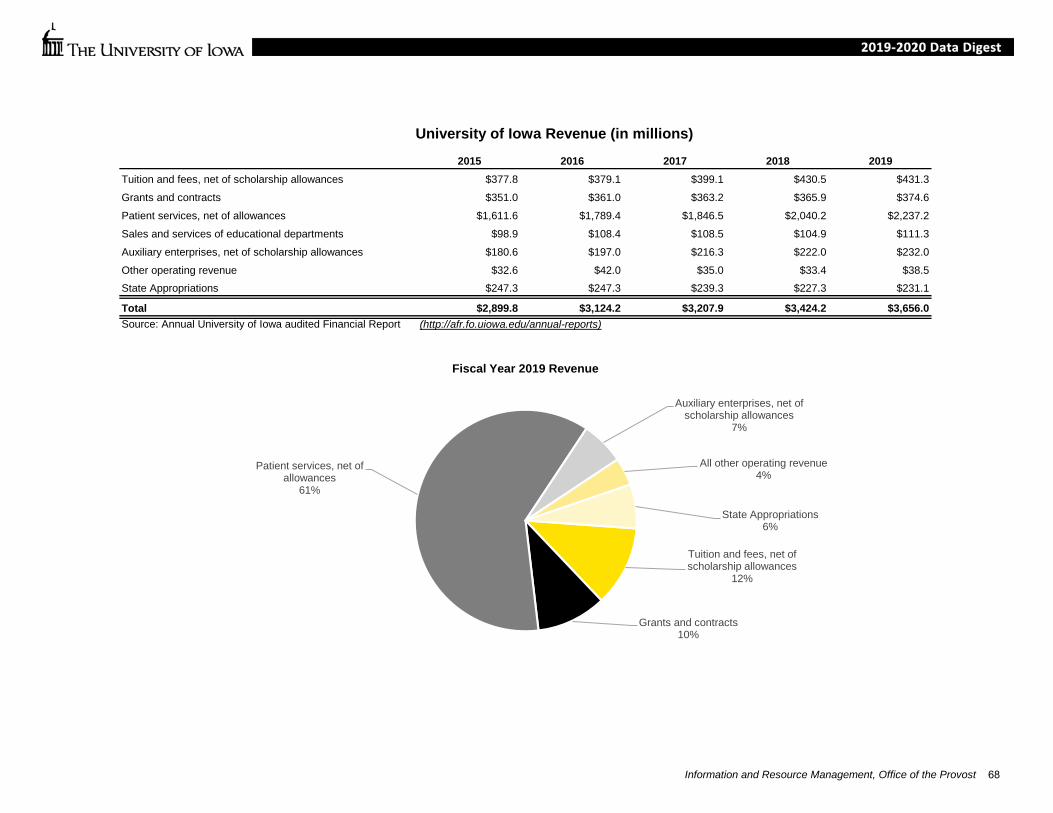
University of Iowa Revenue (in millions)2015 2016 2017 2018 2019
Tuition and fees, net of scholarship allowances $377.8 $379.1 $399.1 $430.5 $431.3Grants and contracts $351.0 $361.0 $363.2 $365.9 $374.6Patient services, net of allowances $1,611.6 $1,789.4 $1,846.5 $2,040.2 $2,237.2Sales and services of educational departments $98.9 $108.4 $108.5 $104.9 $111.3Auxiliary enterprises, net of scholarship allowances $180.6 $197.0 $216.3 $222.0 $232.0Other operating revenue $32.6 $42.0 $35.0 $33.4 $38.5State Appropriations $247.3 $247.3 $239.3 $227.3 $231.1
Total $2,899.8 $3,124.2 $3,207.9 $3,424.2 $3,656.0Source: Annual University of Iowa audited Financial Report (http://afr.fo.uiowa.edu/annual-reports)
Tuition and fees, net of scholarship allowances
12%
Grants and contracts10%
Patient services, net of allowances
61%
Auxiliary enterprises, net of scholarship allowances
7%
All other operating revenue4%
State Appropriations6%
Fiscal Year 2019 Revenue
Information and Resource Management, Office of the Provost 68
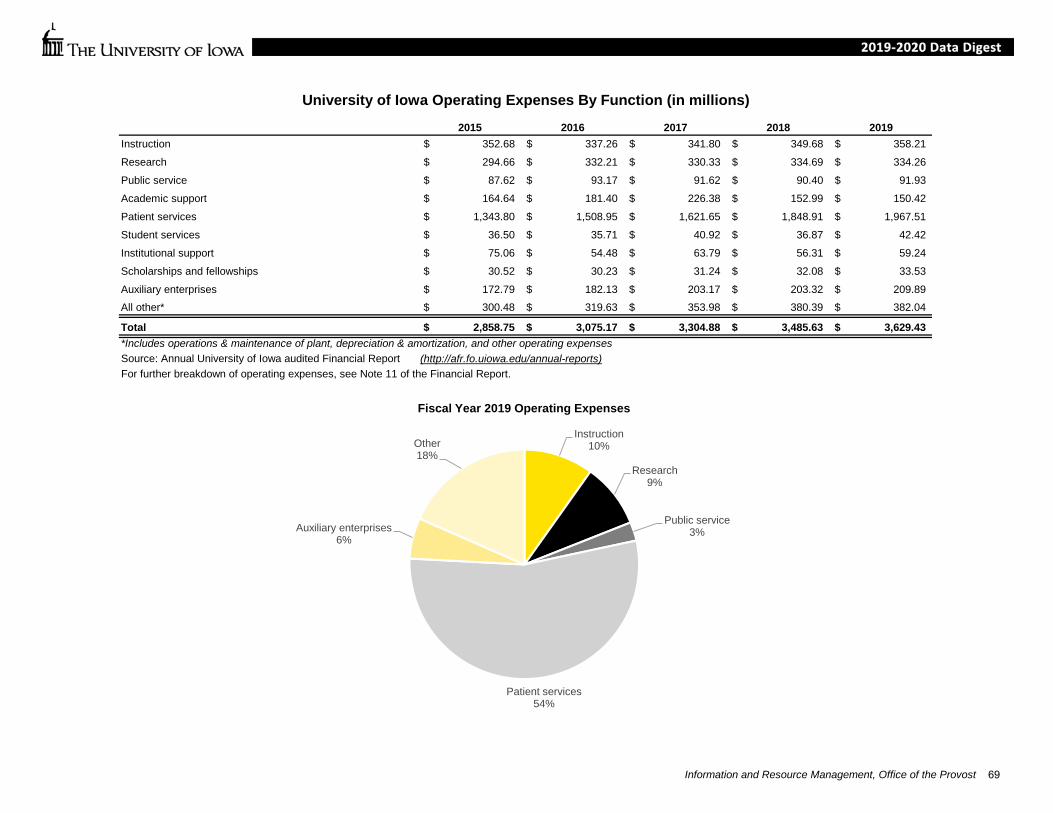
University of Iowa Operating Expenses By Function (in millions)2015 2016 2017 2018 2019
Instruction 352.68$ 337.26$ 341.80$ 349.68$ 358.21$ Research 294.66$ 332.21$ 330.33$ 334.69$ 334.26$ Public service 87.62$ 93.17$ 91.62$ 90.40$ 91.93$ Academic support 164.64$ 181.40$ 226.38$ 152.99$ 150.42$ Patient services 1,343.80$ 1,508.95$ 1,621.65$ 1,848.91$ 1,967.51$ Student services 36.50$ 35.71$ 40.92$ 36.87$ 42.42$ Institutional support 75.06$ 54.48$ 63.79$ 56.31$ 59.24$ Scholarships and fellowships 30.52$ 30.23$ 31.24$ 32.08$ 33.53$ Auxiliary enterprises 172.79$ 182.13$ 203.17$ 203.32$ 209.89$ All other* 300.48$ 319.63$ 353.98$ 380.39$ 382.04$
Total 2,858.75$ 3,075.17$ 3,304.88$ 3,485.63$ 3,629.43$ *Includes operations & maintenance of plant, depreciation & amortization, and other operating expensesSource: Annual University of Iowa audited Financial Report (http://afr.fo.uiowa.edu/annual-reports)For further breakdown of operating expenses, see Note 11 of the Financial Report.
Instruction10%
Research9%
Public service3%
Patient services54%
Auxiliary enterprises6%
Other18%
Fiscal Year 2019 Operating Expenses
Information and Resource Management, Office of the Provost 69

University of Iowa General Education Fund BudgetRevenues
2015-2016 2016-2017 2017-2018 2018-2019 2019-2020
State Appropriations $230,923,005 $232,223,005 $216,759,067 $214,710,793 $218,710,793
Tuition and Fees $432,583,000 $459,794,000 $477,361,000 $482,838,675 $477,684,807Reimbursed Indirect Costs $39,648,000 $42,648,000 $44,467,000 $46,333,136 $48,109,192Interest $1,867,995 $1,267,995 $1,100,000 $1,100,000 $1,445,000Other Income $125,000 $125,000 $24,933 $24,933 $25,208
TOTAL REVENUES $705,147,000 $736,058,000 $739,712,000 $745,007,537 $745,975,000
Source: UI Annual Budget Reports (https://fmb.fo.uiowa.edu/university-budget)
Tuition & Fees64.0%
Reimbursed Indirect Costs,
Interest, & Other Income
6.6%
State Apppropriations
29.3%
General Fund Budgeted Revenues FY 2020
25.0%
27.0%
29.0%
31.0%
33.0%
35.0%
2016 2017 2018 2019 2020
Percent of GEF Budget Supported by State Appropriations
Information and Resource Management, Office of the Provost 70

University of Iowa General Education Fund BudgetExpenditures
2015-2016 2016-2017 2017-2018 2018-2019 2019-2020
Faculty Salaries $266,700,000 $267,640,000 $275,562,000 $273,641,000 $276,781,191Professional & Scientific Salaries $146,900,000 $145,138,000 $149,778,000 $155,068,000 $160,904,188General Services Salaries $56,600,000 $62,086,000 $61,792,000 $58,540,000 $55,127,656Hourly Wages $5,300,000 $5,700,000 $5,700,000 $5,700,000 $5,700,000 Subtotal $475,500,000 $480,564,000 $492,832,000 $492,949,000 $498,513,035
Professional & Scientific Supplies $44,627,000 $60,875,375 $56,901,675 $59,849,508 $59,267,464Library Acquisitions $19,337,000 $19,287,325 $19,287,325 $19,205,984 $19,231,258Rentals $4,900,000 $5,400,000 $5,900,000 $6,900,000 $6,900,000Utilities $33,875,000 $36,328,000 $37,088,000 $36,964,426 $38,266,426Building Repairs $20,918,000 $24,000,000 $13,232,000 $15,126,230 $15,539,337Auditor of State Reimbursement $680,000 $735,000 $765,000 $765,000 $765,000Equipment $2,400,000 $2,267,000 $2,267,000 $2,344,500 $2,699,500Student Aid $102,910,000 $106,601,300 $111,439,000 $110,902,889 $104,792,980 Subtotal $229,647,000 $255,494,000 $246,880,000 $252,058,537 $247,461,965
TOTAL EXPENDITURES $705,147,000 $736,058,000 $739,712,000 $745,007,537 $745,975,000
Source: UI Annual Budget Reports (https://fmb.fo.uiowa.edu/university-budget)
Faculty Salaries37.1%
Professional & Scientific Salaries
21.6%
General Service Salaries & Wages
8.2%
Library Acquisitions2.6%
Utilities5.1%
Equipment0.4%
P&S Supplies & Services, Other9.0%
Building Repairs2.1%
Student Aid14.0%
General Fund Budgeted Expenditures FY 2020
Information and Resource Management, Office of the Provost 71

Resident Non-Resident Resident Non-ResidentUniversity Amount Rank Amount Rank Amount Rank Amount Rank
Pennsylvania State University 18,450 1 35,514 6 22,994 2 38,728 3 University of Illinois 16,210 2 33,352 7 17,420 7 32,438 7 The University of Michigan 15,558 3 51,200 1 24,218 1 48,532 1 Rutgers University 15,407 4 32,189 9 19,983 3 32,391 8 University of Minnesota 15,027 5 33,325 8 19,221 4 28,845 10 Michigan State University 14,460 6 39,766 2 18,858 6 37,056 4 The Ohio State University 11,084 7 32,061 10 12,425 8 36,009 5 Indiana University 10,948 8 36,512 5 10,873 11 33,304 6 University of Maryland 10,779 9 36,891 4 19,180 5 40,636 2
University of Wisconsin 10,725 10 37,785 3 12,179 9 25,506 12 Purdue University 9,992 11 28,797 12 9,992 12 28,797 11
University of Iowa 9,606 12 31,569 11 11,666 10 30,613 9 University of Nebraska 9,365 13 25,806 13 9,670 13 24,742 13
Average Excluding Iowa 13,167 35,266 16,418 33,915Midpoint Excluding Iowa 12,772 34,433 18,139 32,871Iowa Distance From the Midpoint -3,166 -2,865 -6,474 -2,259
2019-20 Academic Year Tuition & Required Fees at Public Big Ten UniversitiesUndergraduate Graduate
Sources: AAUDE Survey of Academic Year Tuition & Required Fees at AAU Public Universities, and the University of Virginia Survey of Academic Year Tuition & Required Fees. Notes: All of the public Big Ten Universities assess additional fees, beyond those shown above, for undergraduates enrolled in specific academic programs, such as engineering or business.
Information and Resource Management, Office of the Provost 72
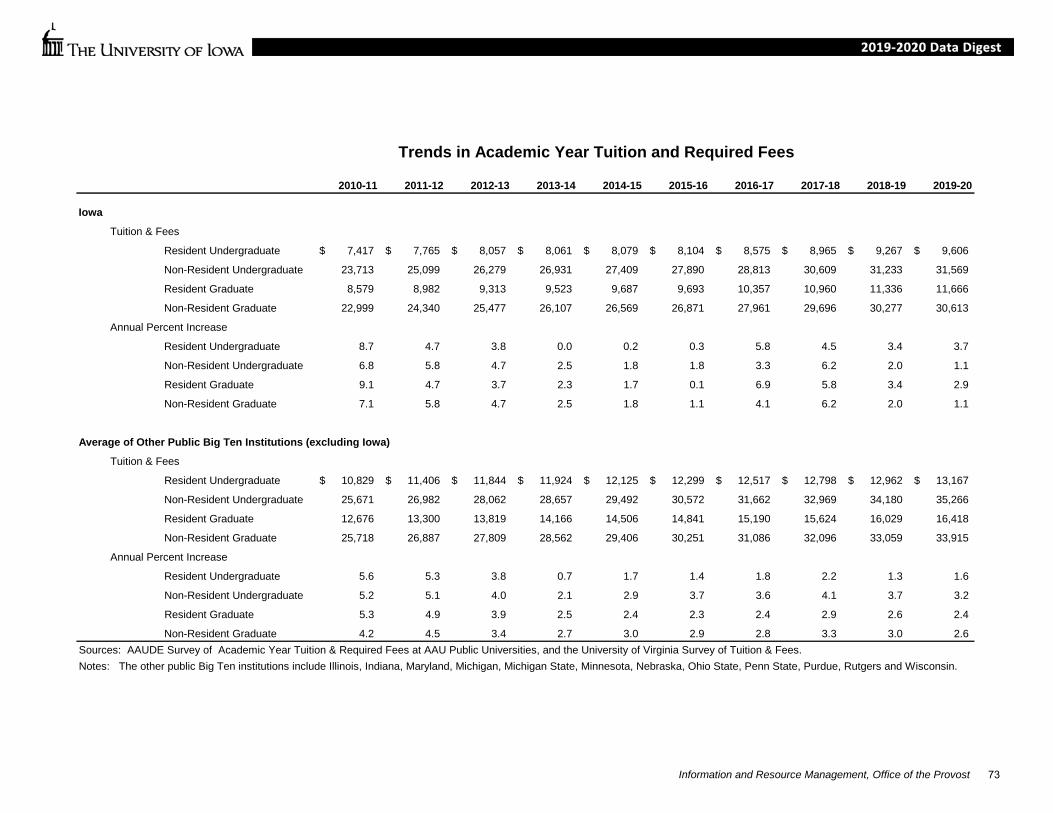
Trends in Academic Year Tuition and Required Fees
2010-11 2011-12 2012-13 2013-14 2014-15 2015-16 2016-17 2017-18 2018-19 2019-20
Iowa
Tuition & Fees
Resident Undergraduate 7,417$ 7,765$ 8,057$ 8,061$ 8,079$ 8,104$ 8,575$ 8,965$ 9,267$ 9,606$
Non-Resident Undergraduate 23,713 25,099 26,279 26,931 27,409 27,890 28,813 30,609 31,233 31,569
Resident Graduate 8,579 8,982 9,313 9,523 9,687 9,693 10,357 10,960 11,336 11,666
Non-Resident Graduate 22,999 24,340 25,477 26,107 26,569 26,871 27,961 29,696 30,277 30,613
Annual Percent Increase
Resident Undergraduate 8.7 4.7 3.8 0.0 0.2 0.3 5.8 4.5 3.4 3.7
Non-Resident Undergraduate 6.8 5.8 4.7 2.5 1.8 1.8 3.3 6.2 2.0 1.1
Resident Graduate 9.1 4.7 3.7 2.3 1.7 0.1 6.9 5.8 3.4 2.9
Non-Resident Graduate 7.1 5.8 4.7 2.5 1.8 1.1 4.1 6.2 2.0 1.1
Average of Other Public Big Ten Institutions (excluding Iowa)
Tuition & Fees
Resident Undergraduate 10,829$ 11,406$ 11,844$ 11,924$ 12,125$ 12,299$ 12,517$ 12,798$ 12,962$ 13,167$
Non-Resident Undergraduate 25,671 26,982 28,062 28,657 29,492 30,572 31,662 32,969 34,180 35,266
Resident Graduate 12,676 13,300 13,819 14,166 14,506 14,841 15,190 15,624 16,029 16,418
Non-Resident Graduate 25,718 26,887 27,809 28,562 29,406 30,251 31,086 32,096 33,059 33,915
Annual Percent Increase
Resident Undergraduate 5.6 5.3 3.8 0.7 1.7 1.4 1.8 2.2 1.3 1.6
Non-Resident Undergraduate 5.2 5.1 4.0 2.1 2.9 3.7 3.6 4.1 3.7 3.2
Resident Graduate 5.3 4.9 3.9 2.5 2.4 2.3 2.4 2.9 2.6 2.4
Non-Resident Graduate 4.2 4.5 3.4 2.7 3.0 2.9 2.8 3.3 3.0 2.6 Sources: AAUDE Survey of Academic Year Tuition & Required Fees at AAU Public Universities, and the University of Virginia Survey of Tuition & Fees.Notes: The other public Big Ten institutions include Illinois, Indiana, Maryland, Michigan, Michigan State, Minnesota, Nebraska, Ohio State, Penn State, Purdue, Rutgers and Wisconsin.
Information and Resource Management, Office of the Provost 73

Undergraduate Cost of Attendance per Academic Year
2010-11 2011-12 2012-13 2013-14 2014-15 2015-16 2016-17 2017-18 2018-19 2019-20Books and Living Costs
Books & Supplies 1,090 1,090 1,090 1,040 1,040 1,240 950 950 950 950Room & Board 8,331 8,750 9,170 9,424 9,614 9,728 10,108 10,450 11,172 11,400Misc. Personal & Travel 3,515 3,515 3,515 2,166 2,128 1,938 2,242 2,242 2,850 2,850Total 12,936 13,355 13,775 12,630 12,782 12,906 13,300 13,642 14,972 15,200
Resident Tuition & Fees 7,417 7,765 8,057 8,061 8,079 8,104 8,800 9,190 9,492 9,830
Resident Total Costs 20,353 21,120 21,832 20,691 20,861 21,010 22,100 22,832 24,464 25,030
Non-Resident Tuition & Fees 23,713 25,099 26,279 26,931 27,409 27,890 29,038 30,834 31,458 31,793
Non - Resident Total Costs 36,649 38,454 40,054 39,561 40,191 40,796 42,338 44,476 46,430 46,993
Source: Office of Student Financial Aid (https://financialaid.uiowa.edu/cost/undergraduate)
Books & Supplies
5.4%
Room & Board40.9%
Misc.17.3%
Tuition & Fees36.4%
Total Costs for Residents in 2010-11Books & Supplies
3.8%
Room & Board45.5%
Misc.11.4%
Tuition & Fees39.3%
Total Costs for Residents in 2019-20
Information and Resource Management, Office of the Provost 74
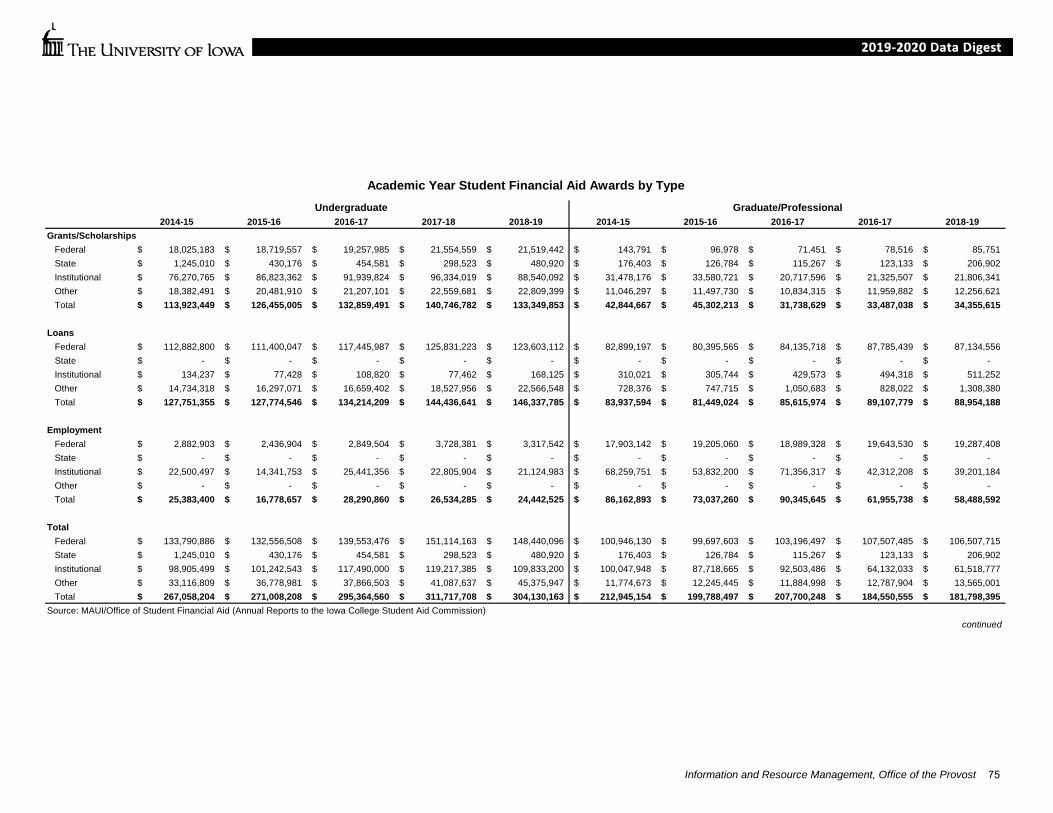
Academic Year Student Financial Aid Awards by Type
2014-15 2015-16 2016-17 2017-18 2018-19 2014-15 2015-16 2016-17 2016-17 2018-19Grants/Scholarships Federal 18,025,183$ 18,719,557$ 19,257,985$ 21,554,559$ 21,519,442$ 143,791$ 96,978$ 71,451$ 78,516$ 85,751$ State 1,245,010$ 430,176$ 454,581$ 298,523$ 480,920$ 176,403$ 126,784$ 115,267$ 123,133$ 206,902$ Institutional 76,270,765$ 86,823,362$ 91,939,824$ 96,334,019$ 88,540,092$ 31,478,176$ 33,580,721$ 20,717,596$ 21,325,507$ 21,806,341$ Other 18,382,491$ 20,481,910$ 21,207,101$ 22,559,681$ 22,809,399$ 11,046,297$ 11,497,730$ 10,834,315$ 11,959,882$ 12,256,621$ Total 113,923,449$ 126,455,005$ 132,859,491$ 140,746,782$ 133,349,853$ 42,844,667$ 45,302,213$ 31,738,629$ 33,487,038$ 34,355,615$
Loans Federal 112,882,800$ 111,400,047$ 117,445,987$ 125,831,223$ 123,603,112$ 82,899,197$ 80,395,565$ 84,135,718$ 87,785,439$ 87,134,556$ State -$ -$ -$ -$ -$ -$ -$ -$ -$ -$ Institutional 134,237$ 77,428$ 108,820$ 77,462$ 168,125$ 310,021$ 305,744$ 429,573$ 494,318$ 511,252$ Other 14,734,318$ 16,297,071$ 16,659,402$ 18,527,956$ 22,566,548$ 728,376$ 747,715$ 1,050,683$ 828,022$ 1,308,380$ Total 127,751,355$ 127,774,546$ 134,214,209$ 144,436,641$ 146,337,785$ 83,937,594$ 81,449,024$ 85,615,974$ 89,107,779$ 88,954,188$
Employment Federal 2,882,903$ 2,436,904$ 2,849,504$ 3,728,381$ 3,317,542$ 17,903,142$ 19,205,060$ 18,989,328$ 19,643,530$ 19,287,408$ State -$ -$ -$ -$ -$ -$ -$ -$ -$ -$ Institutional 22,500,497$ 14,341,753$ 25,441,356$ 22,805,904$ 21,124,983$ 68,259,751$ 53,832,200$ 71,356,317$ 42,312,208$ 39,201,184$ Other -$ -$ -$ -$ -$ -$ -$ -$ -$ -$ Total 25,383,400$ 16,778,657$ 28,290,860$ 26,534,285$ 24,442,525$ 86,162,893$ 73,037,260$ 90,345,645$ 61,955,738$ 58,488,592$
Total Federal 133,790,886$ 132,556,508$ 139,553,476$ 151,114,163$ 148,440,096$ 100,946,130$ 99,697,603$ 103,196,497$ 107,507,485$ 106,507,715$ State 1,245,010$ 430,176$ 454,581$ 298,523$ 480,920$ 176,403$ 126,784$ 115,267$ 123,133$ 206,902$ Institutional 98,905,499$ 101,242,543$ 117,490,000$ 119,217,385$ 109,833,200$ 100,047,948$ 87,718,665$ 92,503,486$ 64,132,033$ 61,518,777$ Other 33,116,809$ 36,778,981$ 37,866,503$ 41,087,637$ 45,375,947$ 11,774,673$ 12,245,445$ 11,884,998$ 12,787,904$ 13,565,001$ Total 267,058,204$ 271,008,208$ 295,364,560$ 311,717,708$ 304,130,163$ 212,945,154$ 199,788,497$ 207,700,248$ 184,550,555$ 181,798,395$ Source: MAUI/Office of Student Financial Aid (Annual Reports to the Iowa College Student Aid Commission)
continued
Undergraduate Graduate/Professional
Information and Resource Management, Office of the Provost 75
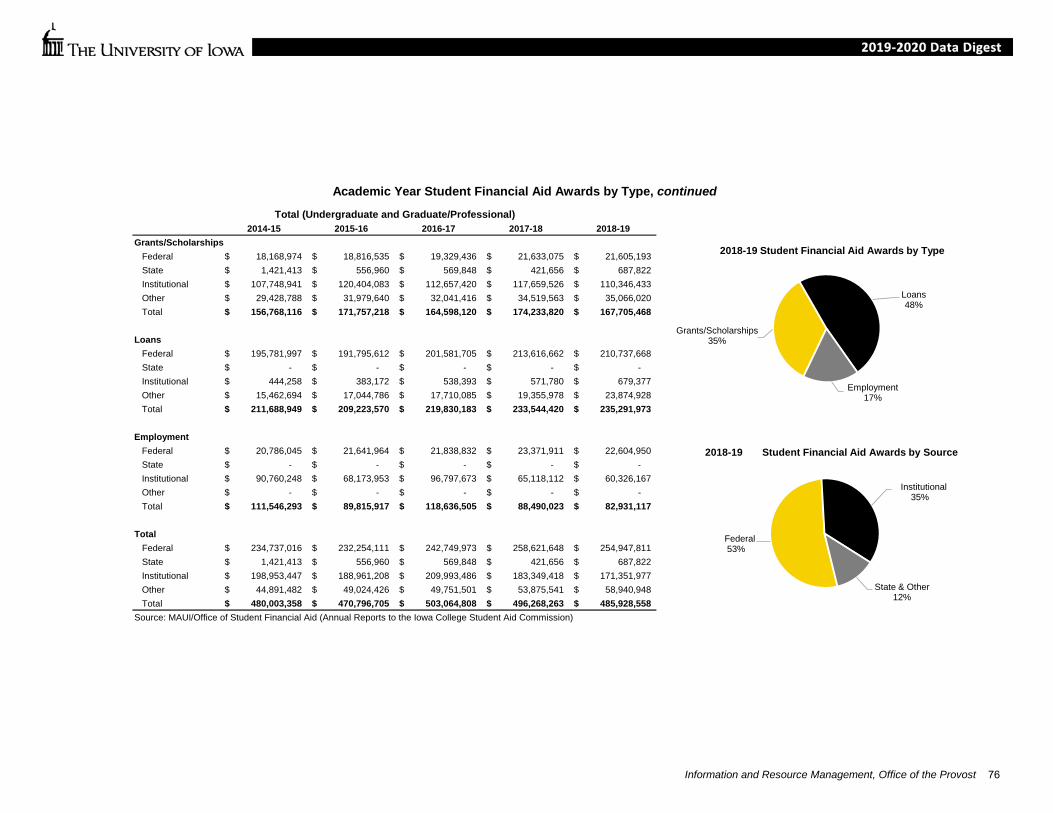
Academic Year Student Financial Aid Awards by Type, continued
Total (Undergraduate and Graduate/Professional)2014-15 2015-16 2016-17 2017-18 2018-19
Grants/Scholarships Federal 18,168,974$ 18,816,535$ 19,329,436$ 21,633,075$ 21,605,193$ State 1,421,413$ 556,960$ 569,848$ 421,656$ 687,822$ Institutional 107,748,941$ 120,404,083$ 112,657,420$ 117,659,526$ 110,346,433$ Other 29,428,788$ 31,979,640$ 32,041,416$ 34,519,563$ 35,066,020$ Total 156,768,116$ 171,757,218$ 164,598,120$ 174,233,820$ 167,705,468$
Loans Federal 195,781,997$ 191,795,612$ 201,581,705$ 213,616,662$ 210,737,668$ State -$ -$ -$ -$ -$ Institutional 444,258$ 383,172$ 538,393$ 571,780$ 679,377$ Other 15,462,694$ 17,044,786$ 17,710,085$ 19,355,978$ 23,874,928$ Total 211,688,949$ 209,223,570$ 219,830,183$ 233,544,420$ 235,291,973$
Employment Federal 20,786,045$ 21,641,964$ 21,838,832$ 23,371,911$ 22,604,950$ State -$ -$ -$ -$ -$ Institutional 90,760,248$ 68,173,953$ 96,797,673$ 65,118,112$ 60,326,167$ Other -$ -$ -$ -$ -$ Total 111,546,293$ 89,815,917$ 118,636,505$ 88,490,023$ 82,931,117$
Total Federal 234,737,016$ 232,254,111$ 242,749,973$ 258,621,648$ 254,947,811$ State 1,421,413$ 556,960$ 569,848$ 421,656$ 687,822$ Institutional 198,953,447$ 188,961,208$ 209,993,486$ 183,349,418$ 171,351,977$ Other 44,891,482$ 49,024,426$ 49,751,501$ 53,875,541$ 58,940,948$ Total 480,003,358$ 470,796,705$ 503,064,808$ 496,268,263$ 485,928,558$ Source: MAUI/Office of Student Financial Aid (Annual Reports to the Iowa College Student Aid Commission)
Grants/Scholarships35%
Loans48%
Employment17%
2018-19 Student Financial Aid Awards by Type
Federal53%
Institutional35%
State & Other12%
2018-19 Student Financial Aid Awards by Source
Information and Resource Management, Office of the Provost 76
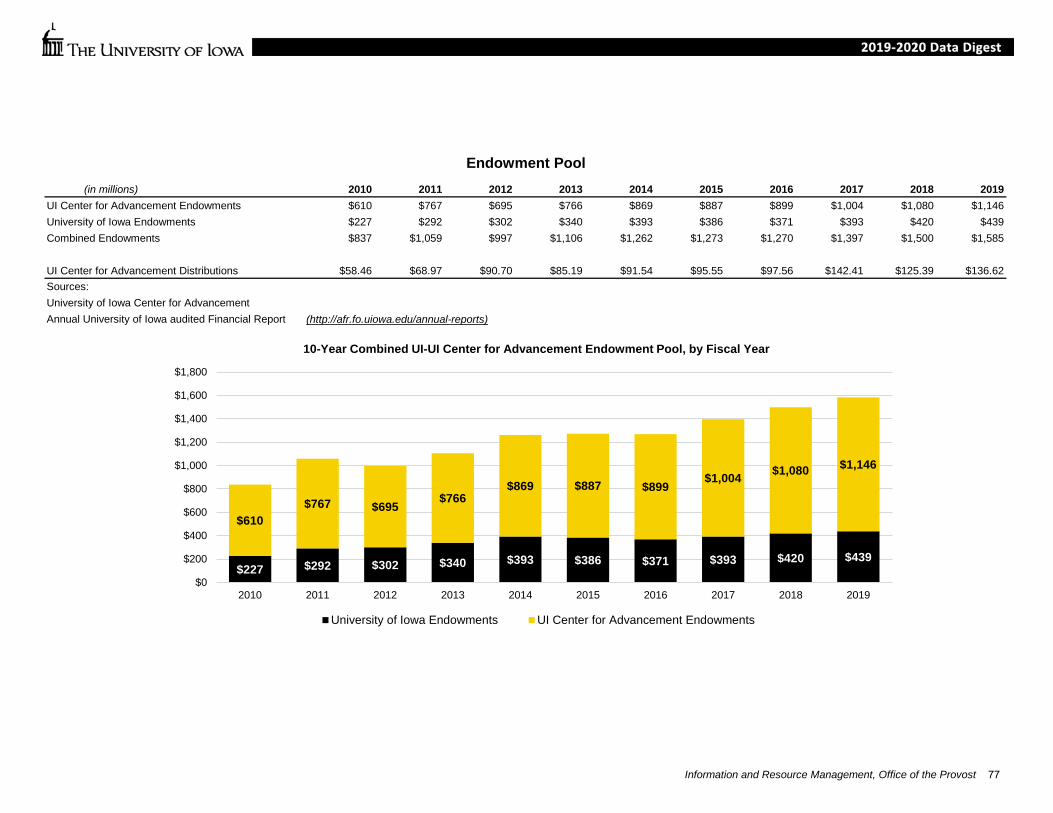
Endowment Pool(in millions) 2010 2011 2012 2013 2014 2015 2016 2017 2018 2019
UI Center for Advancement Endowments $610 $767 $695 $766 $869 $887 $899 $1,004 $1,080 $1,146University of Iowa Endowments $227 $292 $302 $340 $393 $386 $371 $393 $420 $439Combined Endowments $837 $1,059 $997 $1,106 $1,262 $1,273 $1,270 $1,397 $1,500 $1,585
UI Center for Advancement Distributions $58.46 $68.97 $90.70 $85.19 $91.54 $95.55 $97.56 $142.41 $125.39 $136.62Sources: University of Iowa Center for Advancement Annual University of Iowa audited Financial Report (http://afr.fo.uiowa.edu/annual-reports)
$227 $292 $302 $340 $393 $386 $371 $393 $420 $439
$610$767 $695
$766$869 $887 $899
$1,004 $1,080 $1,146
$0
$200
$400
$600
$800
$1,000
$1,200
$1,400
$1,600
$1,800
2010 2011 2012 2013 2014 2015 2016 2017 2018 2019
10-Year Combined UI-UI Center for Advancement Endowment Pool, by Fiscal Year
University of Iowa Endowments UI Center for Advancement Endowments
Information and Resource Management, Office of the Provost 77
Colleges
Fall Semester Headcount Enrollment by College and by Student Level ................ 79 Degree Program Completions by College ............................................................. 81 Alumni by College ................................................................................................. 82 Fiscal Year Student Credit Hours by College of Student’s Primary Program of Study and by Student Level ............................................................ 83 Fiscal Year Student Credit Hours by Administrative Home College and by Student Level ......................................................................................... 85 November 1 Faculty FTE by Faculty Category and by Organization ..................... 87 Headcount of Faculty by Faculty Category and by College ................................... 90 Extramural Awards by College .............................................................................. 92 Federal Research Awards by College ................................................................... 93 Non-Federal Research Awards by College ............................................................ 94 Fiscal Year Gross Expenditures by Organization, All Funds .................................. 95 Fiscal Year Gross Expenditures by Organization, General Education Funds ................................................................................................................ 96
78
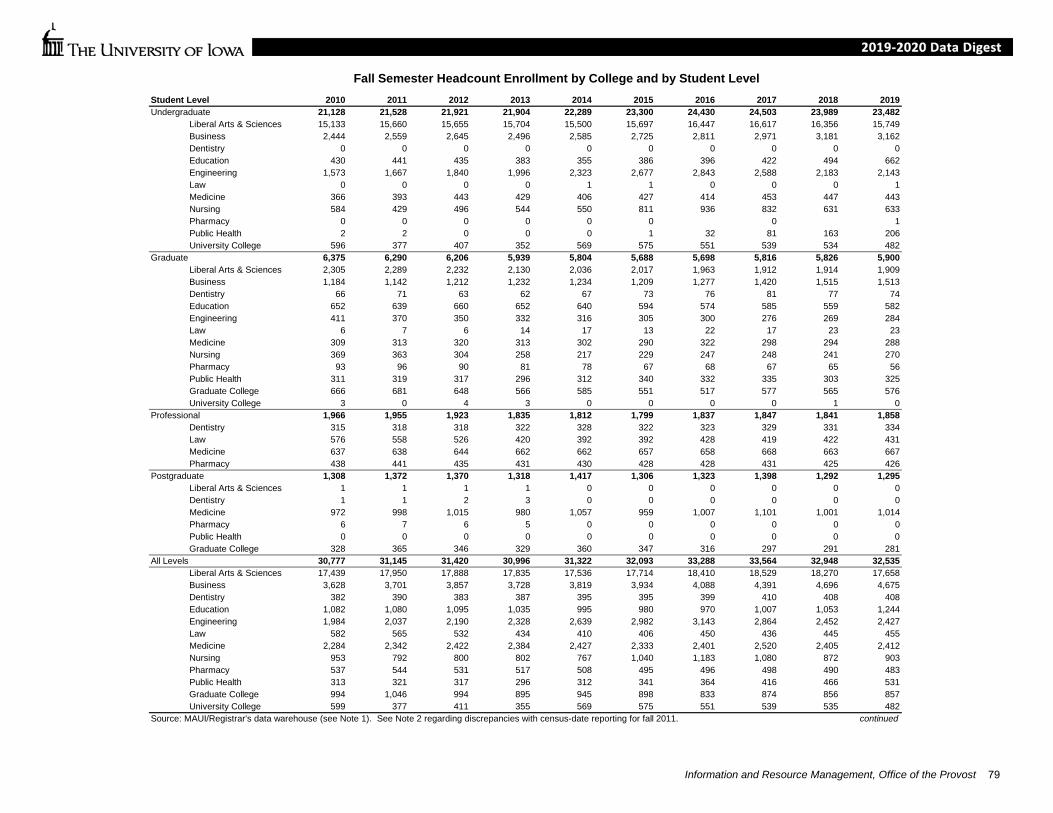
Fall Semester Headcount Enrollment by College and by Student LevelStudent Level 2010 2011 2012 2013 2014 2015 2016 2017 2018 2019Undergraduate 21,128 21,528 21,921 21,904 22,289 23,300 24,430 24,503 23,989 23,482
Liberal Arts & Sciences 15,133 15,660 15,655 15,704 15,500 15,697 16,447 16,617 16,356 15,749Business 2,444 2,559 2,645 2,496 2,585 2,725 2,811 2,971 3,181 3,162Dentistry 0 0 0 0 0 0 0 0 0 0Education 430 441 435 383 355 386 396 422 494 662Engineering 1,573 1,667 1,840 1,996 2,323 2,677 2,843 2,588 2,183 2,143Law 0 0 0 0 1 1 0 0 0 1Medicine 366 393 443 429 406 427 414 453 447 443Nursing 584 429 496 544 550 811 936 832 631 633Pharmacy 0 0 0 0 0 0 0 1Public Health 2 2 0 0 0 1 32 81 163 206University College 596 377 407 352 569 575 551 539 534 482
Graduate 6,375 6,290 6,206 5,939 5,804 5,688 5,698 5,816 5,826 5,900Liberal Arts & Sciences 2,305 2,289 2,232 2,130 2,036 2,017 1,963 1,912 1,914 1,909Business 1,184 1,142 1,212 1,232 1,234 1,209 1,277 1,420 1,515 1,513Dentistry 66 71 63 62 67 73 76 81 77 74Education 652 639 660 652 640 594 574 585 559 582Engineering 411 370 350 332 316 305 300 276 269 284Law 6 7 6 14 17 13 22 17 23 23Medicine 309 313 320 313 302 290 322 298 294 288Nursing 369 363 304 258 217 229 247 248 241 270Pharmacy 93 96 90 81 78 67 68 67 65 56Public Health 311 319 317 296 312 340 332 335 303 325Graduate College 666 681 648 566 585 551 517 577 565 576University College 3 0 4 3 0 0 0 0 1 0
Professional 1,966 1,955 1,923 1,835 1,812 1,799 1,837 1,847 1,841 1,858Dentistry 315 318 318 322 328 322 323 329 331 334Law 576 558 526 420 392 392 428 419 422 431Medicine 637 638 644 662 662 657 658 668 663 667Pharmacy 438 441 435 431 430 428 428 431 425 426
Postgraduate 1,308 1,372 1,370 1,318 1,417 1,306 1,323 1,398 1,292 1,295Liberal Arts & Sciences 1 1 1 1 0 0 0 0 0 0Dentistry 1 1 2 3 0 0 0 0 0 0Medicine 972 998 1,015 980 1,057 959 1,007 1,101 1,001 1,014Pharmacy 6 7 6 5 0 0 0 0 0 0Public Health 0 0 0 0 0 0 0 0 0 0Graduate College 328 365 346 329 360 347 316 297 291 281
All Levels 30,777 31,145 31,420 30,996 31,322 32,093 33,288 33,564 32,948 32,535Liberal Arts & Sciences 17,439 17,950 17,888 17,835 17,536 17,714 18,410 18,529 18,270 17,658Business 3,628 3,701 3,857 3,728 3,819 3,934 4,088 4,391 4,696 4,675Dentistry 382 390 383 387 395 395 399 410 408 408Education 1,082 1,080 1,095 1,035 995 980 970 1,007 1,053 1,244Engineering 1,984 2,037 2,190 2,328 2,639 2,982 3,143 2,864 2,452 2,427Law 582 565 532 434 410 406 450 436 445 455Medicine 2,284 2,342 2,422 2,384 2,427 2,333 2,401 2,520 2,405 2,412Nursing 953 792 800 802 767 1,040 1,183 1,080 872 903Pharmacy 537 544 531 517 508 495 496 498 490 483Public Health 313 321 317 296 312 341 364 416 466 531Graduate College 994 1,046 994 895 945 898 833 874 856 857University College 599 377 411 355 569 575 551 539 535 482
Source: MAUI/Registrar's data warehouse (see Note 1). See Note 2 regarding discrepancies with census-date reporting for fall 2011. continued
Information and Resource Management, Office of the Provost 79
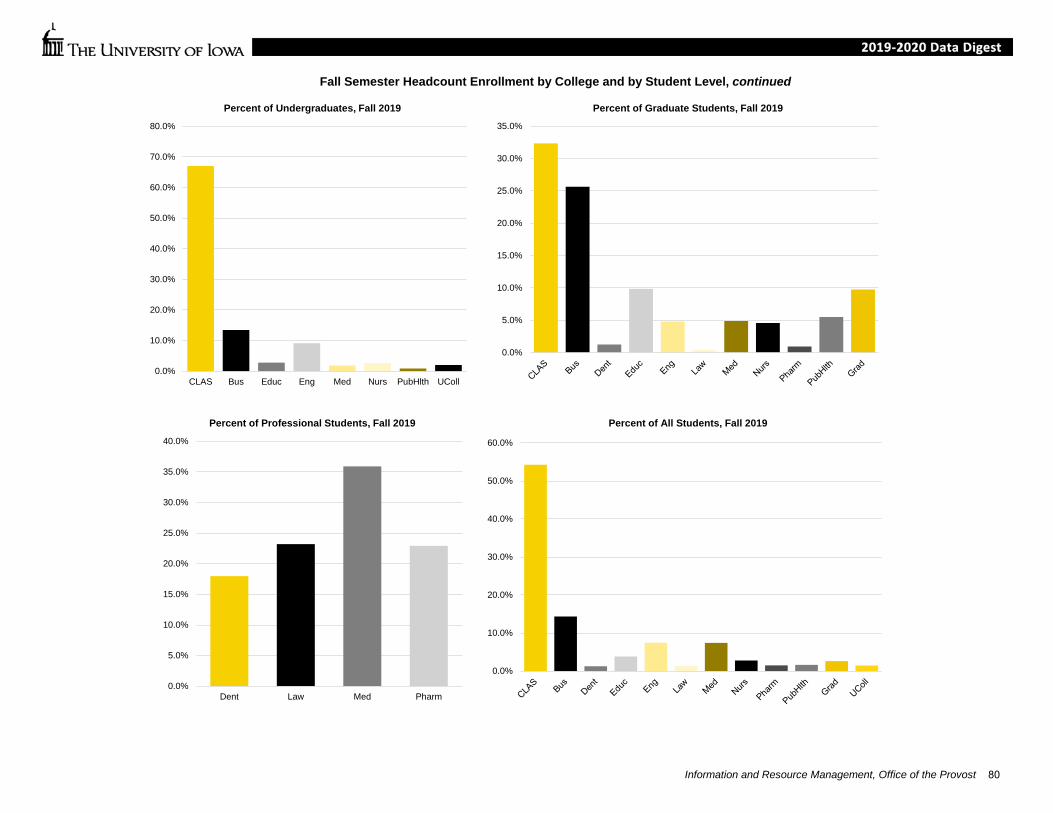
Fall Semester Headcount Enrollment by College and by Student Level, continued
0.0%
10.0%
20.0%
30.0%
40.0%
50.0%
60.0%
70.0%
80.0%
CLAS Bus Educ Eng Med Nurs PubHlth UColl
Percent of Undergraduates, Fall 2019
0.0%
5.0%
10.0%
15.0%
20.0%
25.0%
30.0%
35.0%
Percent of Graduate Students, Fall 2019
0.0%
5.0%
10.0%
15.0%
20.0%
25.0%
30.0%
35.0%
40.0%
Dent Law Med Pharm
Percent of Professional Students, Fall 2019
0.0%
10.0%
20.0%
30.0%
40.0%
50.0%
60.0%
Percent of All Students, Fall 2019
Information and Resource Management, Office of the Provost 80
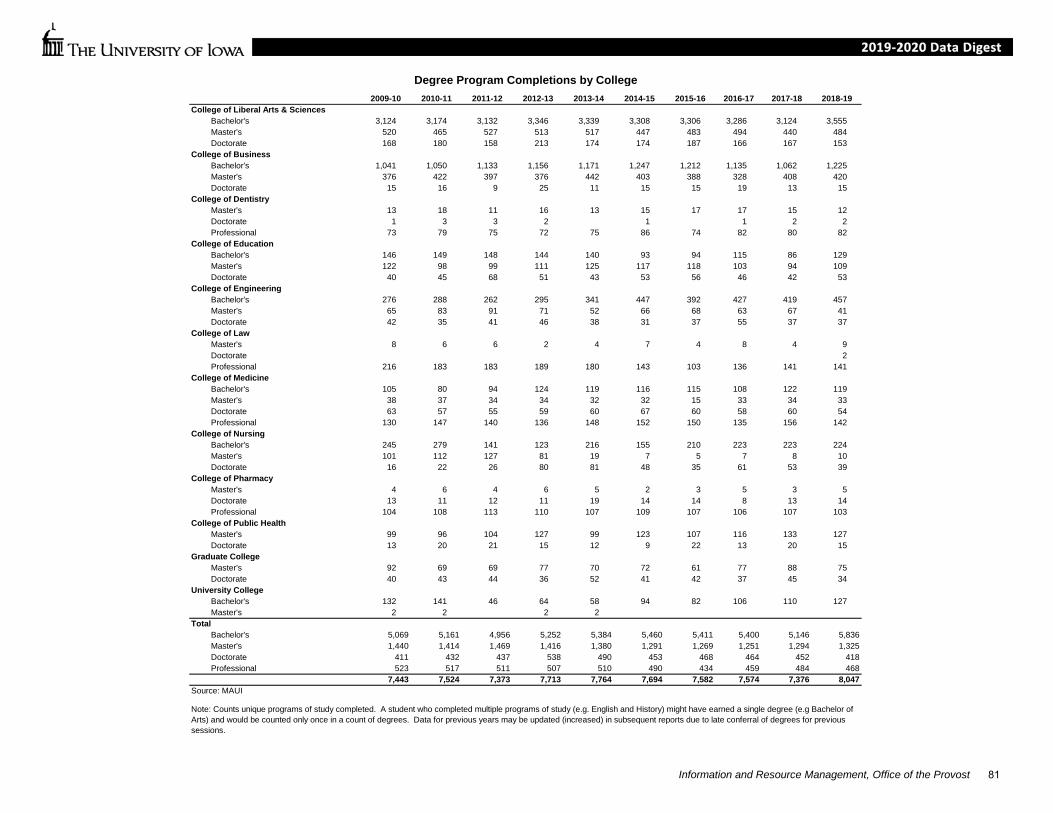
Degree Program Completions by College 2009-10 2010-11 2011-12 2012-13 2013-14 2014-15 2015-16 2016-17 2017-18 2018-19
College of Liberal Arts & SciencesBachelor's 3,124 3,174 3,132 3,346 3,339 3,308 3,306 3,286 3,124 3,555Master's 520 465 527 513 517 447 483 494 440 484Doctorate 168 180 158 213 174 174 187 166 167 153
College of BusinessBachelor's 1,041 1,050 1,133 1,156 1,171 1,247 1,212 1,135 1,062 1,225Master's 376 422 397 376 442 403 388 328 408 420Doctorate 15 16 9 25 11 15 15 19 13 15
College of DentistryMaster's 13 18 11 16 13 15 17 17 15 12Doctorate 1 3 3 2 1 1 2 2Professional 73 79 75 72 75 86 74 82 80 82
College of EducationBachelor's 146 149 148 144 140 93 94 115 86 129Master's 122 98 99 111 125 117 118 103 94 109Doctorate 40 45 68 51 43 53 56 46 42 53
College of EngineeringBachelor's 276 288 262 295 341 447 392 427 419 457Master's 65 83 91 71 52 66 68 63 67 41Doctorate 42 35 41 46 38 31 37 55 37 37
College of LawMaster's 8 6 6 2 4 7 4 8 4 9Doctorate 2Professional 216 183 183 189 180 143 103 136 141 141
College of MedicineBachelor's 105 80 94 124 119 116 115 108 122 119Master's 38 37 34 34 32 32 15 33 34 33Doctorate 63 57 55 59 60 67 60 58 60 54Professional 130 147 140 136 148 152 150 135 156 142
College of NursingBachelor's 245 279 141 123 216 155 210 223 223 224Master's 101 112 127 81 19 7 5 7 8 10Doctorate 16 22 26 80 81 48 35 61 53 39
College of PharmacyMaster's 4 6 4 6 5 2 3 5 3 5Doctorate 13 11 12 11 19 14 14 8 13 14Professional 104 108 113 110 107 109 107 106 107 103
College of Public HealthMaster's 99 96 104 127 99 123 107 116 133 127Doctorate 13 20 21 15 12 9 22 13 20 15
Graduate CollegeMaster's 92 69 69 77 70 72 61 77 88 75Doctorate 40 43 44 36 52 41 42 37 45 34
University CollegeBachelor's 132 141 46 64 58 94 82 106 110 127Master's 2 2 2 2
TotalBachelor's 5,069 5,161 4,956 5,252 5,384 5,460 5,411 5,400 5,146 5,836Master's 1,440 1,414 1,469 1,416 1,380 1,291 1,269 1,251 1,294 1,325Doctorate 411 432 437 538 490 453 468 464 452 418Professional 523 517 511 507 510 490 434 459 484 468
7,443 7,524 7,373 7,713 7,764 7,694 7,582 7,574 7,376 8,047Source: MAUI
Note: Counts unique programs of study completed. A student who completed multiple programs of study (e.g. English and History) might have earned a single degree (e.g Bachelor of Arts) and would be counted only once in a count of degrees. Data for previous years may be updated (increased) in subsequent reports due to late conferral of degrees for previous sessions.
Information and Resource Management, Office of the Provost 81

Alumni by College
College TotalUndergraduate
DegreeGraduateDegree
MultipleDegrees
Alumniin U.S.
Alumni Not in U.S., or Unknown
Primary Address
Liberal Arts & Sciences 165,154 134,796 48,975 71,625 160,483 4,671Business 52,721 42,627 14,817 18,790 50,450 2,271Dentistry 5,001 1,298 4,990 2,182 4,878 123Education 27,849 19,689 12,340 17,267 27,107 742Engineering 15,914 12,224 5,787 5,595 14,773 1,141Law 10,614 3,233 10,614 3,783 10,401 213Medicine 24,027 8,384 19,898 9,276 23,331 696Nursing 12,532 11,152 2,586 2,095 12,461 71Pharmacy 5,610 2,805 3,326 844 5,427 183Public Health 3,353 908 3,343 1,733 3,220 133Graduate College 72,784 17,157 72,736 28,914 67,899 4,885Source: UI Living Alumni Statistical Report, February 10, 2020Note: Not unique counts; alumni are counted in each relevant college and in each relevant degree category.
Information and Resource Management, Office of the Provost 82

Student Level 2010-11 2011-12 2012-13 2013-14 2014-15 2015-16 2016-17 2017-18 2018-19 2019-20Undergraduate 588,386 600,686 608,359 609,998 615,058 638,941 669,474 681,854 686,583 662,628
Liberal Arts & Sciences 415,246 430,144 428,939 429,762 425,673 439,667 460,062 466,710 462,116 440,045Business 75,651 79,292 80,818 78,217 79,896 84,067 87,611 92,577 99,132 95,360Dentistry 0 0 0 0 0 0 0 0 0 0Education 13,628 13,753 13,388 11,664 11,045 12,047 12,579 13,902 15,367 19,849Engineering 47,527 50,763 55,774 60,554 64,853 66,542 70,345 68,290 67,034 63,722Law 0 0 0 0 9 3 0 0 3 9Medicine 8,821 9,613 10,491 10,423 10,524 11,445 11,629 12,494 12,538 12,333Nursing 13,833 10,758 12,755 13,450 14,372 15,831 16,609 16,135 16,608 16,589Pharmacy 0 0 0 0 0 0 0 0 0 4Public Health 9 27 3 0 3 9 946 2,356 4,840 6,424Graduate College 0 0 0 0 0 0 0 0 0 0University College 13,671 6,336 6,191 5,928 8,683 9,330 9,693 9,390 8,945 8,293
Graduate 111,733 109,457 107,176 103,736 101,044 96,202 97,608 98,691 100,500 102,497Liberal Arts & Sciences 37,615 37,668 36,595 35,646 34,483 33,792 32,855 32,494 33,398 33,414Business 21,936 20,812 21,164 21,555 21,721 19,792 20,306 21,322 22,530 22,409Dentistry 971 827 812 729 810 938 859 1,037 916 1,424Education 10,799 11,083 11,764 11,266 10,996 10,269 10,050 9,901 9,799 10,062Engineering 6,721 5,947 5,572 5,277 4,851 4,482 4,384 4,242 4,623 4,666Law 202 243 174 340 529 294 402 235 373 432Medicine 8,842 8,889 8,809 8,837 8,325 7,886 8,891 8,470 8,480 8,570Nursing 7,375 6,920 5,671 4,771 3,937 3,939 4,502 4,646 4,764 5,068Pharmacy 1,459 1,492 1,267 1,196 1,222 1,059 1,032 988 977 1,007Public Health 5,650 5,933 6,109 5,661 5,846 6,183 6,314 6,420 5,888 6,328Graduate College 10,050 9,603 9,124 8,391 8,300 7,568 8,013 8,936 8,740 9,105University College 113 40 115 67 24 0 0 0 12 12
Professional 75,553 74,877 74,115 72,880 73,009 72,607 75,637 75,378 75,320 76,108Dentistry 17,455 17,178 17,505 17,756 18,216 17,602 18,316 18,576 18,947 18,967Law 16,422 15,887 14,947 11,747 11,139 11,334 11,993 11,881 12,007 12,143Medicine 25,460 25,157 25,426 27,018 27,294 27,219 28,408 28,288 27,884 28,149Pharmacy 16,216 16,655 16,237 16,359 16,360 16,452 16,920 16,633 16,482 16,849
Postgraduate 0 7 1 0 0 0 0 0 0 0Medicine 0 7 1 0 0 0 0 0 0 0
All Levels 775,672 785,027 789,651 786,614 789,111 807,750 842,719 855,923 862,403 841,233Liberal Arts & Sciences 452,861 467,812 465,534 465,408 460,156 473,459 492,917 499,204 495,514 473,459Business 97,587 100,104 101,982 99,772 101,617 103,859 107,917 113,899 121,662 117,769Dentistry 18,426 18,005 18,317 18,485 19,026 18,540 19,175 19,613 19,863 20,391Education 24,427 24,836 25,152 22,930 22,041 22,316 22,629 23,803 25,166 29,911Engineering 54,248 56,710 61,346 65,831 69,704 71,024 74,729 72,532 71,657 68,388Law 16,624 16,130 15,121 12,087 11,677 11,631 12,395 12,116 12,383 12,584Medicine 43,123 43,666 44,727 46,278 46,143 46,550 48,928 49,252 48,902 49,052Nursing 21,208 17,678 18,426 18,221 18,309 19,770 21,111 20,781 21,372 21,657Pharmacy 17,675 18,147 17,504 17,555 17,582 17,511 17,952 17,621 17,459 17,860Public Health 5,659 5,960 6,112 5,661 5,849 6,192 7,260 8,776 10,728 12,752Graduate College 10,050 9,603 9,124 8,391 8,300 7,568 8,013 8,936 8,740 9,105University College 13,784 6,376 6,306 5,995 8,707 9,330 9,693 9,390 8,957 8,305
Source: MAUI/Registrar's data warehouse (see Note 1). continued
Fiscal Year Student Credit Hours by College of Student's Primary Program of Study and by Student Level
Information and Resource Management, Office of the Provost 83
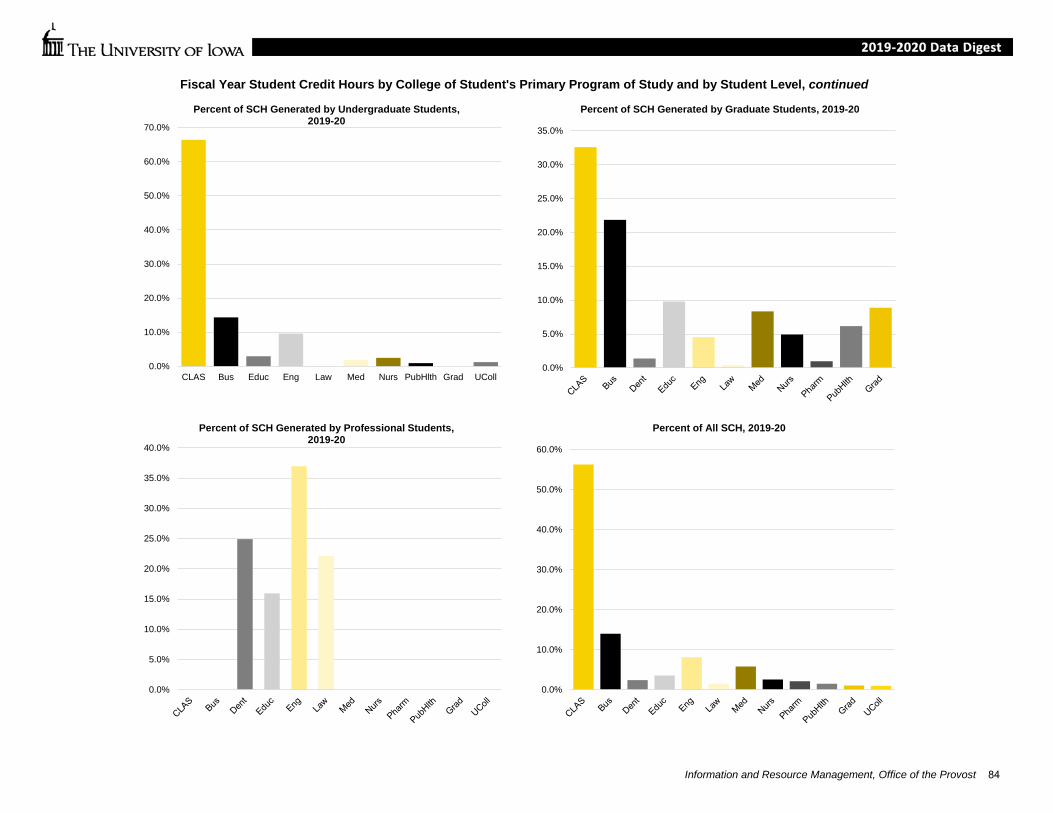
Fiscal Year Student Credit Hours by College of Student's Primary Program of Study and by Student Level, continued
0.0%
10.0%
20.0%
30.0%
40.0%
50.0%
60.0%
70.0%
CLAS Bus Educ Eng Law Med Nurs PubHlth Grad UColl
Percent of SCH Generated by Undergraduate Students, 2019-20
0.0%
5.0%
10.0%
15.0%
20.0%
25.0%
30.0%
35.0%
Percent of SCH Generated by Graduate Students, 2019-20
0.0%
5.0%
10.0%
15.0%
20.0%
25.0%
30.0%
35.0%
40.0%
Percent of SCH Generated by Professional Students, 2019-20
0.0%
10.0%
20.0%
30.0%
40.0%
50.0%
60.0%
Percent of All SCH, 2019-20
Information and Resource Management, Office of the Provost 84
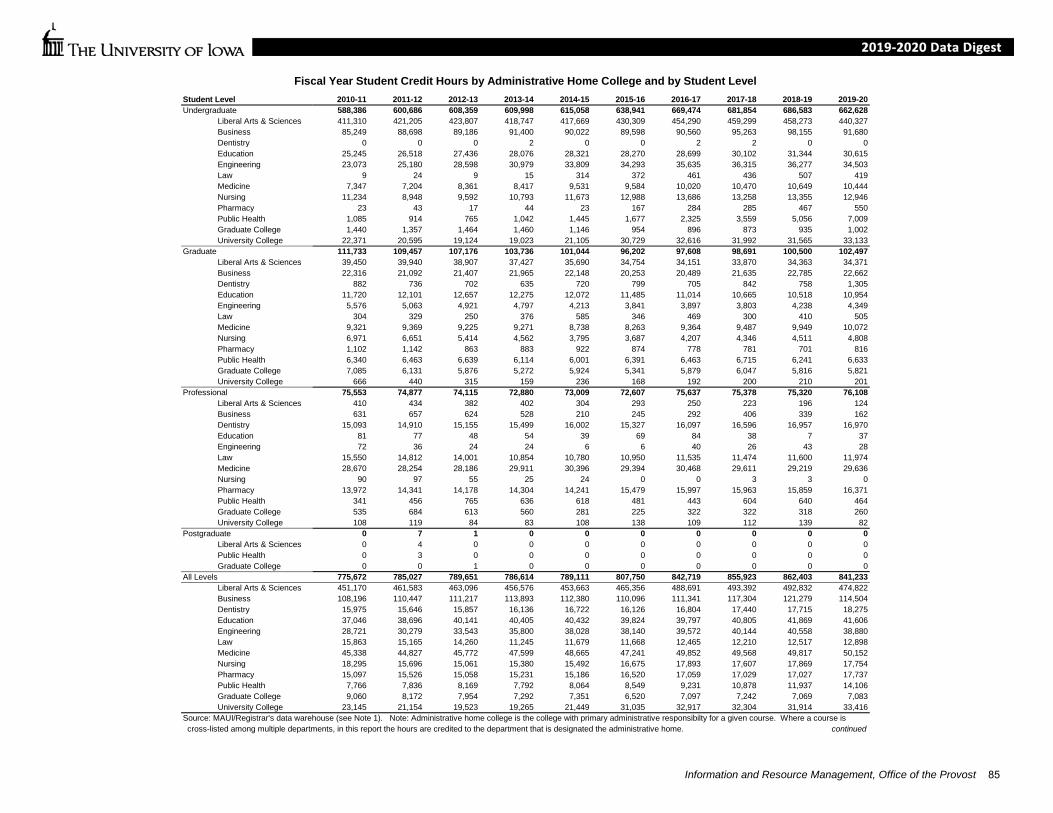
Student Level 2010-11 2011-12 2012-13 2013-14 2014-15 2015-16 2016-17 2017-18 2018-19 2019-20Undergraduate 588,386 600,686 608,359 609,998 615,058 638,941 669,474 681,854 686,583 662,628
Liberal Arts & Sciences 411,310 421,205 423,807 418,747 417,669 430,309 454,290 459,299 458,273 440,327Business 85,249 88,698 89,186 91,400 90,022 89,598 90,560 95,263 98,155 91,680Dentistry 0 0 0 2 0 0 2 2 0 0Education 25,245 26,518 27,436 28,076 28,321 28,270 28,699 30,102 31,344 30,615Engineering 23,073 25,180 28,598 30,979 33,809 34,293 35,635 36,315 36,277 34,503Law 9 24 9 15 314 372 461 436 507 419Medicine 7,347 7,204 8,361 8,417 9,531 9,584 10,020 10,470 10,649 10,444Nursing 11,234 8,948 9,592 10,793 11,673 12,988 13,686 13,258 13,355 12,946Pharmacy 23 43 17 44 23 167 284 285 467 550Public Health 1,085 914 765 1,042 1,445 1,677 2,325 3,559 5,056 7,009Graduate College 1,440 1,357 1,464 1,460 1,146 954 896 873 935 1,002University College 22,371 20,595 19,124 19,023 21,105 30,729 32,616 31,992 31,565 33,133
Graduate 111,733 109,457 107,176 103,736 101,044 96,202 97,608 98,691 100,500 102,497Liberal Arts & Sciences 39,450 39,940 38,907 37,427 35,690 34,754 34,151 33,870 34,363 34,371Business 22,316 21,092 21,407 21,965 22,148 20,253 20,489 21,635 22,785 22,662Dentistry 882 736 702 635 720 799 705 842 758 1,305Education 11,720 12,101 12,657 12,275 12,072 11,485 11,014 10,665 10,518 10,954Engineering 5,576 5,063 4,921 4,797 4,213 3,841 3,897 3,803 4,238 4,349Law 304 329 250 376 585 346 469 300 410 505Medicine 9,321 9,369 9,225 9,271 8,738 8,263 9,364 9,487 9,949 10,072Nursing 6,971 6,651 5,414 4,562 3,795 3,687 4,207 4,346 4,511 4,808Pharmacy 1,102 1,142 863 883 922 874 778 781 701 816Public Health 6,340 6,463 6,639 6,114 6,001 6,391 6,463 6,715 6,241 6,633Graduate College 7,085 6,131 5,876 5,272 5,924 5,341 5,879 6,047 5,816 5,821University College 666 440 315 159 236 168 192 200 210 201
Professional 75,553 74,877 74,115 72,880 73,009 72,607 75,637 75,378 75,320 76,108Liberal Arts & Sciences 410 434 382 402 304 293 250 223 196 124Business 631 657 624 528 210 245 292 406 339 162Dentistry 15,093 14,910 15,155 15,499 16,002 15,327 16,097 16,596 16,957 16,970Education 81 77 48 54 39 69 84 38 7 37Engineering 72 36 24 24 6 6 40 26 43 28Law 15,550 14,812 14,001 10,854 10,780 10,950 11,535 11,474 11,600 11,974Medicine 28,670 28,254 28,186 29,911 30,396 29,394 30,468 29,611 29,219 29,636Nursing 90 97 55 25 24 0 0 3 3 0Pharmacy 13,972 14,341 14,178 14,304 14,241 15,479 15,997 15,963 15,859 16,371Public Health 341 456 765 636 618 481 443 604 640 464Graduate College 535 684 613 560 281 225 322 322 318 260University College 108 119 84 83 108 138 109 112 139 82
Postgraduate 0 7 1 0 0 0 0 0 0 0Liberal Arts & Sciences 0 4 0 0 0 0 0 0 0 0Public Health 0 3 0 0 0 0 0 0 0 0Graduate College 0 0 1 0 0 0 0 0 0 0
All Levels 775,672 785,027 789,651 786,614 789,111 807,750 842,719 855,923 862,403 841,233Liberal Arts & Sciences 451,170 461,583 463,096 456,576 453,663 465,356 488,691 493,392 492,832 474,822Business 108,196 110,447 111,217 113,893 112,380 110,096 111,341 117,304 121,279 114,504Dentistry 15,975 15,646 15,857 16,136 16,722 16,126 16,804 17,440 17,715 18,275Education 37,046 38,696 40,141 40,405 40,432 39,824 39,797 40,805 41,869 41,606Engineering 28,721 30,279 33,543 35,800 38,028 38,140 39,572 40,144 40,558 38,880Law 15,863 15,165 14,260 11,245 11,679 11,668 12,465 12,210 12,517 12,898Medicine 45,338 44,827 45,772 47,599 48,665 47,241 49,852 49,568 49,817 50,152Nursing 18,295 15,696 15,061 15,380 15,492 16,675 17,893 17,607 17,869 17,754Pharmacy 15,097 15,526 15,058 15,231 15,186 16,520 17,059 17,029 17,027 17,737Public Health 7,766 7,836 8,169 7,792 8,064 8,549 9,231 10,878 11,937 14,106Graduate College 9,060 8,172 7,954 7,292 7,351 6,520 7,097 7,242 7,069 7,083University College 23,145 21,154 19,523 19,265 21,449 31,035 32,917 32,304 31,914 33,416
Source: MAUI/Registrar's data warehouse (see Note 1). Note: Administrative home college is the college with primary administrative responsibilty for a given course. Where a course is cross-listed among multiple departments, in this report the hours are credited to the department that is designated the administrative home. continued
Fiscal Year Student Credit Hours by Administrative Home College and by Student Level
Information and Resource Management, Office of the Provost 85
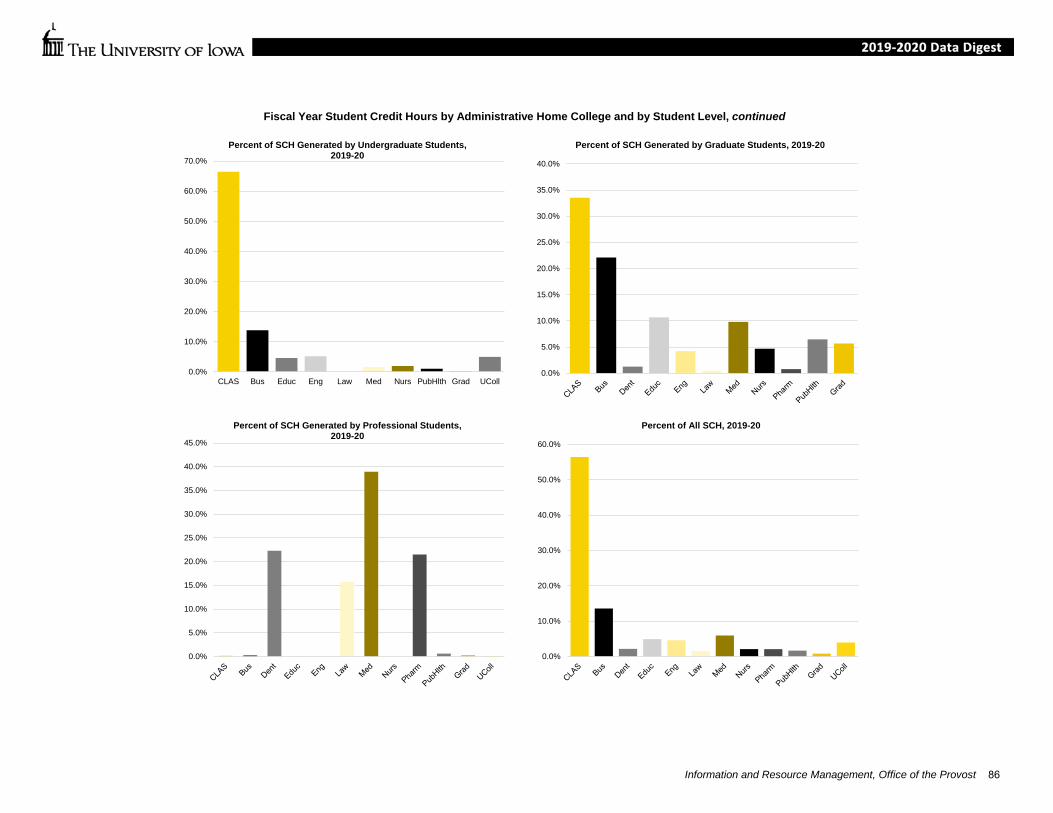
Fiscal Year Student Credit Hours by Administrative Home College and by Student Level, continued
0.0%
10.0%
20.0%
30.0%
40.0%
50.0%
60.0%
70.0%
CLAS Bus Educ Eng Law Med Nurs PubHlth Grad UColl
Percent of SCH Generated by Undergraduate Students, 2019-20
0.0%
5.0%
10.0%
15.0%
20.0%
25.0%
30.0%
35.0%
40.0%
Percent of SCH Generated by Graduate Students, 2019-20
0.0%
5.0%
10.0%
15.0%
20.0%
25.0%
30.0%
35.0%
40.0%
45.0%
Percent of SCH Generated by Professional Students, 2019-20
0.0%
10.0%
20.0%
30.0%
40.0%
50.0%
60.0%
Percent of All SCH, 2019-20
Information and Resource Management, Office of the Provost 86
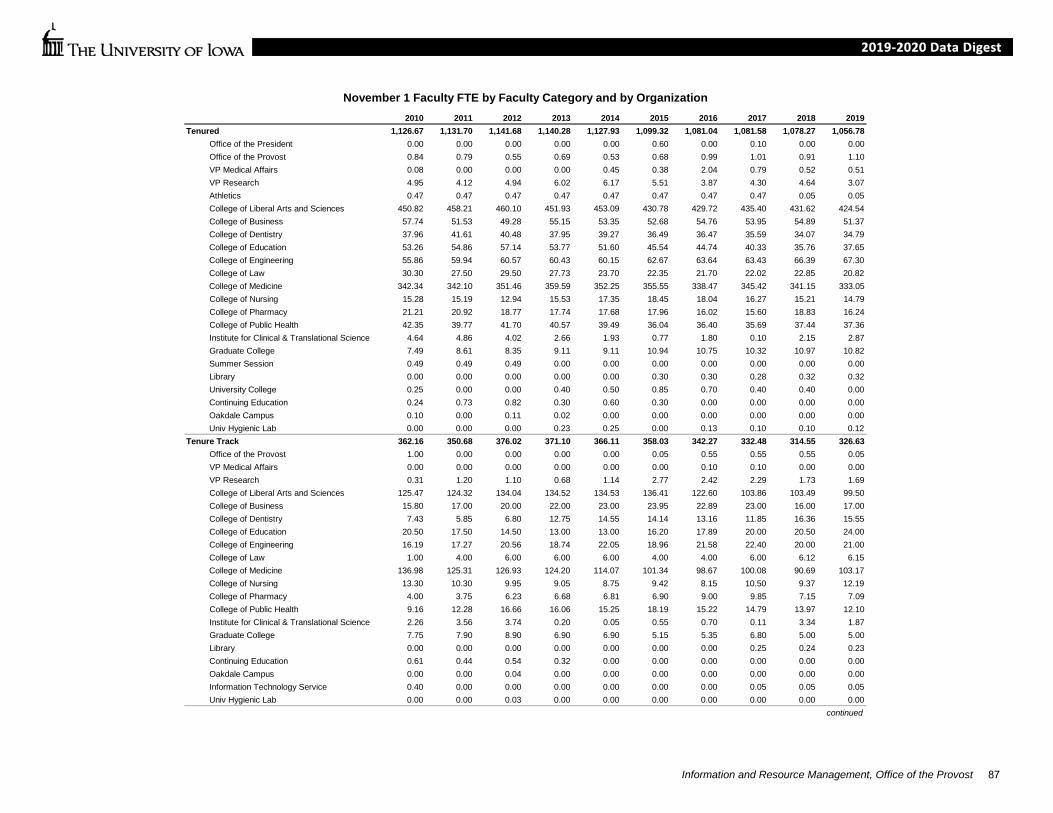
2010 2011 2012 2013 2014 2015 2016 2017 2018 2019Tenured 1,126.67 1,131.70 1,141.68 1,140.28 1,127.93 1,099.32 1,081.04 1,081.58 1,078.27 1,056.78
Office of the President 0.00 0.00 0.00 0.00 0.00 0.60 0.00 0.10 0.00 0.00Office of the Provost 0.84 0.79 0.55 0.69 0.53 0.68 0.99 1.01 0.91 1.10VP Medical Affairs 0.08 0.00 0.00 0.00 0.45 0.38 2.04 0.79 0.52 0.51VP Research 4.95 4.12 4.94 6.02 6.17 5.51 3.87 4.30 4.64 3.07Athletics 0.47 0.47 0.47 0.47 0.47 0.47 0.47 0.47 0.05 0.05College of Liberal Arts and Sciences 450.82 458.21 460.10 451.93 453.09 430.78 429.72 435.40 431.62 424.54College of Business 57.74 51.53 49.28 55.15 53.35 52.68 54.76 53.95 54.89 51.37College of Dentistry 37.96 41.61 40.48 37.95 39.27 36.49 36.47 35.59 34.07 34.79College of Education 53.26 54.86 57.14 53.77 51.60 45.54 44.74 40.33 35.76 37.65College of Engineering 55.86 59.94 60.57 60.43 60.15 62.67 63.64 63.43 66.39 67.30College of Law 30.30 27.50 29.50 27.73 23.70 22.35 21.70 22.02 22.85 20.82College of Medicine 342.34 342.10 351.46 359.59 352.25 355.55 338.47 345.42 341.15 333.05College of Nursing 15.28 15.19 12.94 15.53 17.35 18.45 18.04 16.27 15.21 14.79College of Pharmacy 21.21 20.92 18.77 17.74 17.68 17.96 16.02 15.60 18.83 16.24College of Public Health 42.35 39.77 41.70 40.57 39.49 36.04 36.40 35.69 37.44 37.36Institute for Clinical & Translational Science 4.64 4.86 4.02 2.66 1.93 0.77 1.80 0.10 2.15 2.87Graduate College 7.49 8.61 8.35 9.11 9.11 10.94 10.75 10.32 10.97 10.82Summer Session 0.49 0.49 0.49 0.00 0.00 0.00 0.00 0.00 0.00 0.00Library 0.00 0.00 0.00 0.00 0.00 0.30 0.30 0.28 0.32 0.32University College 0.25 0.00 0.00 0.40 0.50 0.85 0.70 0.40 0.40 0.00Continuing Education 0.24 0.73 0.82 0.30 0.60 0.30 0.00 0.00 0.00 0.00Oakdale Campus 0.10 0.00 0.11 0.02 0.00 0.00 0.00 0.00 0.00 0.00Univ Hygienic Lab 0.00 0.00 0.00 0.23 0.25 0.00 0.13 0.10 0.10 0.12
Tenure Track 362.16 350.68 376.02 371.10 366.11 358.03 342.27 332.48 314.55 326.63Office of the Provost 1.00 0.00 0.00 0.00 0.00 0.05 0.55 0.55 0.55 0.05VP Medical Affairs 0.00 0.00 0.00 0.00 0.00 0.00 0.10 0.10 0.00 0.00VP Research 0.31 1.20 1.10 0.68 1.14 2.77 2.42 2.29 1.73 1.69College of Liberal Arts and Sciences 125.47 124.32 134.04 134.52 134.53 136.41 122.60 103.86 103.49 99.50College of Business 15.80 17.00 20.00 22.00 23.00 23.95 22.89 23.00 16.00 17.00College of Dentistry 7.43 5.85 6.80 12.75 14.55 14.14 13.16 11.85 16.36 15.55College of Education 20.50 17.50 14.50 13.00 13.00 16.20 17.89 20.00 20.50 24.00College of Engineering 16.19 17.27 20.56 18.74 22.05 18.96 21.58 22.40 20.00 21.00College of Law 1.00 4.00 6.00 6.00 6.00 4.00 4.00 6.00 6.12 6.15College of Medicine 136.98 125.31 126.93 124.20 114.07 101.34 98.67 100.08 90.69 103.17College of Nursing 13.30 10.30 9.95 9.05 8.75 9.42 8.15 10.50 9.37 12.19College of Pharmacy 4.00 3.75 6.23 6.68 6.81 6.90 9.00 9.85 7.15 7.09College of Public Health 9.16 12.28 16.66 16.06 15.25 18.19 15.22 14.79 13.97 12.10Institute for Clinical & Translational Science 2.26 3.56 3.74 0.20 0.05 0.55 0.70 0.11 3.34 1.87Graduate College 7.75 7.90 8.90 6.90 6.90 5.15 5.35 6.80 5.00 5.00Library 0.00 0.00 0.00 0.00 0.00 0.00 0.00 0.25 0.24 0.23Continuing Education 0.61 0.44 0.54 0.32 0.00 0.00 0.00 0.00 0.00 0.00Oakdale Campus 0.00 0.00 0.04 0.00 0.00 0.00 0.00 0.00 0.00 0.00Information Technology Service 0.40 0.00 0.00 0.00 0.00 0.00 0.00 0.05 0.05 0.05Univ Hygienic Lab 0.00 0.00 0.03 0.00 0.00 0.00 0.00 0.00 0.00 0.00
continued
November 1 Faculty FTE by Faculty Category and by Organization
Information and Resource Management, Office of the Provost 87

2010 2011 2012 2013 2014 2015 2016 2017 2018 2019Clinical Track 418.93 452.54 493.33 531.24 565.74 630.94 680.61 726.63 755.98 798.73
Office of the Provost 0.00 0.00 0.00 0.00 0.00 0.00 0.74 0.73 0.73 0.23VP Medical Affairs 0.00 0.00 0.24 0.09 0.20 0.98 0.95 0.10 0.25 0.10VP Research 0.00 0.00 0.00 0.00 0.00 0.00 0.00 0.14 0.14 0.14VP Finance and Operations 0.18 0.18 0.18 0.18 0.18 0.18 0.10 0.00 0.00 0.00Human Resources 0.00 0.00 0.00 0.00 0.00 0.00 0.00 0.04 0.05 0.05College of Liberal Arts and Sciences 16.45 15.46 17.04 17.14 18.70 17.77 16.57 19.08 17.09 18.77College of Business 2.00 1.60 1.10 1.10 0.80 0.80 1.49 1.50 2.00 2.00College of Dentistry 36.74 36.74 37.18 41.98 40.03 39.14 42.79 45.24 46.87 47.90College of Education 12.25 13.75 14.15 13.25 14.58 13.47 15.28 18.00 17.65 16.56College of Engineering 0.13 0.16 0.20 0.17 0.19 0.41 0.50 0.44 0.56 0.43College of Law 5.00 5.00 4.65 4.65 4.65 3.65 3.65 5.65 5.65 4.00College of Medicine 304.78 336.38 372.81 409.96 446.44 511.97 547.69 583.87 614.81 656.08College of Nursing 19.05 20.39 20.60 17.95 13.58 13.58 17.24 18.18 19.81 24.00College of Pharmacy 16.25 16.25 18.54 18.02 18.37 20.72 21.42 21.71 21.56 19.70College of Public Health 2.90 4.38 4.88 5.60 7.26 7.84 11.68 11.39 7.80 7.91Institute for Clinical & Translational Science 2.47 1.34 0.86 0.69 0.27 0.17 0.26 0.00 0.47 0.46Library 0.00 0.00 0.00 0.00 0.00 0.00 0.00 0.30 0.30 0.03University College 0.00 0.00 0.00 0.00 0.25 0.25 0.25 0.25 0.25 0.24Continuing Education 0.25 0.42 0.42 0.42 0.25 0.00 0.00 0.00 0.00 0.00Univ Hygienic Lab 0.48 0.50 0.50 0.05 0.00 0.00 0.00 0.00 0.00 0.15
Other Non-Tenure Track 663.39 736.31 728.57 714.82 754.92 779.73 813.92 838.15 878.39 883.35Office of the Provost 1.78 2.00 1.26 0.26 0.26 1.76 1.76 2.41 1.76 1.76VP Research 1.15 4.50 3.40 3.72 3.30 0.75 1.70 1.70 0.50 2.33VP Finance and Operations 0.00 1.00 0.00 0.00 0.00 0.00 0.00 0.00 0.00 0.00Athletics 0.00 0.00 0.00 0.00 0.00 0.00 0.00 0.00 0.40 0.40College of Liberal Arts and Sciences 191.55 214.28 222.58 244.55 288.45 324.05 348.22 340.88 364.65 358.30College of Business 27.45 25.67 22.04 26.29 32.83 44.84 51.78 50.78 53.22 64.43College of Dentistry 23.41 26.92 27.19 21.20 19.18 24.31 19.84 22.74 23.86 23.78College of Education 19.19 23.06 18.19 21.44 25.79 27.82 26.32 23.68 27.84 27.35College of Engineering 21.90 27.49 28.93 24.81 26.73 33.96 34.15 28.76 35.16 31.00College of Law 8.17 9.37 10.06 10.25 10.82 10.80 11.10 9.37 9.47 8.87College of Medicine 285.92 303.77 307.35 300.99 297.87 260.78 266.01 306.77 307.27 311.64College of Nursing 22.85 24.58 23.13 21.45 24.85 28.25 28.72 26.97 29.92 27.64College of Pharmacy 16.22 13.51 6.24 4.40 2.45 2.16 2.34 5.28 5.01 5.94College of Public Health 4.80 10.66 12.02 14.84 11.61 10.80 10.99 10.76 13.77 9.90Institute for Clinical & Translational Science 4.90 4.60 2.75 0.22 0.33 1.00 0.67 0.40 1.00 1.44Graduate College 3.02 2.89 2.60 3.40 4.26 4.95 6.75 4.90 2.73 4.56Library 0.00 0.00 0.00 0.00 0.00 0.00 0.00 0.50 0.24 0.00University College 0.27 0.57 0.10 0.59 1.71 2.25 2.08 1.24 1.62 3.90Continuing Education 30.32 41.44 40.75 15.23 1.65 1.25 1.50 1.00 0.00 0.00Oakdale Campus 0.50 0.00 0.00 1.18 2.84 0.00 0.00 0.00 0.00 0.00Univ Hygienic Lab 0.00 0.00 0.00 0.00 0.00 0.00 0.00 0.00 0.00 0.11
continued
November 1 Faculty FTE by Faculty Category and by Org, continued
Information and Resource Management, Office of the Provost 88
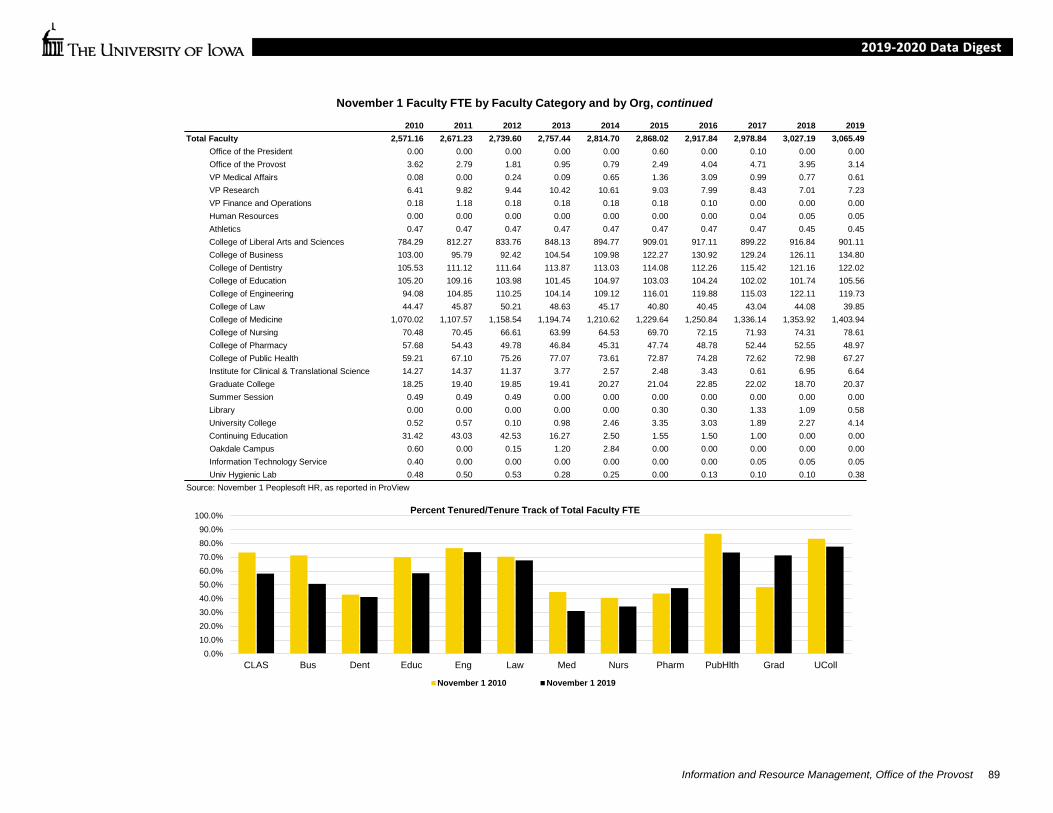
2010 2011 2012 2013 2014 2015 2016 2017 2018 2019Total Faculty 2,571.16 2,671.23 2,739.60 2,757.44 2,814.70 2,868.02 2,917.84 2,978.84 3,027.19 3,065.49
Office of the President 0.00 0.00 0.00 0.00 0.00 0.60 0.00 0.10 0.00 0.00Office of the Provost 3.62 2.79 1.81 0.95 0.79 2.49 4.04 4.71 3.95 3.14VP Medical Affairs 0.08 0.00 0.24 0.09 0.65 1.36 3.09 0.99 0.77 0.61VP Research 6.41 9.82 9.44 10.42 10.61 9.03 7.99 8.43 7.01 7.23VP Finance and Operations 0.18 1.18 0.18 0.18 0.18 0.18 0.10 0.00 0.00 0.00Human Resources 0.00 0.00 0.00 0.00 0.00 0.00 0.00 0.04 0.05 0.05Athletics 0.47 0.47 0.47 0.47 0.47 0.47 0.47 0.47 0.45 0.45College of Liberal Arts and Sciences 784.29 812.27 833.76 848.13 894.77 909.01 917.11 899.22 916.84 901.11College of Business 103.00 95.79 92.42 104.54 109.98 122.27 130.92 129.24 126.11 134.80College of Dentistry 105.53 111.12 111.64 113.87 113.03 114.08 112.26 115.42 121.16 122.02College of Education 105.20 109.16 103.98 101.45 104.97 103.03 104.24 102.02 101.74 105.56College of Engineering 94.08 104.85 110.25 104.14 109.12 116.01 119.88 115.03 122.11 119.73College of Law 44.47 45.87 50.21 48.63 45.17 40.80 40.45 43.04 44.08 39.85College of Medicine 1,070.02 1,107.57 1,158.54 1,194.74 1,210.62 1,229.64 1,250.84 1,336.14 1,353.92 1,403.94College of Nursing 70.48 70.45 66.61 63.99 64.53 69.70 72.15 71.93 74.31 78.61College of Pharmacy 57.68 54.43 49.78 46.84 45.31 47.74 48.78 52.44 52.55 48.97College of Public Health 59.21 67.10 75.26 77.07 73.61 72.87 74.28 72.62 72.98 67.27Institute for Clinical & Translational Science 14.27 14.37 11.37 3.77 2.57 2.48 3.43 0.61 6.95 6.64Graduate College 18.25 19.40 19.85 19.41 20.27 21.04 22.85 22.02 18.70 20.37Summer Session 0.49 0.49 0.49 0.00 0.00 0.00 0.00 0.00 0.00 0.00Library 0.00 0.00 0.00 0.00 0.00 0.30 0.30 1.33 1.09 0.58University College 0.52 0.57 0.10 0.98 2.46 3.35 3.03 1.89 2.27 4.14Continuing Education 31.42 43.03 42.53 16.27 2.50 1.55 1.50 1.00 0.00 0.00Oakdale Campus 0.60 0.00 0.15 1.20 2.84 0.00 0.00 0.00 0.00 0.00Information Technology Service 0.40 0.00 0.00 0.00 0.00 0.00 0.00 0.05 0.05 0.05Univ Hygienic Lab 0.48 0.50 0.53 0.28 0.25 0.00 0.13 0.10 0.10 0.38
Source: November 1 Peoplesoft HR, as reported in ProView
November 1 Faculty FTE by Faculty Category and by Org, continued
0.0%10.0%20.0%30.0%40.0%50.0%60.0%70.0%80.0%90.0%
100.0%
CLAS Bus Dent Educ Eng Law Med Nurs Pharm PubHlth Grad UColl
Percent Tenured/Tenure Track of Total Faculty FTE
November 1 2010 November 1 2019
Information and Resource Management, Office of the Provost 89

2010 2011 2012 2013 2014 2015 2016 2017 2018 2019Tenured 1,248 1,249 1,249 1,243 1,240 1,201 1,179 1,181 1,172 1,156
VP Research 0 0 0 0 0 0 0 0 2 0Liberal Arts & Sciences 487 495 492 486 490 464 461 468 461 458Business 63 58 56 60 58 57 58 58 59 59Dentistry 47 51 48 47 48 45 44 43 42 41Education 61 63 65 61 62 56 54 47 41 43Engineering 64 67 69 70 70 72 72 72 74 74Law 35 33 34 32 28 26 27 26 27 25Medicine 387 384 388 387 383 383 369 372 368 362Nursing 21 20 18 21 22 22 20 20 19 19Pharmacy 27 25 23 22 22 21 20 21 21 18Public Health 49 45 48 49 48 44 44 44 47 46Graduate College 7 8 8 8 9 11 10 10 11 11University College 0 0 0 0 0 0 0 0 0 0
Tenure Track 373 364 386 381 376 363 349 335 324 329Office of the Provost 0 0 0 1 0 0 0 0 0 0Liberal Arts & Sciences 128 130 138 137 138 138 126 106 108 101Business 18 19 21 22 23 24 23 23 16 17Dentistry 7 6 6 13 15 16 14 14 19 17Education 21 18 15 13 14 17 19 21 21 25Engineering 16 16 20 18 23 20 23 23 20 21Law 1 4 6 6 6 4 4 6 6 6Medicine 146 133 136 131 117 103 100 99 95 104Nursing 14 11 11 9 10 9 8 10 10 12Pharmacy 4 5 7 8 7 7 9 9 8 7Public Health 10 13 16 15 15 19 17 17 15 14Graduate College 8 9 10 8 8 6 6 7 6 5
Tenured/Tenure Track Total 1,621 1,613 1,635 1,624 1,616 1,564 1,528 1,516 1,496 1,485Office of the Provost 0 0 0 1 0 0 0 0 0 0VP Research 0 0 0 0 0 0 0 0 2 0Liberal Arts & Sciences 615 625 630 623 628 602 587 574 569 559Business 81 77 77 82 81 81 81 81 75 76Dentistry 54 57 54 60 63 61 58 57 61 58Education 82 81 80 74 76 73 73 68 62 68Engineering 80 83 89 88 93 92 95 95 94 95Law 36 37 40 38 34 30 31 32 33 31Medicine 533 517 524 518 500 486 469 471 463 466Nursing 35 31 29 30 32 31 28 30 29 31Pharmacy 31 30 30 30 29 28 29 30 29 25Public Health 59 58 64 64 63 63 61 61 62 60Graduate College 15 17 18 16 17 17 16 17 17 16
continued
Headcount of Faculty by Faculty Category and by College
Information and Resource Management, Office of the Provost 90
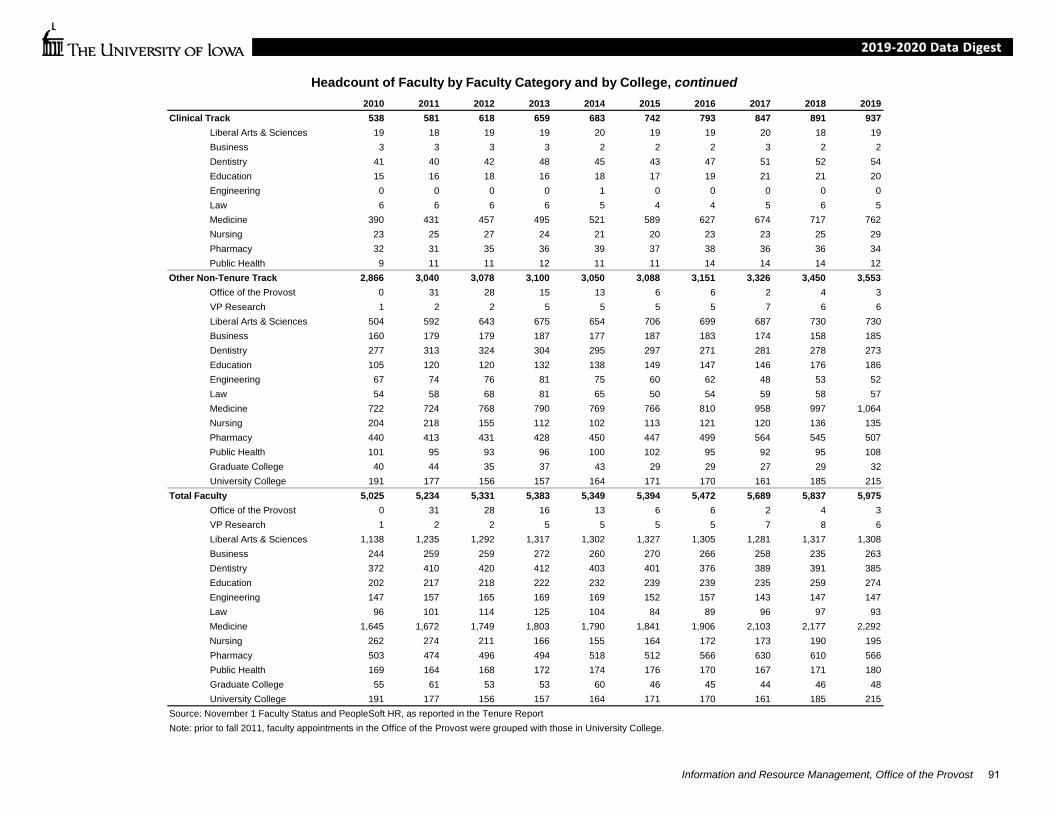
2010 2011 2012 2013 2014 2015 2016 2017 2018 2019Clinical Track 538 581 618 659 683 742 793 847 891 937
Liberal Arts & Sciences 19 18 19 19 20 19 19 20 18 19Business 3 3 3 3 2 2 2 3 2 2Dentistry 41 40 42 48 45 43 47 51 52 54Education 15 16 18 16 18 17 19 21 21 20Engineering 0 0 0 0 1 0 0 0 0 0Law 6 6 6 6 5 4 4 5 6 5Medicine 390 431 457 495 521 589 627 674 717 762Nursing 23 25 27 24 21 20 23 23 25 29Pharmacy 32 31 35 36 39 37 38 36 36 34Public Health 9 11 11 12 11 11 14 14 14 12
Other Non-Tenure Track 2,866 3,040 3,078 3,100 3,050 3,088 3,151 3,326 3,450 3,553Office of the Provost 0 31 28 15 13 6 6 2 4 3VP Research 1 2 2 5 5 5 5 7 6 6Liberal Arts & Sciences 504 592 643 675 654 706 699 687 730 730Business 160 179 179 187 177 187 183 174 158 185Dentistry 277 313 324 304 295 297 271 281 278 273Education 105 120 120 132 138 149 147 146 176 186Engineering 67 74 76 81 75 60 62 48 53 52Law 54 58 68 81 65 50 54 59 58 57Medicine 722 724 768 790 769 766 810 958 997 1,064Nursing 204 218 155 112 102 113 121 120 136 135Pharmacy 440 413 431 428 450 447 499 564 545 507Public Health 101 95 93 96 100 102 95 92 95 108Graduate College 40 44 35 37 43 29 29 27 29 32University College 191 177 156 157 164 171 170 161 185 215
Total Faculty 5,025 5,234 5,331 5,383 5,349 5,394 5,472 5,689 5,837 5,975Office of the Provost 0 31 28 16 13 6 6 2 4 3VP Research 1 2 2 5 5 5 5 7 8 6Liberal Arts & Sciences 1,138 1,235 1,292 1,317 1,302 1,327 1,305 1,281 1,317 1,308Business 244 259 259 272 260 270 266 258 235 263Dentistry 372 410 420 412 403 401 376 389 391 385Education 202 217 218 222 232 239 239 235 259 274Engineering 147 157 165 169 169 152 157 143 147 147Law 96 101 114 125 104 84 89 96 97 93Medicine 1,645 1,672 1,749 1,803 1,790 1,841 1,906 2,103 2,177 2,292Nursing 262 274 211 166 155 164 172 173 190 195Pharmacy 503 474 496 494 518 512 566 630 610 566Public Health 169 164 168 172 174 176 170 167 171 180Graduate College 55 61 53 53 60 46 45 44 46 48University College 191 177 156 157 164 171 170 161 185 215
Source: November 1 Faculty Status and PeopleSoft HR, as reported in the Tenure ReportNote: prior to fall 2011, faculty appointments in the Office of the Provost were grouped with those in University College.
Headcount of Faculty by Faculty Category and by College, continued
Information and Resource Management, Office of the Provost 91
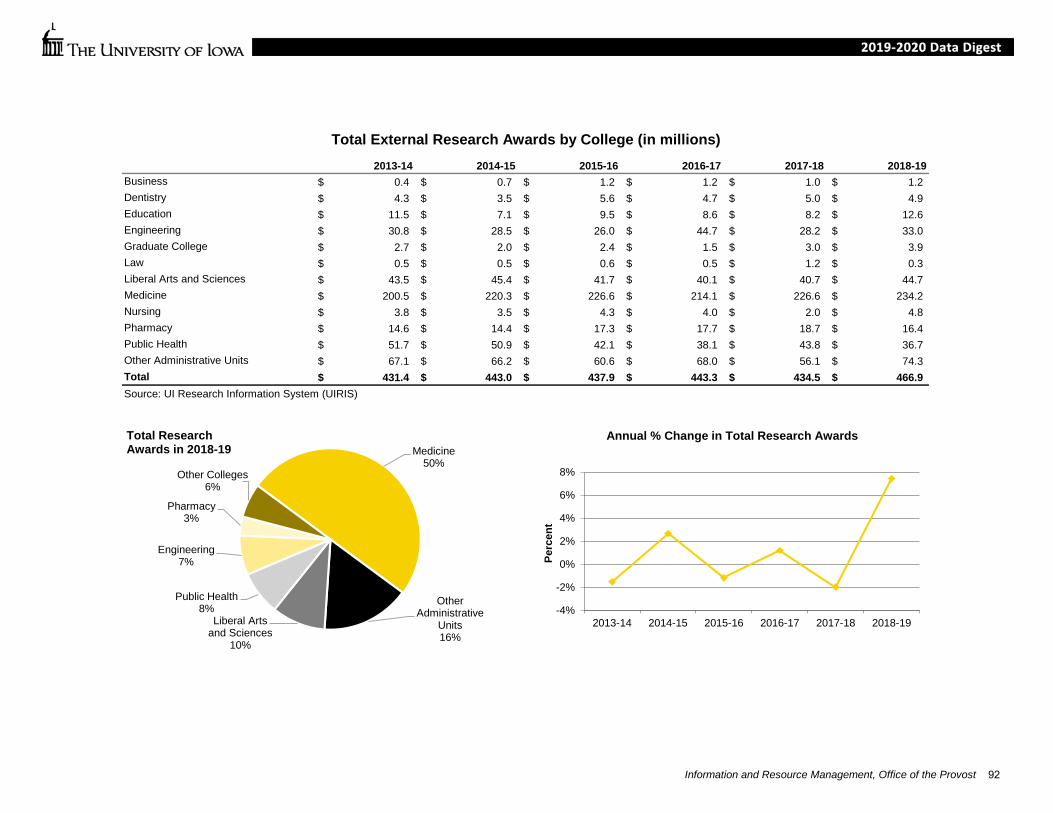
Total External Research Awards by College (in millions)2013-14 2014-15 2015-16 2016-17 2017-18 2018-19
Business 0.4$ 0.7$ 1.2$ 1.2$ 1.0$ 1.2$ Dentistry 4.3$ 3.5$ 5.6$ 4.7$ 5.0$ 4.9$ Education 11.5$ 7.1$ 9.5$ 8.6$ 8.2$ 12.6$ Engineering 30.8$ 28.5$ 26.0$ 44.7$ 28.2$ 33.0$ Graduate College 2.7$ 2.0$ 2.4$ 1.5$ 3.0$ 3.9$ Law 0.5$ 0.5$ 0.6$ 0.5$ 1.2$ 0.3$ Liberal Arts and Sciences 43.5$ 45.4$ 41.7$ 40.1$ 40.7$ 44.7$ Medicine 200.5$ 220.3$ 226.6$ 214.1$ 226.6$ 234.2$ Nursing 3.8$ 3.5$ 4.3$ 4.0$ 2.0$ 4.8$ Pharmacy 14.6$ 14.4$ 17.3$ 17.7$ 18.7$ 16.4$ Public Health 51.7$ 50.9$ 42.1$ 38.1$ 43.8$ 36.7$ Other Administrative Units 67.1$ 66.2$ 60.6$ 68.0$ 56.1$ 74.3$ Total 431.4$ 443.0$ 437.9$ 443.3$ 434.5$ 466.9$ Source: UI Research Information System (UIRIS)
-4%
-2%
0%
2%
4%
6%
8%
2013-14 2014-15 2015-16 2016-17 2017-18 2018-19
Perc
ent
Annual % Change in Total Research AwardsMedicine
50%
Other Administrative
Units16%
Liberal Arts and Sciences
10%
Public Health8%
Engineering7%
Pharmacy3%
Other Colleges 6%
Total Research Awards in 2018-19
Information and Resource Management, Office of the Provost 92

Federal Research Awards by College (in millions)2013-14 2014-15 2015-16 2016-17 2017-18 2018-19
Business 0.1$ 0.1$ 0.6$ 0.5$ 0.4$ 0.6$ Dentistry 3.1$ 1.9$ 3.3$ 2.6$ 2.8$ 2.2$ Education 2.1$ 1.1$ 1.6$ 1.5$ 2.0$ 4.6$ Engineering 17.5$ 12.8$ 11.8$ 16.7$ 13.3$ 19.6$ Graduate College 2.3$ 1.6$ 1.9$ 1.2$ 2.9$ 3.3$ Law -$ 0.1$ -$ -$ 0.7$ -$ Liberal Arts and Sciences 27.6$ 31.5$ 26.9$ 24.3$ 26.8$ 29.8$ Medicine 128.1$ 115.0$ 127.6$ 111.7$ 138.4$ 151.4$ Nursing 2.6$ 2.4$ 3.1$ 3.0$ 1.6$ 4.3$ Pharmacy 4.2$ 3.3$ 3.4$ 4.0$ 4.6$ 3.4$ Public Health 37.7$ 33.4$ 32.1$ 25.2$ 33.3$ 27.4$ Other Administrative Units 25.0$ 28.6$ 27.9$ 33.8$ 33.6$ 35.0$ Total 250.1$ 231.9$ 240.3$ 224.4$ 260.5$ 281.6$ Source: UI Research Information System (UIRIS)
-15%
-10%
-5%
0%
5%
10%
15%
20%
2013-14 2014-15 2015-16 2016-17 2017-18 2018-19
Perc
ent
Annual % Change in Federal Research Awards
Medicine54%
Other Administrative
Units12%
Liberal Arts and Sciences
11%
Public Health10%
Engineering7%
Pharmacy1%
Other Colleges
5%
Federal ResearchAwards in 2018-19
Information and Resource Management, Office of the Provost 93
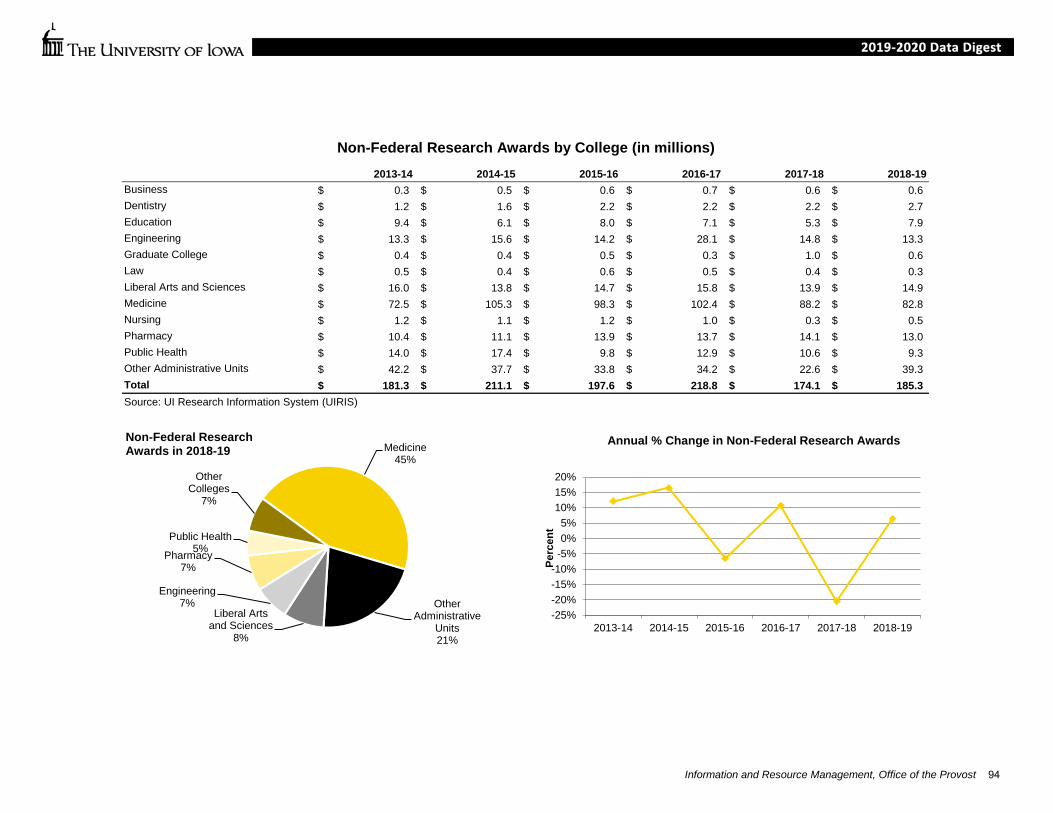
Non-Federal Research Awards by College (in millions)2013-14 2014-15 2015-16 2016-17 2017-18 2018-19
Business 0.3$ 0.5$ 0.6$ 0.7$ 0.6$ 0.6$ Dentistry 1.2$ 1.6$ 2.2$ 2.2$ 2.2$ 2.7$ Education 9.4$ 6.1$ 8.0$ 7.1$ 5.3$ 7.9$ Engineering 13.3$ 15.6$ 14.2$ 28.1$ 14.8$ 13.3$ Graduate College 0.4$ 0.4$ 0.5$ 0.3$ 1.0$ 0.6$ Law 0.5$ 0.4$ 0.6$ 0.5$ 0.4$ 0.3$ Liberal Arts and Sciences 16.0$ 13.8$ 14.7$ 15.8$ 13.9$ 14.9$ Medicine 72.5$ 105.3$ 98.3$ 102.4$ 88.2$ 82.8$ Nursing 1.2$ 1.1$ 1.2$ 1.0$ 0.3$ 0.5$ Pharmacy 10.4$ 11.1$ 13.9$ 13.7$ 14.1$ 13.0$ Public Health 14.0$ 17.4$ 9.8$ 12.9$ 10.6$ 9.3$ Other Administrative Units 42.2$ 37.7$ 33.8$ 34.2$ 22.6$ 39.3$ Total 181.3$ 211.1$ 197.6$ 218.8$ 174.1$ 185.3$ Source: UI Research Information System (UIRIS)
-25%-20%-15%-10%-5%0%5%
10%15%20%
2013-14 2014-15 2015-16 2016-17 2017-18 2018-19
Perc
ent
Annual % Change in Non-Federal Research AwardsMedicine45%
Other Administrative
Units21%
Liberal Arts and Sciences
8%
Engineering7%
Pharmacy7%
Public Health5%
Other Colleges
7%
Non-Federal ResearchAwards in 2018-19
Information and Resource Management, Office of the Provost 94
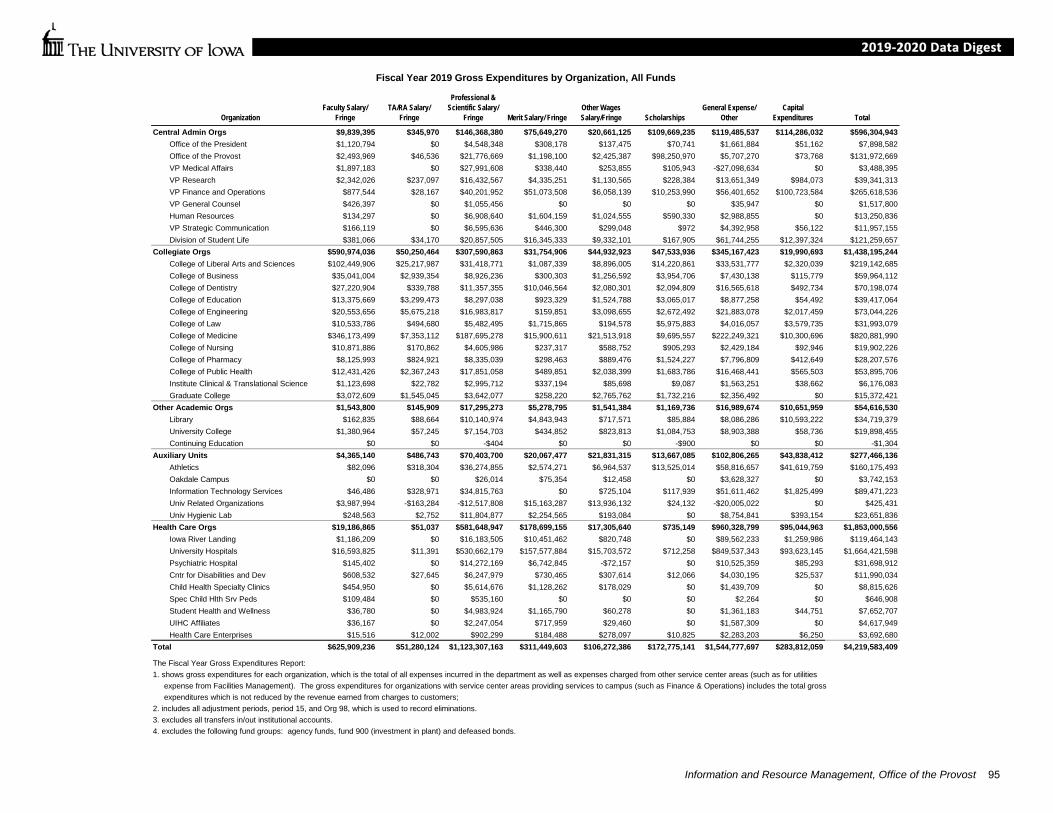
Fiscal Year 2019 Gross Expenditures by Organization, All Funds
OrganizationFaculty Salary/
FringeTA/RA Salary/
Fringe
Professional & Scientific Salary/
Fringe Merit Salary/ FringeOther Wages Salary/Fringe Scholarships
General Expense/ Other
Capital Expenditures Total
Central Admin Orgs $9,839,395 $345,970 $146,368,380 $75,649,270 $20,661,125 $109,669,235 $119,485,537 $114,286,032 $596,304,943Office of the President $1,120,794 $0 $4,548,348 $308,178 $137,475 $70,741 $1,661,884 $51,162 $7,898,582Office of the Provost $2,493,969 $46,536 $21,776,669 $1,198,100 $2,425,387 $98,250,970 $5,707,270 $73,768 $131,972,669VP Medical Affairs $1,897,183 $0 $27,991,608 $338,440 $253,855 $105,943 -$27,098,634 $0 $3,488,395VP Research $2,342,026 $237,097 $16,432,567 $4,335,251 $1,130,565 $228,384 $13,651,349 $984,073 $39,341,313VP Finance and Operations $877,544 $28,167 $40,201,952 $51,073,508 $6,058,139 $10,253,990 $56,401,652 $100,723,584 $265,618,536VP General Counsel $426,397 $0 $1,055,456 $0 $0 $0 $35,947 $0 $1,517,800Human Resources $134,297 $0 $6,908,640 $1,604,159 $1,024,555 $590,330 $2,988,855 $0 $13,250,836VP Strategic Communication $166,119 $0 $6,595,636 $446,300 $299,048 $972 $4,392,958 $56,122 $11,957,155Division of Student Life $381,066 $34,170 $20,857,505 $16,345,333 $9,332,101 $167,905 $61,744,255 $12,397,324 $121,259,657
Collegiate Orgs $590,974,036 $50,250,464 $307,590,863 $31,754,906 $44,932,923 $47,533,936 $345,167,423 $19,990,693 $1,438,195,244College of Liberal Arts and Sciences $102,449,906 $25,217,987 $31,418,771 $1,087,339 $8,896,005 $14,220,861 $33,531,777 $2,320,039 $219,142,685College of Business $35,041,004 $2,939,354 $8,926,236 $300,303 $1,256,592 $3,954,706 $7,430,138 $115,779 $59,964,112College of Dentistry $27,220,904 $339,788 $11,357,355 $10,046,564 $2,080,301 $2,094,809 $16,565,618 $492,734 $70,198,074College of Education $13,375,669 $3,299,473 $8,297,038 $923,329 $1,524,788 $3,065,017 $8,877,258 $54,492 $39,417,064College of Engineering $20,553,656 $5,675,218 $16,983,817 $159,851 $3,098,655 $2,672,492 $21,883,078 $2,017,459 $73,044,226College of Law $10,533,786 $494,680 $5,482,495 $1,715,865 $194,578 $5,975,883 $4,016,057 $3,579,735 $31,993,079College of Medicine $346,173,499 $7,353,112 $187,695,278 $15,900,611 $21,513,918 $9,695,557 $222,249,321 $10,300,696 $820,881,990College of Nursing $10,871,886 $170,862 $4,605,986 $237,317 $588,752 $905,293 $2,429,184 $92,946 $19,902,226College of Pharmacy $8,125,993 $824,921 $8,335,039 $298,463 $889,476 $1,524,227 $7,796,809 $412,649 $28,207,576College of Public Health $12,431,426 $2,367,243 $17,851,058 $489,851 $2,038,399 $1,683,786 $16,468,441 $565,503 $53,895,706Institute Clinical & Translational Science $1,123,698 $22,782 $2,995,712 $337,194 $85,698 $9,087 $1,563,251 $38,662 $6,176,083Graduate College $3,072,609 $1,545,045 $3,642,077 $258,220 $2,765,762 $1,732,216 $2,356,492 $0 $15,372,421
Other Academic Orgs $1,543,800 $145,909 $17,295,273 $5,278,795 $1,541,384 $1,169,736 $16,989,674 $10,651,959 $54,616,530Library $162,835 $88,664 $10,140,974 $4,843,943 $717,571 $85,884 $8,086,286 $10,593,222 $34,719,379University College $1,380,964 $57,245 $7,154,703 $434,852 $823,813 $1,084,753 $8,903,388 $58,736 $19,898,455Continuing Education $0 $0 -$404 $0 $0 -$900 $0 $0 -$1,304
Auxiliary Units $4,365,140 $486,743 $70,403,700 $20,067,477 $21,831,315 $13,667,085 $102,806,265 $43,838,412 $277,466,136Athletics $82,096 $318,304 $36,274,855 $2,574,271 $6,964,537 $13,525,014 $58,816,657 $41,619,759 $160,175,493Oakdale Campus $0 $0 $26,014 $75,354 $12,458 $0 $3,628,327 $0 $3,742,153Information Technology Services $46,486 $328,971 $34,815,763 $0 $725,104 $117,939 $51,611,462 $1,825,499 $89,471,223Univ Related Organizations $3,987,994 -$163,284 -$12,517,808 $15,163,287 $13,936,132 $24,132 -$20,005,022 $0 $425,431Univ Hygienic Lab $248,563 $2,752 $11,804,877 $2,254,565 $193,084 $0 $8,754,841 $393,154 $23,651,836
Health Care Orgs $19,186,865 $51,037 $581,648,947 $178,699,155 $17,305,640 $735,149 $960,328,799 $95,044,963 $1,853,000,556Iowa River Landing $1,186,209 $0 $16,183,505 $10,451,462 $820,748 $0 $89,562,233 $1,259,986 $119,464,143University Hospitals $16,593,825 $11,391 $530,662,179 $157,577,884 $15,703,572 $712,258 $849,537,343 $93,623,145 $1,664,421,598Psychiatric Hospital $145,402 $0 $14,272,169 $6,742,845 -$72,157 $0 $10,525,359 $85,293 $31,698,912Cntr for Disabilities and Dev $608,532 $27,645 $6,247,979 $730,465 $307,614 $12,066 $4,030,195 $25,537 $11,990,034Child Health Specialty Clinics $454,950 $0 $5,614,676 $1,128,262 $178,029 $0 $1,439,709 $0 $8,815,626Spec Child Hlth Srv Peds $109,484 $0 $535,160 $0 $0 $0 $2,264 $0 $646,908Student Health and Wellness $36,780 $0 $4,983,924 $1,165,790 $60,278 $0 $1,361,183 $44,751 $7,652,707UIHC Affiliates $36,167 $0 $2,247,054 $717,959 $29,460 $0 $1,587,309 $0 $4,617,949Health Care Enterprises $15,516 $12,002 $902,299 $184,488 $278,097 $10,825 $2,283,203 $6,250 $3,692,680
Total $625,909,236 $51,280,124 $1,123,307,163 $311,449,603 $106,272,386 $172,775,141 $1,544,777,697 $283,812,059 $4,219,583,409
The Fiscal Year Gross Expenditures Report:1. shows gross expenditures for each organization, which is the total of all expenses incurred in the department as well as expenses charged from other service center areas (such as for utilities expense from Facilities Management). The gross expenditures for organizations with service center areas providing services to campus (such as Finance & Operations) includes the total gross expenditures which is not reduced by the revenue earned from charges to customers; 2. includes all adjustment periods, period 15, and Org 98, which is used to record eliminations.3. excludes all transfers in/out institutional accounts.4. excludes the following fund groups: agency funds, fund 900 (investment in plant) and defeased bonds.
Information and Resource Management, Office of the Provost 95

Fiscal Year 2019 Gross Expenditures by Organization, General Education Funds
OrganizationFaculty Salary/
Fringe TA Salary/ Fringe
Professional & Scientific Salary/
FringeMerit Salary/
FringeOther Wages Salary/ Fringe Scholarships
General Expense/ Other
Capital Expenditures Total
Central Admin Orgs $5,505,123 $102,992 $63,480,275 $11,184,535 $2,094,931 $70,915,079 $93,941,815 $30,730,607 $277,955,356Office of the President $1,119,897 $0 $3,742,178 $238,283 $63,305 $12,390 $959,857 $51,162 $6,187,072Office of the Provost $2,310,986 $46,536 $17,517,216 $1,026,888 $674,104 $70,133,338 $3,925,789 $11,268 $95,646,124VP Medical Affairs $52,000 $0 $2,632,975 $0 -$8 $0 -$2,684,967 $0 $0VP Research $992,774 $45,015 $9,421,209 $269,285 $186,552 $172,016 $1,888,703 $246,589 $13,222,143VP Finance and Operations $320,930 $593 $14,400,957 $8,315,537 $711,266 $0 $86,251,849 $28,349,607 $138,350,739VP General Counsel $426,397 $0 $1,055,456 $0 $0 $0 $33,310 $0 $1,515,163Human Resources $24,223 $0 $4,392,396 $710,401 $69,714 $590,330 $1,993,834 $0 $7,780,897VP Strategic Communication $162,115 $0 $5,360,772 $217,047 $91,601 $972 $703,919 $0 $6,536,426Division of Student Life $95,801 $10,848 $4,957,116 $407,094 $298,397 $6,033 $869,521 $2,071,981 $8,716,792
Collegiate Orgs $233,396,225 $31,415,918 $71,435,011 $9,501,713 $9,491,760 $25,774,753 $25,405,617 $5,118,752 $411,539,749College of Liberal Arts and Sciences $94,985,652 $20,557,129 $19,682,415 $1,102,017 $4,356,095 $9,845,814 $5,946,126 $751,786 $157,227,034College of Business $24,307,490 $2,599,265 $3,652,794 $287,080 $503,413 $1,544,976 $602,602 $0 $33,497,620College of Dentistry $16,398,938 $125,764 $5,790,499 $3,256,780 $119,883 $1,370,268 $1,477,453 -$186,981 $28,352,603College of Education $10,759,721 $1,710,734 $3,384,473 $519,324 $528,565 $1,345,947 $759,472 $6,608 $19,014,843College of Engineering $15,752,193 $1,729,594 $4,363,095 $77,933 $686,062 $487,052 $1,669,941 $298,119 $25,063,989College of Law $8,896,222 $416,536 $4,928,426 $1,686,324 $170,008 $3,818,251 $1,632,605 $3,664,376 $25,212,748College of Medicine $37,504,382 $1,490,917 $16,723,354 $1,736,297 $1,232,325 $4,249,570 $9,771,763 $439,033 $73,147,641College of Nursing $9,545,369 $94,667 $3,193,737 $237,317 $159,467 $87,839 $581,387 $0 $13,899,784College of Pharmacy $6,274,381 $362,262 $2,402,979 $145,905 $269,567 $1,108,422 $1,103,116 $115,336 $11,781,967College of Public Health $6,098,471 $934,860 $4,047,917 $195,507 $331,642 $668,806 $1,133,374 $30,475 $13,441,053Institute for Clinical & Translational Science $13,995 $0 $0 $0 $0 $0 -$13,995 $0 $0Graduate College $2,859,412 $1,394,190 $3,265,323 $257,230 $1,134,733 $1,247,808 $741,772 $0 $10,900,467
Other Academic Orgs $1,246,152 $67,628 $13,908,262 $5,169,239 $1,037,004 $22,623 $7,010,617 $10,459,564 $38,921,091Library $47,603 $10,383 $8,793,894 $4,823,040 $638,497 $5,154 $6,571,627 $10,459,564 $31,349,760University College $1,198,549 $57,245 $5,114,506 $346,200 $398,507 $17,470 $438,991 $0 $7,571,468Continuing Education $0 $0 -$137 $0 $0 $0 $0 $0 -$137
Auxiliary Units $78,608 $45,563 $1,874,977 $0 $30,061 $26,514 $4,995,980 $349,903 $7,401,606Information Technology Services $0 $0 $0 $0 $0 $2,382 $33,409,677 $349,903 $33,761,962Univ Related Organizations $78,608 $45,563 $1,865,386 $0 $30,061 $24,132 -$28,493,697 $0 -$26,449,947Univ Hygienic Lab $0 $0 $9,591 $0 $0 $0 $80,000 $0 $89,591
Total $240,226,109 $31,632,101 $150,698,525 $25,855,488 $12,653,756 $96,738,968 $131,354,029 $46,658,826 $735,817,802
The Fiscal Year Gross Expenditures Report:1. shows gross expenditures for each organization, which is the total of all expenses incurred in the department as well as expenses charged from other service center areas (such as for utilities expense from Facilities Management). The gross expenditures for organizations with service center areas providing services to campus (such as Finance & Operations) includes the total gross expenditures which is not reduced by the revenue earned from charges to customers; 2. includes all adjustment periods, period 15, and Org 98, which is used to record eliminations.3. excludes all transfers in/out institutional accounts.4. excludes the following fund groups: agency funds, fund 900 (investment in plant) and defeased bonds.
Information and Resource Management, Office of the Provost 96

Programs
Academic Degree Programs Offered ..................................................................... 98 Fall Semester Enrollment by Objective and Program of Study .............................. 99 Number of Degree Programs Completed by Objective and Program of Study..... 113
97
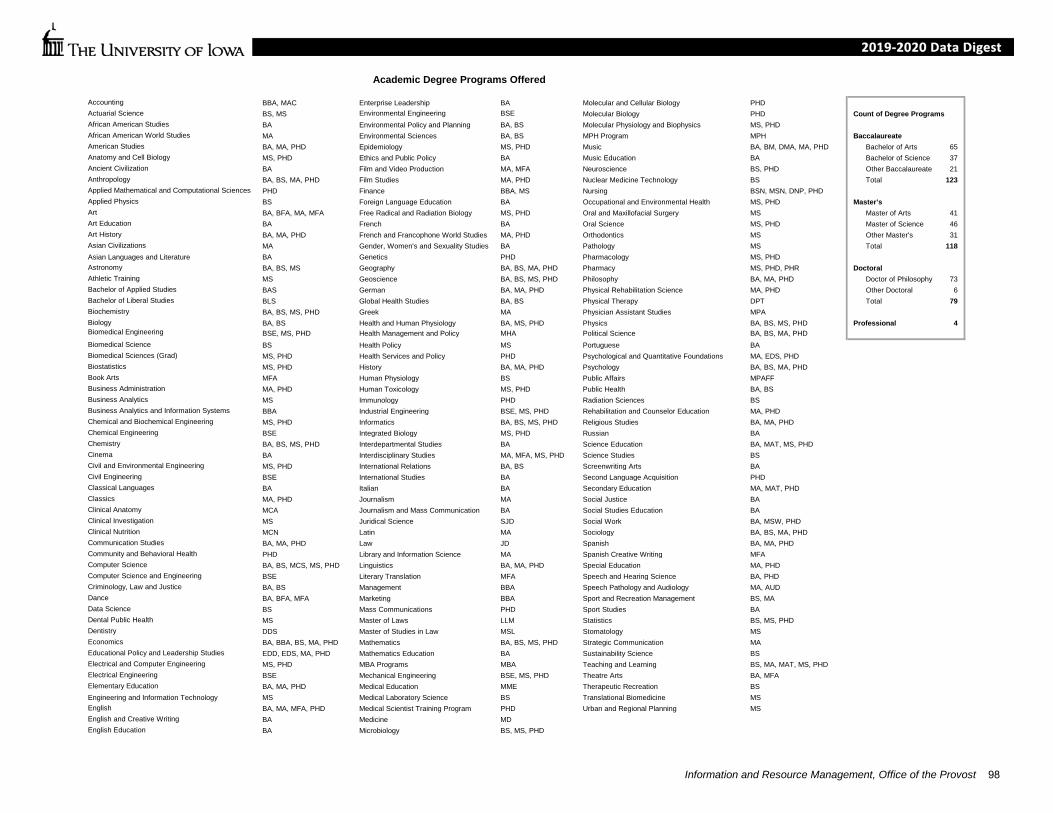
Accounting BBA, MAC Enterprise Leadership BA Molecular and Cellular Biology PHD Actuarial Science BS, MS Environmental Engineering BSE Molecular Biology PHD Count of Degree ProgramsAfrican American Studies BA Environmental Policy and Planning BA, BS Molecular Physiology and Biophysics MS, PHD African American World Studies MA Environmental Sciences BA, BS MPH Program MPH Baccalaureate American Studies BA, MA, PHD Epidemiology MS, PHD Music BA, BM, DMA, MA, PHD Bachelor of Arts 65Anatomy and Cell Biology MS, PHD Ethics and Public Policy BA Music Education BA Bachelor of Science 37Ancient Civilization BA Film and Video Production MA, MFA Neuroscience BS, PHD Other Baccalaureate 21Anthropology BA, BS, MA, PHD Film Studies MA, PHD Nuclear Medicine Technology BS Total 123Applied Mathematical and Computational Sciences PHD Finance BBA, MS Nursing BSN, MSN, DNP, PHD Applied Physics BS Foreign Language Education BA Occupational and Environmental Health MS, PHD Master's Art BA, BFA, MA, MFA Free Radical and Radiation Biology MS, PHD Oral and Maxillofacial Surgery MS Master of Arts 41Art Education BA French BA Oral Science MS, PHD Master of Science 46Art History BA, MA, PHD French and Francophone World Studies MA, PHD Orthodontics MS Other Master's 31Asian Civilizations MA Gender, Women's and Sexuality Studies BA Pathology MS Total 118Asian Languages and Literature BA Genetics PHD Pharmacology MS, PHD Astronomy BA, BS, MS Geography BA, BS, MA, PHD Pharmacy MS, PHD, PHR Doctoral Athletic Training MS Geoscience BA, BS, MS, PHD Philosophy BA, MA, PHD Doctor of Philosophy 73Bachelor of Applied Studies BAS German BA, MA, PHD Physical Rehabilitation Science MA, PHD Other Doctoral 6Bachelor of Liberal Studies BLS Global Health Studies BA, BS Physical Therapy DPT Total 79Biochemistry BA, BS, MS, PHD Greek MA Physician Assistant Studies MPA Biology BA, BS Health and Human Physiology BA, MS, PHD Physics BA, BS, MS, PHD Professional 4Biomedical Engineering BSE, MS, PHD Health Management and Policy MHA Political Science BA, BS, MA, PHDBiomedical Science BS Health Policy MS Portuguese BA Biomedical Sciences (Grad) MS, PHD Health Services and Policy PHD Psychological and Quantitative Foundations MA, EDS, PHD Biostatistics MS, PHD History BA, MA, PHD Psychology BA, BS, MA, PHD Book Arts MFA Human Physiology BS Public Affairs MPAFFBusiness Administration MA, PHD Human Toxicology MS, PHD Public Health BA, BS Business Analytics MS Immunology PHD Radiation Sciences BS Business Analytics and Information Systems BBA Industrial Engineering BSE, MS, PHD Rehabilitation and Counselor Education MA, PHD Chemical and Biochemical Engineering MS, PHD Informatics BA, BS, MS, PHD Religious Studies BA, MA, PHD Chemical Engineering BSE Integrated Biology MS, PHD Russian BA Chemistry BA, BS, MS, PHD Interdepartmental Studies BA Science Education BA, MAT, MS, PHD Cinema BA Interdisciplinary Studies MA, MFA, MS, PHD Science Studies BSCivil and Environmental Engineering MS, PHD International Relations BA, BS Screenwriting Arts BACivil Engineering BSE International Studies BA Second Language Acquisition PHD Classical Languages BA Italian BA Secondary Education MA, MAT, PHD Classics MA, PHD Journalism MA Social Justice BAClinical Anatomy MCA Journalism and Mass Communication BA Social Studies Education BAClinical Investigation MS Juridical Science SJD Social Work BA, MSW, PHD Clinical Nutrition MCN Latin MA Sociology BA, BS, MA, PHDCommunication Studies BA, MA, PHD Law JD Spanish BA, MA, PHD Community and Behavioral Health PHD Library and Information Science MA Spanish Creative Writing MFA Computer Science BA, BS, MCS, MS, PHD Linguistics BA, MA, PHD Special Education MA, PHD Computer Science and Engineering BSE Literary Translation MFA Speech and Hearing Science BA, PHD Criminology, Law and Justice BA, BS Management BBA Speech Pathology and Audiology MA, AUD Dance BA, BFA, MFA Marketing BBA Sport and Recreation Management BS, MAData Science BS Mass Communications PHD Sport Studies BA Dental Public Health MS Master of Laws LLM Statistics BS, MS, PHD Dentistry DDS Master of Studies in Law MSL Stomatology MS Economics BA, BBA, BS, MA, PHD Mathematics BA, BS, MS, PHD Strategic Communication MA Educational Policy and Leadership Studies EDD, EDS, MA, PHD Mathematics Education BA Sustainability Science BSElectrical and Computer Engineering MS, PHD MBA Programs MBA Teaching and Learning BS, MA, MAT, MS, PHDElectrical Engineering BSE Mechanical Engineering BSE, MS, PHD Theatre Arts BA, MFA Elementary Education BA, MA, PHD Medical Education MME Therapeutic Recreation BSEngineering and Information Technology MS Medical Laboratory Science BS Translational Biomedicine MS English BA, MA, MFA, PHD Medical Scientist Training Program PHD Urban and Regional Planning MS English and Creative Writing BA Medicine MD English Education BA Microbiology BS, MS, PHD
Academic Degree Programs Offered
Information and Resource Management, Office of the Provost 98
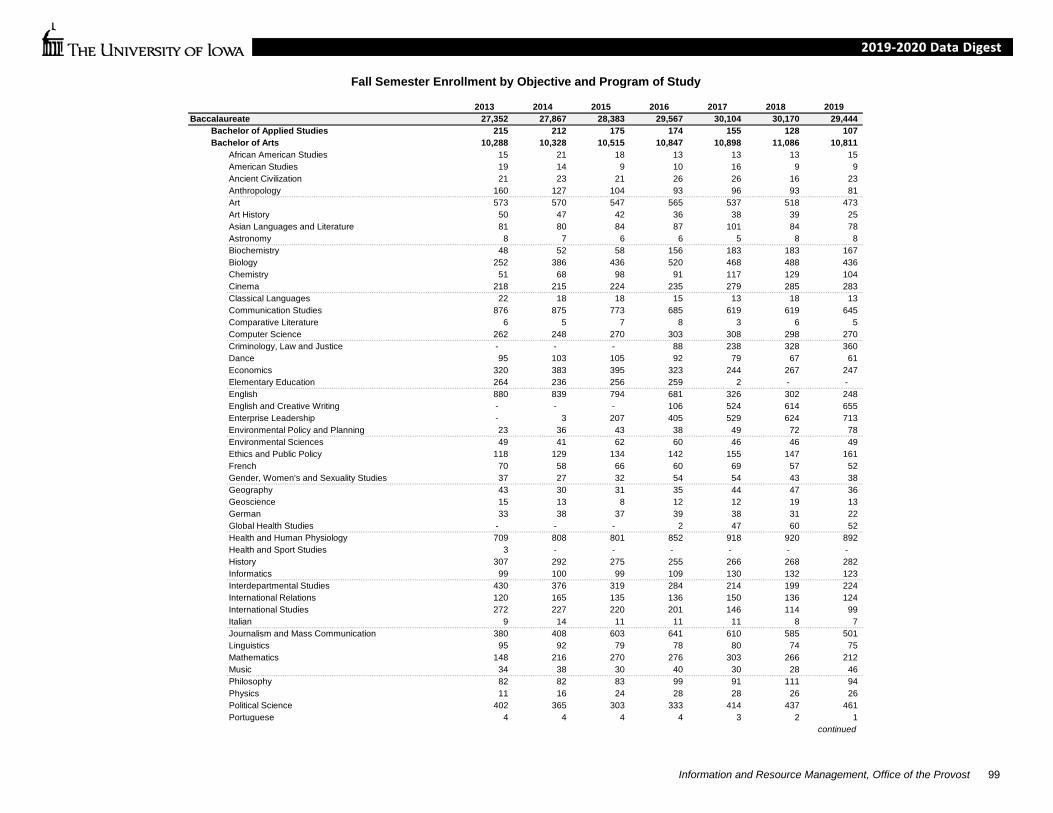
Fall Semester Enrollment by Objective and Program of Study
2013 2014 2015 2016 2017 2018 2019Baccalaureate 27,352 27,867 28,383 29,567 30,104 30,170 29,444
Bachelor of Applied Studies 215 212 175 174 155 128 107 Bachelor of Arts 10,288 10,328 10,515 10,847 10,898 11,086 10,811
African American Studies 15 21 18 13 13 13 15 American Studies 19 14 9 10 16 9 9 Ancient Civilization 21 23 21 26 26 16 23 Anthropology 160 127 104 93 96 93 81 Art 573 570 547 565 537 518 473 Art History 50 47 42 36 38 39 25 Asian Languages and Literature 81 80 84 87 101 84 78 Astronomy 8 7 6 6 5 8 8 Biochemistry 48 52 58 156 183 183 167 Biology 252 386 436 520 468 488 436 Chemistry 51 68 98 91 117 129 104 Cinema 218 215 224 235 279 285 283 Classical Languages 22 18 18 15 13 18 13 Communication Studies 876 875 773 685 619 619 645 Comparative Literature 6 5 7 8 3 6 5 Computer Science 262 248 270 303 308 298 270 Criminology, Law and Justice - - - 88 238 328 360 Dance 95 103 105 92 79 67 61 Economics 320 383 395 323 244 267 247 Elementary Education 264 236 256 259 2 - - English 880 839 794 681 326 302 248 English and Creative Writing - - - 106 524 614 655 Enterprise Leadership - 3 207 405 529 624 713 Environmental Policy and Planning 23 36 43 38 49 72 78 Environmental Sciences 49 41 62 60 46 46 49 Ethics and Public Policy 118 129 134 142 155 147 161 French 70 58 66 60 69 57 52 Gender, Women's and Sexuality Studies 37 27 32 54 54 43 38 Geography 43 30 31 35 44 47 36 Geoscience 15 13 8 12 12 19 13 German 33 38 37 39 38 31 22 Global Health Studies - - - 2 47 60 52 Health and Human Physiology 709 808 801 852 918 920 892 Health and Sport Studies 3 - - - - - - History 307 292 275 255 266 268 282 Informatics 99 100 99 109 130 132 123 Interdepartmental Studies 430 376 319 284 214 199 224 International Relations 120 165 135 136 150 136 124 International Studies 272 227 220 201 146 114 99 Italian 9 14 11 11 11 8 7 Journalism and Mass Communication 380 408 603 641 610 585 501 Linguistics 95 92 79 78 80 74 75 Mathematics 148 216 270 276 303 266 212 Music 34 38 30 40 30 28 46 Philosophy 82 82 83 99 91 111 94 Physics 11 16 24 28 28 26 26 Political Science 402 365 303 333 414 437 461 Portuguese 4 4 4 4 3 2 1
continued
Information and Resource Management, Office of the Provost 99

Fall Semester Enrollment by Objective and Program of Study, continued
Bachelor of Arts, continued 2013 2014 2015 2016 2017 2018 2019Psychology 1,193 1,125 1,079 1,142 1,073 1,031 1,061 Public Health - - - 14 32 83 117 Religious Studies 45 29 32 38 34 36 24 Russian 32 23 25 20 24 31 29 Social Justice - - - - 4 28 32 Social Work 122 112 118 106 107 105 115 Sociology 257 276 297 226 184 153 117 Spanish 288 275 274 223 232 216 198 Speech and Hearing Science 289 264 253 242 276 305 301 Sport Studies 146 140 101 73 77 69 51 Theatre Arts 202 189 195 171 183 193 179
Bachelor of Arts in Education - - - - 288 342 526 Art Education - - - - - - 12 Elementary Education - - - - 288 342 338 English Education - - - - - - 39 Foreign Language Education - - - - - - 14 Mathematics Education - - - - - - 16 Music Education - - - - - - 46 Science Education - - - - - - 17 Social Studies Education - - - - - - 44
Bachelor of Business Administration 2,483 2,544 2,690 2,801 3,036 3,281 3,294 Accounting 318 295 313 279 280 325 311 Business Accelerated Admission 99 5 - - - - - Business Analytics and Information Systems 38 130 172 195 233 332 366 Business Direct Admission 393 493 708 925 1,039 1,078 1,079 Business Standard Admission 185 273 265 216 330 263 236 Economics 108 91 87 91 86 88 85 Finance 748 710 662 603 602 687 647 Management 245 249 227 225 209 214 219 Management Information Systems 65 11 - - - - - Marketing 284 287 256 267 257 294 351
Bachelor of Fine Arts 88 83 70 66 88 87 80 Art 75 76 56 52 65 63 55 Dance 13 7 14 14 23 24 25
Bachelor of Liberal Studies 63 102 162 192 189 209 205 Bachelor of Music 197 194 192 210 219 217 204 Bachelor of Science 3,066 3,291 3,393 3,723 3,865 3,928 3,695
Actuarial Science 55 51 42 50 59 66 60 Anthropology 18 26 28 38 30 44 39 Applied Physics 8 6 6 15 8 9 9 Astronomy 32 22 26 28 42 39 41 Athletic Training 44 46 52 53 46 27 16 Biochemistry 115 80 76 69 65 56 42 Biology 493 388 342 414 426 366 286 Biomedical Sciences - - 17 25 41 62 74 Chemistry 155 125 121 112 92 79 85 Computer Science 127 206 269 340 321 333 300 Criminology, Law and Justice - - - 3 23 42 40 Data Science - - - - - 1 22 Economics 136 142 126 118 97 79 59 Elementary Education - - 3 7 - - -
continued
Information and Resource Management, Office of the Provost 100
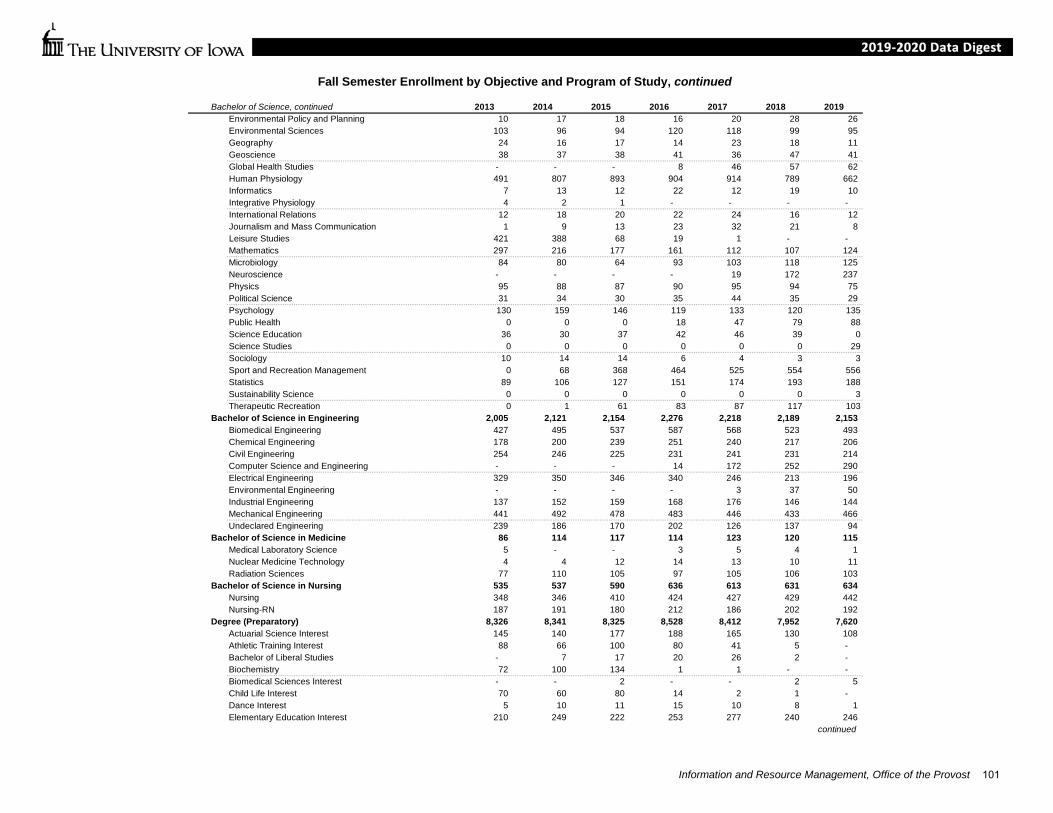
Fall Semester Enrollment by Objective and Program of Study, continued
Bachelor of Science, continued 2013 2014 2015 2016 2017 2018 2019Environmental Policy and Planning 10 17 18 16 20 28 26 Environmental Sciences 103 96 94 120 118 99 95 Geography 24 16 17 14 23 18 11 Geoscience 38 37 38 41 36 47 41 Global Health Studies - - - 8 46 57 62 Human Physiology 491 807 893 904 914 789 662 Informatics 7 13 12 22 12 19 10 Integrative Physiology 4 2 1 - - - - International Relations 12 18 20 22 24 16 12 Journalism and Mass Communication 1 9 13 23 32 21 8 Leisure Studies 421 388 68 19 1 - - Mathematics 297 216 177 161 112 107 124 Microbiology 84 80 64 93 103 118 125 Neuroscience - - - - 19 172 237 Physics 95 88 87 90 95 94 75 Political Science 31 34 30 35 44 35 29 Psychology 130 159 146 119 133 120 135Public Health 0 0 0 18 47 79 88Science Education 36 30 37 42 46 39 0Science Studies 0 0 0 0 0 0 29Sociology 10 14 14 6 4 3 3Sport and Recreation Management 0 68 368 464 525 554 556Statistics 89 106 127 151 174 193 188Sustainability Science 0 0 0 0 0 0 3Therapeutic Recreation 0 1 61 83 87 117 103
Bachelor of Science in Engineering 2,005 2,121 2,154 2,276 2,218 2,189 2,153 Biomedical Engineering 427 495 537 587 568 523 493 Chemical Engineering 178 200 239 251 240 217 206 Civil Engineering 254 246 225 231 241 231 214 Computer Science and Engineering - - - 14 172 252 290 Electrical Engineering 329 350 346 340 246 213 196 Environmental Engineering - - - - 3 37 50 Industrial Engineering 137 152 159 168 176 146 144 Mechanical Engineering 441 492 478 483 446 433 466 Undeclared Engineering 239 186 170 202 126 137 94
Bachelor of Science in Medicine 86 114 117 114 123 120 115 Medical Laboratory Science 5 - - 3 5 4 1 Nuclear Medicine Technology 4 4 12 14 13 10 11 Radiation Sciences 77 110 105 97 105 106 103
Bachelor of Science in Nursing 535 537 590 636 613 631 634 Nursing 348 346 410 424 427 429 442 Nursing-RN 187 191 180 212 186 202 192
Degree (Preparatory) 8,326 8,341 8,325 8,528 8,412 7,952 7,620 Actuarial Science Interest 145 140 177 188 165 130 108 Athletic Training Interest 88 66 100 80 41 5 - Bachelor of Liberal Studies - 7 17 20 26 2 - Biochemistry 72 100 134 1 1 - - Biomedical Sciences Interest - - 2 - - 2 5 Child Life Interest 70 60 80 14 2 1 - Dance Interest 5 10 11 15 10 8 1 Elementary Education Interest 210 249 222 253 277 240 246
continued
Information and Resource Management, Office of the Provost 101
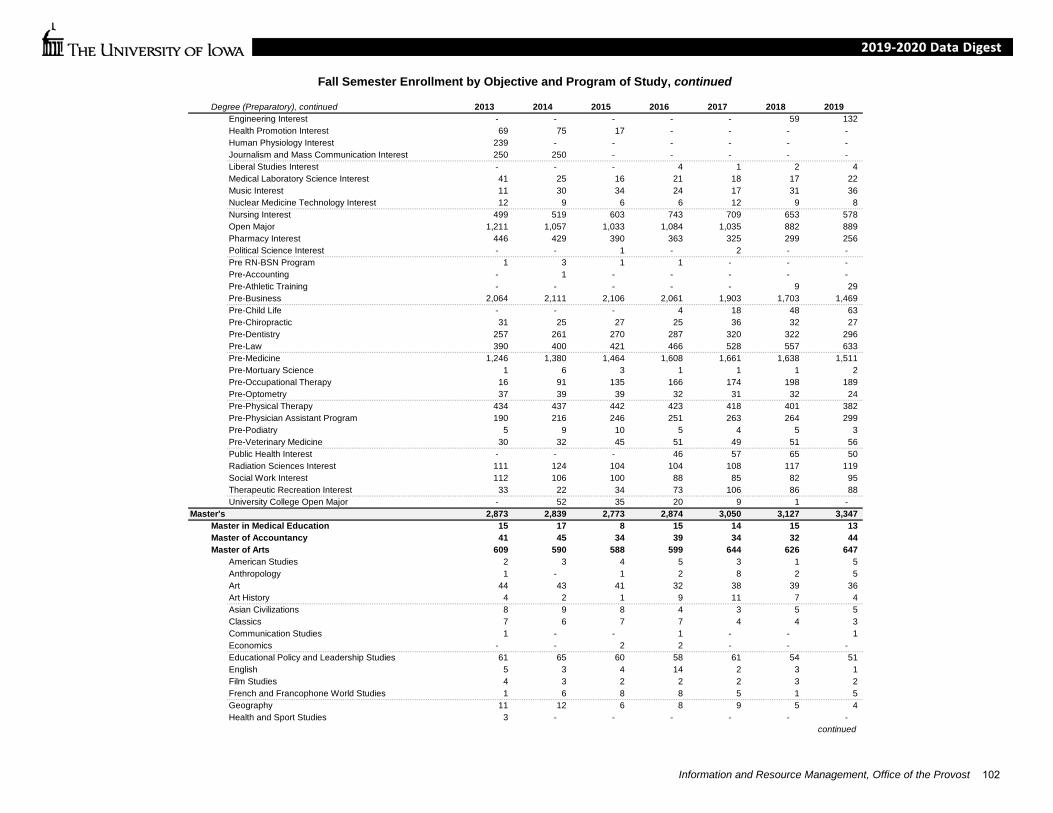
Fall Semester Enrollment by Objective and Program of Study, continued
Degree (Preparatory), continued 2013 2014 2015 2016 2017 2018 2019Engineering Interest - - - - - 59 132 Health Promotion Interest 69 75 17 - - - - Human Physiology Interest 239 - - - - - - Journalism and Mass Communication Interest 250 250 - - - - - Liberal Studies Interest - - - 4 1 2 4 Medical Laboratory Science Interest 41 25 16 21 18 17 22 Music Interest 11 30 34 24 17 31 36 Nuclear Medicine Technology Interest 12 9 6 6 12 9 8 Nursing Interest 499 519 603 743 709 653 578 Open Major 1,211 1,057 1,033 1,084 1,035 882 889 Pharmacy Interest 446 429 390 363 325 299 256 Political Science Interest - - 1 - 2 - - Pre RN-BSN Program 1 3 1 1 - - - Pre-Accounting - 1 - - - - - Pre-Athletic Training - - - - - 9 29 Pre-Business 2,064 2,111 2,106 2,061 1,903 1,703 1,469 Pre-Child Life - - - 4 18 48 63 Pre-Chiropractic 31 25 27 25 36 32 27 Pre-Dentistry 257 261 270 287 320 322 296 Pre-Law 390 400 421 466 528 557 633 Pre-Medicine 1,246 1,380 1,464 1,608 1,661 1,638 1,511 Pre-Mortuary Science 1 6 3 1 1 1 2 Pre-Occupational Therapy 16 91 135 166 174 198 189 Pre-Optometry 37 39 39 32 31 32 24 Pre-Physical Therapy 434 437 442 423 418 401 382 Pre-Physician Assistant Program 190 216 246 251 263 264 299 Pre-Podiatry 5 9 10 5 4 5 3 Pre-Veterinary Medicine 30 32 45 51 49 51 56 Public Health Interest - - - 46 57 65 50 Radiation Sciences Interest 111 124 104 104 108 117 119 Social Work Interest 112 106 100 88 85 82 95 Therapeutic Recreation Interest 33 22 34 73 106 86 88 University College Open Major - 52 35 20 9 1 -
Master's 2,873 2,839 2,773 2,874 3,050 3,127 3,347 Master in Medical Education 15 17 8 15 14 15 13 Master of Accountancy 41 45 34 39 34 32 44 Master of Arts 609 590 588 599 644 626 647
American Studies 2 3 4 5 3 1 5 Anthropology 1 - 1 2 8 2 5 Art 44 43 41 32 38 39 36 Art History 4 2 1 9 11 7 4 Asian Civilizations 8 9 8 4 3 5 5 Classics 7 6 7 7 4 4 3 Communication Studies 1 - - 1 - - 1 Economics - - 2 2 - - - Educational Policy and Leadership Studies 61 65 60 58 61 54 51 English 5 3 4 14 2 3 1 Film Studies 4 3 2 2 2 3 2 French and Francophone World Studies 1 6 8 8 5 1 5 Geography 11 12 6 8 9 5 4 Health and Sport Studies 3 - - - - - -
continued
Information and Resource Management, Office of the Provost 102

Fall Semester Enrollment by Objective and Program of Study, continued
Master of Arts, continued 2013 2014 2015 2016 2017 2018 2019History 14 9 10 9 7 8 5 Interdisciplinary Studies 1 1 1 - - 2 1 International Studies 3 - - - - - - Journalism 7 8 5 3 1 2 2 Leisure Studies 23 18 22 29 36 2 - Library and Information Science 55 68 76 81 92 75 80 Linguistics 14 22 22 15 14 15 15 Music 58 63 60 55 56 64 47 Philosophy 4 6 4 6 2 6 4 Physical Rehabilitation Science - - - - - - 1 Political Science 14 8 9 6 9 9 11 Psychological and Quantitative Foundations 48 37 30 22 19 18 16 Psychology 4 - - 1 - - - Rehabilitation and Counselor Education 61 53 53 53 56 54 70 Religious Studies 8 5 6 3 1 1 3 Sociology 15 16 16 18 16 14 9 Spanish 7 6 3 3 4 6 6 Special Education 16 1 - - - - - Speech Pathology and Audiology 52 50 49 48 48 47 46 Sport and Recreation Management - - - - - 37 39 Strategic Communication 15 25 37 56 64 68 81 Teaching and Learning 36 40 41 37 71 72 87 Urban and Regional Planning 2 2 - 2 2 2 2
Master of Arts in Teaching 45 43 34 37 29 34 38 Science Education 2 - - - - - - Secondary Education 5 - - - - - - Teaching and Learning 38 43 34 37 29 34 38
Master of Business Administration 886 857 809 777 863 841 829 CIMBA Program--MBA 10 25 23 13 15 8 6 MBA Executive Program 135 103 83 81 92 79 79 MBA Full-time Program 110 118 118 109 101 48 3 MBA International Executive Program 46 37 38 33 16 - 10 Professional MBA Program 585 574 547 541 639 706 731
Master of Clinical Anatomy - - - - - 7 11 Master of Clinical Nutrition - - - - - - 8 Master of Computer Science 46 40 62 70 57 51 54 Master of Fine Arts 268 258 242 245 258 264 260
Art 29 28 17 25 19 19 23 Book Arts 25 19 15 16 21 22 22 Comparative Literature - Translation 6 11 14 20 23 25 14 Dance 12 12 14 11 14 13 11 English 128 123 117 115 120 120 121 Film and Video Production 10 10 7 7 8 9 7 Interdisciplinary Studies - - - - - - 1 Literary Translation - - - - - - 9 Music 2 - - - - - - Spanish Creative Writing 9 8 11 10 10 13 11 Theatre Arts 47 47 47 41 43 43 41
Master of Health Administration 58 72 77 76 75 76 82 Master of Laws 8 15 3 7 2 10 3 Master of Physician Assistant Studies 48 48 51 74 75 74 75
continued
Information and Resource Management, Office of the Provost 103

Fall Semester Enrollment by Objective and Program of Study, continued
2013 2014 2015 2016 2017 2018 2019Master of Public Health 153 152 145 148 150 135 129 Master of Science 439 477 476 556 616 687 872
Actuarial Science 36 48 39 29 19 13 19 Anatomy and Cell Biology 1 - - - - - - Astronomy 2 1 2 1 - - 4 Athletic Training - - - - - - 2 Biochemistry 2 - - - - - - Biology 3 3 - - - - - Biomedical Engineering 29 31 28 28 22 18 24 Biomedical Science - - - - - - 1 Biostatistics 19 15 14 15 14 15 22 Business Analytics - - 26 85 176 251 342 Chemical and Biochemical Engineering 4 6 5 7 8 1 2 Chemistry 5 3 2 2 1 1 1 Civil and Environmental Engineering 39 39 29 29 28 36 41 Clinical Investigation 10 6 8 11 9 8 7 Community and Behavioral Health 1 1 2 1 1 1 - Computer Science - - - - 1 - 1 Dental Public Health 8 7 8 9 8 7 4 Electrical and Computer Engineering 18 29 23 28 21 25 32 Epidemiology 18 26 17 10 13 9 10 Exercise Science 2 - - - - - - Finance - - - - - 40 68 Geoscience 20 14 15 19 17 15 17 Health and Human Physiology 10 22 26 33 37 36 34 Health Policy - - 1 4 3 2 1 Human Toxicology - - 1 2 1 3 1 Industrial Engineering 3 5 4 8 6 10 14 Informatics 10 17 15 11 21 24 22 Integrated Biology 2 5 8 11 10 7 13 Interdisciplinary Studies 2 2 3 1 1 - 1 Mathematics 36 31 19 50 36 17 9 Mechanical Engineering 17 16 24 14 8 9 14 Microbiology 1 1 1 1 1 - - Molecular Physiology and Biophysics 1 - - 2 1 - - Occupational and Environmental Health 17 13 19 24 20 17 22 Operative Dentistry 8 - - - - - - Oral Science 15 26 28 27 27 20 26 Orthodontics 10 10 10 10 10 10 10 Pathology 5 2 3 4 4 4 5 Pharmacology 1 - - - - - - Pharmacy 1 2 6 2 3 2 2 Physics 4 5 3 1 3 2 2 Science Education 1 1 - - - - - Statistics 27 29 32 26 23 22 23 Teaching and Learning 2 1 - 3 9 21 40 Translational Biomedicine - 8 11 10 10 5 2 Urban and Regional Planning 49 52 44 38 44 36 34
Master of Science in Nursing 26 16 15 16 17 16 18 Master of Social Work 215 200 217 203 207 250 253 Master of Studies in Law - - 2 4 1 2 7
continued
Information and Resource Management, Office of the Provost 104

Fall Semester Enrollment by Objective and Program of Study, continued
2013 2014 2015 2016 2017 2018 2019Specialist in Education 16 9 10 8 8 7 4
Educational Policy and Leadership Studies 14 8 7 6 6 6 4 Psychological and Quantitative Foundations 2 1 3 2 2 1 -
Doctorate 2,863 2,709 2,646 2,575 2,510 2,460 2,449 Doctor of Audiology 31 29 31 30 31 35 32 Doctor of Juridical Science - - 4 7 9 7 6 Doctor of Musical Arts 115 117 112 105 109 98 99 Doctor of Nursing Practice 201 174 183 201 194 194 211 Doctor of Philosophy 2,407 2,277 2,201 2,115 2,048 2,005 1,976
American Studies 24 17 16 13 13 14 12 Anatomy and Cell Biology 17 15 13 9 3 2 2 Anthropology 35 32 32 27 26 26 25 Applied Mathematical and Computational Sciences 38 37 39 40 40 32 37 Art History 29 26 21 17 13 13 14 Biochemistry 26 31 32 33 28 23 15 Biology 28 21 14 10 6 - - Biomedical Engineering 49 46 41 49 35 40 41 Biomedical Science - - - 1 52 80 120 Biosciences Program 8 10 1 - - - - Biostatistics 24 26 27 26 25 26 26 Business Administration 73 65 60 61 65 61 64 Chemical and Biochemical Engineering 31 29 28 28 30 28 28 Chemistry 132 130 151 155 146 145 133 Civil and Environmental Engineering 47 39 38 42 45 51 45 Classics 10 10 10 9 10 8 10 Communication Studies 53 50 43 40 38 31 32 Community and Behavioral Health 10 8 9 11 10 10 9 Comparative Literature 7 5 5 4 2 1 1 Computer Science 39 32 28 36 35 47 47 Economics 29 29 33 33 26 19 12 Educational Policy and Leadership Studies 87 86 91 85 76 73 70 Electrical and Computer Engineering 53 50 52 46 35 33 29 Elementary Education 1 - - - - - - English 92 87 79 71 68 60 54 Epidemiology 33 27 28 26 27 25 28 Film Studies 18 19 18 15 11 14 13 Free Radical and Radiation Biology 12 13 13 13 10 8 5 French and Francophone World Studies 9 10 7 5 7 11 9 Gender, Women's and Sexuality Studies 2 1 1 - - - - Genetics 42 41 43 40 40 39 39 Geography 16 15 13 15 12 14 12 Geoscience 26 20 19 17 13 14 14 German 1 - - - - - - Health and Human Physiology 2 3 6 9 14 12 16 Health and Sport Studies 9 8 6 2 2 2 - Health Services and Policy 9 9 12 14 13 16 15 History 54 49 47 35 34 37 35 Human Toxicology 22 19 21 17 18 21 26 Immunology 34 30 24 24 17 14 10 Industrial Engineering 15 15 16 16 14 17 20 Informatics 10 9 13 13 15 15 16
continued
Information and Resource Management, Office of the Provost 105

Fall Semester Enrollment by Objective and Program of Study, continued
Doctor of Philosophy, continued 2013 2014 2015 2016 2017 2018 2019Integrated Biology 5 11 16 20 24 30 32 Integrative Physiology 3 - 1 - - - - Interdisciplinary Studies 9 9 9 4 5 4 4 Linguistics 10 10 8 6 4 2 4 Mass Communications 28 23 24 18 16 16 17 Mathematics 67 66 60 62 55 54 47 Mechanical Engineering 42 41 40 35 37 37 37 Medical Scientist Training Program 25 20 20 19 20 17 15 Microbiology 37 31 27 25 18 14 10 Molecular and Cellular Biology 45 42 40 43 36 26 16 Molecular Physiology and Biophysics 21 23 19 15 13 8 8 Music 38 29 30 32 29 27 29 Neuroscience 44 45 43 40 49 53 58 Nursing 33 27 30 23 22 23 26 Occupational and Environmental Health 10 12 16 16 20 15 17 Oral Science 3 7 9 11 14 19 14 Pharmacology 16 16 11 12 9 8 5 Pharmacy 80 76 62 67 64 63 54 Philosophy 18 14 18 17 20 17 17 Physical Rehabilitation Science 11 10 9 11 7 9 13 Physics 70 71 66 64 60 60 69 Political Science 22 29 28 30 29 32 32 Psychological and Quantitative Foundations 155 163 151 142 131 126 116 Psychology 78 72 71 59 58 57 59 Rehabilitation and Counselor Education 45 42 40 39 37 26 22 Religious Studies 20 18 17 17 15 14 18 Science Education 10 5 3 1 - - - Second Language Acquisition 26 24 21 18 16 12 8 Secondary Education 4 - - - - - - Social Work 10 8 8 8 7 8 7 Sociology 24 19 17 15 17 17 27 Spanish 17 12 12 11 7 7 8 Special Education 1 2 1 - - - - Speech and Hearing Science 24 21 18 17 15 13 8 Statistics 17 16 17 21 26 24 21 Teaching and Learning 79 92 87 89 94 85 74 Translational Biomedicine 4 2 2 1 - - -
Doctor of Physical Therapy 109 112 115 117 119 121 125 Professional 1,837 1,814 1,800 1,838 1,849 1,841 1,858
Doctor of Dental Surgery 322 328 322 323 329 331 334 Doctor of Medicine 664 664 658 659 669 663 667 Doctor of Pharmacy 431 430 428 428 431 425 426 Juris Doctor 420 392 392 428 420 422 431
Postgraduate 1,344 1,443 1,346 1,366 1,437 1,329 1,319 Postgraduate Training 1,344 1,443 1,346 1,366 1,437 1,329 1,319
CLAS Fellow 1 - - - - - - Dentistry Fellow 4 - - - - - - Fellow Physician 194 207 187 198 208 205 199 Pharmacy Fellow 5 - - - - - - Post Doctoral 334 367 358 331 306 304 290 Resident Physician 806 869 801 837 923 820 830
continued
Information and Resource Management, Office of the Provost 106
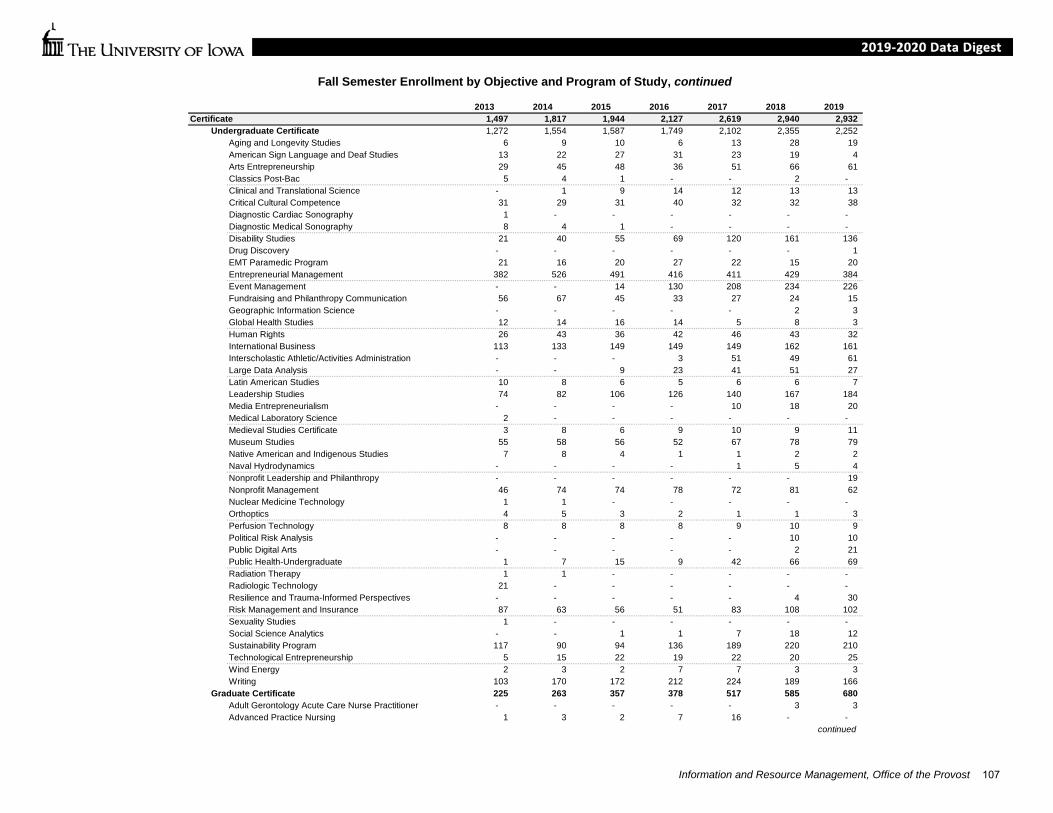
Fall Semester Enrollment by Objective and Program of Study, continued
2013 2014 2015 2016 2017 2018 2019Certificate 1,497 1,817 1,944 2,127 2,619 2,940 2,932
Undergraduate Certificate 1,272 1,554 1,587 1,749 2,102 2,355 2,252 Aging and Longevity Studies 6 9 10 6 13 28 19 American Sign Language and Deaf Studies 13 22 27 31 23 19 4 Arts Entrepreneurship 29 45 48 36 51 66 61 Classics Post-Bac 5 4 1 - - 2 - Clinical and Translational Science - 1 9 14 12 13 13 Critical Cultural Competence 31 29 31 40 32 32 38 Diagnostic Cardiac Sonography 1 - - - - - - Diagnostic Medical Sonography 8 4 1 - - - - Disability Studies 21 40 55 69 120 161 136 Drug Discovery - - - - - - 1 EMT Paramedic Program 21 16 20 27 22 15 20 Entrepreneurial Management 382 526 491 416 411 429 384 Event Management - - 14 130 208 234 226 Fundraising and Philanthropy Communication 56 67 45 33 27 24 15 Geographic Information Science - - - - - 2 3 Global Health Studies 12 14 16 14 5 8 3 Human Rights 26 43 36 42 46 43 32 International Business 113 133 149 149 149 162 161 Interscholastic Athletic/Activities Administration - - - 3 51 49 61 Large Data Analysis - - 9 23 41 51 27 Latin American Studies 10 8 6 5 6 6 7 Leadership Studies 74 82 106 126 140 167 184 Media Entrepreneurialism - - - - 10 18 20 Medical Laboratory Science 2 - - - - - - Medieval Studies Certificate 3 8 6 9 10 9 11 Museum Studies 55 58 56 52 67 78 79 Native American and Indigenous Studies 7 8 4 1 1 2 2 Naval Hydrodynamics - - - - 1 5 4 Nonprofit Leadership and Philanthropy - - - - - - 19 Nonprofit Management 46 74 74 78 72 81 62 Nuclear Medicine Technology 1 1 - - - - - Orthoptics 4 5 3 2 1 1 3 Perfusion Technology 8 8 8 8 9 10 9 Political Risk Analysis - - - - - 10 10 Public Digital Arts - - - - - 2 21 Public Health-Undergraduate 1 7 15 9 42 66 69 Radiation Therapy 1 1 - - - - - Radiologic Technology 21 - - - - - - Resilience and Trauma-Informed Perspectives - - - - - 4 30 Risk Management and Insurance 87 63 56 51 83 108 102 Sexuality Studies 1 - - - - - - Social Science Analytics - - 1 1 7 18 12 Sustainability Program 117 90 94 136 189 220 210 Technological Entrepreneurship 5 15 22 19 22 20 25 Wind Energy 2 3 2 7 7 3 3 Writing 103 170 172 212 224 189 166
Graduate Certificate 225 263 357 378 517 585 680 Adult Gerontology Acute Care Nurse Practitioner - - - - - 3 3 Advanced Practice Nursing 1 3 2 7 16 - -
continued
Information and Resource Management, Office of the Provost 107
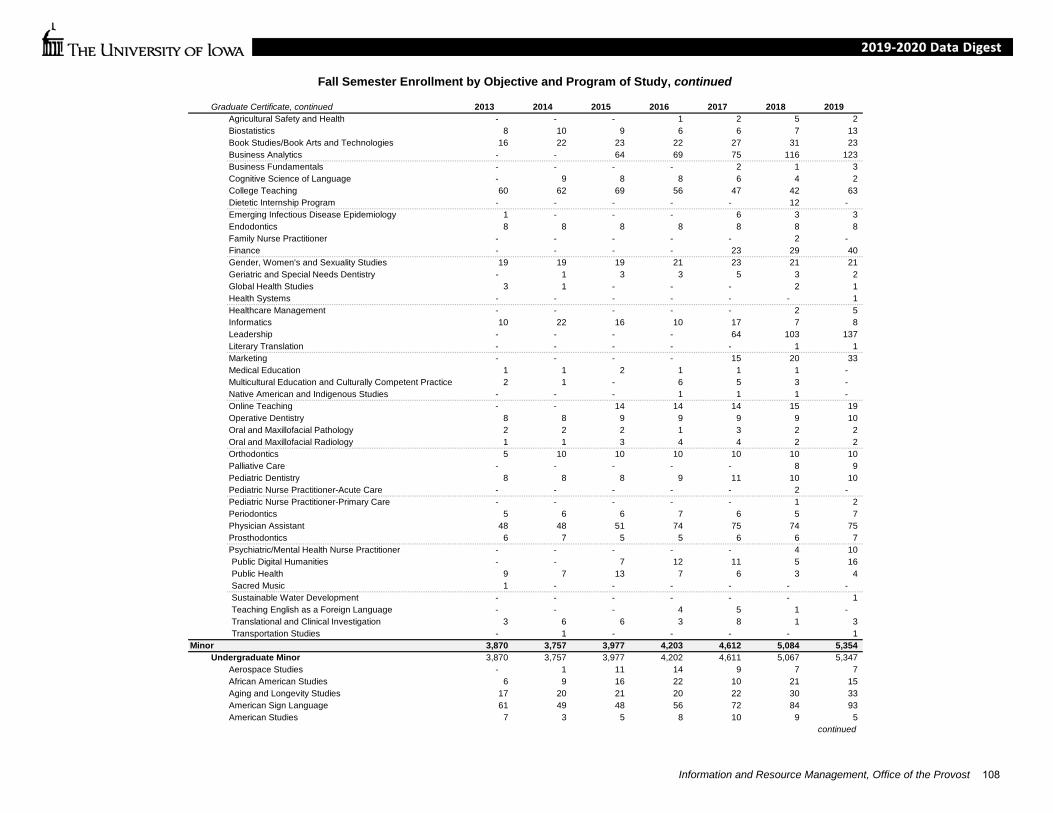
Fall Semester Enrollment by Objective and Program of Study, continued
Graduate Certificate, continued 2013 2014 2015 2016 2017 2018 2019Agricultural Safety and Health - - - 1 2 5 2 Biostatistics 8 10 9 6 6 7 13 Book Studies/Book Arts and Technologies 16 22 23 22 27 31 23 Business Analytics - - 64 69 75 116 123 Business Fundamentals - - - - 2 1 3 Cognitive Science of Language - 9 8 8 6 4 2 College Teaching 60 62 69 56 47 42 63 Dietetic Internship Program - - - - - 12 - Emerging Infectious Disease Epidemiology 1 - - - 6 3 3 Endodontics 8 8 8 8 8 8 8 Family Nurse Practitioner - - - - - 2 - Finance - - - - 23 29 40 Gender, Women's and Sexuality Studies 19 19 19 21 23 21 21 Geriatric and Special Needs Dentistry - 1 3 3 5 3 2 Global Health Studies 3 1 - - - 2 1 Health Systems - - - - - - 1 Healthcare Management - - - - - 2 5 Informatics 10 22 16 10 17 7 8 Leadership - - - - 64 103 137 Literary Translation - - - - - 1 1 Marketing - - - - 15 20 33 Medical Education 1 1 2 1 1 1 - Multicultural Education and Culturally Competent Practice 2 1 - 6 5 3 - Native American and Indigenous Studies - - - 1 1 1 - Online Teaching - - 14 14 14 15 19 Operative Dentistry 8 8 9 9 9 9 10 Oral and Maxillofacial Pathology 2 2 2 1 3 2 2 Oral and Maxillofacial Radiology 1 1 3 4 4 2 2 Orthodontics 5 10 10 10 10 10 10 Palliative Care - - - - - 8 9 Pediatric Dentistry 8 8 8 9 11 10 10 Pediatric Nurse Practitioner-Acute Care - - - - - 2 - Pediatric Nurse Practitioner-Primary Care - - - - - 1 2 Periodontics 5 6 6 7 6 5 7 Physician Assistant 48 48 51 74 75 74 75 Prosthodontics 6 7 5 5 6 6 7 Psychiatric/Mental Health Nurse Practitioner - - - - - 4 10 Public Digital Humanities - - 7 12 11 5 16 Public Health 9 7 13 7 6 3 4 Sacred Music 1 - - - - - - Sustainable Water Development - - - - - - 1 Teaching English as a Foreign Language - - - 4 5 1 - Translational and Clinical Investigation 3 6 6 3 8 1 3 Transportation Studies - 1 - - - - 1
Minor 3,870 3,757 3,977 4,203 4,612 5,084 5,354 Undergraduate Minor 3,870 3,757 3,977 4,202 4,611 5,067 5,347
Aerospace Studies - 1 11 14 9 7 7 African American Studies 6 9 16 22 10 21 15 Aging and Longevity Studies 17 20 21 20 22 30 33 American Sign Language 61 49 48 56 72 84 93 American Studies 7 3 5 8 10 9 5
continued
Information and Resource Management, Office of the Provost 108
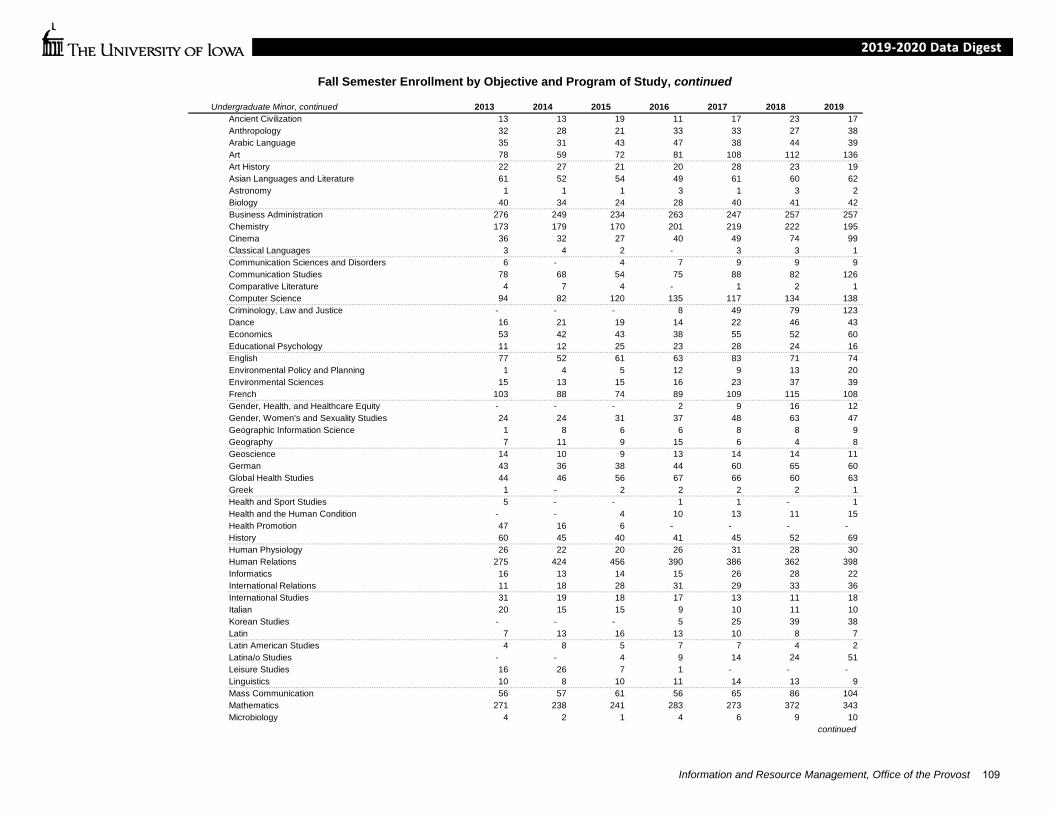
Fall Semester Enrollment by Objective and Program of Study, continued
Undergraduate Minor, continued 2013 2014 2015 2016 2017 2018 2019Ancient Civilization 13 13 19 11 17 23 17 Anthropology 32 28 21 33 33 27 38 Arabic Language 35 31 43 47 38 44 39 Art 78 59 72 81 108 112 136 Art History 22 27 21 20 28 23 19 Asian Languages and Literature 61 52 54 49 61 60 62 Astronomy 1 1 1 3 1 3 2 Biology 40 34 24 28 40 41 42 Business Administration 276 249 234 263 247 257 257 Chemistry 173 179 170 201 219 222 195 Cinema 36 32 27 40 49 74 99 Classical Languages 3 4 2 - 3 3 1 Communication Sciences and Disorders 6 - 4 7 9 9 9 Communication Studies 78 68 54 75 88 82 126 Comparative Literature 4 7 4 - 1 2 1 Computer Science 94 82 120 135 117 134 138 Criminology, Law and Justice - - - 8 49 79 123 Dance 16 21 19 14 22 46 43 Economics 53 42 43 38 55 52 60 Educational Psychology 11 12 25 23 28 24 16 English 77 52 61 63 83 71 74 Environmental Policy and Planning 1 4 5 12 9 13 20 Environmental Sciences 15 13 15 16 23 37 39 French 103 88 74 89 109 115 108 Gender, Health, and Healthcare Equity - - - 2 9 16 12 Gender, Women's and Sexuality Studies 24 24 31 37 48 63 47 Geographic Information Science 1 8 6 6 8 8 9 Geography 7 11 9 15 6 4 8 Geoscience 14 10 9 13 14 14 11 German 43 36 38 44 60 65 60 Global Health Studies 44 46 56 67 66 60 63 Greek 1 - 2 2 2 2 1 Health and Sport Studies 5 - - 1 1 - 1 Health and the Human Condition - - 4 10 13 11 15 Health Promotion 47 16 6 - - - - History 60 45 40 41 45 52 69 Human Physiology 26 22 20 26 31 28 30 Human Relations 275 424 456 390 386 362 398 Informatics 16 13 14 15 26 28 22 International Relations 11 18 28 31 29 33 36 International Studies 31 19 18 17 13 11 18 Italian 20 15 15 9 10 11 10 Korean Studies - - - 5 25 39 38 Latin 7 13 16 13 10 8 7 Latin American Studies 4 8 5 7 7 4 2 Latina/o Studies - - 4 9 14 24 51 Leisure Studies 16 26 7 1 - - - Linguistics 10 8 10 11 14 13 9 Mass Communication 56 57 61 56 65 86 104 Mathematics 271 238 241 283 273 372 343 Microbiology 4 2 1 4 6 9 10
continued
Information and Resource Management, Office of the Provost 109
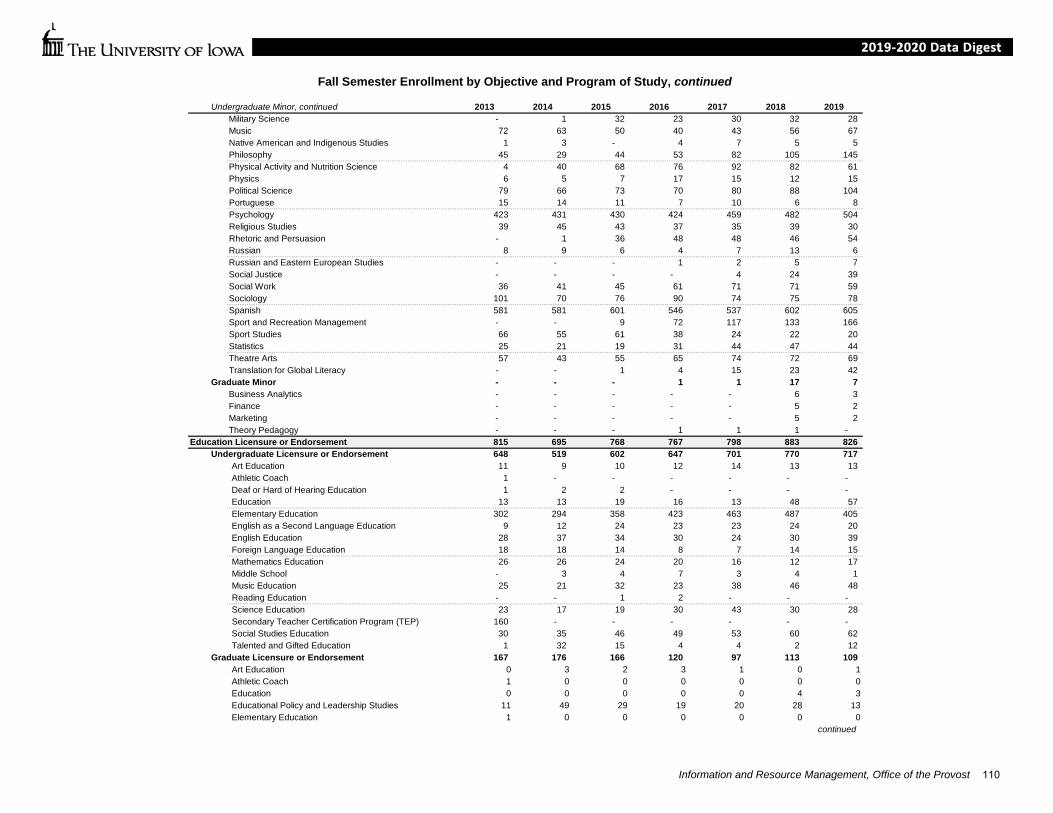
Fall Semester Enrollment by Objective and Program of Study, continued
Undergraduate Minor, continued 2013 2014 2015 2016 2017 2018 2019Military Science - 1 32 23 30 32 28 Music 72 63 50 40 43 56 67 Native American and Indigenous Studies 1 3 - 4 7 5 5 Philosophy 45 29 44 53 82 105 145 Physical Activity and Nutrition Science 4 40 68 76 92 82 61 Physics 6 5 7 17 15 12 15 Political Science 79 66 73 70 80 88 104 Portuguese 15 14 11 7 10 6 8 Psychology 423 431 430 424 459 482 504 Religious Studies 39 45 43 37 35 39 30 Rhetoric and Persuasion - 1 36 48 48 46 54 Russian 8 9 6 4 7 13 6 Russian and Eastern European Studies - - - 1 2 5 7 Social Justice - - - - 4 24 39 Social Work 36 41 45 61 71 71 59 Sociology 101 70 76 90 74 75 78 Spanish 581 581 601 546 537 602 605 Sport and Recreation Management - - 9 72 117 133 166 Sport Studies 66 55 61 38 24 22 20 Statistics 25 21 19 31 44 47 44 Theatre Arts 57 43 55 65 74 72 69 Translation for Global Literacy - - 1 4 15 23 42
Graduate Minor - - - 1 1 17 7 Business Analytics - - - - - 6 3 Finance - - - - - 5 2 Marketing - - - - - 5 2 Theory Pedagogy - - - 1 1 1 -
Education Licensure or Endorsement 815 695 768 767 798 883 826 Undergraduate Licensure or Endorsement 648 519 602 647 701 770 717
Art Education 11 9 10 12 14 13 13 Athletic Coach 1 - - - - - - Deaf or Hard of Hearing Education 1 2 2 - - - - Education 13 13 19 16 13 48 57 Elementary Education 302 294 358 423 463 487 405 English as a Second Language Education 9 12 24 23 23 24 20 English Education 28 37 34 30 24 30 39 Foreign Language Education 18 18 14 8 7 14 15 Mathematics Education 26 26 24 20 16 12 17 Middle School - 3 4 7 3 4 1 Music Education 25 21 32 23 38 46 48 Reading Education - - 1 2 - - - Science Education 23 17 19 30 43 30 28 Secondary Teacher Certification Program (TEP) 160 - - - - - - Social Studies Education 30 35 46 49 53 60 62 Talented and Gifted Education 1 32 15 4 4 2 12
Graduate Licensure or Endorsement 167 176 166 120 97 113 109 Art Education 0 3 2 3 1 0 1Athletic Coach 1 0 0 0 0 0 0Education 0 0 0 0 0 4 3Educational Policy and Leadership Studies 11 49 29 19 20 28 13Elementary Education 1 0 0 0 0 0 0
continued
Information and Resource Management, Office of the Provost 110
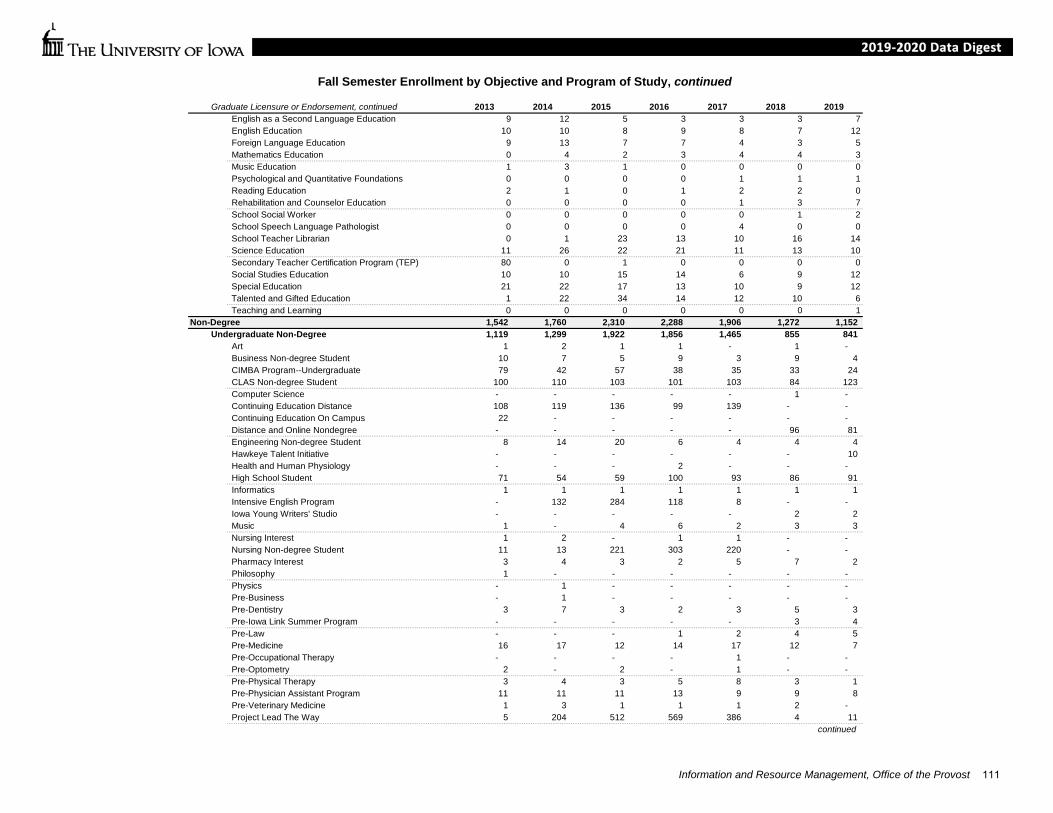
Fall Semester Enrollment by Objective and Program of Study, continued
Graduate Licensure or Endorsement, continued 2013 2014 2015 2016 2017 2018 2019English as a Second Language Education 9 12 5 3 3 3 7English Education 10 10 8 9 8 7 12Foreign Language Education 9 13 7 7 4 3 5Mathematics Education 0 4 2 3 4 4 3Music Education 1 3 1 0 0 0 0Psychological and Quantitative Foundations 0 0 0 0 1 1 1Reading Education 2 1 0 1 2 2 0Rehabilitation and Counselor Education 0 0 0 0 1 3 7School Social Worker 0 0 0 0 0 1 2School Speech Language Pathologist 0 0 0 0 4 0 0School Teacher Librarian 0 1 23 13 10 16 14Science Education 11 26 22 21 11 13 10Secondary Teacher Certification Program (TEP) 80 0 1 0 0 0 0Social Studies Education 10 10 15 14 6 9 12Special Education 21 22 17 13 10 9 12Talented and Gifted Education 1 22 34 14 12 10 6Teaching and Learning 0 0 0 0 0 0 1
Non-Degree 1,542 1,760 2,310 2,288 1,906 1,272 1,152 Undergraduate Non-Degree 1,119 1,299 1,922 1,856 1,465 855 841
Art 1 2 1 1 - 1 - Business Non-degree Student 10 7 5 9 3 9 4 CIMBA Program--Undergraduate 79 42 57 38 35 33 24 CLAS Non-degree Student 100 110 103 101 103 84 123 Computer Science - - - - - 1 - Continuing Education Distance 108 119 136 99 139 - - Continuing Education On Campus 22 - - - - - - Distance and Online Nondegree - - - - - 96 81 Engineering Non-degree Student 8 14 20 6 4 4 4 Hawkeye Talent Initiative - - - - - - 10 Health and Human Physiology - - - 2 - - - High School Student 71 54 59 100 93 86 91 Informatics 1 1 1 1 1 1 1 Intensive English Program - 132 284 118 8 - - Iowa Young Writers' Studio - - - - - 2 2 Music 1 - 4 6 2 3 3 Nursing Interest 1 2 - 1 1 - - Nursing Non-degree Student 11 13 221 303 220 - - Pharmacy Interest 3 4 3 2 5 7 2 Philosophy 1 - - - - - - Physics - 1 - - - - - Pre-Business - 1 - - - - - Pre-Dentistry 3 7 3 2 3 5 3 Pre-Iowa Link Summer Program - - - - - 3 4 Pre-Law - - - 1 2 4 5 Pre-Medicine 16 17 12 14 17 12 7 Pre-Occupational Therapy - - - - 1 - - Pre-Optometry 2 - 2 - 1 - - Pre-Physical Therapy 3 4 3 5 8 3 1 Pre-Physician Assistant Program 11 11 11 13 9 9 8 Pre-Veterinary Medicine 1 3 1 1 1 2 - Project Lead The Way 5 204 512 569 386 4 11
continued
Information and Resource Management, Office of the Provost 111

Fall Semester Enrollment by Objective and Program of Study, continued
Undergraduate Non-Degree, continued 2013 2014 2015 2016 2017 2018 2019Regents Exchange - - - - - 2 - Regents Online Exchange - - - 9 3 - - Secondary Education Interest 554 390 343 323 318 315 284 Secondary Student Training Program 1 1 - - - - - Speech and Hearing Science 2 - - 1 1 1 - Study Abroad Non-degree Student 1 - - - - - - UI REACH Program 50 52 56 58 50 44 48 Undergraduate Workshop - 3 1 - 2 - - University College Non-Degree Student - 72 48 34 23 102 96 Upward Bound - - - - - 1 2 Upward Bound Bridge - - - 2 2 2 11 Visiting Student - International 31 15 15 21 12 - - Visiting Student - USA 22 18 21 16 12 19 16
Graduate Non-Degree 423 461 388 432 441 417 311 American Studies 1 2 2 3 1 - - Art 1 - - - - - - Chemistry - - - 1 - - - CIMBA Program--Graduate - - - 1 - - - Comparative Literature - Translation - - - - 1 - - Continuing Education Distance 50 70 63 58 55 - - Continuing Education On Campus 2 - - - - - - Dentistry Non-degree Student 1 1 2 2 6 5 1 Dietetic Internship Program 12 12 12 12 12 - - Distance and Online Nondegree - - - - - 55 46 Doris Duke Scholar 2 - - - - - - German - - - - 1 - - Graduate Nondepartmental 136 113 105 103 91 100 87 Graduate Workshop 2 15 2 1 1 - - Law Non-degree Student 6 2 4 4 5 4 7 MBA Program 2 1 1 3 1 - - Music - - 1 - - - - Pre MBA Professional MBA Program 208 245 196 239 263 244 165 Professional MBA Program - - - 3 4 8 5 Study Abroad Non-degree Student - - - - - 1 - Urban and Regional Planning - - - 2 - - -
TOTAL 43,993 44,701 45,947 47,605 48,885 49,106 48,681
Notes: "Program of study" (POS) counts for this report are rolled up at the program level (by declaration type and objective) and do not include declared sub-programs as unique POSs. Individual students are counted multiple times if they are enrolled in multiple programs of study. Non-Degree counts include graduate students registered under "professional improvement" status and undergraduate students registered for "personal development," as well as other students in programs without a declared degree objective.
Information and Resource Management, Office of the Provost 112

Number of Degree Programs Completed by Objective and Program of Study (Fiscal Year)
2009-10 2010-11 2011-12 2012-13 2013-14 2014-15 2015-16 2016-17 2017-18 2018-19Baccalaureate 5,069 5,161 4,956 5,252 5,384 5,460 5,411 5,400 5,146 5,836
Bachelor of Applied Studies 12 22 35 64 49 71 50 55 51 57 Bachelor of Arts 2,901 2,930 2,749 2,836 2,765 2,683 2,700 2,659 2,423 2,755
African American Studies 2 5 6 2 4 1 5 5 3 4 African American World Studies - - - - - 1 1 - - - American Studies 14 23 14 9 3 10 4 2 4 5 Ancient Civilization 4 9 3 10 7 4 5 6 7 6 Anthropology 52 57 56 52 32 40 28 25 30 30 Art 65 58 63 82 56 62 62 68 47 78 Art History 17 14 20 16 11 6 7 9 6 12 Asian Languages and Literature 26 16 27 19 15 15 17 9 18 14 Astronomy - - 1 - - - - - - - Biochemistry 8 10 16 13 22 20 23 27 28 24 Biology 38 48 29 33 21 30 21 27 25 35 Chemistry 7 10 7 11 13 16 24 16 26 26 Cinema 73 72 49 58 39 60 54 44 44 66 Classical Languages 5 8 5 5 5 5 7 2 - 6 Communication Studies 275 258 223 235 260 258 257 239 193 190 Comparative Literature 2 1 2 4 - - - - - - Computer Science 19 21 21 38 38 40 61 50 59 64 Criminology, Law and Justice - - - - - - - 11 16 58 Dance 20 15 14 21 19 13 15 14 11 19 Economics 47 68 82 69 118 118 141 114 80 111 Elementary Education 133 137 134 137 128 87 89 109 - - English 233 234 230 231 222 216 205 155 92 82 English and Creative Writing - - - - - - - 14 46 107 Enterprise Leadership - - - - - - 27 109 182 206 Environmental Policy and Planning - - - - 4 6 17 13 9 11 Environmental Sciences - 5 10 15 14 11 8 23 11 15 Ethics and Public Policy 2 2 22 28 35 34 40 36 45 53 French 22 21 19 19 23 13 15 11 20 11 Gender, Women's and Sexuality Studies 5 10 4 6 10 11 7 5 16 11 Geography 22 14 24 17 23 12 8 7 10 13 Geoscience 5 1 8 3 5 4 4 7 2 8 German 11 8 9 5 10 11 5 7 7 6 Global Health Studies - - - - - - - 1 7 18 Health and Human Physiology - 26 99 142 220 258 253 258 253 309 Health and Sport Studies 98 92 50 12 4 1 2 1 - - History 114 116 105 109 70 68 63 72 68 48 Informatics 16 23 22 33 26 19 28 30 28 38 Interdepartmental Studies 427 392 331 273 227 195 179 155 145 126 International Relations - - - - 11 42 38 39 23 27 International Studies 120 119 98 101 93 71 57 60 51 41
continued
Information and Resource Management, Office of the Provost 113

Number of Degree Programs Completed by Objective and Program of Study (Fiscal Year), continued
Bachelor of Arts, continued 2009-10 2010-11 2011-12 2012-13 2013-14 2014-15 2015-16 2016-17 2017-18 2018-19Italian 2 1 4 4 4 2 2 3 4 2 Journalism and Mass Communication 161 147 141 161 134 170 153 143 140 153 Linguistics 25 20 33 32 25 20 20 18 16 22 Literature, Science, and the Arts 5 1 1 - - - - - - - Mathematics 11 16 22 33 31 23 26 34 51 63 Music 13 16 10 15 11 12 13 17 14 11 Performing Arts Entrepreneurship 1 1 - - - - - - - - Philosophy 13 24 23 28 25 16 19 14 15 27 Physics 3 3 3 4 3 3 2 1 7 5 Political Science 177 165 128 146 124 116 92 96 86 110 Portuguese 3 2 - 2 - 2 - 1 1 1 Psychology 292 290 273 261 253 238 249 251 219 214 Religious Studies 28 25 17 17 21 12 9 10 7 12 Russian 10 5 4 10 6 6 8 4 - 7 Social Justice - - - - - - - - - 2 Social Work 42 47 34 51 55 53 57 62 59 45 Sociology 59 79 56 61 83 78 79 71 58 46 Spanish 79 92 76 72 66 51 54 50 43 37 Speech and Hearing Science 52 51 61 55 64 65 64 42 47 63 Sport Studies - 2 30 40 35 32 35 30 15 31 Theatre Arts 43 50 30 36 37 26 41 32 29 26
Bachelor of Arts in Education - - - - - - - - 80 118 Bachelor of Business Administration 988 970 1,034 1,063 1,027 1,100 1,053 1,002 960 1,093
Accounting 115 133 150 152 146 130 154 139 109 140 Business Administration - - 2 - - - - - - - Business Analytics and Information Systems - - - - 24 77 96 107 133 160 Economics 53 63 82 90 65 64 58 56 63 53 Finance 380 347 366 376 414 461 407 377 349 410 Management 158 162 183 186 150 156 143 139 127 135 Management Information Systems 39 28 47 45 33 6 1 - - - Marketing 243 237 204 214 195 206 194 184 179 195
Bachelor of Fine Arts 85 69 89 91 77 88 67 57 67 61 Art 80 64 80 84 70 80 58 52 61 55 Dance 5 5 9 7 7 8 9 5 6 6
Bachelor of Liberal Studies 24 19 24 20 19 23 32 51 59 70 Bachelor of Music 36 35 18 27 31 24 27 29 25 28 Bachelor of Science 447 502 562 672 816 821 822 850 789 921
Actuarial Science 17 15 22 32 19 22 14 20 19 26 Anthropology 4 3 6 7 9 9 9 10 8 13 Applied Physics 1 2 2 1 1 - 1 3 1 2 Astronomy 5 5 7 4 8 4 5 5 4 6 Athletic Training 13 16 18 14 13 12 14 17 14 11 Biochemistry 19 7 18 23 29 25 18 24 19 25 Biology 75 72 71 59 62 46 65 69 66 75 Biomedical Sciences - - - - - - - - 1 5
continued
Information and Resource Management, Office of the Provost 114

Number of Degree Programs Completed by Objective and Program of Study (Fiscal Year), continued
Bachelor of Science, continued 2009-10 2010-11 2011-12 2012-13 2013-14 2014-15 2015-16 2016-17 2017-18 2018-19Chemistry 10 16 13 19 23 10 11 14 15 14 Computer Science 9 19 13 10 21 32 38 38 34 68 Criminology, Law and Justice - - - - - - - - 2 2 Economics 6 12 17 24 26 29 18 19 22 21 Elementary Education 1 1 - - - - - - - - Environmental Policy and Planning - - - - - 7 5 5 3 9 Environmental Sciences 12 12 19 17 17 16 14 18 21 20 Geography 11 12 11 9 4 3 6 2 6 9 Geoscience 3 10 10 5 13 13 10 9 11 10 Global Health Studies - - - - - - - 3 4 18 Human Physiology - - 13 117 166 183 230 209 195 200 Informatics - 1 3 6 4 2 3 4 3 5 Integrative Physiology 59 92 88 35 3 - 1 - - - International Relations - - - - 2 3 3 8 7 6 Journalism and Mass Communication 2 1 1 - - 3 1 6 3 5 Leisure Studies 24 28 32 87 153 128 58 16 7 - Mathematics 36 47 50 77 92 90 80 81 53 55 Microbiology 23 16 18 27 25 23 16 10 25 18 Neuroscience - - - - - - - - - 3 Physics 6 11 13 7 19 12 7 15 10 11 Political Science 21 18 19 16 14 13 9 8 7 7 Psychology 71 64 75 53 54 59 63 34 48 42 Science Education 12 11 14 7 12 6 5 6 6 11 Sociology 4 2 - 5 2 5 4 1 1 - Sport and Recreation Management - - - - - 43 69 111 113 116 Statistics 3 9 9 11 25 23 22 50 21 56 Therapeutic Recreation - - - - - - 23 35 40 52
Bachelor of Science in Engineering 276 288 262 295 341 447 392 427 419 457 Biomedical Engineering 76 56 47 56 69 87 92 102 99 129 Chemical Engineering 24 39 32 25 26 27 44 44 44 41 Civil Engineering 60 54 52 72 51 72 50 46 53 57 Computer Science and Engineering - - - - - - - 2 6 26 Electrical Engineering 31 38 36 45 68 87 77 78 55 54 Environmental Engineering - - - - - - - - 1 2 Industrial Engineering 15 29 32 31 44 44 38 36 59 46 Mechanical Engineering 70 72 63 66 83 130 91 119 102 102
Bachelor of Science in Medicine 55 47 42 61 43 48 58 47 50 52 Medical Laboratory Science 12 6 8 12 4 - 3 3 7 4 Nuclear Medicine Technology 2 2 - 2 1 4 4 7 6 7 Radiation Sciences 41 39 34 47 38 44 51 37 37 41
Bachelor of Science in Nursing 245 279 141 123 216 155 210 223 223 224 Nursing 142 150 82 82 143 79 130 135 144 136 Nursing-RN 103 129 59 41 73 76 80 88 79 88
continued
Information and Resource Management, Office of the Provost 115
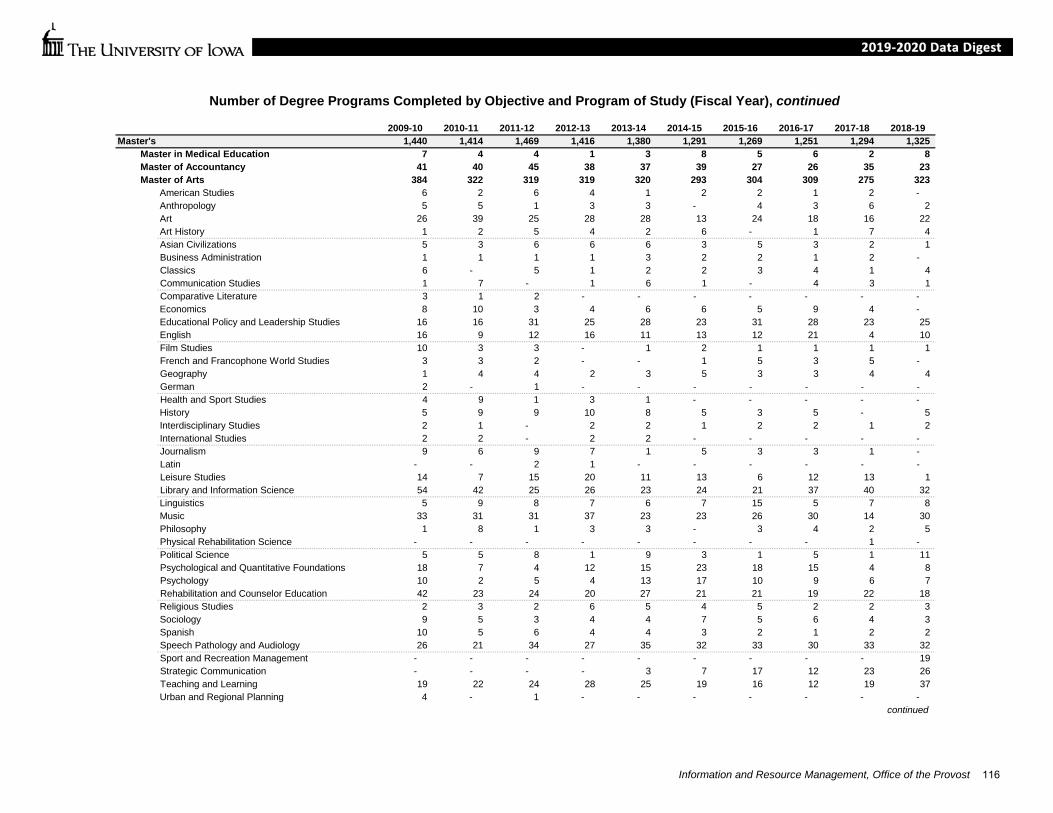
Number of Degree Programs Completed by Objective and Program of Study (Fiscal Year), continued
2009-10 2010-11 2011-12 2012-13 2013-14 2014-15 2015-16 2016-17 2017-18 2018-19Master's 1,440 1,414 1,469 1,416 1,380 1,291 1,269 1,251 1,294 1,325
Master in Medical Education 7 4 4 1 3 8 5 6 2 8 Master of Accountancy 41 40 45 38 37 39 27 26 35 23 Master of Arts 384 322 319 319 320 293 304 309 275 323
American Studies 6 2 6 4 1 2 2 1 2 - Anthropology 5 5 1 3 3 - 4 3 6 2 Art 26 39 25 28 28 13 24 18 16 22 Art History 1 2 5 4 2 6 - 1 7 4 Asian Civilizations 5 3 6 6 6 3 5 3 2 1 Business Administration 1 1 1 1 3 2 2 1 2 - Classics 6 - 5 1 2 2 3 4 1 4 Communication Studies 1 7 - 1 6 1 - 4 3 1 Comparative Literature 3 1 2 - - - - - - - Economics 8 10 3 4 6 6 5 9 4 - Educational Policy and Leadership Studies 16 16 31 25 28 23 31 28 23 25 English 16 9 12 16 11 13 12 21 4 10 Film Studies 10 3 3 - 1 2 1 1 1 1 French and Francophone World Studies 3 3 2 - - 1 5 3 5 - Geography 1 4 4 2 3 5 3 3 4 4 German 2 - 1 - - - - - - - Health and Sport Studies 4 9 1 3 1 - - - - - History 5 9 9 10 8 5 3 5 - 5 Interdisciplinary Studies 2 1 - 2 2 1 2 2 1 2 International Studies 2 2 - 2 2 - - - - - Journalism 9 6 9 7 1 5 3 3 1 - Latin - - 2 1 - - - - - - Leisure Studies 14 7 15 20 11 13 6 12 13 1 Library and Information Science 54 42 25 26 23 24 21 37 40 32 Linguistics 5 9 8 7 6 7 15 5 7 8 Music 33 31 31 37 23 23 26 30 14 30 Philosophy 1 8 1 3 3 - 3 4 2 5 Physical Rehabilitation Science - - - - - - - - 1 - Political Science 5 5 8 1 9 3 1 5 1 11 Psychological and Quantitative Foundations 18 7 4 12 15 23 18 15 4 8 Psychology 10 2 5 4 13 17 10 9 6 7 Rehabilitation and Counselor Education 42 23 24 20 27 21 21 19 22 18 Religious Studies 2 3 2 6 5 4 5 2 2 3 Sociology 9 5 3 4 4 7 5 6 4 3 Spanish 10 5 6 4 4 3 2 1 2 2 Speech Pathology and Audiology 26 21 34 27 35 32 33 30 33 32 Sport and Recreation Management - - - - - - - - - 19 Strategic Communication - - - - 3 7 17 12 23 26 Teaching and Learning 19 22 24 28 25 19 16 12 19 37 Urban and Regional Planning 4 - 1 - - - - - - -
continued
Information and Resource Management, Office of the Provost 116
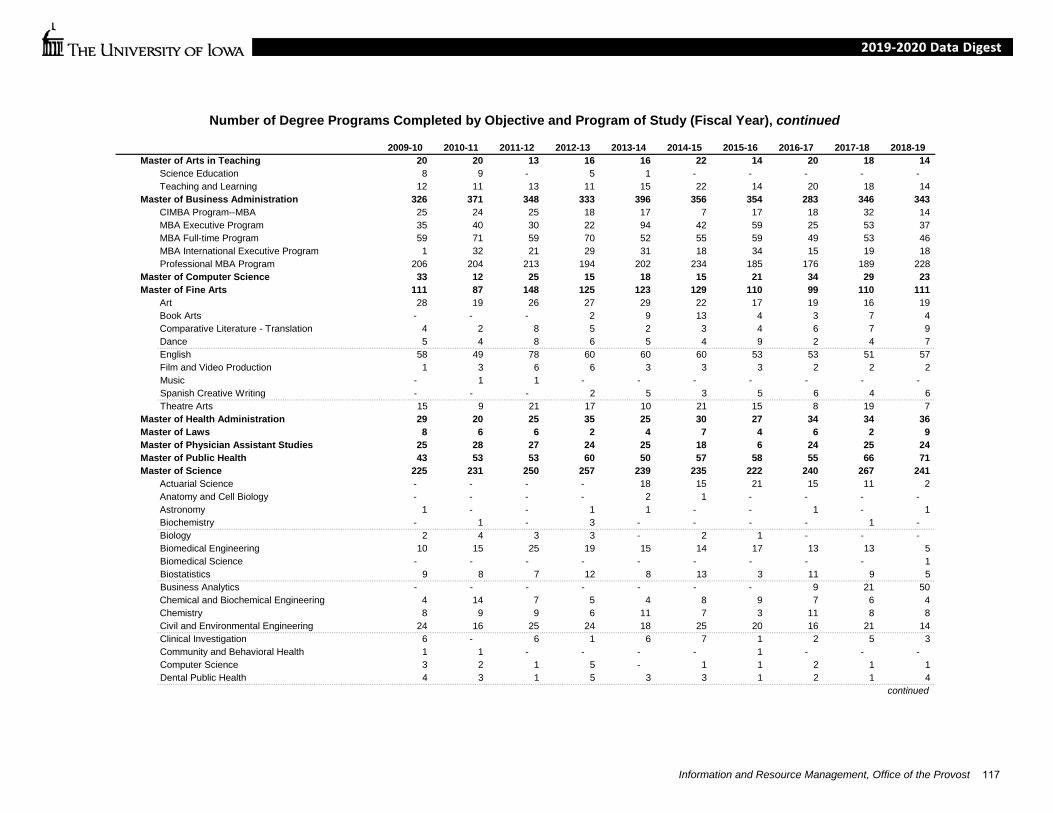
Number of Degree Programs Completed by Objective and Program of Study (Fiscal Year), continued
2009-10 2010-11 2011-12 2012-13 2013-14 2014-15 2015-16 2016-17 2017-18 2018-19Master of Arts in Teaching 20 20 13 16 16 22 14 20 18 14
Science Education 8 9 - 5 1 - - - - - Teaching and Learning 12 11 13 11 15 22 14 20 18 14
Master of Business Administration 326 371 348 333 396 356 354 283 346 343 CIMBA Program--MBA 25 24 25 18 17 7 17 18 32 14 MBA Executive Program 35 40 30 22 94 42 59 25 53 37 MBA Full-time Program 59 71 59 70 52 55 59 49 53 46 MBA International Executive Program 1 32 21 29 31 18 34 15 19 18 Professional MBA Program 206 204 213 194 202 234 185 176 189 228
Master of Computer Science 33 12 25 15 18 15 21 34 29 23 Master of Fine Arts 111 87 148 125 123 129 110 99 110 111
Art 28 19 26 27 29 22 17 19 16 19 Book Arts - - - 2 9 13 4 3 7 4 Comparative Literature - Translation 4 2 8 5 2 3 4 6 7 9 Dance 5 4 8 6 5 4 9 2 4 7 English 58 49 78 60 60 60 53 53 51 57 Film and Video Production 1 3 6 6 3 3 3 2 2 2 Music - 1 1 - - - - - - - Spanish Creative Writing - - - 2 5 3 5 6 4 6 Theatre Arts 15 9 21 17 10 21 15 8 19 7
Master of Health Administration 29 20 25 35 25 30 27 34 34 36 Master of Laws 8 6 6 2 4 7 4 6 2 9 Master of Physician Assistant Studies 25 28 27 24 25 18 6 24 25 24 Master of Public Health 43 53 53 60 50 57 58 55 66 71 Master of Science 225 231 250 257 239 235 222 240 267 241
Actuarial Science - - - - 18 15 21 15 11 2 Anatomy and Cell Biology - - - - 2 1 - - - - Astronomy 1 - - 1 1 - - 1 - 1 Biochemistry - 1 - 3 - - - - 1 - Biology 2 4 3 3 - 2 1 - - - Biomedical Engineering 10 15 25 19 15 14 17 13 13 5 Biomedical Science - - - - - - - - - 1 Biostatistics 9 8 7 12 8 13 3 11 9 5 Business Analytics - - - - - - - 9 21 50 Chemical and Biochemical Engineering 4 14 7 5 4 8 9 7 6 4 Chemistry 8 9 9 6 11 7 3 11 8 8 Civil and Environmental Engineering 24 16 25 24 18 25 20 16 21 14 Clinical Investigation 6 - 6 1 6 7 1 2 5 3 Community and Behavioral Health 1 1 - - - - 1 - - - Computer Science 3 2 1 5 - 1 1 2 1 1 Dental Public Health 4 3 1 5 3 3 1 2 1 4
continued
Information and Resource Management, Office of the Provost 117
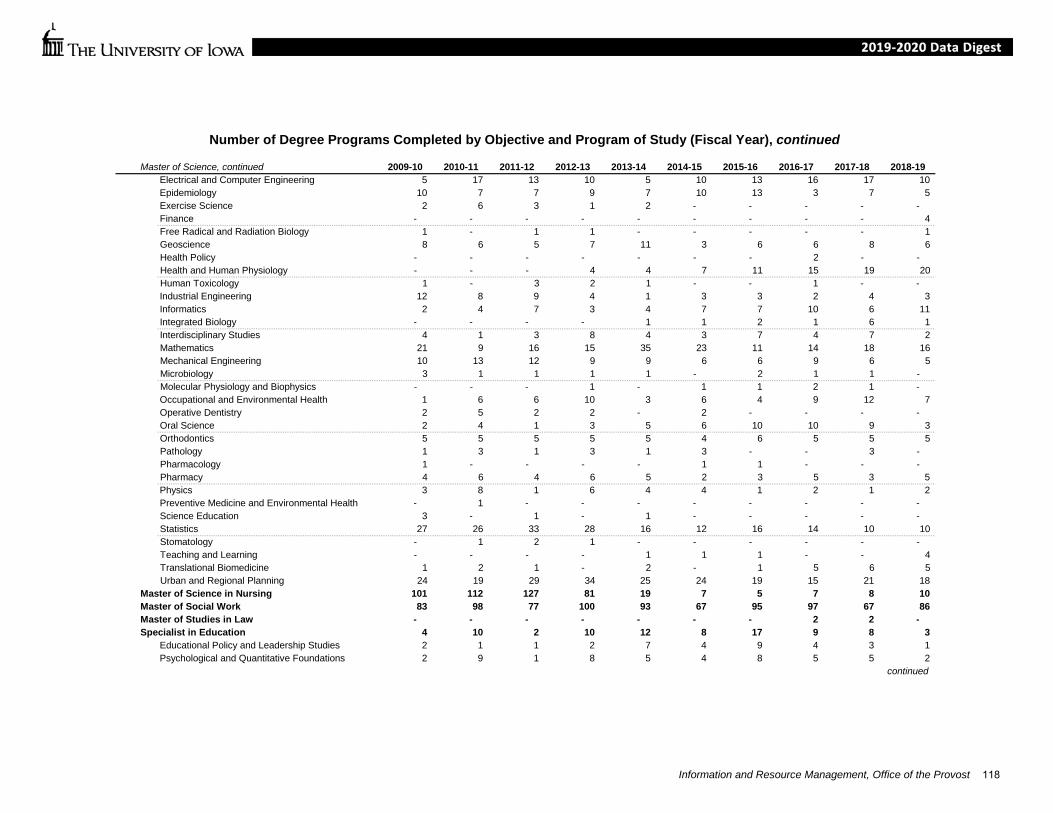
Number of Degree Programs Completed by Objective and Program of Study (Fiscal Year), continued
Master of Science, continued 2009-10 2010-11 2011-12 2012-13 2013-14 2014-15 2015-16 2016-17 2017-18 2018-19Electrical and Computer Engineering 5 17 13 10 5 10 13 16 17 10 Epidemiology 10 7 7 9 7 10 13 3 7 5 Exercise Science 2 6 3 1 2 - - - - - Finance - - - - - - - - - 4 Free Radical and Radiation Biology 1 - 1 1 - - - - - 1 Geoscience 8 6 5 7 11 3 6 6 8 6 Health Policy - - - - - - - 2 - - Health and Human Physiology - - - 4 4 7 11 15 19 20 Human Toxicology 1 - 3 2 1 - - 1 - - Industrial Engineering 12 8 9 4 1 3 3 2 4 3 Informatics 2 4 7 3 4 7 7 10 6 11 Integrated Biology - - - - 1 1 2 1 6 1 Interdisciplinary Studies 4 1 3 8 4 3 7 4 7 2 Mathematics 21 9 16 15 35 23 11 14 18 16 Mechanical Engineering 10 13 12 9 9 6 6 9 6 5 Microbiology 3 1 1 1 1 - 2 1 1 - Molecular Physiology and Biophysics - - - 1 - 1 1 2 1 - Occupational and Environmental Health 1 6 6 10 3 6 4 9 12 7 Operative Dentistry 2 5 2 2 - 2 - - - - Oral Science 2 4 1 3 5 6 10 10 9 3 Orthodontics 5 5 5 5 5 4 6 5 5 5 Pathology 1 3 1 3 1 3 - - 3 - Pharmacology 1 - - - - 1 1 - - - Pharmacy 4 6 4 6 5 2 3 5 3 5 Physics 3 8 1 6 4 4 1 2 1 2 Preventive Medicine and Environmental Health - 1 - - - - - - - - Science Education 3 - 1 - 1 - - - - - Statistics 27 26 33 28 16 12 16 14 10 10 Stomatology - 1 2 1 - - - - - - Teaching and Learning - - - - 1 1 1 - - 4 Translational Biomedicine 1 2 1 - 2 - 1 5 6 5 Urban and Regional Planning 24 19 29 34 25 24 19 15 21 18
Master of Science in Nursing 101 112 127 81 19 7 5 7 8 10 Master of Social Work 83 98 77 100 93 67 95 97 67 86 Master of Studies in Law - - - - - - - 2 2 - Specialist in Education 4 10 2 10 12 8 17 9 8 3
Educational Policy and Leadership Studies 2 1 1 2 7 4 9 4 3 1 Psychological and Quantitative Foundations 2 9 1 8 5 4 8 5 5 2
continued
Information and Resource Management, Office of the Provost 118
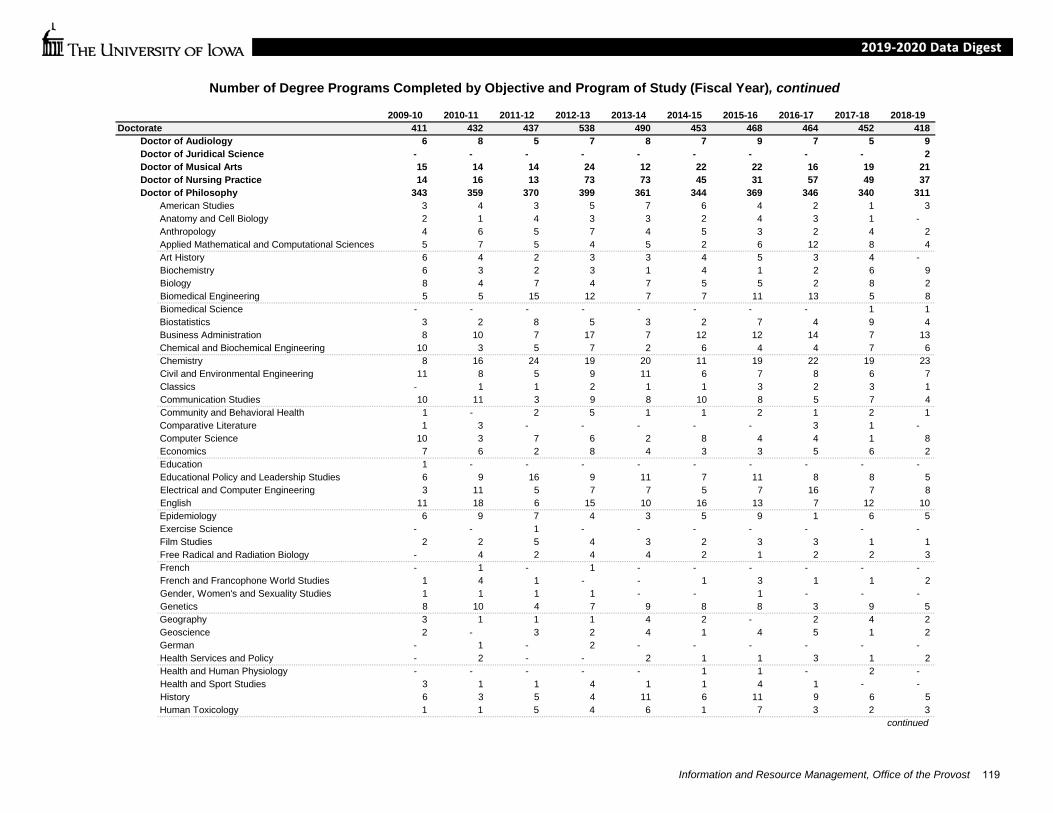
Number of Degree Programs Completed by Objective and Program of Study (Fiscal Year), continued
2009-10 2010-11 2011-12 2012-13 2013-14 2014-15 2015-16 2016-17 2017-18 2018-19Doctorate 411 432 437 538 490 453 468 464 452 418
Doctor of Audiology 6 8 5 7 8 7 9 7 5 9 Doctor of Juridical Science - - - - - - - - - 2 Doctor of Musical Arts 15 14 14 24 12 22 22 16 19 21 Doctor of Nursing Practice 14 16 13 73 73 45 31 57 49 37 Doctor of Philosophy 343 359 370 399 361 344 369 346 340 311
American Studies 3 4 3 5 7 6 4 2 1 3 Anatomy and Cell Biology 2 1 4 3 3 2 4 3 1 - Anthropology 4 6 5 7 4 5 3 2 4 2 Applied Mathematical and Computational Sciences 5 7 5 4 5 2 6 12 8 4 Art History 6 4 2 3 3 4 5 3 4 - Biochemistry 6 3 2 3 1 4 1 2 6 9 Biology 8 4 7 4 7 5 5 2 8 2 Biomedical Engineering 5 5 15 12 7 7 11 13 5 8 Biomedical Science - - - - - - - - 1 1 Biostatistics 3 2 8 5 3 2 7 4 9 4 Business Administration 8 10 7 17 7 12 12 14 7 13 Chemical and Biochemical Engineering 10 3 5 7 2 6 4 4 7 6 Chemistry 8 16 24 19 20 11 19 22 19 23 Civil and Environmental Engineering 11 8 5 9 11 6 7 8 6 7 Classics - 1 1 2 1 1 3 2 3 1 Communication Studies 10 11 3 9 8 10 8 5 7 4 Community and Behavioral Health 1 - 2 5 1 1 2 1 2 1 Comparative Literature 1 3 - - - - - 3 1 - Computer Science 10 3 7 6 2 8 4 4 1 8 Economics 7 6 2 8 4 3 3 5 6 2 Education 1 - - - - - - - - - Educational Policy and Leadership Studies 6 9 16 9 11 7 11 8 8 5 Electrical and Computer Engineering 3 11 5 7 7 5 7 16 7 8 English 11 18 6 15 10 16 13 7 12 10 Epidemiology 6 9 7 4 3 5 9 1 6 5 Exercise Science - - 1 - - - - - - - Film Studies 2 2 5 4 3 2 3 3 1 1 Free Radical and Radiation Biology - 4 2 4 4 2 1 2 2 3 French - 1 - 1 - - - - - - French and Francophone World Studies 1 4 1 - - 1 3 1 1 2 Gender, Women's and Sexuality Studies 1 1 1 1 - - 1 - - - Genetics 8 10 4 7 9 8 8 3 9 5 Geography 3 1 1 1 4 2 - 2 4 2 Geoscience 2 - 3 2 4 1 4 5 1 2 German - 1 - 2 - - - - - - Health Services and Policy - 2 - - 2 1 1 3 1 2 Health and Human Physiology - - - - - 1 1 - 2 - Health and Sport Studies 3 1 1 4 1 1 4 1 - - History 6 3 5 4 11 6 11 9 6 5 Human Toxicology 1 1 5 4 6 1 7 3 2 3
continued
Information and Resource Management, Office of the Provost 119
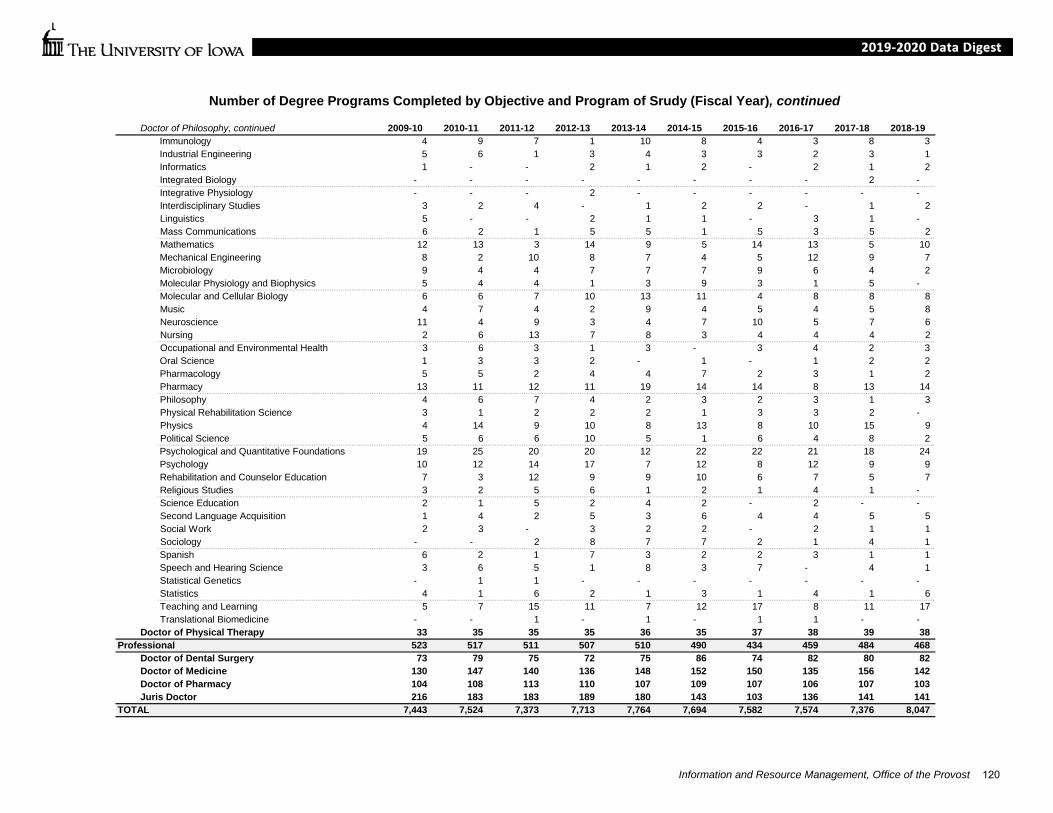
Number of Degree Programs Completed by Objective and Program of Srudy (Fiscal Year), continued
Doctor of Philosophy, continued 2009-10 2010-11 2011-12 2012-13 2013-14 2014-15 2015-16 2016-17 2017-18 2018-19Immunology 4 9 7 1 10 8 4 3 8 3 Industrial Engineering 5 6 1 3 4 3 3 2 3 1 Informatics 1 - - 2 1 2 - 2 1 2 Integrated Biology - - - - - - - - 2 - Integrative Physiology - - - 2 - - - - - - Interdisciplinary Studies 3 2 4 - 1 2 2 - 1 2 Linguistics 5 - - 2 1 1 - 3 1 - Mass Communications 6 2 1 5 5 1 5 3 5 2 Mathematics 12 13 3 14 9 5 14 13 5 10 Mechanical Engineering 8 2 10 8 7 4 5 12 9 7 Microbiology 9 4 4 7 7 7 9 6 4 2 Molecular Physiology and Biophysics 5 4 4 1 3 9 3 1 5 - Molecular and Cellular Biology 6 6 7 10 13 11 4 8 8 8 Music 4 7 4 2 9 4 5 4 5 8 Neuroscience 11 4 9 3 4 7 10 5 7 6 Nursing 2 6 13 7 8 3 4 4 4 2 Occupational and Environmental Health 3 6 3 1 3 - 3 4 2 3 Oral Science 1 3 3 2 - 1 - 1 2 2 Pharmacology 5 5 2 4 4 7 2 3 1 2 Pharmacy 13 11 12 11 19 14 14 8 13 14 Philosophy 4 6 7 4 2 3 2 3 1 3 Physical Rehabilitation Science 3 1 2 2 2 1 3 3 2 - Physics 4 14 9 10 8 13 8 10 15 9 Political Science 5 6 6 10 5 1 6 4 8 2 Psychological and Quantitative Foundations 19 25 20 20 12 22 22 21 18 24 Psychology 10 12 14 17 7 12 8 12 9 9 Rehabilitation and Counselor Education 7 3 12 9 9 10 6 7 5 7 Religious Studies 3 2 5 6 1 2 1 4 1 - Science Education 2 1 5 2 4 2 - 2 - - Second Language Acquisition 1 4 2 5 3 6 4 4 5 5 Social Work 2 3 - 3 2 2 - 2 1 1 Sociology - - 2 8 7 7 2 1 4 1 Spanish 6 2 1 7 3 2 2 3 1 1 Speech and Hearing Science 3 6 5 1 8 3 7 - 4 1 Statistical Genetics - 1 1 - - - - - - - Statistics 4 1 6 2 1 3 1 4 1 6 Teaching and Learning 5 7 15 11 7 12 17 8 11 17 Translational Biomedicine - - 1 - 1 - 1 1 - -
Doctor of Physical Therapy 33 35 35 35 36 35 37 38 39 38 Professional 523 517 511 507 510 490 434 459 484 468
Doctor of Dental Surgery 73 79 75 72 75 86 74 82 80 82 Doctor of Medicine 130 147 140 136 148 152 150 135 156 142 Doctor of Pharmacy 104 108 113 110 107 109 107 106 107 103 Juris Doctor 216 183 183 189 180 143 103 136 141 141
TOTAL 7,443 7,524 7,373 7,713 7,764 7,694 7,582 7,574 7,376 8,047
Information and Resource Management, Office of the Provost 120

Additional Facts & Figures
Library Statistics .................................................................................................. 122 Association of Research Libraries Rankings, University of Iowa Libraries ........... 123 Land and Facilities .............................................................................................. 124 Fall Classroom/Lab Utilization Summary ............................................................. 125
121
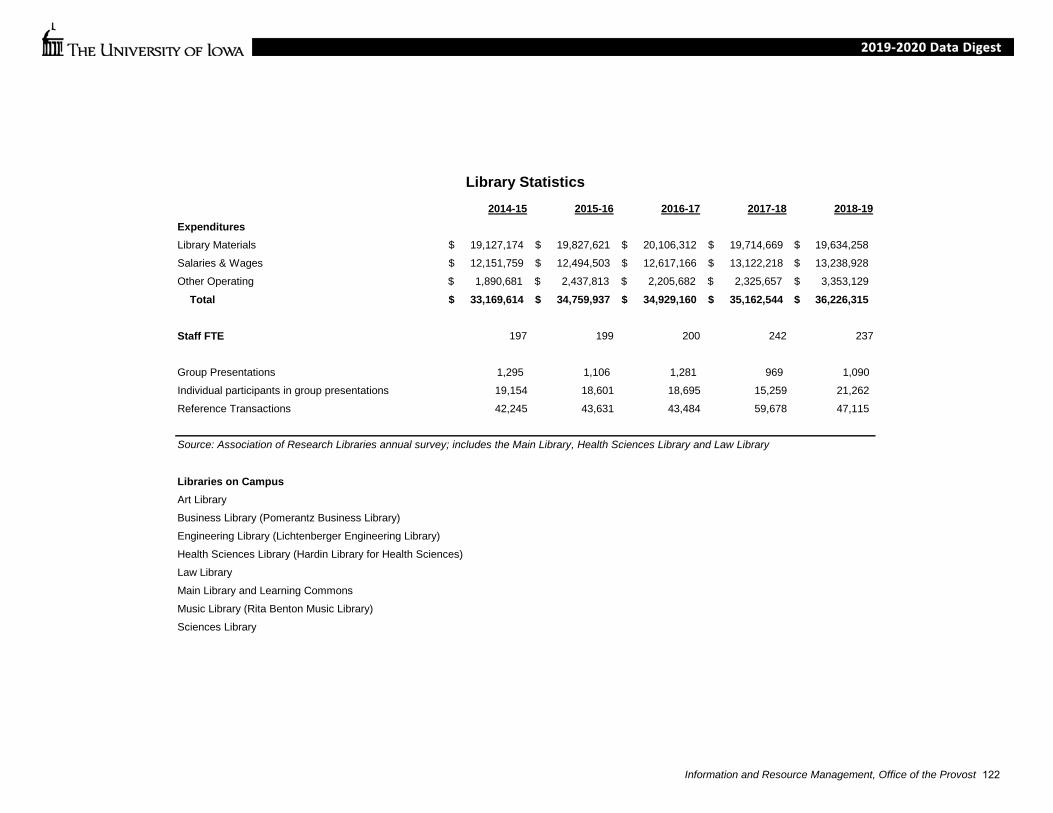
2014-15 2015-16 2016-17 2017-18 2018-19ExpendituresLibrary Materials 19,127,174$ 19,827,621$ 20,106,312$ 19,714,669$ $ 19,634,258 Salaries & Wages 12,151,759$ 12,494,503$ 12,617,166$ 13,122,218$ $ 13,238,928 Other Operating $ 1,890,681 $ 2,437,813 $ 2,205,682 $ 2,325,657 $ 3,353,129
Total 33,169,614$ 34,759,937$ 34,929,160$ 35,162,544$ $ 36,226,315
Staff FTE 197 199 200 242 237
Group Presentations 1,295 1,106 1,281 969 1,090 Individual participants in group presentations 19,154 18,601 18,695 15,259 21,262 Reference Transactions 42,245 43,631 43,484 59,678 47,115
Libraries on CampusArt LibraryBusiness Library (Pomerantz Business Library)Engineering Library (Lichtenberger Engineering Library)Health Sciences Library (Hardin Library for Health Sciences)Law LibraryMain Library and Learning CommonsMusic Library (Rita Benton Music Library)Sciences Library
Library Statistics
Source: Association of Research Libraries annual survey; includes the Main Library, Health Sciences Library and Law Library
Information and Resource Management, Office of the Provost 122
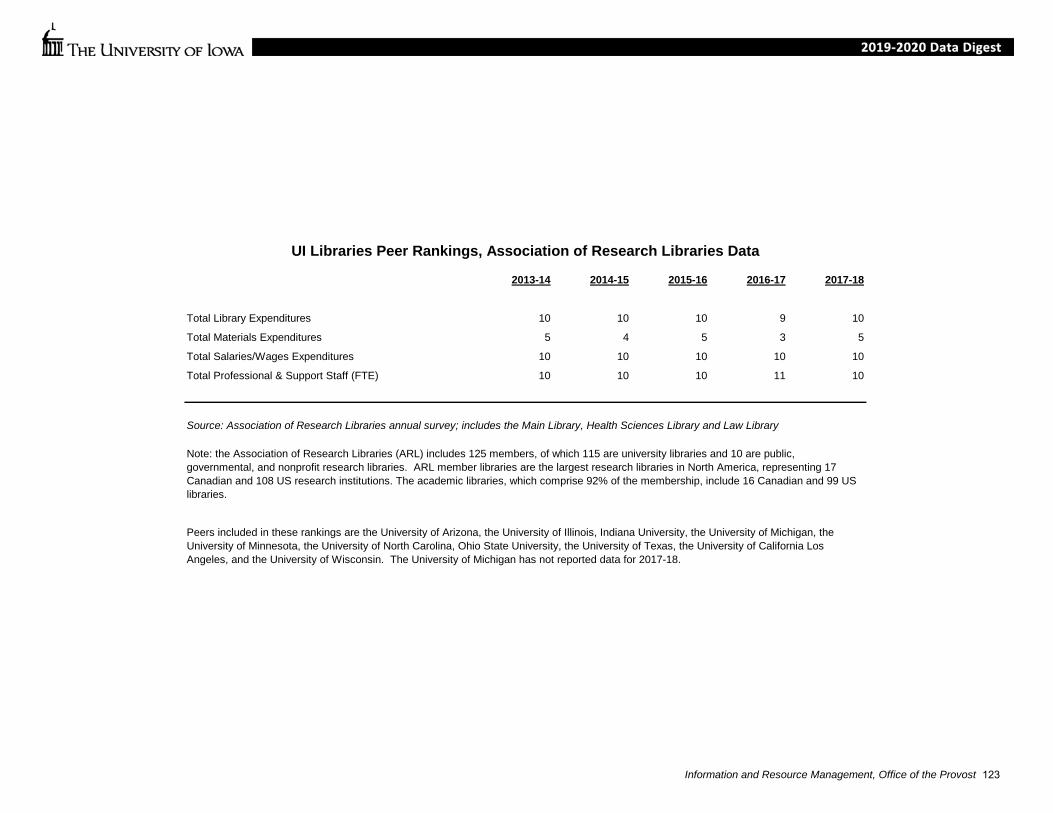
2013-14 2014-15 2015-16 2016-17 2017-18
Total Library Expenditures 10 10 10 9 10
Total Materials Expenditures 5 4 5 3 5
Total Salaries/Wages Expenditures 10 10 10 10 10
Total Professional & Support Staff (FTE) 10 10 10 11 10
UI Libraries Peer Rankings, Association of Research Libraries Data
Note: the Association of Research Libraries (ARL) includes 125 members, of which 115 are university libraries and 10 are public, governmental, and nonprofit research libraries. ARL member libraries are the largest research libraries in North America, representing 17 Canadian and 108 US research institutions. The academic libraries, which comprise 92% of the membership, include 16 Canadian and 99 US libraries.
Peers included in these rankings are the University of Arizona, the University of Illinois, Indiana University, the University of Michigan, the University of Minnesota, the University of North Carolina, Ohio State University, the University of Texas, the University of California Los Angeles, and the University of Wisconsin. The University of Michigan has not reported data for 2017-18.
Source: Association of Research Libraries annual survey; includes the Main Library, Health Sciences Library and Law Library
Information and Resource Management, Office of the Provost 123

Campus Areas Acres Assignable Square Feet of Building Space by Program
Main Campus 1,428.2 Academic and Administrative Space 5,076,113UI Research Park / Oakdale Campus 543.3 Instruction 999,869Iowa Lakeside Laboratory 128.2 Research 1,535,206Off-Campus 0.4 Public Service 22,377
UI Acreage: 2,100.1 Acres Academic Support 1,110,753Libraries 529,769Student Services 139,329
Macbride Nature Center (Land Lease) 397 Institutional Support 409,349Operations and Maintenance 329,461
UI Leased Acreage: 397 AcresAuxiliaries 3,047,340
Intercollegiate Athletics 755,225Residential 1,429,907Student Union 214,078Recreation 468,970Other Auxiliary Enterprises 179,160
Parking Garages 1,519,068 1,519,068
Hospital 3,296,530 3,296,530
Independent Operations 301,561 301,561 (Non-Institutional Activities)
Total Sq. Ft: 13,240,611Source: Campus Planning and Space Management
Land and Facilities
Instruction20%
Research30%
Academic Support
22%
Libraries10%
Institutional Support
8%
Operations and Maintenance
7%
Student Services & Pub Svc3%
Academic and Administrative Space by Program
Intercollegiate Athletics
25%
Residential47%
Student Union7%
Recreation15%
Other Auxiliary Enterprises
6%
Auxiliary Space by Program
Information and Resource Management, Office of the Provost 124

Fall 2018 Classroom/Lab Utilization SummaryClassrooms
University Programmed Total Labs1 Number of rooms 264 71 335 169
2 Number of student-stations (seats) 13,391 4,271 17,662 4,898
3 Available room periods 13,200 3,550 16,750 8,450
4 Available student-station periods 669,550 213,550 883,100 244,900
5 Room periods used 7,796.4 695.4 8,491.8 2,675.8
6 Percentage utilization of room periods 59.06% 19.59% 50.70% 31.67%
7 Average room periods used per room (hrs) 29.532 9.794 25.349 15.833
8 Student-station periods used (daytime) 267,972 29,573 297,545 56,340
9 Percentage utilization of available student-station periods 40.02% 13.85% 33.69% 23.01%
10 Average student hours per week per student station 20.011 6.924 16.847 11.503
11 Percentage of stations in use when room occupied 62.29% 63.58% 62.94% 63.42%
12 Square feet of space included (excludes service rooms) 220,654 72,386 293,040 192,943
13 Average square feet by student-station 16.48 16.95 16.59 39.39Source: Space Utilization Report, Office of the Registrar
Notes:1 Number of rooms broken down by ownership and category2 Number of student stations (seats) by ownership and category3 50 room periods available for assignment in any single room in one week
(10 periods per day (8:30a-6:20 pm) x 5 days per week = 50 periods * Number of rooms)4 (Number of student stations * 50 periods) by ownership and category5 Total contact hours spent in all rooms by ownership and category6 Actual number of contact hours used to the total periods available in each category
(Room Periods of Use / (Number of Rooms * Total Class Periods per Week))7 Average number of periods used out of the total number of available periods for each room in each category
(Room Periods Used / Number of Rooms)8 Total contact hours for all students in all rooms in each category (daytime)9 When a room is used, the percentage of stations (seats) being used
(Total Student Station Periods Occupied / (Available Student Stations * 50 Room Periods))10 On average, the length of time a station (seat) is being used, based on contact hours, for each station in each category11 Number of stations used (occupied) when a room is in use to the number of overall stations available
(Total Possible Student Stations Periods Occupied / Available Stations When Room Used)12 Total square footage by ownership and category13 (Total square feet / Number of student-stations) by ownership and category
Information and Resource Management, Office of the Provost 125

Peer Comparisons
University of Iowa Peer Comparison Groups ................................................ 127 Selected Peer Comparison Reports .............................................................. 128
126
Peer Comparisons
Information and Resource Management, Office of the Provost
University of Iowa Peer/Comparison Groups The university often benchmarks itself against its peers and other related institutions. University of Iowa peer and comparison groups include:
Association of American Universities (AAU): The University of Iowa is a member of the Association of American Universities (https://www.aau.edu/), an organization of 65 universities recognized for their excellence in research.
Big Ten Conference: The University of Iowa is a member of the Big Ten Athletic Conference and the Big Ten Academic Alliance (formerly the Committee on Institutional Cooperation [CIC], https://www.btaa.org/home). The 14 members of the Big Ten are: • University of Illinois, Urbana (public) ........................................................................................................................................................................... http://www.illinois.edu/ • Indiana University, Bloomington (public) ............................................................................................................................. http://www.indiana.edu/ • University of Iowa, Iowa City (public) .......................................................................................................................................................................... http://www.uiowa.edu/ • University of Maryland, College Park (public) ................................................................................................................................................................ http://www.umd.edu/ • University of Michigan, Ann Arbor (public) .................................................................................................................................................................. http://www.umich.edu/ • Michigan State University, East Lansing (public) ........................................................................................................................................................... http://www.msu.edu/ • University of Minnesota, Minneapolis (public) ........................................................................................................................................................ http://twin-cities.umn.edu/ • University of Nebraska, Lincoln (public) ........................................................................................................................................................................... http://www.unl.edu/ • Northwestern University (private) ..................................................................................................................................................................... http://www.northwestern.edu/ • The Ohio State University, Main Campus (public)........................................................................................................................................................... http://www.osu.edu/ • Pennsylvania State University, Main Campus (public) .................................................................................................................................................... http://www.psu.edu/ • Purdue University, Main Campus (public) .................................................................................................................................................................. http://www.purdue.edu/ • Rutgers University, New Brunswick (public) ................................................................................................................................................ http://newbrunswick.rutgers.edu/ • University of Wisconsin, Madison (public) ...................................................................................................................................................................... http://www.wisc.edu/
UI Peer Group: Because the members of the Big Ten and CIC differ from one another in a variety of ways (for example, some campuses have large health sciences centers and others do not), the University of Iowa regularly uses an "official UI Peer Group" to benchmark itself against other, similar, institutions. The university formed the official UI Peer Group in the mid-1980s, and the Board of Regents, State of Iowa approved it. It included all of the public universities in the Big Ten at the time (Penn State was not yet a member), except for Michigan State and Purdue, which did not have comparable health science centers. In addition, four comparable campuses from various geographical regions of the country were added. The 10 public university members of the official UI Peer Group are: • University of Arizona, Tucson.................................................................................................................................................................................... http://www.arizona.edu/ • University of California, Los Angeles .............................................................................................................................................................................. http://www.ucla.edu/ • University of Illinois, Urbana ........................................................................................................................................................................................ http://www.illinois.edu/ • Indiana University, Bloomington ................................................................................................................................................................................ http://www.indiana.edu/ • University of Michigan, Ann Arbor ............................................................................................................................................................................... http://www.umich.edu/ • University of Minnesota, Minneapolis ..................................................................................................................................................................... http://twin-cities.umn.edu/ • University of North Carolina, Chapel Hill ......................................................................................................................................................................... http://www.unc.edu/ • The Ohio State University, Main Campus ....................................................................................................................................................................... http://www.osu.edu/ • University of Texas, Austin ......................................................................................................................................................................................... http://www.utexas.edu/ • University of Wisconsin, Madison ................................................................................................................................................................................... http://www.wisc.edu/
127

Peer Comparisons
Information and Resource Management, Office of the Provost
Regents Comparison Group: In some reports, at the request of the Board of Regents, State of Iowa, the University of Iowa provides comparison benchmarking data for a group that includes all of the Big Ten public universities plus the four non-Big Ten universities that are part of the official UI Peer Group: Arizona, UCLA, North Carolina, and Texas.
Selected Peer Comparison Reports Customized IPEDS Data Feedback Reports .......................................................................................... https://provost.uiowa.edu/data-and-reports/ipeds-data-feedback-reports
The Top American Research Universities, Annual Report ......................................................................................................................... https://mup.umass.edu/Top-Universities
University of Iowa 2018-19 U.S. News & World Report Rankings Report
(Undergraduate) ..............................................................................https://provost.uiowa.edu/sites/provost.uiowa.edu/files/2021-02/SUI_Rankings_Report_2018-19_0.pdf
128

Institutional Data Resources
Reports to the Board of Regents, State of Iowa ............................................ 130 Other Resources ........................................................................................... 130
129

Institutional Data Resources
Information and Resource Management, Office of the Provost
Selected Reports to the Board of Regents, State of Iowa Note: Many of the reports submitted to the Board of Regents, State of Iowa can be accessed via the Board’s list of reports at http://www.regents.iowa.gov/Reports/reports.html. Where links below lead to that list, note that you may need to scroll down the list to reach the desired report. These reports are submitted annually unless otherwise noted.
Comprehensive Fiscal Report ................................................................................................................................ http://www.iowaregents.edu/reports/page-of-reports/#section_c Comprehensive Human Resources Report (includes information about faculty salaries, including peer
comparisons) .................................................................................................................................................. http://www.iowaregents.edu/reports/page-of-reports/#section_c Diversity Report ..................................................................................................................................................... http://www.iowaregents.edu/reports/page-of-reports/#section_d Economic Development and Technology Transfer ................................................................................................ http://www.iowaregents.edu/reports/page-of-reports/#section_e Enrollment Report .................................................................................................................................................. http://www.iowaregents.edu/reports/page-of-reports/#section_e Graduation and Retention Rates ........................................................................................................................... http://www.iowaregents.edu/reports/page-of-reports/#section_g Tenure Report ......................................................................................................................................................... http://www.iowaregents.edu/reports/page-of-reports/#section_t
Most recent Tenure Report detail tables for SUI .......................................................................................................................... http://provost.uiowa.edu/tenure-report-tables
Other Resources About the University (includes summary facts, history, rankings, etc.) ....................................................................................... http://www.uiowa.edu/homepage/about-university Audited Financial Report (annual) .................................................................................................................................................................. http://afr.fo.uiowa.edu/annual-reports Census Report (official headcounts as of census date each session) ........................................................................................................ http://registrar.uiowa.edu/census-report Common Data Set (a survey completed annually by many participating higher education data providers) ................https://provost.uiowa.edu/data-and-reports/common-data-set Funding Watch (monthly YTD external funding proposal and award data) ..................................................................................................... https://uiris.uiowa.edu/funding_watch Profile of Students Enrolled (various enrollment statistics and key demographics, by session) ............................................... https://registrar.uiowa.edu/profile-students-enrolled University Budget (fiscal year) .................................................................................................................................................................. http://fmb.fo.uiowa.edu/university-budget
130

Definitions & Notes
Definitions ..................................................................................................... 132 Notes ............................................................................................................ 134 Reporting Variations ..................................................................................... 135 Version Notes ............................................................................................... 138
131
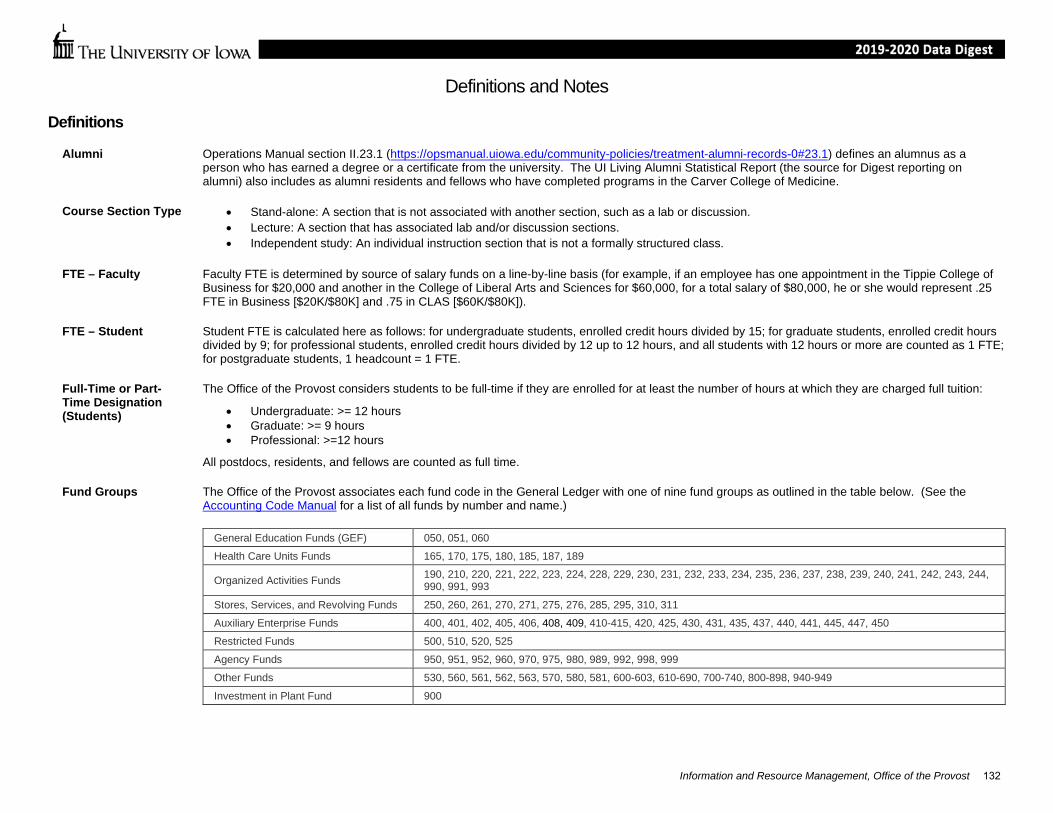
Definitions and Notes
Information and Resource Management, Office of the Provost
Definitions
Alumni Operations Manual section II.23.1 (https://opsmanual.uiowa.edu/community-policies/treatment-alumni-records-0#23.1) defines an alumnus as a person who has earned a degree or a certificate from the university. The UI Living Alumni Statistical Report (the source for Digest reporting on alumni) also includes as alumni residents and fellows who have completed programs in the Carver College of Medicine.
Course Section Type • Stand-alone: A section that is not associated with another section, such as a lab or discussion.• Lecture: A section that has associated lab and/or discussion sections.• Independent study: An individual instruction section that is not a formally structured class.
FTE – Faculty Faculty FTE is determined by source of salary funds on a line-by-line basis (for example, if an employee has one appointment in the Tippie College of Business for $20,000 and another in the College of Liberal Arts and Sciences for $60,000, for a total salary of $80,000, he or she would represent .25 FTE in Business [$20K/$80K] and .75 in CLAS [$60K/$80K]).
FTE – Student Student FTE is calculated here as follows: for undergraduate students, enrolled credit hours divided by 15; for graduate students, enrolled credit hours divided by 9; for professional students, enrolled credit hours divided by 12 up to 12 hours, and all students with 12 hours or more are counted as 1 FTE; for postgraduate students, 1 headcount = 1 FTE.
Full-Time or Part-Time Designation (Students)
The Office of the Provost considers students to be full-time if they are enrolled for at least the number of hours at which they are charged full tuition:
• Undergraduate: >= 12 hours• Graduate: >= 9 hours• Professional: >=12 hours
All postdocs, residents, and fellows are counted as full time.
Fund Groups The Office of the Provost associates each fund code in the General Ledger with one of nine fund groups as outlined in the table below. (See the Accounting Code Manual for a list of all funds by number and name.)
General Education Funds (GEF) 050, 051, 060 Health Care Units Funds 165, 170, 175, 180, 185, 187, 189
Organized Activities Funds 190, 210, 220, 221, 222, 223, 224, 228, 229, 230, 231, 232, 233, 234, 235, 236, 237, 238, 239, 240, 241, 242, 243, 244, 990, 991, 993
Stores, Services, and Revolving Funds 250, 260, 261, 270, 271, 275, 276, 285, 295, 310, 311 Auxiliary Enterprise Funds 400, 401, 402, 405, 406, 408, 409, 410-415, 420, 425, 430, 431, 435, 437, 440, 441, 445, 447, 450 Restricted Funds 500, 510, 520, 525 Agency Funds 950, 951, 952, 960, 970, 975, 980, 989, 992, 998, 999 Other Funds 530, 560, 561, 562, 563, 570, 580, 581, 600-603, 610-690, 700-740, 800-898, 940-949
Investment in Plant Fund 900
132

Definitions and Notes
Information and Resource Management, Office of the Provost
Professional Students
Professional student counts include "first professional" (those pursuing a DDS, JD, MD, or PharmD degree) only. Other students enrolled in the professional colleges are counted in other categories (e.g., Master of Laws [LLM] students in Law are counted as graduate students).
133

Definitions and Notes
Information and Resource Management, Office of the Provost
Notes
1 Enrollment Data, Source of
Student enrollment (headcount and FTE) data prior to fall 2013 are pulled from the Registrar’s data warehouse. In fall 2013 and later they are pulled from the MAUI student information system.
2 Postgraduate Student Headcounts, Fall 2011
In fall 2011, 288 postgraduate students (residents) were left out of census-date reporting due to a change in coding; they are included in Data Digest reports.
3 Iowa Intensive English Program (IIEP)
Students enrolled exclusively in Iowa Intensive English Program (IIEP) courses are no longer included in any student headcounts (they were included in the unclassified undergraduate counts in previous versions of the Data Digest). This change was made in the university's census-date reporting beginning with fall 2017. See the table below for the counts that were previously included.
IIEP Fall Student Headcounts 2008 2009 2010 2011 2012 2013 2014 2015 2016
Male 29 15 23 22 48 43 41 30 25
Female 31 25 25 14 30 26 24 27 21
Total 60 40 48 36 78 69 65 57 46
4 Race/ Ethnicity Reporting
Race/ethnicity categories and reporting methodology represent federal reporting categories and methodology. A major change in data collection and reporting occurred in 2009 for students and in 2010 for faculty; data before and after are not directly comparable. Prior to the change, individuals were only able to indicate a single race/ethnic category. After the change, revised federal guidelines allowed individuals to indicate multiple race/ethnic identities. These guidelines stipulate that all domestic students or faculty who indicate Hispanic ethnicity should be reported as Hispanic, regardless of other racial information provided. Non-Hispanic domestic students or faculty who indicate more than one race are reported in the "two or more races" category.
5 Gender Reporting In spring 2016 the university began its Inclusive Student Records initiative, which provides new functionality allowing students to designate and use identifiers (preferred first name, sex, gender, and pronouns of reference) in many university student records systems. Effective fall 2016 (20163), the possible values for "gender" (now "sex" in university systems) changed from "male," "female," or "transgender" to "male," "female," or "prefer not to answer." (In addition to and distinct from the value selected for "sex," students now have the option to identify one or more gender identity values.) In Digest reports, "Prefer Not to Answer/Other" includes all students who chose not to identify their sex as either male or female, whether by selecting "transgender" (or not reporting) in fall 2013 through fall 2015, or by selecting "prefer not to answer" starting in fall 2016.
134
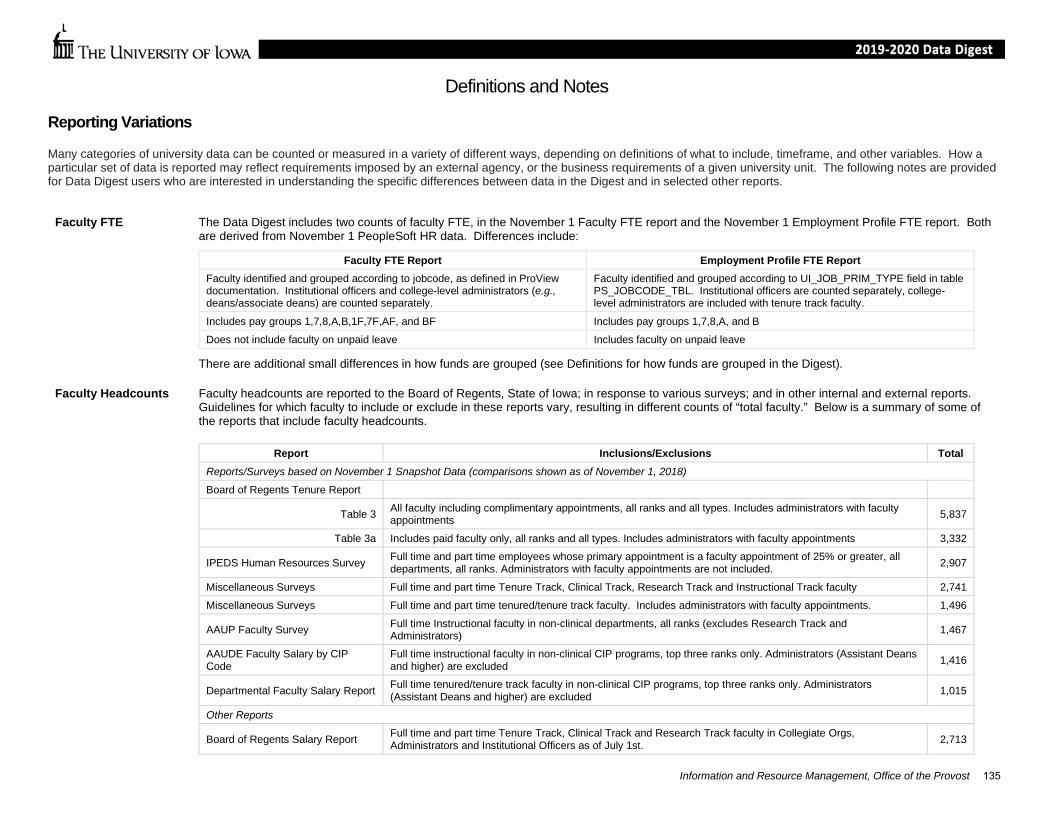
Definitions and Notes
Information and Resource Management, Office of the Provost
Reporting Variations
Many categories of university data can be counted or measured in a variety of different ways, depending on definitions of what to include, timeframe, and other variables. How a particular set of data is reported may reflect requirements imposed by an external agency, or the business requirements of a given university unit. The following notes are provided for Data Digest users who are interested in understanding the specific differences between data in the Digest and in selected other reports.
Faculty FTE The Data Digest includes two counts of faculty FTE, in the November 1 Faculty FTE report and the November 1 Employment Profile FTE report. Both are derived from November 1 PeopleSoft HR data. Differences include:
Faculty FTE Report Employment Profile FTE Report Faculty identified and grouped according to jobcode, as defined in ProView documentation. Institutional officers and college-level administrators (e.g., deans/associate deans) are counted separately.
Faculty identified and grouped according to UI_JOB_PRIM_TYPE field in table PS_JOBCODE_TBL. Institutional officers are counted separately, college-level administrators are included with tenure track faculty.
Includes pay groups 1,7,8,A,B,1F,7F,AF, and BF Includes pay groups 1,7,8,A, and B Does not include faculty on unpaid leave Includes faculty on unpaid leave
There are additional small differences in how funds are grouped (see Definitions for how funds are grouped in the Digest).
Faculty Headcounts Faculty headcounts are reported to the Board of Regents, State of Iowa; in response to various surveys; and in other internal and external reports. Guidelines for which faculty to include or exclude in these reports vary, resulting in different counts of “total faculty.” Below is a summary of some of the reports that include faculty headcounts.
Report Inclusions/Exclusions Total Reports/Surveys based on November 1 Snapshot Data (comparisons shown as of November 1, 2018)
Board of Regents Tenure Report
Table 3 All faculty including complimentary appointments, all ranks and all types. Includes administrators with faculty appointments 5,837
Table 3a Includes paid faculty only, all ranks and all types. Includes administrators with faculty appointments 3,332
IPEDS Human Resources Survey Full time and part time employees whose primary appointment is a faculty appointment of 25% or greater, all departments, all ranks. Administrators with faculty appointments are not included. 2,907
Miscellaneous Surveys Full time and part time Tenure Track, Clinical Track, Research Track and Instructional Track faculty 2,741 Miscellaneous Surveys Full time and part time tenured/tenure track faculty. Includes administrators with faculty appointments. 1,496
AAUP Faculty Survey Full time Instructional faculty in non-clinical departments, all ranks (excludes Research Track and Administrators) 1,467
AAUDE Faculty Salary by CIP Code
Full time instructional faculty in non-clinical CIP programs, top three ranks only. Administrators (Assistant Deans and higher) are excluded 1,416
Departmental Faculty Salary Report Full time tenured/tenure track faculty in non-clinical CIP programs, top three ranks only. Administrators (Assistant Deans and higher) are excluded 1,015
Other Reports
Board of Regents Salary Report Full time and part time Tenure Track, Clinical Track and Research Track faculty in Collegiate Orgs, Administrators and Institutional Officers as of July 1st. 2,713
135

Definitions and Notes
Information and Resource Management, Office of the Provost
Equal Opportunity and Diversity/Chief Diversity Office Reports
Affirmative Action Plan: Excludes administrators (including DEO's); Includes visiting faculty and faculty fellows 2,968
Board of Regents: Same as above, but excludes faculty with less than 50% appointments 2,732
The Data Digest 10-year faculty headcount reports (by faculty category, gender, and race/ethnicity) are based on the Board of Regents Tenure Report, with all faculty included. The Digest also includes the most recent November 1 Employment Profile Headcount Report, which includes faculty. The Employment Profile is prepared by Human Resources from PeopleSoft HR data, and uses slightly different criteria to identify and group faculty, as noted under Note 2, above.
Graduate Student Counts, Master’s vs. Advanced
The Headcount and Full-Time Equivalent (FTE) Report in the Student Profile breaks down graduate student headcounts into "master's" and "advanced." The latter includes students pursuing doctoral degrees, as well as post-doctoral students in sessions where those students were counted with graduate students (see “Postgraduate Student Counts”); the "master's" group includes all other graduate students (certificate and non-degree students, etc.). The advanced (doctoral) vs. masters (masters + other) breakdown in Data Digest reports will not match the Headcount and FTE Report because of the graduate students who were formerly counted as professional (see “Graduate vs. Professional Student Counts”), and because post-doctoral students have been separated out. The Headcount and FTE Report also reflects a few additional small variations in counting in selected sessions.
Graduate vs. Professional Student Counts
In fall 2014 the Board of Regents, State of Iowa required that only "first professional" students (those pursuing a DDS, JD, MD, or PharmD degree) be counted as professional in official SUI enrollment reporting. Prior to fall 2014, Tippie School of Management students and some other students in the professional colleges (non-degree students in Dentistry, Law, and Medicine; certificate students in Dentistry and Medicine; and Master of Laws [LLM] students in Law) were counted as professional. In Digest reports, only "first professional" students are counted as professional in all years.
Postgraduate Student Counts
The Fall Enrollment Report begins counting postgraduate students separately from other students starting in fall 2011; the Census Report does so in fall 2013; and the Student Profile's Comparative Enrollment Report does so in fall 2014. Prior to those sessions, in each of those reports, graduate post-doctoral students and fellows (Liberal Arts, Graduate College, Public Health) were counted with graduate students, and professional residents and fellows (Medicine, Dentistry, Pharmacy) were counted with professional students. Postgraduate students are counted separately in all years in Digest reports.
In fall 2013, one CLAS Fellow was counted as an undergraduate in the College of Liberal Arts and Sciences in Registrar reporting. This student is counted as post-doctoral in Digest reports, in order to be consistent with prior sessions.
In fall 2011, 288 postgraduate students (residents in the Carver College of Medicine) were left out of census-date reporting due to a change in coding. They are included in Digest reports.
Retention and Graduation Rates of New First Time Full Time Students
The Data Digest reports retention and graduation data for all cohorts based on a snapshot of academic persistence data captured on the official census date of the most recent fall semester. The snapshot includes the latest changes, such as late-awarded degrees, for all cohorts through that fall census date. Although these data are provided to the Board for the annual Graduation and Retention Rate report to the Board of Regents, State of Iowa, the tables posted on the Board’s web site may not reflect updates to data previously provided for past cohorts. Note also that retention and graduation data reported annually to IPEDS and to U.S. News and World Report are not updated after the original reporting year.
136
Definitions and Notes
Information and Resource Management, Office of the Provost
Student Counts by Residency and Geographic Origin
International status, residency status, and residency state are derived from distinct fields in the student information system and were not perfectly aligned prior to MAUI implementation in fall 2013. A small number of undergraduate students were coded as international according to reported ethnicity, and as residents of the state of Iowa according to residency status. In addition, some students were coded as non-resident but with a residency state of Iowa, and were counted as resident or non-resident depending on context. In the Digest, where there is a discrepancy and the data are presented as part of a single whole, priority is given to international status (derived from the reported ethnicity field) over residency status, and then to residency status over residency state. This results in small differences as compared to the Summary of Total Enrollment by Geographic Origin report in the Student Profile.
Student FTE and Full-Time Status
In the Data Digest, student FTE and full-time or part-time status are defined as described above in Definitions. In the Student Profile and Fall Enrollment Report, there are some variations in how students are counted that are based not on enrolled credit hours but on program of study, enrollment in a certain type of course, the provision (starting with MAUI data in fall 2013) of a “short hours” letter (a form authorizing a graduate or professional student to be considered full time for immigration or other purposes even though actually enrolled for fewer than full-time hours), or other factors. The Digest ties full-time status and FTE to enrolled hours in an effort to provide the most consistent data over time.
Technology Transfer Measures in the Data Digest Technology Transfer report differ from those in the annual Economic Development and Technology Transfer report to the Board of Regents in several ways, including:
• the Digest includes audited data that may reflect minor additions or adjustments;• the Regent report includes all patents issued; the Digest includes U.S. patents issued only;• the Regent report includes all license and option agreements generating income; the Digest follows an industry guideline that excludes
agreements below a certain dollar amount, and doesn’t count certain materials.
Additional detail is available on request from the University of Iowa Research Foundation.
137
Definitions and Notes
Information and Resource Management, Office of the Provost
Version Notes
In addition to adding the latest newly available data, a new Data Digest version may incorporate changes to previously published (prior year) data, in order to correct an error or to reflect updated information. Previous Digest versions will remain archived as originally published. Changes to the current version are recorded below.
Report Difference from Previous Digest Version
Endowment Pool The 2017-18 Digest reported UI Center for Advancement distributions for FY 2017 as $132.69 (in millions), based on the FY 2017 Audited Financial Report. The FY 2017 amount is updated here to $142.41 (in millions), based on the FY 2018 Audited Financial Report.
Race/Ethnicity of Postgraduate Students
From fall 2014 through fall 2019, a system error led to miscounting postgraduate students by race and ethnicity (the number counted in the "Two or More Races" group was significantly overstated). This has been corrected in the 2019-20 Data Digest.
Retention and Graduation Rates of New First Time Full Time Students
Beginning with the 2019-20 Digest, the source for retention and graduation data is a snapshot of the MAUI academic persistence data captured as of the official census date of the most recent fall semester. Previously these data came from the “live” academic persistence table, which reflects the latest updates as of the query date, including any late-awarded degrees.
Also beginning with the 2019-20 Digest, first-year retention rates are calculated based on whether a student in a given cohort enrolled in the following fall semester only, not whether the student enrolled at any time during the following academic year.
These changes were made in order to align with annual reporting to the Board of Regents, State of Iowa.
Student Credit Hours by Primary Instructor Category
The distribution of credit hours by primary instructor category for 2017-18 differs in the 2017-18 and later Digests because of an update run in summer 2018 that captured retroactive appointment changes.
138

Informa on & Resource Management Office of the Execu ve Vice President and Provost
111 Jessup Hall 5 West Jefferson Street Iowa City, IA 52240
Phone: 319‐335‐3565 E‐Mail: provost‐[email protected]
h p://provost.uiowa.edu/data‐digest
![D ATA PERSONAL DATA · [2020] PDP Digest MCI (P) 024/07/2020 PERSONAL D ATA PRO TECTION DIGES T [2020] PDP Digest PERSONAL DATA PROTECTION DIGEST Personal Data Protection Digest 2020.indd](https://img.pdfslide.net/doc/110x75/605b14b506f7c63ede4961b2/d-ata-personal-data-2020-pdp-digest-mci-p-024072020-personal-d-ata-pro-tection.jpg)