Embed Size (px)
Citation preview

DATA DATA DISCLOSURESDISCLOSURES
Chapter 5Chapter 5

CHAPTER 5 OBJECTIVESCHAPTER 5 OBJECTIVES
Understand why the overall economic Understand why the overall economic and industry conditions matter to and industry conditions matter to financial statement analysis.financial statement analysis.
Explain the state of the U.S. and Explain the state of the U.S. and international economy for 1993—1998.international economy for 1993—1998.
Discuss the background, environment, Discuss the background, environment, markets, and trends in the personal markets, and trends in the personal computer (PC) industry.computer (PC) industry.
CHAPTER 5 OBJECTIVES CHAPTER 5 OBJECTIVES (CONT.)(CONT.)
Describe the performance of Apple Describe the performance of Apple Computer during the period Computer during the period analyzed.analyzed.
List some of Apple’s competitors.List some of Apple’s competitors. Define the new, or information, Define the new, or information,
economy and explain the role of economy and explain the role of the PC industry in it. the PC industry in it.

ECONOMIC CONDITIONSECONOMIC CONDITIONS
Provide an overall context for Provide an overall context for industry and corporate analysisindustry and corporate analysis
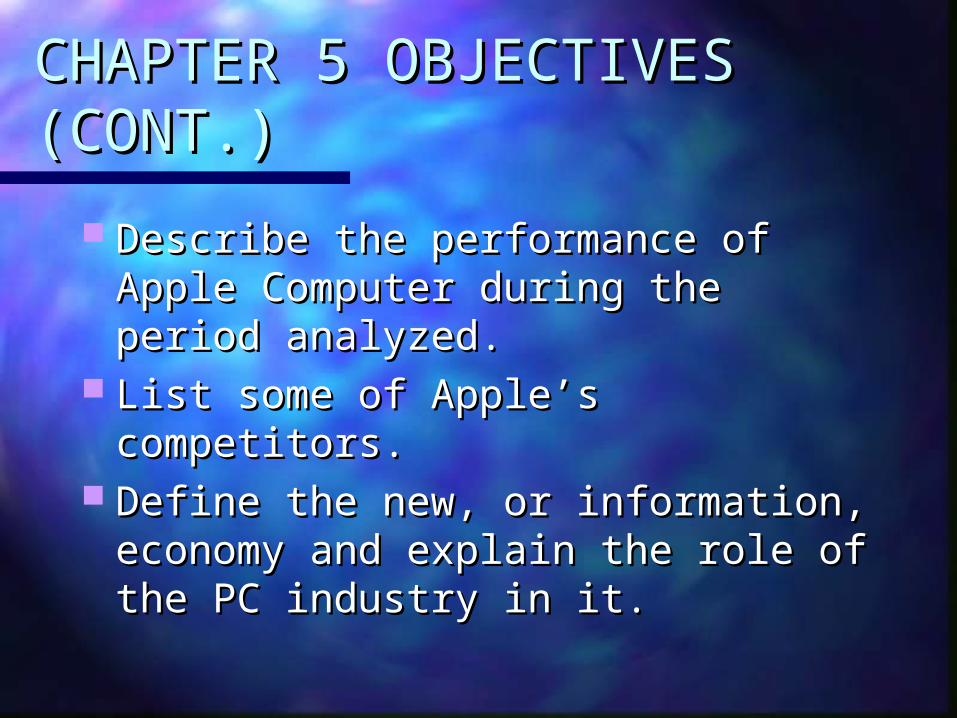
U.S. Economy—prosperous during U.S. Economy—prosperous during the period examined.the period examined.
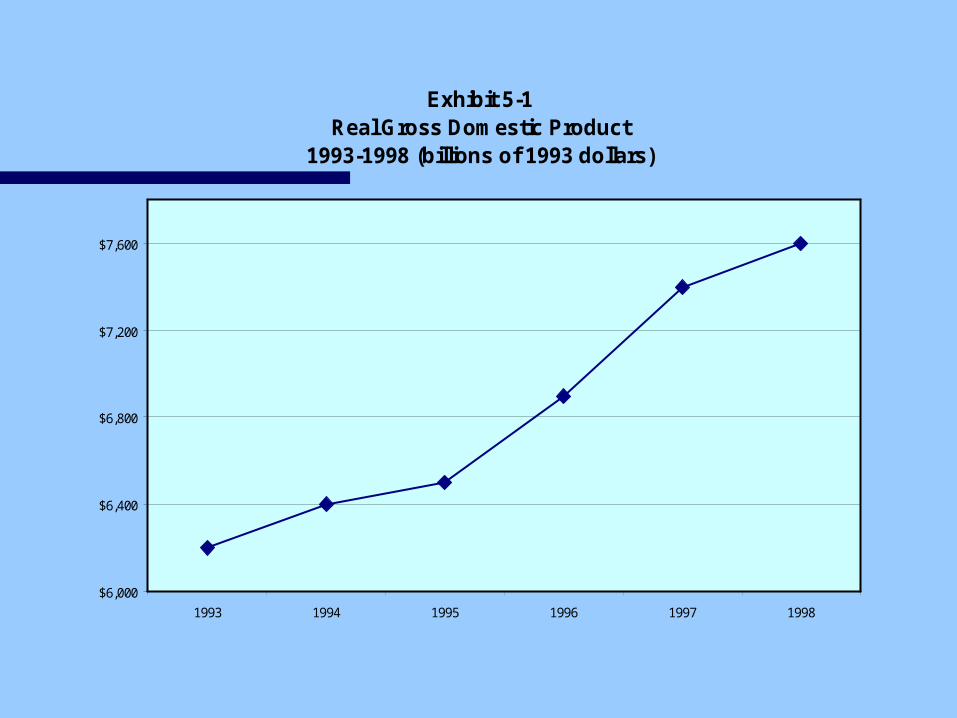
Exhibit 5-1Real Gross Domestic Product
1993-1998 (billions of 1993 dollars)
$6,000
$6,400
$6,800
$7,200
$7,600
1993 1994 1995 1996 1997 1998
Exhibit 5-2Unemployment Rate (annual percentage)
1993-1998
0%
2%
4%
6%
8%
10%
1993 1994 1995 1996 1997 1998
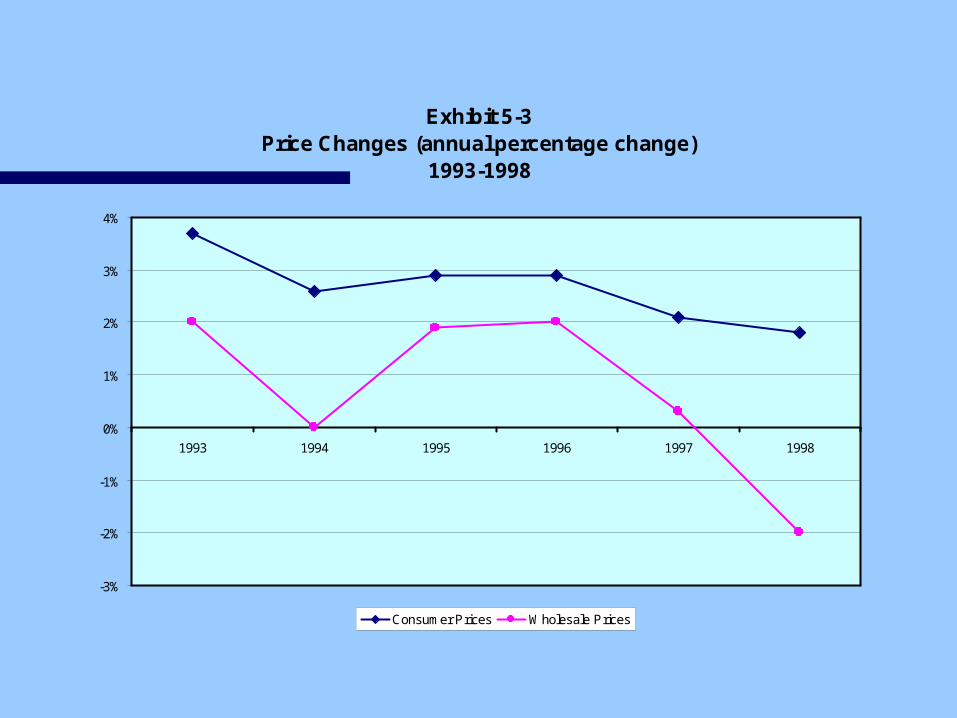
Exhibit 5-3Price Changes (annual percentage change)
1993-1998
-3%
-2%
-1%
0%
1%
2%
3%
4%
1993 1994 1995 1996 1997 1998
Consumer Prices Wholesale Prices
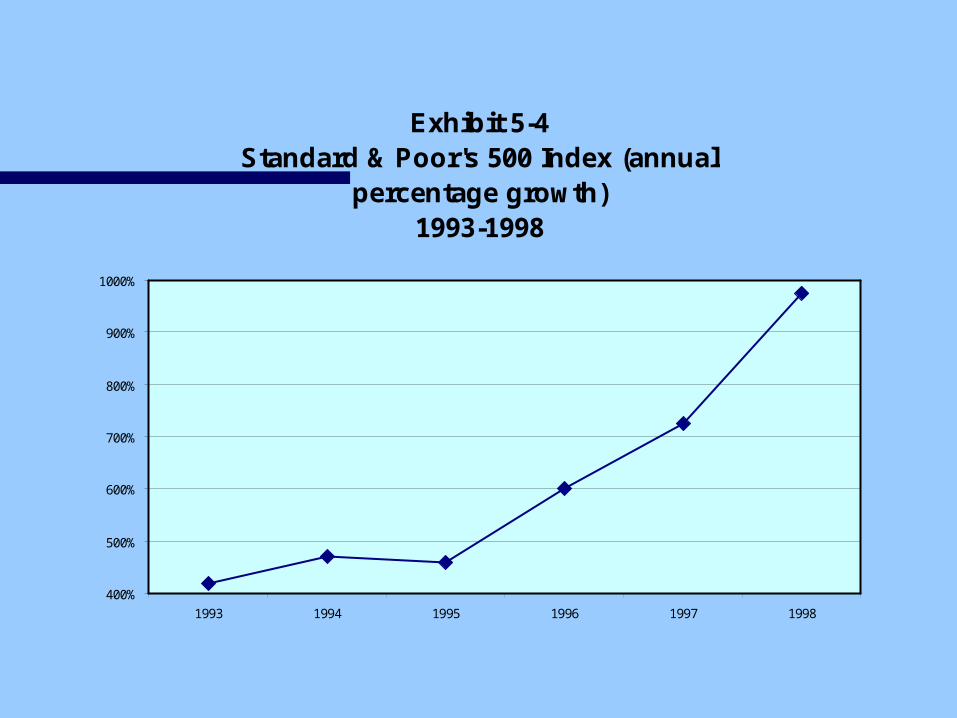
Exhibit 5-4Standard & Poor's 500 Index (annual
percentage growth)1993-1998
400%
500%
600%
700%
800%
900%
1000%
1993 1994 1995 1996 1997 1998
ECONOMIC CONDITIONS ECONOMIC CONDITIONS (CONT.)(CONT.)
Global economy Global economy Mixed results in 1997 and 1998Mixed results in 1997 and 1998 Healthy throughout the world from 1993 to Healthy throughout the world from 1993 to
19961996
Asian, Russian, and Latin American Asian, Russian, and Latin American economies declined in 1997 and 1998economies declined in 1997 and 1998 Thailand no longer pegs baht’s value to that Thailand no longer pegs baht’s value to that
of the U.S. dollarof the U.S. dollar Set of a domino effect throughout Asia—Set of a domino effect throughout Asia—
known as the known as the Asian contagionAsian contagion

ECONOMIC CONDITIONS ECONOMIC CONDITIONS (CONT.)(CONT.)
Western EuropeWestern Europe Remained healthy in 1997 and 1998Remained healthy in 1997 and 1998 Development of European Union Development of European Union
contributed to economic growth contributed to economic growth Countries become more pro business Countries become more pro business
and globally competitiveand globally competitive
PERSONAL COMPUTER PERSONAL COMPUTER INDUSTRYINDUSTRY
Companies that design, Companies that design, manufacture, and distribute PCs manufacture, and distribute PCs and related devices to businesses and related devices to businesses and individualsand individuals
PERSONAL COMPUTER PERSONAL COMPUTER INDUSTRY (CONT.)INDUSTRY (CONT.)
Industry changesIndustry changes Rapidly expanding sales—90 million units Rapidly expanding sales—90 million units
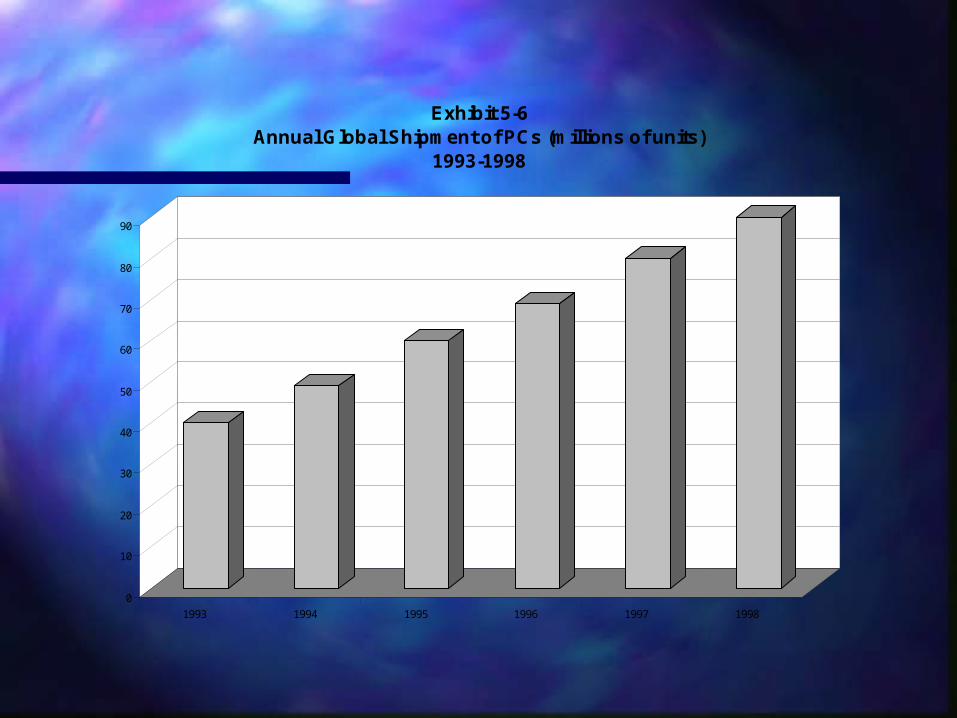
shipped in 1998 (Exhibit 5-5)shipped in 1998 (Exhibit 5-5) Declining prices—machine prices declined Declining prices—machine prices declined
by 50% from 1993 to 1998 (Exhibit 5-6)by 50% from 1993 to 1998 (Exhibit 5-6) Product changes—Laptops and servers are Product changes—Laptops and servers are
growing products, but desk-top machines growing products, but desk-top machines still dominate sales (Exhibit 5-7)still dominate sales (Exhibit 5-7)
0
10
20
30
40
50
60
70
80
90
1993 1994 1995 1996 1997 1998
Exhibit 5-6Annual Global Shipment of PCs (millions of units)
1993-1998
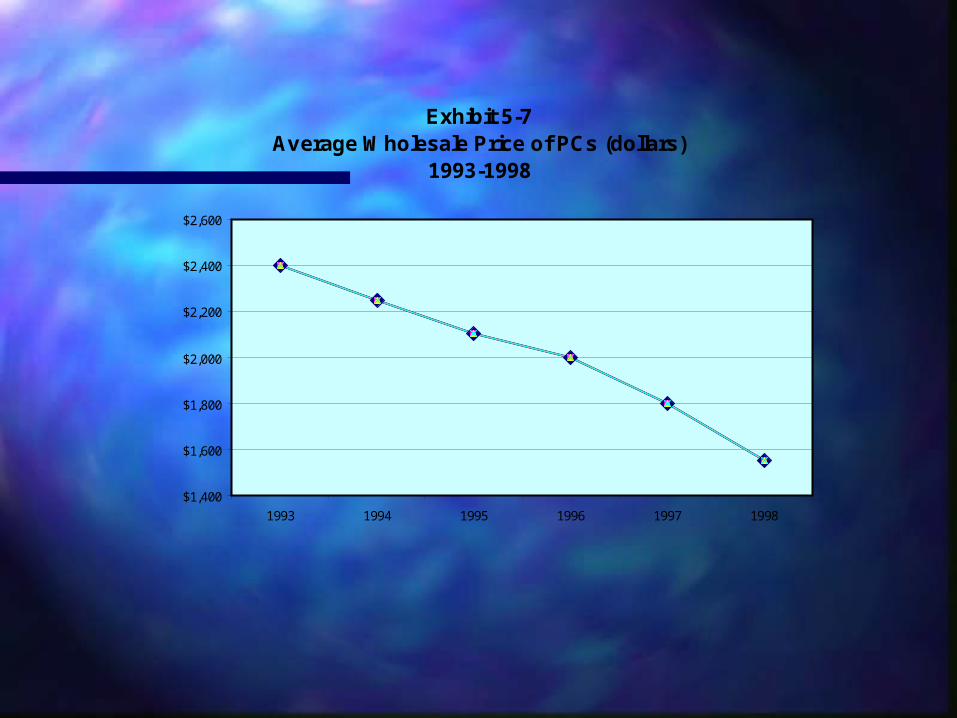
Exhibit 5-7Average Wholesale Price of PCs (dollars)
1993-1998
$1,400
$1,600
$1,800
$2,000
$2,200
$2,400
$2,600
1993 1994 1995 1996 1997 1998
PERSONAL COMPUTER PERSONAL COMPUTER INDUSTRY (CONT.)INDUSTRY (CONT.)
Market shareMarket share Fragmented industry—top four Fragmented industry—top four
companies command only 36% of the companies command only 36% of the market (Exhibit 5-8)market (Exhibit 5-8)
Shift in market leaders from 1993 to Shift in market leaders from 1993 to 1998 (Exhibit 5-8)1998 (Exhibit 5-8)
Apple Computer no longer a top-tier Apple Computer no longer a top-tier firmfirm
PERSONAL COMPUTER PERSONAL COMPUTER INDUSTRY (CONT.)INDUSTRY (CONT.)
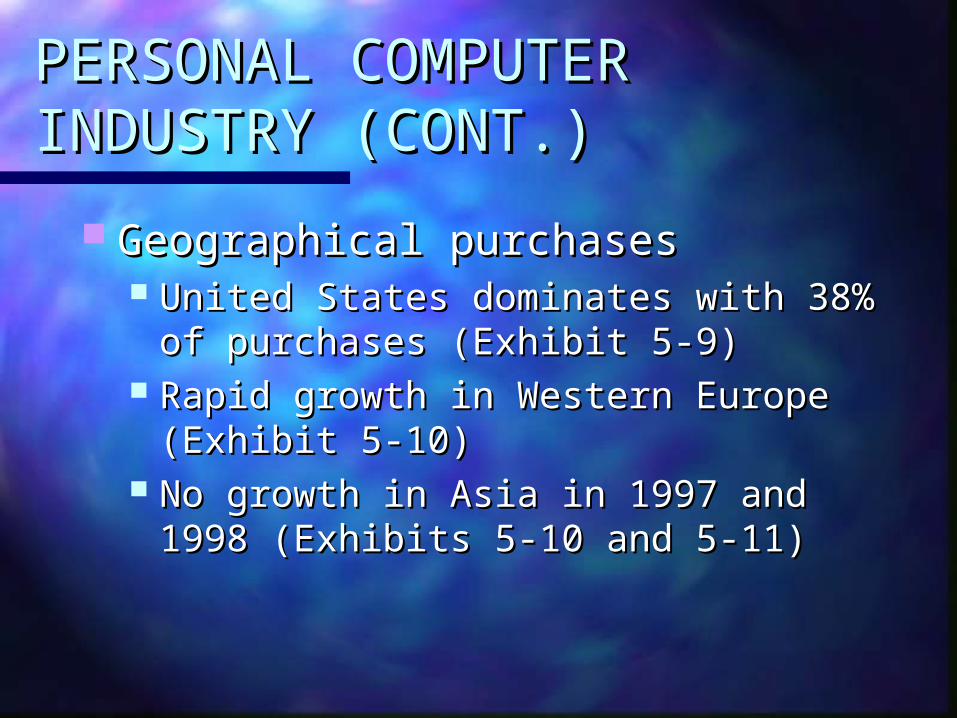
Geographical purchasesGeographical purchases United States dominates with 38% of United States dominates with 38% of
purchases (Exhibit 5-9)purchases (Exhibit 5-9) Rapid growth in Western Europe Rapid growth in Western Europe
(Exhibit 5-10)(Exhibit 5-10) No growth in Asia in 1997 and 1998 No growth in Asia in 1997 and 1998
(Exhibits 5-10 and 5-11)(Exhibits 5-10 and 5-11)
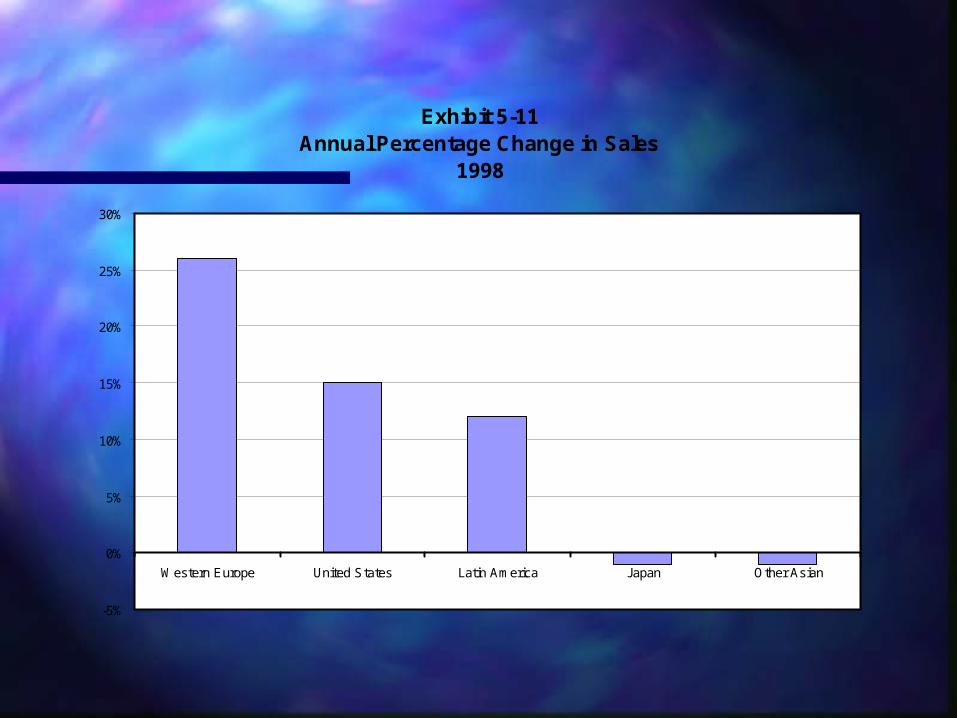
Exhibit 5-11Annual Percentage Change in Sales
1998
-5%
0%
5%
10%
15%
20%
25%
30%
Western Europe United States Latin America Japan Other Asian
PERSONAL COMPUTER PERSONAL COMPUTER INDUSTRY (CONT.)INDUSTRY (CONT.)
Mature markets—industry became Mature markets—industry became entrenched during the 1990’s as evidenced entrenched during the 1990’s as evidenced byby Intense competitionIntense competition Shrinking profit marginsShrinking profit margins Greater cost controlsGreater cost controls Aggressive inventory managementAggressive inventory management Expanded products and servicesExpanded products and services Lack of product differentiationLack of product differentiation Business consolidationBusiness consolidation Revamped distribution networksRevamped distribution networks
PERSONAL COMPUTER PERSONAL COMPUTER COMPANIESCOMPANIES
Apple Computer’s financial Apple Computer’s financial performanceperformance Poor during the period examinedPoor during the period examined Compound annual growth rates Compound annual growth rates
declined from 1993 to 1998declined from 1993 to 1998
PERSONAL COMPUTER PERSONAL COMPUTER COMPANIES (CONT.)COMPANIES (CONT.)
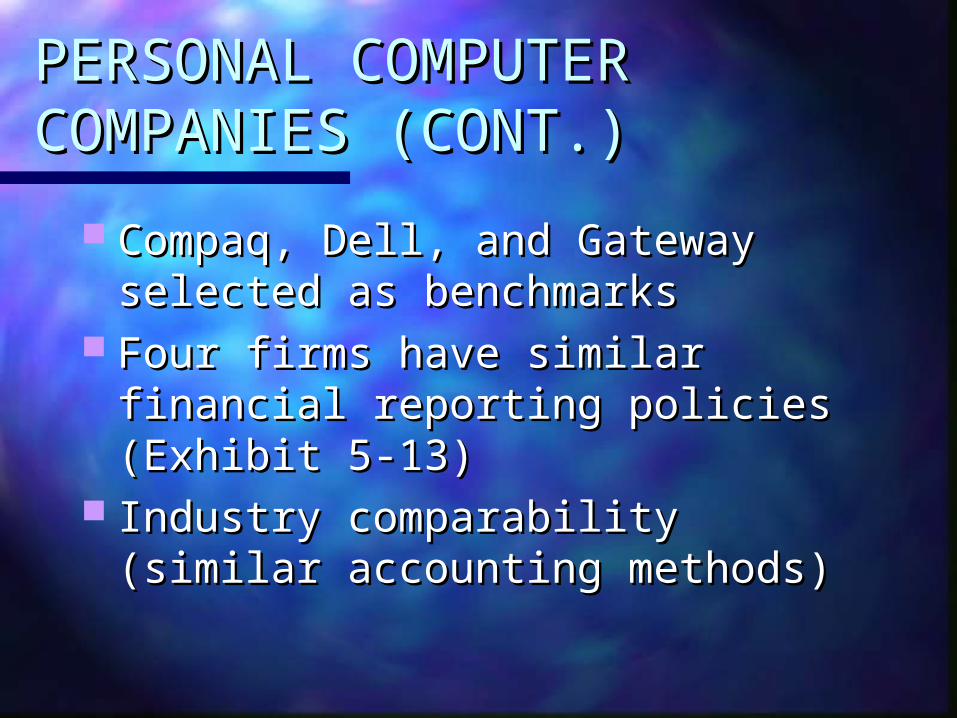
Compaq, Dell, and Gateway Compaq, Dell, and Gateway selected as benchmarksselected as benchmarks
Four firms have similar financial Four firms have similar financial reporting policies (Exhibit 5-13)reporting policies (Exhibit 5-13)
Industry comparability (similar Industry comparability (similar accounting methods)accounting methods)
PERSONAL COMPUTER PERSONAL COMPUTER COMPANIES (CONT.)COMPANIES (CONT.)
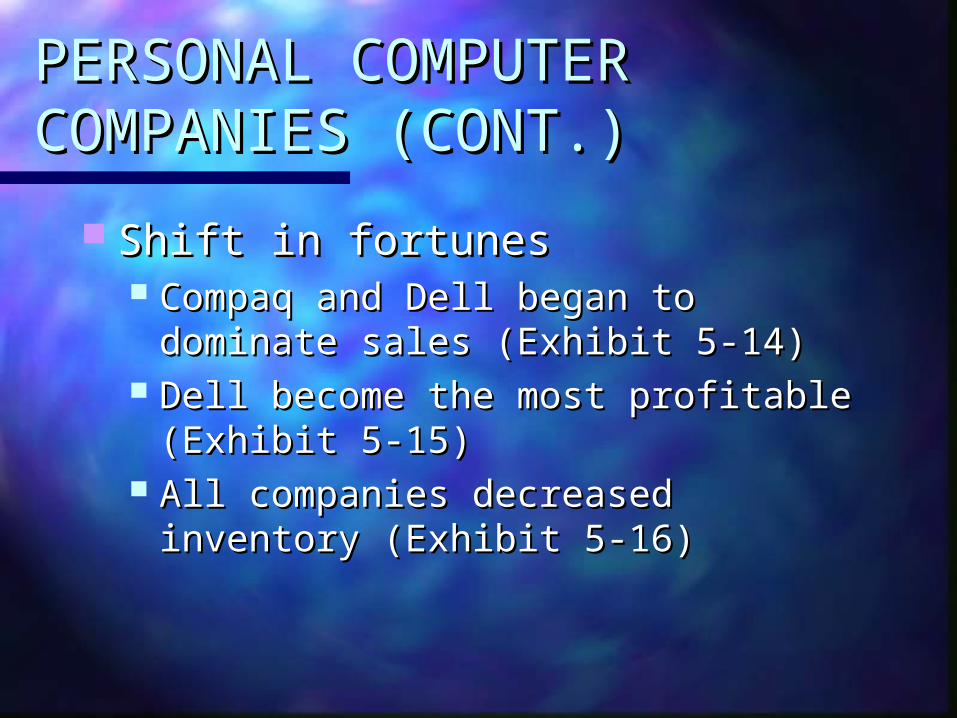
Shift in fortunes Shift in fortunes Compaq and Dell began to dominate Compaq and Dell began to dominate
sales (Exhibit 5-14)sales (Exhibit 5-14) Dell become the most profitable Dell become the most profitable
(Exhibit 5-15)(Exhibit 5-15) All companies decreased inventory All companies decreased inventory
(Exhibit 5-16)(Exhibit 5-16)

ECONOMIC CHANGEECONOMIC CHANGE
Shift in economy from an industrial Shift in economy from an industrial to a service baseto a service base
Differential between “old” Differential between “old” economy and “new” economyeconomy and “new” economy
Information is a major component Information is a major component of the new economyof the new economy
ECONOMIC CHANGE ECONOMIC CHANGE (CONT.)(CONT.)
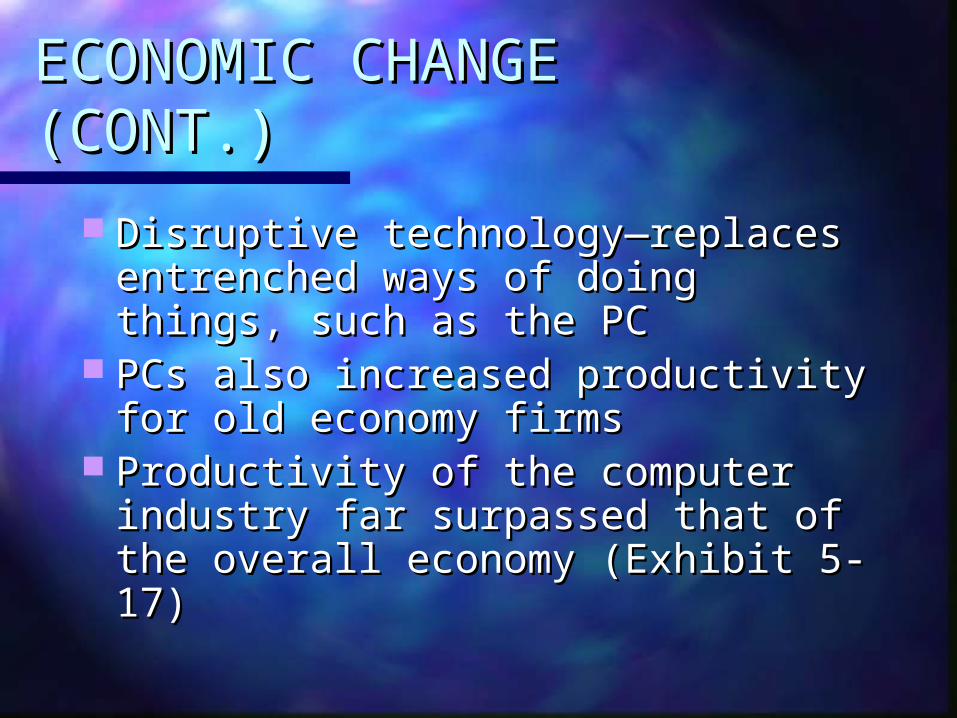
Disruptive technology—replaces Disruptive technology—replaces entrenched ways of doing things, entrenched ways of doing things, such as the PCsuch as the PC
PCs also increased productivity for PCs also increased productivity for old economy firmsold economy firms
Productivity of the computer Productivity of the computer industry far surpassed that of the industry far surpassed that of the overall economy (Exhibit 5-17)overall economy (Exhibit 5-17)
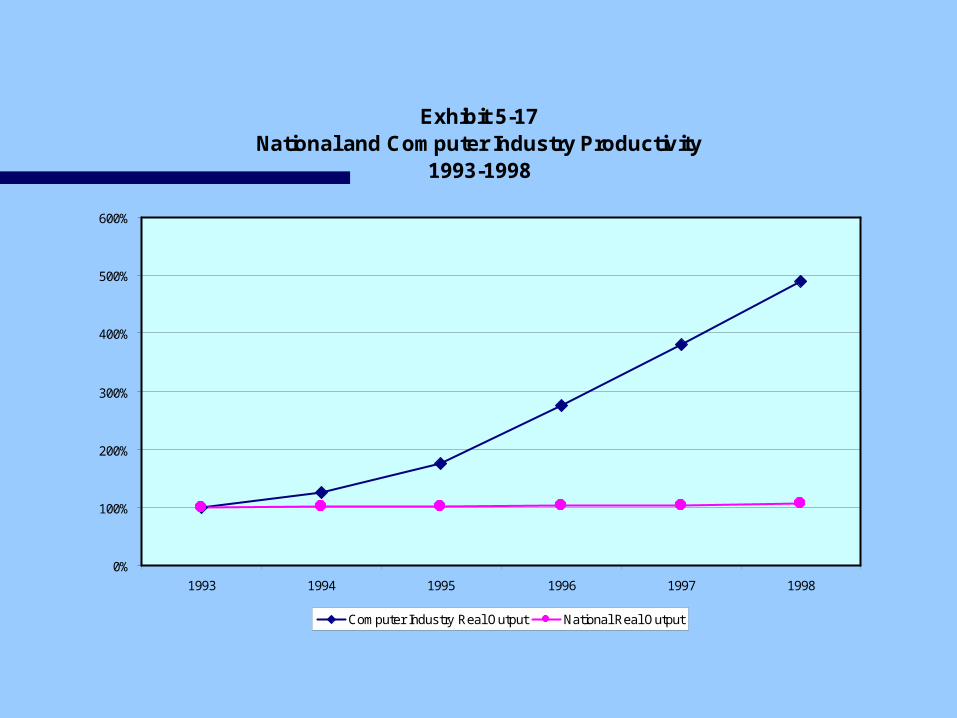
Exhibit 5-17National and Computer Industry Productivity
1993-1998
0%
100%
200%
300%
400%
500%
600%
1993 1994 1995 1996 1997 1998
Computer Industry Real Output National Real Output