Embed Size (px)
Citation preview

Data-driven decision-making in the innovation process of SMEs
Author: Linda Gehrmann
Student number: 2203898
Examiners: Dr. Matthias de Visser
Dr. Michel Ehrenhard
Institution: University of Twente
Faculty: Faculty of Behavioural, Management and Social Science
Program: MSc in Business Administration
Date: 22-08-2020

1
Acknowledgements
I would like to thank my supervisor Matthias de Visser who provided feedback, support and
guidance throughout the writing of my master thesis. Besides, I also want to thank my second
supervisor Michel Ehrenhard for his useful and critical feedback. Moreover, I thank the partic-
ipants of this study who spared the time for an interview. Moreover, I give thanks to the second
coder who invested a lot of time and effort in order to code interviews and discuss the coding
with me.

2
Abstract
The increase in the amount of data which is collected every day has led to an opportunity for
organizations: data-driven decision-making. Data-driven decision-making can offer various ad-
vantages to companies of all sizes, such as an improvement of the market value of a company.
Also the innovation process can be improved by using data as a decision support. Previous
studies about data-driven decision-making and about the innovation process focused mainly on
large organizations. However, the usage of data analytics is lagging behind at SMEs. Therefore,
this study aims to investigate to what extent SMEs use data-driven decision-making in their
innovation process. Qualitative research has been conducted including cases of nine SMEs op-
erating in different industries in order to elaborate SMEs’ perception of data-driven decision-
making and the extent to which they use it in their innovation process. The results indicate that
the participating SMEs have a basic understanding of the term data-driven decision-making.
However, a more comprehensive definition is necessary so that SMEs can fully understand the
concept and how it can add value to their organization. Furthermore, it is argued that data-
driven decision-making comes along with benefits as well as challenges, which are acknowl-
edged by the participating SMEs. Moreover, the extent to which data-driven decision-making
is used in the innovation process depends on the organization but also on the stage of the inno-
vation process. Finally, the research shows that there is room for improvement regarding the
data usage in the innovation process of SMEs. This study highlights multiple possibilities which
offer potential for the future.
Key words
data-driven decision-making, innovation process, data-driven innovation, digital innovation,
SME, Business Analytics

3
Table of Contents
1 Introduction ........................................................................................................................... 5
2 Theory .................................................................................................................................... 7
2.1 Data-Driven Decision-Making ......................................................................................... 7
2.2 Innovation ......................................................................................................................... 8
2.3 Data-driven decisions in the innovation process ............................................................ 12
2.3.1 Idea Generation Phase ............................................................................................. 12
2.3.2 Idea Selection Phase ................................................................................................ 14
2.3.3 Development Phase ................................................................................................. 15
2.3.4 Launch Phase ........................................................................................................... 16
2.3.5 Post-Launch Adaption Phase .................................................................................. 17
2.3.6 Learn Phase ............................................................................................................. 17
2.4 Research Model .............................................................................................................. 18
3 Methodology ........................................................................................................................ 20
3.1 Research Design ............................................................................................................. 20
3.2 Interview Participants ..................................................................................................... 21
3.3 Data Analysis ................................................................................................................. 21
3.4 Validity, Reliability, and Generalizability ..................................................................... 22
4 Results .................................................................................................................................. 23
4.1 Data-Driven Decision-Making ....................................................................................... 23
4.1.1 Understanding of Data-Driven Decision-Making ................................................... 23
4.1.2 Preparations for Data-Driven Decision-Making ..................................................... 24
4.1.3 Benefits of Data-Driven Decision-Making ............................................................. 25
4.1.4 Challenges of Data-Driven Decision-Making ......................................................... 26
4.1.5 Systems and Techniques ......................................................................................... 28
4.2 Innovation Process of SMEs .......................................................................................... 29
4.2.1 Idea Generation Phase ............................................................................................. 29
4.2.2 Idea Selection Phase ................................................................................................ 30
4.2.3 Development Phase ................................................................................................. 31
4.2.4 Launch Phase ........................................................................................................... 33
4.2.5 Post-Launch Adaption Phase .................................................................................. 34
4.2.6 Learn Phase ............................................................................................................. 36
4.2.7 General Overview ................................................................................................... 36
5 Discussion ............................................................................................................................. 40
5.1 Theoretical Implications ................................................................................................. 40
5.1.1 Perception of data-driven decision-making ............................................................. 40
5.2.2 Data-driven decisions in the innovation process ..................................................... 41

4
5.2 Practical Implications ..................................................................................................... 43
5.3 Limitations ..................................................................................................................... 44
5.4 Directions for future research ......................................................................................... 44
5.5 Conclusion ...................................................................................................................... 45
References ............................................................................................................................... 46
Appendix 1: Literature Review ............................................................................................. 52
Appendix 2: Interview Questionnaire .................................................................................. 54
Appendix 3: Code Book ......................................................................................................... 56

5
1 Introduction
Huge amounts of data are collected every day. Nevertheless, “data is meaningless unless it helps
make decisions” (Meyer, McGuire, Masri, & Shaikh, 2013). It has been proven that companies
who apply data-driven decision-making are more successful than the ones that do not (McAfee
& Brynjolfsson, 2012). Data-driven decision-making is, for instance, correlated with an im-
provement in the return on assets, return on equity, and the market value of a company (Provost
& Fawcett, 2013). However, different decisions require different types of data and analytics
(Breuer, Moulton, & Turtle, 2013). Therefore, it is necessary for a company to understand
which data is helpful and how to handle the data.
In order to be competitive, a company needs to innovate continuously (Gubbins &
Dooley, 2014; Standing & Kiniti, 2011). The increased amount of data has a significant impact
on the innovation process of a company (Trabucchi & Buganza, 2019). This is as organizations
can use data-driven decision-making to improve their innovation process (Sedera, Lokuge,
Grover, Sarker, & Sarker, 2016). The usage of data in the innovation process is, however, not
only crucial for technology companies but for every industry and sector (Tumbas, Berente, &
vom Brocke, 2018; Nambisan, 2018). It offers advantages to companies, such as the possibility
to gain an understanding of the customers’ needs, which makes it possible to adapt offerings
accordingly (Urbinati, Bogers, Chiesa, & Frattini, 2019).
Approximately 99 percent of the companies in the EU are small- or medium-sized en-
terprises (SME) (European Commission, 2015). SMEs are companies which have less than 250
employees and a turnover of less than 50 million or balance sheet total of less than 43 million
(European Commission, 2015). An efficient innovation process of SMEs is “critical for the
European economy because of the large representation of the SME sector” (Coleman, Göb,
Manco, & Pievatolo, 2016). Innovation is the most important characteristic for SMEs to be
successful, to achieve a stronger growth and a high market share, and to be more profitable
(Tidd & Bessant, 2009). Nonetheless, it seems like data-driven decision-making is mostly used
by larger multinational companies (Reijkumar, Aswathy Asokan, & Sreedharan, 2018). This is
since the usage of data analytics is lagging behind at SMEs (Parra & Tort-Martorell, 2016).
Furthermore, even companies that see the benefits of the data usage experience problems with
getting started (Reijkumar et al., 2018).
Several studies have been performed about data-driven decision-making. However,
most of these studies focused on large organizations (e.g. Brynjolfsson, Hitt, & Kim, 2011;
Brynjolfsson & McElheran, 2016; Troisi, Majone, Grimaldi, & Loia, 2019). Even though there
are also studies on how technology can be used to support the innovation process, there are no
studies examining how SMEs use data-driven decision-making in the innovation process. This
study aims to investigate how data-driven decision-making can be used in the different phases
of the innovation process and to what extent SMEs make use of that. Therefore, this study is an
extension to the current literature on data-driven decision-making and to the literature on the
innovation management of SMEs. It provides insights into the perception of SMEs on data-
driven decision-making and how SMEs use data in order to make decisions during the innova-
tion process. This shows to what extent the innovations of SMEs are based on data.
For the management of SMEs, it provides interesting insights as well. First, the literature
review on data-driven decisions in the innovation process can help managers to gain knowledge
about how data can support the decisions in the various phases of the innovation process. Sec-
ondly, it is interesting to see how other companies of the same size manage their innovation
process and which decisions are supported by data.
In order to elaborate the usage of data-driven decision-making at SMEs in their innova-
tion process, interviews are conducted to provide insights into the current practices of SMEs
regarding the decision-making in the innovation process. Through this, the following research
question should be answered: To what extent do Dutch SMEs use data-driven decision-making

6
in their innovation process? For this, answering the following sub questions is necessary: 1.
How do SMEs perceive data-driven decision-making? and 2. To what extent do SMEs use data-
driven decision-making in the various stages of the innovation process? By answering these
two questions, it will become clear what the understanding of data-driven decision-making is
and which challenges and benefits SMEs perceive. This also shows the motivations for data-
driven decision-making and what might be holding SMEs back from implementing it to a higher
extent. It can be expected that this influences the extent to which SMEs use data-driven deci-
sion-making in the innovation process. Next to this, it will be elaborated how the decisions in
the innovation process are made. Through this it will be possible to see to what extent these
decisions are based on data.
The structure of this study is as follows. First, the theory chapter will define what data-
driven decision-making is, how the innovation process looks like, and which decisions need to
be made during this process. Next to this, it also provides examples of how companies can make
these decisions with the aid of data. Secondly, the methodology, which is used for the analysis,
is described. Thirdly, results are presented which includes the analysis of the interviews. This
section should give insights on how SMEs perceive data-driven decision-making and on how
the decisions in the innovation process are made. Lastly, a discussion is given, including theo-
retical and practical implications, limitations, directions for future research, and the conclusion.

7
2 Theory
In order to define the necessary terms for this paper, a literature review has been conducted.
Information on this can be found in Appendix 1.
2.1 Data-Driven Decision-Making
Often, managers make decisions based on incomplete information, experience, or intuition
(Baba & HakemZadeh, 2012; McAfee & Brynjolfsson, 2012). However, in order to make rea-
sonable decisions, managers should rely on evidence (Baba & HakemZadeh, 2012). This evi-
dence can be achieved by relying on data. The amount of data is growing continuously which
is mainly caused by the internet (Delen & Zolbanin, 2018; Wielki, 2015). The internet has led
organizations to use transactional databases for which they collect a huge amount of data. Next
to this, the multimedia usage is growing and the development of the “Internet of Things” makes
physical objects or devices collect and share data “with each other without any human interfer-
ence” (Wielki, 2015, p. 193). Moreover, the growing usage of social media increases the
amount of data as well. The different kind of data can be processed in order to provide value to
organizations (Frazzetto, Nielsen, Pedersen, & Šikšnys, 2019; Kolomvatsos & Hadjiefthymia-
des, 2017) By doing so, the data can be used to improve the decision-making.
Data-driven decision-making can be defined as follows. It refers to making decisions
which are not purely based on intuition or experience but on insights from verifiable data anal-
ysis (Cao, Duan, & Li, 2015; Provost & Fawcett, 2013; Reijkumar et al., 2018). In the process
of data-driven decision-making, historical data is used to create new knowledge on which de-
cisions are based (Lu et al., 2019). Moreover, organizations can also use a combination of ex-
perience, intuition, and data-driven decision-making (Provost & Fawcett, 2013). Especially in
unstructured problem situations, data-driven decision-making can be extremely helpful to help
solving a complex problem (Lu et al., 2019).
Data-driven decision-making is part of business analytics. “The key component of ana-
lytics is the process in which a set of various techniques transform data into value” (Delen &
Zolbanin, 2018, p. 188). This value can be the knowledge necessary to make decisions and
drive actions (Gürdür, El-khoury, & Törngren, 2019; Liberatore, Pollack-Johnson, & Heller
Chain, 2017). For this process, specific methods can be used. These can be classified into four
categories, which all provide different insights: descriptive, diagnostic, predictive, and prescrip-
tive. First, descriptive analytics answers the question of what happened in the past or what is
currently happening by collecting and summarizing historical data (Delen & Zolbanin, 2018;
Frazzetto et al., 2018; Liberatore et al., 2017). For this, data visualization can be helpful for the
identification of patterns and trends (Delen & Zolbanin, 2018; Frazzetto et al., 2019) Second,
diagnostic analytics tries to elaborate the reason why something has happened (Delen & Zolba-
nin, 2018). It aims to find the underlying causes of problems by using for instance data mining
or data visualization (Delen & Zolbanin, 2018). Thirdly, predictive analytics forecasts what
might happen in the future (Delen & Zolbanin, 2018; Frazzetto et al., 2019; Liberatore et al.,
2017). To do so, large amounts of historical data are used to create predictive models (Delen &
Zolbanin, 2018). Fourthly, prescriptive analytics aims to answer what should be done by finding
the best course of action (Delen & Zolbanin, 2018; Liberatore et al., 2017). It logically follows
from the previous three categories since it is possible to determine which course of action one
should follow when it is known what happened in the past, why it happened, and future predic-
tions are available (Frazzetto et al., 2019). The optimal usage of the categories involves a com-
bination and integration of all four concepts (Frazzetto et al., 2019). By combining the different
methods, a holistic view can be created. Big data is often the basis for business analytics. Big
data is characterized by three challenges: volume, velocity, and variety (Cao et al., 2015; Delen
& Zolbanin, 2018; McAfee & Brynjolfsson, 2012; NewVantage Partners, 2012). Volume refers
8
to the size of the data set. Velocity represents the speed of the data creation. Lastly, the com-
plexity of different forms of data is referred to as variety. Nevertheless, big data also offers the
opportunity to convert data from information to knowledge into action by an improved analytic
capability (Delen & Zolbanin, 2018; NewVantage Partners, 2012).
There are various advantages of making use of data-driven decision-making. It can be
said that data-driven decision-making leads to smarter and more effective decisions (Cao et al.,
2015; McAfee & Brynjolfsson, 2012). Using data for the decision-making can serve as a com-
petitive advantage – not only for online businesses but also for traditional ones (Liberatore et
al., 2017; McAfee & Brynjolfsson, 2012; Reijkumar et al., 2018). “Companies in the top third
of their industry in the use of data-driven decision making were, on average, 5% more produc-
tive and 6% more profitable than their competitors” (McAfee & Brynjolfsson, 2012, p. 6). This
also stays true after controlling for multiple possible confounding factors (McAfee & Brynjolfs-
son, 2012; Provost & Fawcett, 2013). Data-driven decision-making leads to an improved busi-
ness performance with a higher profitability (Ross, Beath, & Quaadgras, 2013). According to
Provost and Fawcett (2013), this includes a “higher return on assets, return on equity, asset
utilization, and market value” (p. 53). Moreover, it can also be used to create new products and
services for the customers based on their preferences (Cao et al., 2015). In general, data-driven
decision-making can increase the speed and the flexibility of the decision-making in an organ-
ization (Cao et al., 2015). This is, for instance, because automating decisions based on data
frees employees from making routine decisions (Ross et al., 2013). This in turn allows them to
focus on other activities. In conclusion, making effective usage of data in the decision-making
is a core competence to be successful (Reijkumar et al., 2018). This is due to the fact that it can
improve both the efficiency and the effectiveness of the decision-making process in an organi-
zation.
However, data-driven decision-making comes along with challenges. There are cultural
challenges in an organization when it comes to basing decisions on data (Gürdür et al., 2019;
McAfee & Brynjolfsson, 2012). When introducing new technologies for the decision-making,
the corporate culture needs to be addressed, as well, including the company values (Gürdür et
al., 2019). Furthermore, there are privacy concerns which a company needs to consider
(McAfee & Brynjolfsson, 2012). Besides, according to Reijkumar et al. (2018), the data quality
and the analysis process are the main factors for a successful data-driven decision. Therefore,
it needs to be ensured that the dataset is comprehensive and that the company is equipped with
suitable tools to process the data (Gürdür et al., 2019; Long, 2018). Additionally, employees,
who are in charge of making decisions, need to receive sufficient trainings in order to acquire
the necessary skills (Ross et al., 2013). Moreover, the business processes need to be defined,
which includes the existence of rules and regulations regarding data-driven decision-making
(Cao et al., 2015; Gürdür et al., 2019). If these requirements are not met in an organization, data
could be misinterpreted. A decision based on that can lead to a competitive disadvantage
(McAfee & Brynjolfsson, 2012; Reijkumar et al., 2018).
To conclude, data-driven decision-making refers to decisions which are based on the
analysis of data instead of experience or intuition. It is a part of business analytics and can be
used by applying different methods of analysis: descriptive, diagnostic, predictive, and pre-
scriptive analytics. Data-driven decision-making can lead to a competitive advantage and an
improved business performance. Nevertheless, certain requirements need to be fulfilled in order
to achieve these advantages, such as a skilled decision-maker who has the right tools.
2.2 Innovation
Innovation is a necessary part of every organization. It has been shown that the competitiveness
of an organization relies on its innovation ability (Gubbins & Dooley, 2014; Standing & Kiniti,
2011). In consequence, it is necessary to define what innovation is. Innovation can be defined

9
as an idea which is new to the organization pursuing it (Sedera et al., 2016; Standing & Kiniti,
2011). Thus, it does not need to be completely new in general - it can also be something that
other organizations already did before. An innovation which is based on the improvement of
already existing ideas is called exploitation (Love, Roper, & Bryson, 2011). Companies exploit
and refine these existing ideas. When companies are searching for opportunities by developing
new ideas, it is called exploration (Love et al., 2011). To create innovation, both exploitation
and exploration, knowledge is a necessity (Tidd & Bessant, 2018). Diverse knowledge needs
to be combined in order to create an innovation. This process is done under uncertainty since it
is not known how the final innovation will look like and how to get to this final stage (Tidd &
Bessant, 2018). Generally, innovation is referring to change in one of four areas: product inno-
vation, process innovation, position innovation, or paradigm innovation (Tidd & Bessant,
2018).
The way of innovating has been changed in the last years. The usage of digital innova-
tion has “transformed the ways and means of innovation in a wide swath of industries and
sectors” (Nambisan, 2018, p. 104). More companies than ever make use of data in order to
come up with more successful innovations (Agostini, Galati, & Gastaldi, 2019; Rindfleisch,
O’Hern, & Sachdev, 2017). Consequently, it is not only crucial to technology organizations,
but it also becomes more important to all other companies (Tumbas et al., 2018). Digital inno-
vation can be defined as follows. A digital innovation is an innovation which is based on the
usage of digital technology (Nambisan, Lyyntinen, Majchrzak, & Song, 2017; Yoo, Hen-
fridsson, & Lyyntinen, 2010). This can be, for example, by acquiring, analyzing, and acting on
consumer data (Rindfleisch et al., 2017; Yoo et al., 2010). Through this, an understanding of
the customers’ needs is enabled which makes it possible to adapt the offerings to those (Urbinati
et al., 2019).
Innovation can be described as a continuous process which enables companies to grow
(Love et al., 2011; Tidd & Bessant, 2018). Due to an increasing digitization, the different phases
of the innovation process have become more overlapping (Nambisan et al., 2017). Besides,
there is no specific process which is suitable for every type of project (Salerno, Gomes, Da
Silva, Bagno, & Freitas, 2015). Nonetheless, for this paper the innovation process phases will
be defined to provide a structure for the research. There are many innovation process models
defined in the literature (e.g. Fichman, Dos Santos, & Zheng, 2014; Frankenberg, Weiblen,
Csik, & Gassmann, 2013; Salerno et al., 2015; Standing & Kiniti, 2011; Tidd & Bessant, 2018).
Frankenberg et al. (2013) emphasize that “at heart, however, the process models feature a set
of common characteristics”. Many researchers define it as a process which starts with the
searching for innovation ideas – the idea generation – and continues with the selection of which
innovation to pursue, the development of the idea, the actual implementation in the market, and
possible changes after the launch (Eveleens, 2010). It is emphasized that it is important to con-
tinuously reflect on the innovation process itself in order to learn from it and to improve the
process (Eveleens, 2010). For this paper, the innovation process will be defined according to
the literature review on innovation process models by Eveleens (2010) with the following
phases (Figure 1): idea generation, idea selection, development, launch, post-launch adaption,
Figure 1. Innovation Process (adapted from Eveleen, 2010)
Idea
generation
Idea
selectionDevelopment
Learn
LaunchPost-launch
adaption

10
and learn. This process has been based on the review of various innovation process models (e.g.
Cooper & Kleinschmidt, 1986; Jacobs & Snijders, 2008; Mulgan & Albury, 2003; Nooteboom,
2000; Rothwell, 1994; Tidd & Bessant, 2008; Verloop & Wissema, 2004). This process model
has been chosen as it combines different models from the literature and includes the previously
mentioned phases of an innovation process, including a learn phase to reflect on the process
itself. Figure 1 shows the process.
The idea generation phase is about discovering opportunities in the environment. This
contains of the search “to identify unfulfilled needs that provide the opportunity for potential
innovations” (Gubbins & Dooley, 2014, p. 9). For this, the environment needs to be scanned
for signals about threats and opportunities (Tidd & Bessant, 2018).
In the idea selection phase, an idea is chosen for further development. In order to be
innovative, the idea selection is a crucial step. It has to be chosen to which of the identified
signals, a company wants to react to (Tidd & Bessant, 2018). Therefore, it needs to be evaluated
which ideas should be implemented by considering their “fit with the mission and values of an
organization and ideas must also have commercial value” (Standing & Kiniti, 2011, p. 290). It
should be an idea which is realistic and possible to implement (Sengupta & Dev, 2011) and
which lets the organization develop in the best way (Tidd & Bessant, 2018). The decision is
based on knowledge the company has (Gubbins & Dooley, 2014). A better-informed decision
in this phase can lead to a higher change of success of the final innovation (Gubbins & Dooley,
2014).
The third phase consists of the development of the innovation. In this phase, it is im-
portant that the necessary knowledge and recourses are acquired through, for instance, R&D
activities or through alliances (Love et al., 2011; Tidd & Bessant, 2018). Afterwards, the ac-
quired knowledge has to be transformed into actual actions and output (Ganotakis & Love,
2012; Love et al., 2011). During this phase, prototypes are constructed of the future innovation
and resources and structures are set up in order to make the innovation utilizable or producible
(Standing & Kiniti, 2011).
In the fourth phase, the innovation is launched. This is the phase, in which the actual
commercialization of the innovation takes place (Standing & Kiniti, 2011). In this phase, the
marketing activities related to the innovation are prepared as well (Eveleens, 2010). The needs
of the market have to be considered in order to enable the initial adoption of the innovation
(Gubbins & Dooley, 2014).
The fifth phase consists of adapting the innovation in order to sustain it for the long
term. This phase happens post launch (Eveleens, 2010). It can include a modification of the
innovation (Tidd & Bessant, 2018) or a re-innovation (Eveleens, 2010) so that the acceptance
of the users increases. For this, the innovation needs to be monitored since findings might be
useful for adjustments (Sengupta & Dev, 2011).
The learn phase refers to the continuous learning throughout the innovation process. In
every phase of the innovation process, there is the chance for the organization to learn from it
(Tidd & Bessant, 2018). For this, it has to be analyzed and evaluated what is currently done in
the innovation process (Mulgan & Albury, 2003). Adjusting the process based on what a com-
pany has learnt, can lead to an improvement in the management of the whole process (Tidd &
Bessant, 2018).
During the innovation process various decisions need to be made. These decisions are
different in each phase of the process (Klingebiel & Rammer, 2014). A simplified overview of
decisions in the innovation process can be seen in Table 1.
In the search phase, the following decisions need to be made. First, a company needs to
decide on strategic goals that should be reached within a specific time (Sengupta & Dev, 2011).
Secondly, a company needs to decide for what they are searching – they can choose for new
opportunities by improving something they currently already do or by developing something
new (Tidd & Bessant, 2018). With this they decide what they might innovate. This can involve

11
a product/service, the positioning, the process, or a paradigm innovation. Thirdly, “organiza-
tions pick up signals about innovation possibilities through exploring a particular ‘selection
environment’” (Tidd & Bessant, 2018, p.349). In order to do so, a company needs to decide
where they want to search – they need to choose a search environment. Fourthly, the company
needs to decide who is involved in the searching (Standing & Kiniti, 2011).
In the select phase, the company needs to make decisions to select opportunities the
company wants to explore. The company thus has to decide which ideas from the search phase
will be progressed and which not (Eveleens, 2010; Gubbins & Dooley, 2014). For this, two
questions need to be answered: “Does the innovation we are considering help us reach the stra-
tegic goals we have set ourselves (for growth, market share, profit margin etc.)?” and “With the
underlying competencies – do we know enough about this to pull it off (or if not do we have a
clear idea of how we would get hold of and integrate such knowledge)?” (Tidd & Bessant,
2018, p. 364). Consequently, companies need to decide on how to answer these questions. This
includes how they do the analysis and who is involved in this (Tidd & Bessant, 2018).
In the development phase, the following decisions need to be made. In order to acquire
the necessary knowledge, it has to be decided which knowledge is necessary for the implemen-
tation of the specific innovation and how this knowledge can be gained (Tidd & Bessant, 2018).
Afterwards, decisions need to be made to enable the execution of the implementation. In this
stage, it needs to be decided how the actual outcome should look like. Therefore, decisions need
to be made about the design of the innovation. Next to this, it also needs to be decided on a
structure on how to implement the innovation, which can involve, for instance, the production
process of a product or a definition of different steps in a process (Standing & Kiniti, 2011;
Tidd & Bessant, 2018). After prototypes have been created, the company needs to decide if the
innovation needs to be improved before the launch and if yes, how (Tidd & Bessant, 2018). For
all of these decisions, it again needs to be decided who is responsible for each action.
Table 1: Decisions during the innovation process
Decision
Which strategic goals should be reached?
What might be innovated?
Where do we want to search for ideas?
Who is involved in the searching?
Which ideas should be progressed and which not?
How do we analyze the different ideas?
Who is involved in the selection?
Which knowledge do we need for the innovation?
How do we gain the necessary knowledge?
How should the design of the innovation look like?
How can the implementation be structured?
Who is responsible for the execution?
How should the final innovation look like?
How should we promote the innovation?
How should we price the innovation?
Where should we launch the innovation?
When should we launch the innovation?
Which objectives do we want to reach with this innovation?
Post-launch adaption Does the innovation need to be adjusted?
Does the innovation process need to be changed? Learn
Phase
Idea generation
Idea selection
Develop
Launch

12
In the launch phase of the implementation, the following decisions need to be made. It
needs to be decided how the final innovation should look like (Tidd & Bessant, 2018). Next to
this, decisions need to be made on the way the innovation should be launched (Tidd & Bessant,
2018). This includes decisions about the marketing of the innovation (Eveleens, 2010), for in-
stance the place, the price, and the promotion, but also the timing of the launch. Furthermore,
specific objectives have to be defined in order to be able to control the development (Tidd &
Bessant, 2018).
In the post-launch adaption phase of the innovation process, the company needs to de-
cide on how the innovation should be adjusted in order to increase the diffusion of the innova-
tion and the acceptance of the customers high (Mulgan & Albury, 2003).
To learn from the innovation process, a decision has to be made. It needs to be decided
whether something needs to be changed in the process based on previous projects (Mulgan &
Albury, 2003; Tidd & Bessant, 2018). Based on this decision, the innovation process itself can
be adjusted.
In conclusion, an innovation is an idea which is new to the person or organization pur-
suing it. In companies, innovation refers to change in one of four different areas: product inno-
vation, process innovation, position innovation, or paradigm innovation. During the last years,
the usage of digital technology during the innovation process has been increased. The innova-
tion process goes from the search and selection of ideas to the development and implementation
of the innovation. During this process, it is crucial for organizations to learn in order to improve
the process itself. In the course of the innovation process, various decisions have to be made by
an organization.
2.3 Data-driven decisions in the innovation process
In this sub chapter, it is shown which decisions in the innovation process might be based on
data and examples are given on how to use data-driven decision-making in the innovation pro-
cess. An overview of which decisions might be based on data can be found in Table 2 at the
end of this chapter.
2.3.1 Idea Generation Phase
It has been found that searching for innovative ideas should be a frequent activity for each
organization (O’Brien, 2020). To decide what a company might need to innovate Tidd and
Bessant (2018) suggest spotting trends, apply market forecasting by extrapolation or scenario
writing, compare against competitors, and also consider mistakes and failures from the past.
Especially small companies can benefit from participation of external parties, such as consum-
ers or suppliers, in the ideation stage since they can compensate for a lack of resources com-
pared to larger companies (Chang & Taylor, 2016). The participation can be active or passive.
A passive participation consists of the analysis of existing data from users or customers
(Stockstrom, Goduscheit, Lüthje, & Jørgensen, 2016). During an active participation, data is
created with the aid of customers specifically for the purpose of the innovation.
In passive participation, existing data is analyzed. For instance, social media, websites,
and chat rooms offer customer data, which can be helpful for an organization (Muninger,
Hammedi, & Mahr, 2019; Tidd & Bessant, 2018). Next to this, data from other externals, such
as suppliers or competitors might be analyzed. For instance, patents from externals can be an-
alyzed in order to find valuable ideas (Woo, Yeom, & Lee, 2019). A considerable amount of
this data is in textual unstructured form (Chen, Chiang, & Storey, 2012). Natural language pro-
cessing (NLP) and machine learning enable the analysis of text data (Broniecki & Hanchar,
2017). It can be distinguished between supervised and unsupervised learning (Broniecki &

13
Hanchar, 2017). In supervised learning, a human coder is required who labels the data. Unsu-
pervised learning is more exploratory and tries to identify patterns in the data (Broniecki &
Hanchar, 2017). One common way to retrieve value from the data is by using sentiment analysis
(Chen et al., 2012). Sentiment analysis identifies the tone of a given text (Broniecki & Hanchar,
2017). Therefore, it can be found out which association customers have with, for instance, a
product or service offered by a company. The basis for sentiment analysis is a dictionary com-
prising of words which are related to, for example, positive or negative emotions (Broniecki &
Hanchar, 2017). The outcome of sentiment analysis is a sentiment score based on the relative
word counts. Based on these scores the company could also identify how consumers perceive
them in comparison to competitors or how they perceive one specific feature or functionality
of a product or service. A company can therefore see which products or which parts of a product
are perceived as negative. Thus, attention can be given to those topics when deciding what to
innovate.
Another possibility to analyze text data is semantic analysis. Semantic analysis can be
used in order to identify ideas based on social media posts by taking context and meaning into
account (Broniecki & Hanchar, 2017; Mirkovski, von Briel, & Lowry, 2016). Posts about own
products but also posts about competitors’ products can be included in the analysis in order to
gain a more complete picture of the desires and preferences of the consumers (Mirkovski et al.,
2016). Mirkovski et al. (2016) propose to start the semantic analysis by labelling a sample of
posts. This needs to be done by an employee manually. Based on this labeling, a classification
scheme can be created which enables an automatic classification of further posts through the
usage of an algorithm (Mirkovski et al., 2016). Mirkovksi et al. (2016), for instance, describe a
classification scheme which labels posts into most and least feasible innovation ideas. Based
on the classification scheme, the algorithm can identify ideas which suit the customer prefer-
ences and which implementation is feasible. Based on the most feasible ideas, a topic model
can be created (Miskovski et al., 2016). Topic models “summarize multiple text documents into
a number of common, semantic topics” (Broniecki & Hanchar, 2017, p. 93). This can be helpful
for a company to identify topics which customers are talking about and therefore can help in
deciding what the company can innovate.
In an active participation of the externals in the innovation process, people who are
external to the company are asked to “share their ideas and thoughts about how firms can im-
prove their products and services” (Hossain & Islam, 2015, p. 612). This is called open inno-
vation. The involvement of users in the idea search phase is widely adopted and can comple-
ment the work of professionals (Poetz & Schreier, 2012). It has been shown that products and
services which were created with the aid of consumer involvement achieve higher success rates
than the ones generated only by professionals inside the organization (Nishikawa, Schreier, &
Ogawa, 2013; Witell, Kristensson, Gustafsson, & Löfgren, 2011). Moreover, a collaboration
with consumers leads to a reduction of risks during the implementation phase of an innovation
(Tobiassen & Pettersen, 2018). Therefore, it can be said that it can be beneficial for a company
to involve consumers in the search for innovative ideas. However, Gama, Frishammar, and
Parida (2019) emphasized that SMEs first need to have systematic routines in place before they
should consider an active involvement of consumers.
Companies need to decide who to involve in the active participation. In general, con-
sumers who should be involved need to show domain-specific interest (Füller, Matzler, Hutter,
& Hautz, 2012). It has been found that business customers or lead users are more valuable in
an active participation due to their higher knowledge in the domain (Bosch-Sijtsema & Bosch,
2015; Chang & Taylor, 2016; Tidd & Bessant, 2018). Collaborations with suppliers and con-
sumers are way more common than with competitors (Walsh, Lee, & Nagaoka, 2016). Hence,
vertical collaborations are most common. Next to this, also collaborations with universities can
lead to a higher quality of inventions (Walsh et al., 2016). Furthermore, internal employees who

14
are not related to the innovation itself can be involved in the idea searching (O’Reilly & Binns,
2019).
There are different ways to involve externals through active participation. A number of
consumers or suppliers can be invited for a focus group discussion (Schweitzer, Buchinger,
Gassmann, & Obrist, 2012). The data collected during the discussion can be a basis for a com-
pany to decide in which field innovation might be necessary. Focus groups are especially ben-
eficial when the needs of a target group should be investigated (Schweitzer et al., 2012). In
contrast to focus groups, social media offers a way to involve a higher number of externals (He
& Wang, 2016). Social media offers the advantage that the company can interact with the cus-
tomers (Hossain & Islam, 2015). On social media, organizations can initiate the idea generation
by, for instance, asking consumers for feedback about current services or products or inviting
them to share ideas in order to improve those (Mirkovski et al., 2016) Misunderstandings are
more likely to occur with the usage of only text-based social media applications (He & Wang,
2016). Crowdsourcing – when the consumers are asked to share own ideas – can offer a high
value to a company (Poetz & Schreier, 2012). Some large organizations even have own inno-
vation platforms on which they can interact with users (Hossain & Islam, 2015). Social media
also offers the users the opportunity to discuss their feedback and ideas with each other. Be-
sides, organizations can use customer surveys to collect feedback on products and services and
to ask for ideas for improvement (Tidd & Bessant, 2018). Companies can offer incentives to
the users, which motivate them to participate in the innovation search of the organization (He
& Wang, 2016). This can be, for instance, reward points or vouchers. The collected data through
social media, online platforms, or surveys can offer important insights which can help to decide
which innovations might be beneficial.
Employees can be involved in several ways. Organizations can, for example, implement
online suggestion systems or internal contests (O’Reilly & Binns, 2019). An online suggestion
system can be composed of a standard format document which has to be filled in by the em-
ployee who wants to suggest an idea (O’Reilly & Binns, 2019). This creates a pool of new
ideas, which the company can access easily. The company can use this pool as a basis to decide
for what the company might want to innovate. Incentives might also be a motivator for employ-
ees to share their ideas.
In order to analyze the results of active participation by externals or employees, text
analytics might be helpful for a large amount of data. Sentiment and semantic analysis might
be useful to create an overview of what the participants desire and prefer (Broniecki & Hanchar,
2017).
It can be said that the decision what an organization might want to innovate can be
supported by data. There are different possibilities on how to do that with different forms of
participation. For SMEs, the participation of externals might provide benefits since it can com-
pensate for a lack of resources. However, before involving externals into this process, system-
atic routines should be in place.
2.3.2 Idea Selection Phase
Data can also be used to support decisions in the selection phase. A formal process for the idea
selection can increase the success of an organization’s ideas (Eling, Griffin, & Langarek, 2016).
Therefore, it is important that an organization defines a consistent process for the idea selection.
Nonetheless, it has been found that reflexivity improves the effectiveness and the efficiency of
the idea selection process (Hammedi, van Riel, & Sasovova, 2011). Thus, the decision makers
should reflect on the objectives and the process and perhaps adapt those to special situations.
There are different methods for the idea selection proposed in the literature. Also in the selec-
tion of ideas, external can be included, but the process can also be done internally.
15
When relying on internals, a consistent process can be created. In the first place, a deci-
sion committee can be formed, which is responsible for the selection of ideas (Mousavi, Torabi,
& Tavakkoli-Moghaddam, 2013). This decision committee is responsible for defining criteria
which an innovation idea has to fulfill in order to be progressed (Mousavi et al., 2013; Yarmo-
hammadi, Rezvani, & Albotzi, 2017). These criteria might include costs and benefits of an idea,
but also the feasibility in terms of technology and legal requirements (Mousavi et al., 2013;
Yarmohammadi et al., 2017). A numerical scale can be determined by the committee in order
to rate the ideas (Mousavi et al., 2013). Mousavi et al. (2013) propose to determine the relative
importance of each criterium and to then weigh the criteria with the numerical values created
by the rating. Based on this, a decision matrix can be created in which the different ideas are
measured on, for instance, costs versus benefits (Mousavi et al., 2013; Tidd & Bessant, 2018).
The results of this allow a ranking of the different alternatives. To what extent this process is
data-driven also seems to depend on how the committee reasons the values they choose on the
numerical scale – whether these are grounded in research or the intuition of the committee
members. Moreover, this method looks at ideas in a portfolio perspective which offers the ben-
efit of creating balance and a better overview (Eling et al., 2016; Tidd & Bessant, 2018).
Employees who are not part of a decision committee can also participate. Voting
schemes can be used to enable employees to state their opinion about which ideas should be
progressed (Onarheim & Christensen, 2012). The experience of employees can be a comple-
ment and creates a more nuanced view (Onarheim & Christensen, 2012). However, involving
employees should not be seen as an alternative, but as an addition. The votes can be analyzed
by looking at the descriptive statistics, which shows the frequency of votes for each alternative.
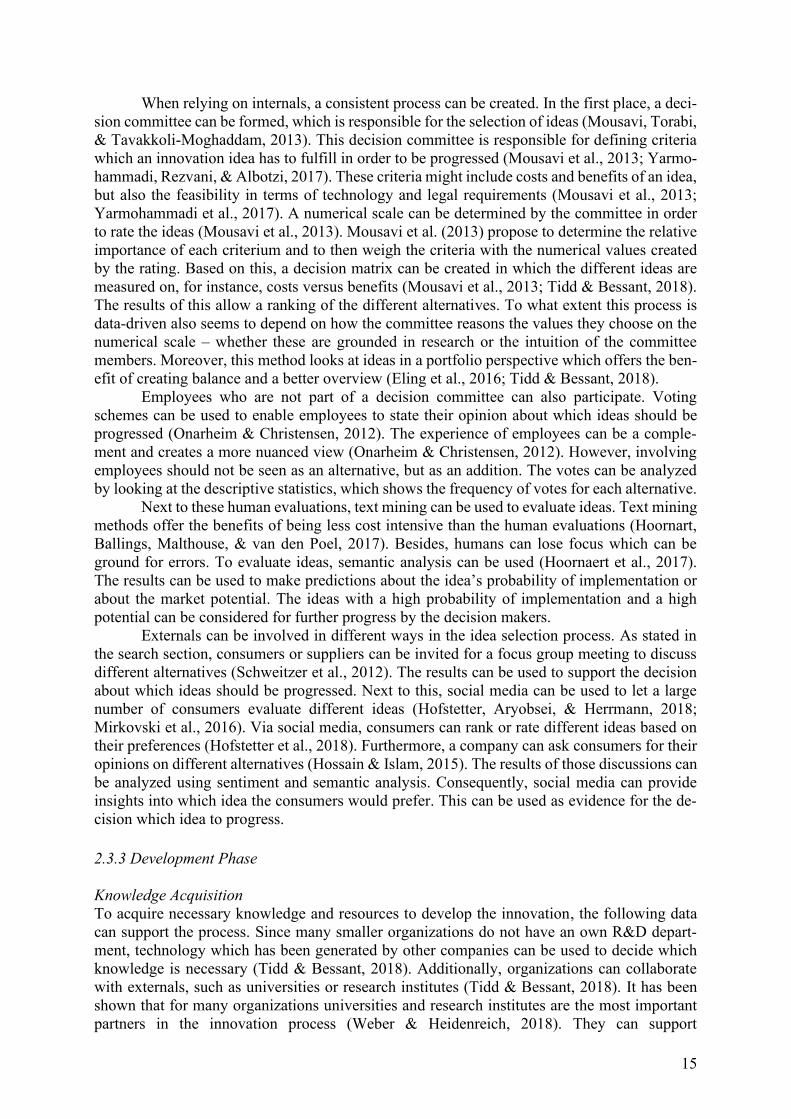
Next to these human evaluations, text mining can be used to evaluate ideas. Text mining
methods offer the benefits of being less cost intensive than the human evaluations (Hoornart,
Ballings, Malthouse, & van den Poel, 2017). Besides, humans can lose focus which can be
ground for errors. To evaluate ideas, semantic analysis can be used (Hoornaert et al., 2017).
The results can be used to make predictions about the idea’s probability of implementation or
about the market potential. The ideas with a high probability of implementation and a high
potential can be considered for further progress by the decision makers.
Externals can be involved in different ways in the idea selection process. As stated in
the search section, consumers or suppliers can be invited for a focus group meeting to discuss
different alternatives (Schweitzer et al., 2012). The results can be used to support the decision
about which ideas should be progressed. Next to this, social media can be used to let a large
number of consumers evaluate different ideas (Hofstetter, Aryobsei, & Herrmann, 2018;
Mirkovski et al., 2016). Via social media, consumers can rank or rate different ideas based on
their preferences (Hofstetter et al., 2018). Furthermore, a company can ask consumers for their
opinions on different alternatives (Hossain & Islam, 2015). The results of those discussions can
be analyzed using sentiment and semantic analysis. Consequently, social media can provide
insights into which idea the consumers would prefer. This can be used as evidence for the de-
cision which idea to progress.
2.3.3 Development Phase
Knowledge Acquisition
To acquire necessary knowledge and resources to develop the innovation, the following data
can support the process. Since many smaller organizations do not have an own R&D depart-
ment, technology which has been generated by other companies can be used to decide which
knowledge is necessary (Tidd & Bessant, 2018). Additionally, organizations can collaborate
with externals, such as universities or research institutes (Tidd & Bessant, 2018). It has been
shown that for many organizations universities and research institutes are the most important
partners in the innovation process (Weber & Heidenreich, 2018). They can support

16
organizations in research and can provide especially smaller organizations with missing
knowledge and data.
Execution
In order to execute the development, data can fasten and improve the process. Organizations
might want to involve users in design activities of a new innovation. For this, the organizations
provide necessary tools and other support which enables the user to integrate own ideas and
expertise (Russo-Spena & Mele, 2012). Companies “can develop design toolkits and apply
them creatively to product design” (Muninger et al., 2019, p. 117). These toolkits might be used
by customers but also by own employees. The usage of such tools is supported by other features
of the internet, such as forums or wikis, in which different users can engage and exchange views
about different ideas (Russo-Spena & Mele, 2012). Wikis and forums also offer the advantage
that knowledge and ideas are stored and can be retrieved at any point in time (Standing & Kiniti,
2011).
Crowdsourcing can be another source of data in the execute phase. With the usage of
crowdsourcing users are integrated in the process (Bosch-Sijtsema & Bosch, 2015). For exam-
ple, Facebook can be “used as a test-and-learn tool” (Mount & Martinez, 2014). With Facebook
organizations can easily share different pictures or create opinion polls. The results of such an
opinion poll or the comments and likes for different pictures and posts can be valuable infor-
mation about the preferences of the consumers (Mount & Martinez, 2014). Nonetheless, for
small companies it might be more difficult to reach a high number of users via social media
channels.
Furthermore, digital prototypes can be used. Based on digital prototypes, decisions can
be made about the design of the innovation. Using digital prototypes instead of physical ones
can save the designers around five to six weeks (Brossard, Erntell, & Hepp, 2018). Therefore,
it can lead to an earlier commercialization of the innovation. Besides, 3D printing can also help
to fasten the process. Prototypes created with 3D printing can be used to test the innovation and
can be shown to the customers (Candi & Beltagui, 2019). Based on the results of that prototypes
and the reactions of the customers, decisions about the design can be made.
In case that prototypes already exist from earlier phases or innovations, the suitability
should still be tested (Lindič, Baloh, Ribire, & Desouza, 2011). Also for this, the involvement
of users can be beneficial. Organizations include customers in the execution phase because they
can be a source of valuable feedback about whether current ideas and prototypes are in line
with the customers’ needs (Mirkovski et al., 2016). However, Chang and Taylor (2016) state
that the involvement of customers in the development of an innovation can lead to a delay in
the process.
To decide how to structure the implementation of the innovation, employees and other
users can be surveyed so that their needs and knowledge are considered (Tidd & Bessant, 2018).
Based on an analysis of the feedback, decisions about how the implementation should be struc-
tured can be made.
2.3.4 Launch Phase
In the launch phase, data can improve the results. First, to make the final decision how the
innovation should look like, particular concepts can be tested with customers (Bosch-Sijtsema
& Bosch, 2015; Lynch, O’Toole, & Biemans, 2016). Based on the outcome of these tests, the
decision can be made if the originally developed concept is accepted. This can also indicate
which features or functionalities customers would be willing to pay a premium for and which
could be eliminated (Zhan, Tan, Ji, Chung, & Tseng, 2017). Especially for technology, the
design can be tested with a user community. For this, the new technology is made available to
a test user community before it is launched (Russo-Spena & Mele, 2012). The organization

17
collects data of the user community and can improve the final design based on it. Additionally,
companies can conduct A/B testing, in which different beta versions of the innovation are re-
leased to observe the reactions to each version (Bosch-Sijtsema & Bosch, 2015; Brossard et al.,
2018; Tidd & Bessant, 2018). Decisions about the final version are made by taking the data of
the A/B testing into account. But also data from online customer surveys can help in deciding
how the final innovation should look like (Bosch-Sijtsema & Bosch, 2015). These surveys can
also be done in the form of an opinion poll on social media (Mount & Martinez, 2014). This
allows companies to increase the alignment of the innovation with the actual customer needs
(Mount & Martinez, 2014).
Decisions about the promotion of the innovation can be based on the preferences of the
customers which can be identified by analyzing the results of the concept testing (Tidd & Bes-
sant, 2018). This helps to define the value proposition of the innovation perceived by the cus-
tomers (Lindič et al., 2011). However, next to customers, also suppliers and other stakeholders
can be involved in this process of defining the value proposition (Lindič et al., 2011). Besides,
competing offerings should be taken into consideration when developing the promotion plan
(Tidd & Bessant, 2018).
Customer preferences and competing offerings should also be considered in the pricing
of the innovation (Tidd & Bessant, 2018). Also dynamics in the market can be a basis for the
price. The adoption of the so called dynamic pricing requires data about the “demand, inventory
levels, competitor offerings, and customer history” (Omar, Minoufekr, & Plapper, 2019). It has
been shown that dynamic pricing lead to an improved financial performance and does not have
a negative effect on the price image (Omar et al., 2018).
The decision about the location of the launch should be made with the competing offers
as support (Tidd & Bessant, 2018). Moreover, a company needs to do market research in order
to find out where the innovation can be sold and where consumers would be able and willing
to buy it.
2.3.5 Post-Launch Adaption Phase
To sustain the innovation, data can be helpful. Companies can use online surveys to receive
feedback from customers (Bosch-Sijtsema & Bosch, 2015). With this input, improvement po-
tential might be discovered by listening to the actual experience of the customers. Next to this,
quantitative data of the customers, such as sales information can help in making decisions re-
garding the sustaining of the innovation (Bosch-Sijtsema & Bosch, 2015). The sales infor-
mation provides insights into which features and functionalities are most and least favored by
the customers. Furthermore, text data can be gathered on, for example, social media to get more
feedback about positive and negative attributes of a launched innovation (Muninger et al.,
2019). Text analysis can be used to decide whether and how the innovation needs to be adjusted.
Sentiment analysis can help in identifying positive as well as negative associations with specific
features of the innovation. Besides, semantic analysis can help in discovering reasons for dis-
satisfaction or satisfaction by taking context and meaning of the text into account. Sensors
which are embedded in the product capture data which can help to identify customer require-
ments (Ervelles, Fukawa, & Swayne, 2016). Based on this, improvements can be made. How-
ever, this is not a common measure for most companies (Niebel, Rasel, & Viete, 2019).
2.3.6 Learn Phase
There are useful tools which can support the learn stage. Post-project reviews “are structured
approaches to capture learning at the end of an innovation project” (Tidd & Bessant, 2018, p.
403). Based on this documentation of the innovation process, decisions might be made regard-
ing changing standard procedures. For this, metrics are useful. According to Mulgan & Albury

18
(2003), “clear measures and transparent systems for accessing the success […] of innovations
are vital to robust analysis and creating cultures of learning” (p. 28). In order to make use of
metrics, processes and mechanisms need to be defined. Benchmarking can be helpful to see
how other companies manage their innovation process and where an organization can learn
from others (Tidd & Bessant, 2018). The analysis of the benchmarking results can be a basis
for improvements of the own innovation process.
2.4 Research Model
In order to investigate how SMEs use data-driven decision-making in the innovation process,
it first needs to be elaborated what their perception of data-driven decision-making itself is.
This is necessary since the familiarity with the phenomenon, the preparations to enable data-
driven decision-making, the perceived and expected benefits, and the perceived and expected
Figure 2. Research Model
Table 2: Overview of which decisions can be based on data
Familiarity
Perceived and expected challenges
Perceived and expected benefits
Preparations
Idea Search
Idea Selection
Launch
Post-Launch Adaption
Data-driven decision-makingUsage of data-driven decision-
making in the innovation process
Systems and techniques Learn
Decision Based on data?
Which strategic goals should be reached?
What might be innovated? ü
Where do we want to search for ideas?
Who is involved in the searching?
Which ideas should be progressed and which not? ü
How do we analyze the different ideas?
Who is involved in the selection?
Which knowledge do we need for the innovation? ü
How do we gain the necessary knowledge?
How should the design of the innovation look like? ü
How can the implementation be structured? ü
Who is responsible for the execution?
How should the final innovation look like? ü
How should we promote the innovation? ü
How should we price the innovation? ü
Where should we launch the innovation? ü
When should we launch the innovation?
Which objectives do we want to reach with this innovation?
Post-launch adaption Does the innovation need to be adjusted? ü
Does the innovation process need to be changed? üLearn
Phase
Idea generation
Idea selection
Develop
Launch

19
challenges influence whether and to what extent SMEs use data-driven decision-making in the
innovation process. After the identification of this, it has to be found out how data-driven deci-
sion-making is used in the innovation process. This step will also investigate how SMEs are
making the decisions in the innovation process when not relying on the analysis of data. The
results of this will lead to conclusions and recommendations. The research model in Figure 2
shows this.
The study aims to draw conclusions on how SMEs perceive data-driven decision-mak-
ing, which includes the familiarity, the preparations, the benefits, and the challenges. Further-
more, it will be shown how SMEs are making the decisions which have been determined in
Table 2 to be able to be based on data. Furthermore, it will be shown how SMEs are using data-
driven decision-making, for instance which software they are using.

20
3 Methodology
To investigate how SMEs perceive data-driven decision-making and to what extent they use
data-driven decision-making in their innovation process, nine cases have been chosen. Semi-
structured interviews have been conducted with ten interviewees in the period of four weeks.
Due to the situation regarding the corona crisis, all interviews have been conducted online.
3.1 Research Design
For the nine cases, semi-structured interviews have been conducted due to the exploratory na-
ture of the study. Face-to-face interviews offer the advantage of perceiving social cues, for
instance the body language or the tone of voice (Opdenakker, 2006). However, due to the situ-
ation regarding the corona crisis, it was not possible to conduct the interviews face-to-face.
Therefore, it has been chosen to do the interviews via video calls online. Through this, the
researcher and the interviewees were able to see each other which allowed for the perception
of social cues to the highest extent possible. Additionally, in semi-structured interviews, a re-
action of the interviewer is possible to what the interviewees say (Opdenakker, 2006). Due to
the semi-structured interview style, it can be guaranteed that the interviews follow the same
structure while offering room to being responsive to individual answers of the interviewees
(Leech, 2002).
The formulation of open-ended questions has been chosen due to the fact that it facili-
tates an open conversation. Therefore, it enables topics to emerge in course of the interview
which the interviewer did not think of before. These questions were divided into three different
topics, namely information about the participant, data-driven decision-making, and the innova-
tion process. Before questions about these topics have been asked, an introduction has been
given to the participants, in which it has been explained for which purpose the interview is
conducted. Moreover, it has been stressed that there are no right or wrong answers, that the
interview is anonymous, and that the participant is able to stop with the interview at any time
without stating a reason for this. Through this, it should be guaranteed that the interviewee feels
comfortable to share their honest opinions and experiences. Furthermore, the participants were
asked if they agree to the interview being recorded in order to not violate their privacy.
Before the interview, it has been prepared what the company is doing in general so that
the time of the participants is not wasted with topics that can be found online. For this, the
company websites and the social media channels, such as LinkedIn, YouTube, and Facebook,
and news releases about the company have been considered. Things that remained unclear after
the internet search about the company have been asked during the interview.
As a beginning, the first topic of the interview has been about the participant himself. It
has been asked what his current function is, how long he already is in the current function, and
what his main responsibilities are. These questions were used to get an overview of the inter-
view participants but also to make the interviewee feel more comfortable in giving answers.
The second topic has been about data-driven decision-making. First, the interviewee has
been asked to define data-driven decision-making. With this, it has been aimed to find out what
the general understanding of the term is. This shows to what extent the interviewees are familiar
with the term data-driven decision-making. Afterwards, the definition of the researcher has
been given in order to create a common basis for the following questions. After that, the reasons
for the (non-)usage of data-driven decision-making have been discussed and the perceived and
expected benefits. Besides, it has been asked how the company of the interviewee prepared or
is planning to prepare to enable data-driven decision-making. Moreover, the participants were
asked which challenges they experience as an SME regarding data-driven decision-making and
which other challenges they might expect in the future.

21
The last topic has been about the innovation process. In order to ask questions about the
different stages of the innovation process, it has been explained to the interviewee which phases
the innovation process has in the definition of this study and what these phases consist of. After
that, it has been asked for each innovation phase how the companies are managing the stage
and how they make specific decisions in the stages. With this, it could be identified to what
extent the SMEs use data during this process. Moreover, it has specifically been asked how they
use data, for instance, which programs they use, who is responsible for this, and how to they
analyze data.
3.2 Interview Participants
Nine interviews have been conducted with ten interviewees. Thus, one interview has been con-
ducted with two participants. All participants work at SMEs in a leading role. These have been
inclusion criteria since the study deals with companies who are small- or medium-sized and it
is crucial that the participants have decision rights in the company. Besides, the companies are
clients of Leap, which ensures that they are engaging in innovation plans. The managing con-
sultant of Leap has been asked to select SMEs for the study. Those have first been contacted
by Leap to inform them about the research and afterwards have received an invitation by the
researcher to participate in the study. 20 SMEs have been contacted from which eight were
willing to participate. One more interviewee who is no client of Leap has been asked to partic-
ipate additionally by the researcher.
The included companies are all active in different industries, which can be seen in Table
3. Of the nine SMEs, six are small SMEs with less than 50 employees, and three are medium-
sized SMEs with more than 50 employees.
Table 3: Interview Participants
No. Industry No. of
employees Interviewee function
1 Nanotechnology 11-50
Business Development Di-
rector
Finance Manager
2 Logistics & Supply Chain 50+ CTO
3 Internet 11-50 CEO
4 Chemicals 11-50 CTO
5 Textiles 50+ R&D Manager
6 Leisure, Travel & Tourism 11-50 CEO
7 Mechanical/Industrial Engineering 11-50 Managing Director
8 Food & Beverages 11-50 CEO
9 Industrial Automation 50+ Project Manager
3.3 Data Analysis
The interviews were conducted using Google Meet since this allowed for an easy recording of
the interviews. The transcription has been done with the aid of Amberscript and by revising the
created transcript manually. In order to interpret and analyze the interview results, content anal-
ysis is used, in which the data is labeled and categories are created (Blair, 2015). An initial code
book has been created by defining the main code categories based on the literature. The subcat-
egories were then derived from the literature, as well. Since software packages such as ATLAS

22
TI require an initial effort to become proficient with the software (Blair, 2015), it has been
decided to code the data manually.
With the list of codes as a basis, the first and the last interview were coded by the re-
searcher and a second coder in order to see whether the initial codes are applicable and whether
there is consensus between the two coders. The first and the last interview have been chosen
due to the fact that insights that might be gained during the data collection phase can have an
impact on “follow-up questions or narrow the focus of observation” (Graneheim & Lundman,
2004). As a first step, the content has been reduced by summarizing the answers to each ques-
tion while taking care that no information is lost. Afterwards, the content has been divided into
the different main categories which have been defined with the aid of the literature. Finally,
subcategories have been used to structure the content in more detail. During this process, the
codebook has been refined based on the discussion between the researcher and the other coder
and supplemented by additional codes which derived from the interview data. Consequently,
the coding has been done deductively based on the literature and inductively based on the in-
terview data. This combination of deductive and inductive coding allows for an increased thor-
oughness as prior literature is considered and new findings can emerge from the interview data
(Thomas, 2006). The final codebook can be found in Appendix 3.
In order to analyze the results of the interviews, the data for the different interviews is
displayed according to the codes. Using such a data display is especially helpful when multiple
cases need to be compared (Forman & Damschroder, 2007). By organizing the data systemati-
cally according to the codes, patterns can be recognized more easily and the different cases can
be compared to each other and to the presented theory (Forman & Damschroder, 2007). More-
over, it can be identified how frequent specific concepts are mentioned by the participating
companies.
3.4 Validity, Reliability, and Generalizability
Validity, reliability, and generalizability are terms used in quantitative research. Validity refers
to whether the applied methods are appropriate so that the findings actually reflect the data
(Noble & Smith, 2015). Next to this, reliability represents whether results and processes are
replicable (Leung, 2015) and thus, whether the procedures are consistent (Noble & Smith,
2015). Generalizability is described as “the transferability of the findings to other settings and
applicability in other contexts” (Noble & Smith, 2015, p. 2). Even though these terms are used
for quantitative research mostly, qualitative research also aims to be trustworthy. Therefore,
Noble and Smith (2015) created alternative terminologies for the three terms which are more
suitable for qualitative research, which are truth value, consistency, and applicability.
The truth value (validity) is enhanced by giving each participant the same introduction
and also the same definition of data-driven decision-making and the innovation process. There-
fore, each participant starts with the same basis so that the results are comparable and reflect
the actual situation. Moreover, the discussion with a second coder increases the truth value.
Additionally, data triangulation has been used by examining the company websites, the social
media channels, and news releases. Furthermore, the audio recording and the transcribing al-
lows for revisiting the data multiple times in order to avoid misunderstandings. Besides, every-
thing has been documented including the communication with the interviewees, the interview
process, and the coding process.
The consistency (reliability) is ensured by a transparent documentation of the research
process. This includes the process of the literature review but also by explaining the process of
the interview conduction, transcription, and coding.
Applicability (generalizability) is enhanced by providing details of context for each par-
ticipating company and the study itself. This enables “the evaluation of study conclusions and
transferability to other […] units” (Noble & Smith, 2015, p. 3).

23
4 Results
This chapter describes the perceptions of the SMEs regarding data-driven decision-making.
This includes the understanding of data-driven decision-making, the preparations that SMEs
consider as necessary, as well as benefits and challenges. Next to this, systems in use and tech-
niques are presented. Furthermore, it is described how SMEs make decisions in the innovation
process in order to evaluate the extent of data-driven decision-making.
4.1 Data-Driven Decision-Making
4.1.1 Understanding of Data-Driven Decision-Making
When asked to define data-driven decision-making all participants gave a description of what
it entails according to them. As presented in the theory chapter, data-driven decision-making
refers to decisions which are based on the analysis of data instead of experience or intuition.
The individual understanding of data-driven decision-making of the participants can be seen in
Table 4. All participants stated that data-driven decision-making means that decisions are made
based on data.
Analysis is mentioned by four of the participants as part of data-driven decision-making.
This shows that these participants notice the importance of not just having data but also to
analyze the data in order to be able to make a decision based on it. Additionally, Participant 7
describes data-driven decision-making “as continuous positive feedback loop where you just
analyze what you have done and make decisions based on what you analyze”. Therefore, this
participant also indicates that data-driven decision-making is not a process with a fixed start
and end, but a continuous process. This is due to the fact that the data that you analyze lead to
decisions and these decisions again lead to new data based on which decisions can be made in
the future.
Table 4: Understanding of Data-Driven Decision-Making
Company Definition
Company 1 Looking into the market data and make decisions based on the analysis of this
data.
Company 2 For me it’s really just to use the data that you have to come to decisions. So
really to have some fundamentals behind your decisions rather than taking them
just on some gut feeling.
Company 3 You have to make decisions based on your feelings but also on data. For me
data-driven decision-making is that you make choices based on data.
Company 4 I would define it that you gather enough data to make a decision that fits best
with the situation you are in and is well thought of and not based on some kind
of emotional impulse.
Company 5 Data-driven decision-making means that you make decisions based on the anal-
ysis of data that you have.
Company 6 For me data-driven decision-making is collecting data, looking at what I want
to do in the future, analyze the data, and make a decision based on that.

24
Company 7 I would describe data-driven decision-making as continuous positive feedback
loop where you just analyze what you have done and make decisions based on
what you analyze.
Company 8 Data-driven decision-making is basically making a decision based on certain
facts, on data that you get.
Company 9 I would say it refers to Big Data normally. But data-driven decision-making can
mean a lot of things. You gather as much data as possible to make your decision
measurable. In the end, it’s of course, always also about feelings.
Feelings are also named by four of the participants. It is mentioned that data-driven
decision-making makes it possible to make decisions based on fundamentals and not just based
on own feelings. For instance, Participant 4 stated that data-driven decision-making leads to a
decision which “fits best with the situation you are in and is well thought of and not based on
some kind of emotional impulse”. However, it is also emphasized that “in the end, it’s of course,
always also about feelings” (Participant 9). Therefore, it is acknowledged by the participants
that data-driven decision-making can help to compensate for variations in feelings and opinions
of different people. Nevertheless, feelings cannot be fully disregarded.
However, four participants also expressed difficulties in defining data-driven decision-
making. For example, Participant 7 said: “I try to make objective decisions based on arguments
and numbers. And rational. But I’m not really sure if that is already data-driven decision-mak-
ing”. Participant 1A also stated that it is an abstract term which they do not use in the company.
Moreover, the daily business requires thousands of decisions and therefore, it is not clear to
Participant 1B which decisions are meant with data-driven decision-making. Furthermore, Par-
ticipant 9 was the only one to name Big Data. This led to the confusion whether decisions which
are not based on Big Data but on other data could also be referred to as data-driven decision-
making. Therefore, it has been important to give a definition to all participants of what data-
driven decision-making is.
The majority of the participants (seven participants) stated that data-driven decision-
making is becoming more important when the company grows. Participant 7, for instance, said:
“The need for data-driven decision-making is higher when you have a big company. We still
have a lot of face-to-face contact with the clients”. The other four participants also mentioned
that for a small company keeping track of everything without using data is easier. However,
“when the company is getting bigger and bigger, you also need more data to support your
decisions” (Participant 3). This is due to the fact that everybody needs to have an overview of
what current priorities are and on what basis decisions have been made. In consequence, the
participating SMEs consider data-driven decision-making to be more crucial for larger organi-
zations. However, they also see the necessity to implement it more in their businesses. For
instance, Participant 1A stated: “We definitely think that we need to implement data-driven
decision-making more”. Thus, in order to grow they consider it to be important to support their
decisions to a higher extent with data.
4.1.2 Preparations for Data-Driven Decision-Making
The preparations that the participants had to make or are planning to make in order to enable
data-driven decision-making are mainly in the areas of business processes, employee trainings,
and software. Four of the participants stated that adaptions in the business processes need to be
made. Participant 6 mentioned that the processes had to be changed in order to enable the col-
lection of relevant data. This has been done in the past at the company. Participant 5 said: “We
need to be able to measure more and we actually also need to do it. For that the processes of

25
how we do things here would need to be adapted”. This indicates that current business pro-
cesses might not be suitable to collect the necessary data.
Training for the employees has also been named as a necessary preparation four times.
Participant 6 stated: “Employees needed training to ensure that they also use the tools in a
correct way”. Participant 2 and 4 emphasized as well that training was necessary so that the
employees are able to analyze the data in a correct way. In contrast, Participant 9 said that his
company buys analyses from other companies which are specialized in it. Therefore, they know
that the necessary expertise is in place and they do not need to train their own employees in
that.
Another important preparation is the software of a company. Participant 1A talked about
the following plans: “We have plans to improve our ERP system. And to automate a lot of
things that we do manually now and to incorporate that in our ERP system”. This means that
there is still the need for an external to adapt the software of the company in order to improve
the possibilities for data-driven decision-making. At company 6, a software expert had been
hired to create a system which fits the needs of the company. Consequently, it can be seen that
own expertise in these fields might be lacking for smaller companies and that they are depend-
ent on the hiring of experts. Besides, Participant 2 stated that the systems which were used in
the company had to be changed in order to fit to the adapted processes.
4.1.3 Benefits of Data-Driven Decision-Making
Data-driven decision-making can offer benefits to companies. Those benefits perceived or ex-
pected by the participants can be seen in Table 5. Through this, it can be seen which benefits
are mentioned most.
Six participants argue that data-driven decision-making can lead to an increased speed.
Two different reasons for an increased speed have been identified during the interviews. First,
data-driven decision-making increases the probability that the right decision is made from the
start. Thus, later adaptions might not be necessary. Participant 9 argued: “It prevents you to
make a bad choice because in the end, it takes time and it takes a lot of money”. Second, the
decision-making itself is sped up. This is due to the fact that the data give you fundamentals to
decide on. As Participant 6 stated: “If you have clear data, you do not need much time to make
a decision because the situation is clear. You do not need to discuss about it”. This makes it
clear that the participants consider discussions to be easier when they have clear data with which
they can prove how something should be done. Therefore, data-driven decision-making in-
creases the speed due to less adaptions and due to a decreased need for long discussions.
Five of the participants generally stated that the usage of data to make decisions leads
to better decisions. This is due to the fact that it gives you more security, as Participant 3 said:
“It is nice when you make a decision and know that it is based on data because it gives you
more security in the decision-making”. It is also argued by Participant 4 that more data lead to
a higher security. This high security is important for the participants to make reliable decisions.
For instance, Participant 2 stated: “The decisions that you make are more reliable because you
have fundamentals to base it on because some people will always have a good story. But just
from talking to different people, you don’t always get a clear picture.” Hence, data-driven de-
cision-making can increase the reliability of decisions, which offers a higher security to com-
panies. This is why the participants consider data-driven decisions as better compared to deci-
sions which are not based on data.
Four of the eleven participants think that data-driven decision-making improves the
business performance. Participant 1A thinks: “I think the output will be higher, so the efficiency
will be higher. We would lose less days because we do not run out of stock” and Participant 1B
added: “We would not disappoint customers when there is no stock and we cannot supply”.
Based on that the company could sell more and improve the business performance as a result.

26
Company 2 uses data-driven decision-making in order to monitor developments within the
company and in the market. This enables them to react more quickly in case something is not
going as planned, which improves the performance. Participant 8 argued that processes can be
improved due to the analysis of data from previous projects. Consequently, the participants
experience and expect that data-driven decision-making can improve the overall business per-
formance of the company.
A competitive advantage can be a result of the usage of data-driven decision-making.
Three of the participants stated that the usage of data as a basis of the decisions can offer an
advantage with regards to competitors. For example, Participant 3 said: “It can help you to
make clients happier, which can give you an advantage compared to your competitors” and
Participant 6 mentioned: “It gives us a competitive advantage that we analyze data and actually
know what the customers ask for”. In consequence, it gets clear that data-driven decision-mak-
ing can help to discover what the customers actually prefer, which in turn can lead to a com-
petitive advantage.
Increased predictability is another possible benefit of data-driven decision-making.
Three companies experience or expect that data can help to predict what might happen in the
future. Participant 7 said: “Clients are, of course, unique. But eventually, if the numbers are
large enough, everyone’s the same”. Therefore, it is possible for the company to make predic-
tions about what different customer segments prefer. Also Participant 1A and 1B expect that
data-driven decision-making would help to improve the supply of the customers because the
stock can be adapted to the forecasted demand. In consequence, data-driven decision-making
improves the predictability in a company. This can be beneficial for discovering what customers
might buy in the future and to adapt the offerings and stock accordingly.
4.1.4 Challenges of Data-Driven Decision-Making
There are also challenges related to data-driven decision-making. Table 5 shows the challenges
perceived or expected by the participants with the frequency it has been mentioned. Through
this, it can be seen which challenge is perceived the most by the participating SMEs.
The data collection is a challenge which is mentioned by eight of the eleven participants.
Thus, it is the most-named challenge. There are two different facets of this challenge. First,
participants experience that the right data is not available. Participant 1B argued that “for a lot
of questions, the right data is not available because it is so unique”. This is also mentioned by
Participant 6 who claimed that “if you want to do new things, there is no data that can help
you, because nobody did that before”. The participants consider it to be difficult to collect data
when they do something which is new in the market. Second, there is the difficulty of gathering
enough data to base decisions on. For instance, Participant 4 stated: “You want to have a huge
amount of data to be certain that you make the right decision” and Participant 7 argued that for
a small company the client base is not as big as for large companies, which makes it more
difficult to gather enough data to make the outcomes significant. Therefore, data collection is
considered to be a challenge due to the fact that it is difficult to get the right data when doing
something new and because of the amount of data which would be necessary to get meaningful
results.
Four participants consider the data quality to be a challenge. As Participant 3 stated:
“The data needs to be correct. Otherwise you’re basing your decisions on wrong data and
that’s not what you want.” Basing decisions on data with a lower quality might also lead to
decisions which are not optimal. Therefore, it is crucial to check whether the quality of the data
which is used is sufficient. Participant 8 argues that “sometimes you take data too easy for
granted without checking if it’s valid or not. Sometimes you are maybe a bit too happy with
getting data, so that you don’t double check it.” Consequently, organizations should be aware
of the fact that the data quality has to be checked. Participant 2 suggests “to really keep on top

27
and try to find a process to make it easier, more understandable, and to have less errors. That’s
continuous.” Thus, it is crucial to continuously check the data quality to be sure that no deci-
sions are based on data which includes errors. For this a fixed process might help.
In order to enable data-driven decision-making, current processes need to be redefined.
This is perceived as a challenge by four of the participants. Participant 5 stated: “We always
lose information because not everything is documented. That is how we work. But if you want
to analyze the data, we would need to change our processes and document everything”. More-
over, Participant 1A mentioned that their processes in the company would need to be changed
in order to enable the usage of certain standard software. This would be necessary in case no
tailormade software is used. Therefore, the companies realize that the current processes might
be changed in order to enable data-driven decision-making. Participant 3 argued that they al-
ways redefine their process to improve it further. Thus, it is a continuous process to always
ensure that the processes are fitting to the current situation the company is facing.
Having suitable software can also be a challenge. Three of the participants consider it
to be difficult to find a software which is suitable for the company. Participant 1A and 5 stated
that they would not know which software to use because it would need to be adapted to the
current business processes of the organization. For instance, Participant 1A said: “I don’t rec-
ognize data-driven decision-making as a subject where people are selling software for. So it’s
not like SAP or Exact will deliver a package for SMEs where they say: ‘This is the data-driven
decision-making package’”. That is why Company 6 hired an IT specialist who created a soft-
ware especially for their purposes. If companies do not want to adapt the business processes to
fit to the standard solutions offered by companies, it could be a solution to let IT specialists
create tailor-made software for them. However, this might come at a higher cost than using
standard software.
Even though predictability is considered to be a benefit, unpredictability is considered
to be a challenge by three participants, from which two are from Company 1. The participants
claim that when a company does something new and is still growing, the predictability is lim-
ited. For instance, Participant 1B said: “So there’s no steady. If you have a company who does
the same for 20 years, then it’s easier to predict”. Also Participant 6 argued that “if you do
something for ten years, it’s easier to predict. But as soon as you do something completely new,
data-driven decision-making reaches its boundaries because there is no data”. This shows that
the participants consider it to be difficult to predict what might happen in the future because
they are still growing. Moreover, they state that it is not possible to find data to make predictions
about something completely new, such as a new product or service.
Although trainings were mentioned to be an important preparation, only two participants
stated that they experience the challenge of missing skills. Participant 8 mentioned that most of
the employees in the company have a technological background, which is crucial for the key
processes within the organization. Nevertheless, skills are missing for other areas, which would
help in getting and analyzing certain data. Due to limited resources, it does not seem to be
always possible for SMEs to hire employees with the necessary skills.
The organizational culture can also be a challenge. Two of the participants experience
challenges which are based on the culture of the organization. For instance, Participant 1B
stated that somebody else in the company is responsible for the software programs and that he
“does not ask: ‘What do you want from the data base?’”. Therefore, data that he needs is some-
times missing. Moreover, Participant 2 said that the subsidiaries in the different countries “do
things differently and that creates some struggles because you cannot really compare those
figures”. Therefore, it shows that participant experience different problems regarding the or-
ganizational culture. Nonetheless, it seems to stand out that predefined regulations and pro-
cesses could help to overcome this problem. Through regulations and defined processes, it
could be guaranteed that processes and documentations are the same in different subsidiaries
and that the needs of all users are considered in the creation of the software.
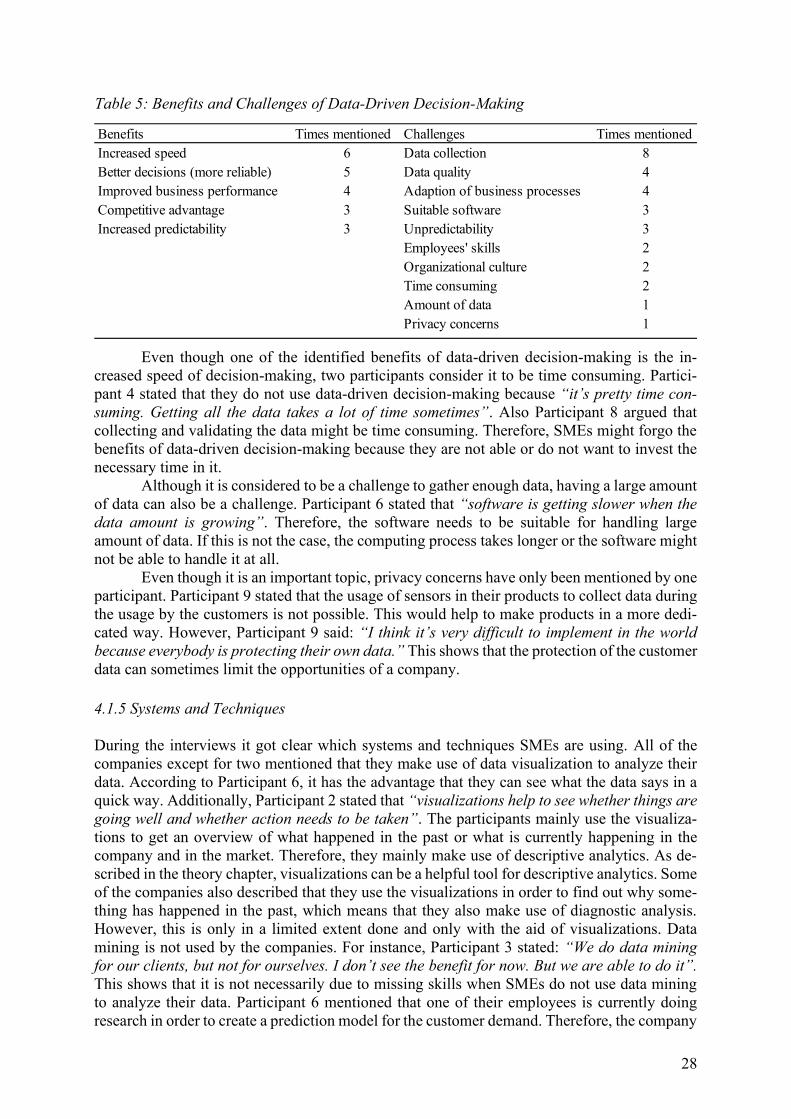
28
Even though one of the identified benefits of data-driven decision-making is the in-
creased speed of decision-making, two participants consider it to be time consuming. Partici-
pant 4 stated that they do not use data-driven decision-making because “it’s pretty time con-
suming. Getting all the data takes a lot of time sometimes”. Also Participant 8 argued that
collecting and validating the data might be time consuming. Therefore, SMEs might forgo the
benefits of data-driven decision-making because they are not able or do not want to invest the
necessary time in it.
Although it is considered to be a challenge to gather enough data, having a large amount
of data can also be a challenge. Participant 6 stated that “software is getting slower when the
data amount is growing”. Therefore, the software needs to be suitable for handling large
amount of data. If this is not the case, the computing process takes longer or the software might
not be able to handle it at all.
Even though it is an important topic, privacy concerns have only been mentioned by one
participant. Participant 9 stated that the usage of sensors in their products to collect data during
the usage by the customers is not possible. This would help to make products in a more dedi-
cated way. However, Participant 9 said: “I think it’s very difficult to implement in the world
because everybody is protecting their own data.” This shows that the protection of the customer
data can sometimes limit the opportunities of a company.
4.1.5 Systems and Techniques
During the interviews it got clear which systems and techniques SMEs are using. All of the
companies except for two mentioned that they make use of data visualization to analyze their
data. According to Participant 6, it has the advantage that they can see what the data says in a
quick way. Additionally, Participant 2 stated that “visualizations help to see whether things are
going well and whether action needs to be taken”. The participants mainly use the visualiza-
tions to get an overview of what happened in the past or what is currently happening in the
company and in the market. Therefore, they mainly make use of descriptive analytics. As de-
scribed in the theory chapter, visualizations can be a helpful tool for descriptive analytics. Some
of the companies also described that they use the visualizations in order to find out why some-
thing has happened in the past, which means that they also make use of diagnostic analysis.
However, this is only in a limited extent done and only with the aid of visualizations. Data
mining is not used by the companies. For instance, Participant 3 stated: “We do data mining
for our clients, but not for ourselves. I don’t see the benefit for now. But we are able to do it”.
This shows that it is not necessarily due to missing skills when SMEs do not use data mining
to analyze their data. Participant 6 mentioned that one of their employees is currently doing
research in order to create a prediction model for the customer demand. Therefore, the company
Benefits Times mentioned Challenges Times mentioned
Increased speed 6 Data collection 8
Better decisions (more reliable) 5 Data quality 4
Improved business performance 4 Adaption of business processes 4
Competitive advantage 3 Suitable software 3
Increased predictability 3 Unpredictability 3
Employees' skills 2
Organizational culture 2
Time consuming 2
Amount of data 1
Privacy concerns 1
Table 5: Benefits and Challenges of Data-Driven Decision-Making

29
is trying to develop a predictive analysis model, which can help to find out what might happen
in the future. In conclusion, it stands out that the SMEs in this research make mostly use of
descriptive analytics and only little of diagnostic and predictive analytics. A combination of the
different techniques could help in getting a more holistic view and might therefore be beneficial.
The system used for the data visualization which was named by most of the companies
is Excel. Eight of the companies explicitly mentioned that they use Excel in order to visualize
their data. It got clear that most of the participants consider Excel to be a simple tool, which is
not as sophisticated. For instance, Participant 9 said: “The way we do it, we don’t need software.
The common office stuff we use – Excel and PowerPoint”. Hence, Excel is used by most of the
participants, which can offer a good basis for data-driven decision-making. This is due to the
fact that it offers flexible data visualization functionalities which can be sufficient depending
on the needs of a company (Marr, 2020). Next to Excel, other tools are used as well by the
participants to get a visual overview of the data. For instance, Klipfolio is used to create a
dashboard with the most important figures and numbers by Company 3. Moreover, Company
8 creates a dashboard in the CRM system PerfectView, in which the numbers from, for instance,
finance and marketing are visualized.
To make data-driven decisions, visualization tools are important to present the data in a
more comprehensible way (Marr, 2020). However, some of the companies are not making use
of the full potential of data visualizations. For instance, PowerBI, Tableau, and QlikSense are
useful visualization tools for businesses (Marr, 2020). Marr (2020) also names Google Charts
as a free alternative, which can also be used by people who are less experienced.
4.2 Innovation Process of SMEs
In this chapter, it is presented how the organizations manage the different stages of the innova-
tion process and how decisions in these stages are made.
4.2.1 Idea Generation Phase
Customer requests and collaborations are for seven of the participating companies the main
source of new ideas for innovation. There are two different ways of how the companies involve
the customers in this process. However, both are a type of active involvement and not passive.
The first way is that the companies get a request of the customer. Participant 8 stated: “Typi-
cally, our customers come to us with a request or a need.” Furthermore, Participant 7 argued:
“Searching is also costing energy, of course. And all the clients can give you the direct infor-
mation that you really need.” This indicates that the companies rely on the ideas of the custom-
ers because they can save time and resources which can compensate for missing resources.
Moreover, this also ensures that the company is developing something for which there is cus-
tomer demand. Second, the companies can ask the customers actively for new ideas. This can
be done by either asking specific customers about their desires but also by sending surveys to
a larger number of customers in order to receive feedback and ideas. Company 6, for instance,
sends a survey to all the customers once a year, in which the customer is asked whether he/she
has ideas to improve what the company is offering. Through this survey, the company has a
pool of new ideas. The company is analyzing the results manually by reading the answers.
Nevertheless, if the customer base increases, the number of responses might also increase. In
that case, the usage of NLP might save time for the company. Furthermore, Company 4, 7, and
9 stated that they actively contact customers to ask them about current issues or ideas. Company
7, for instance, mentioned that they ask “customers what challenges they come across and what
they are doing at the moment to then develop solutions for their challenges”. Since the custom-
ers are contacted individually and in a limited number, manual consideration of their responses

30
is possible for the company. It gets obvious that the companies are not using any NLP or ma-
chine learning to analyze social media or forum posts. Additionally, one of the companies men-
tioned that they are collaborating with suppliers and knowledge institutes in order to identify
new ideas. Participant 4 said: “Besides, we talk a lot with suppliers and knowledge institutes.
And of course, they always work on totally new processes, products, etc. And that may inspire
us to innovate in that direction.” This shows that collaborating with suppliers or knowledge
institutes can give important insights into developments in the markets. Moreover, it can also
be the basis for a further collaboration in the innovation process, which might be beneficial to
compensate for missing resources at a small company.
Market research can provide companies with new ideas. Six of the companies stated that
they are doing market research to discover ideas for innovation. This includes that the compa-
nies are researching what competitors are doing but also that they look at publications in jour-
nals or newspapers. For example, Participant 7 mentioned that they regularly check scientific
publications to see what is currently done in the market. Moreover, Participant 6 looks at mag-
azines and newspapers to discover what the company could innovate. Besides, he is doing re-
search about which search terms consumers are using in Google to discover their current inter-
ests. This might be a good data basis to see what customers are actually interested in at the
moment. Moreover, Company 1 scans patents from other companies and people because
through this they can see: “What are developments? What is coming up? What are competitors
and customers doing? What is on their mind? What is their main interest at the moment?” This
is done in a manual way by scanning single patents.
Events such as seminars, conferences, or fairs are another source of new ideas for five
of the participating SMEs. Through this it is possible to identify developments and potentials
in the market, which the company might not have considered before. As Participant 6 stated:
“We want to learn from the best and that’s why we also want to learn from other companies,
industries, and fields. For this we visit fairs – to see what’s new”. Thus, fairs can be beneficial
for companies to discover how own offerings might be improved but also to identify ideas for
new offerings. Participant 5 mentioned that the innovations shown on fairs might be a good
basis for own innovations. In consequence, it can be said that visiting such events is not data
driven. However, it represents a good opportunity for an SME to get inspirations for new ideas.
In conclusion, it can be said that the extent to which the participating SMEs use data to
make the decision what they want to innovate is limited. However, it gets obvious that most of
the companies rely on the collaboration with customers. As identified in the theory chapter,
especially smaller companies can benefit from that as it can compensate a lack of resources
(Chang & Taylot, 2016). Consequently, the companies rely on the opinions and desires of cus-
tomers in order to make the right decisions. The participation of customers is not passive but
active. Hence, only individual customers are considered. However, most of the companies
stated that the products are also produced individually for one customer and not for a bigger
market. Moreover, the analysis of the data, which the companies get from the collaboration
with their customers or from the market research, is done in a manual way, which might cost
the companies time and effort.
4.2.2 Idea Selection Phase
The criteria for selecting an innovation idea is for most companies based on the expected profit
it can create for the business. Two of the participants stated, however, that the first thing they
look at is whether it fits to the company and whether they are capable of doing it. This is an
important question to consider since a realistic evaluation at this point in time can save expenses
and efforts created by the continuation of the process. Moreover, Participant 2 argued that it is
important to look at what is really the biggest issue and most urgent at the moment. Based on
this, it can be decided what has to be innovated first. Seven of the participants mentioned that

31
they calculate how much the innovation would cost and how much profit it could create in order
to calculate a net present value of the project. Participant 7 stated: “For us it’s rather straight-
forward. If the margin is big enough, you can decide if you like to proceed with the project”.
According to Participant 9, this calculation is done based on experience of previous projects.
Also for the other companies it does not seem to be based on data but more on experience. For
example, Participant 3 said: “We don’t use data to make choices about new innovations. It’s
about whether we think that we can do it.”
One company argued that they are collaborating in this phase with the customer. This is
due to the fact that the risk becomes too high if no customer is interested in the innovation.
Therefore, Company 8 prepares a business case calculation for an innovation idea and contacts
potential customers with that. Based on this, customers can decide whether they are interested
in the innovation and whether they would like to invest in it. Participant 8 said: “If there is no
customer in the second phase who is interested in our technology, then most of our projects are
already stopping right there because we are too small to take the risks.” This shows that smaller
companies are not able to fund big projects themselves without having specific customers in
prospect. Although the other participants did not mention that specifically, it seems to be also
true for some of them as well. Most of the participating companies are already relying on cus-
tomer requests in the search phase. Therefore, they already have specific customers who are
interested in the innovation, which decreases the risk for them.
The decision about which idea to select is mostly made internally by the higher man-
agement. For this, there mostly is a discussion between employees from departments, which
are involved in the innovation, and the management. The direction is responsible for the final
decision. In some cases, the customers are involved as well, for example in the case of Company
8. For this, they mostly contact customers individually but sometimes they also organize small
events in which they present and discuss their ideas with multiple potential customers. Out-
comes of this discussion might be a good basis for deciding which idea will be selected. None-
theless, none of the companies mentioned that they have a formal process for the selection of
ideas. Besides, the companies do not make use of any voting possibilities, even though by using
this, the opinion of the customers might be considered in an easy and fast way.
4.2.3 Development Phase
Knowledge Acquisition
In order to find out which knowledge is necessary and to acquire this knowledge, most of the
companies rely on collaborations with externals. Four of the participants mentioned that they
work together with their suppliers. During this collaboration, the suppliers provide the compa-
nies with knowledge and insights necessary to plan the implementation of the innovation. Par-
ticipant 7 said that suppliers “are willing to help you because they know that you are a good
customer”. Therefore, it is important to maintain a good relationship with suppliers in order to
be able to use their resources.
Three of the participants work together with knowledge institutes. Participant 4 stated:
“We have chemical knowledge but maybe not all the knowledge that we need. The knowledge
institute can do some fundamental research for us and we can transfer that into a product”.
Knowledge institutes are for many organizations important partners since they can provide
smaller companies with missing knowledge and data (Weber & Heidenreich, 2018). Therefore,
this is a cost-effective alternative for SMEs to get insights about, for instance, specific processes
or developments.
Customers can also be involved in the acquisition of the necessary knowledge. Two of
the participating companies mentioned that they work together with their customers in the ac-
quire phase of the innovation process. Participant 9, for example, argued that they have several
customers who they can contact in case they need support in the knowledge acquisition process.

32
Those customers do research for the company so that they can develop the innovation for the
customers. For smaller companies, also this collaboration can compensate for a lack of re-
sources.
Next to the collaborations with externals, own research is conducted. This has been
stated by four of the companies. For instance, Participant 7 stated: “First, you search yourself
for the information that you need for it. That’s by using the idea that everyone can learn every-
thing”. This emphasizes that internal employees can do research even though they might not
have a lot of experience with it. Participant 7 emphasizes that this is possible due to the internet
since a large amount of valuable information can be excessed there.
The acquire phase is for the companies mainly based on the collaboration with externals
and the data that these externals provide. Decisions about which skills and resources are neces-
sary are based on these insights. Especially for smaller companies, the collaboration with, for
instance, knowledge institutes can be beneficial since it can be a compensation for missing
knowledge and data.
Execution
To test how the final product will look like, the participating companies create prototypes. Also
in this phase, the customers can be involved. One of the participants mentioned that they involve
the customers to decide how the product should look like and which features it has to offer. By
doing so they want to make sure “that [they are] making the right choice and getting the right
data” (Participant 9). Through the involvement of the customers, it can be ensured that the
product is adapted to the customers’ needs. However, the involvement of customers at the com-
pany is only done on an individual basis and not via, for instance, wikis or forums. Next to the
involvement of customers, other externals, such as suppliers, can be involved in this phase. Two
of the participants mentioned that they involve partner companies by, for example, trusting the
expertise of those partners. This is also done on an individual basis and does not require the
analysis of data.
The prototypes itself are created in different ways at the participating companies. For
instance, Participant 1B said: “We find out a lot with 3D printing. We learn a lot from the parts
which come from there”. Using 3D printing can fasten the innovation process since it can be
used to test the innovation and can also be shown to consumers (Candi & Beltaugi, 2019). The
results of this can be analyzed and decisions can be made based on it. However, most of the
participating companies show a prototype to an individual customer, which means that also the
feedback is given directly to the company. At half of the companies, the decision whether the
prototype is sufficient and if not, how it needs to be changed is therefore done by the customer
and not based on the analysis of data. Digital prototypes are only used by the companies which
offer digital products. The other companies do not consider it to be value-adding for their prod-
ucts because “you need to experience how the product feels” (Participant 5). Additionally, Par-
ticipant 9 argued: “In the end, you can do everything from your computer. But in reality, you
always run into errors and problems”. Therefore, they do not make use of digital prototypes
although it can save designers around five to six weeks (Brossard et al., 2018). Participant 7
mentioned that they can often make use of existing prototypes from previous projects. For this,
it is important that the suitability of the prototype is also tested for the current project (Lindič
et al., 2011).
The decision how the process should be structured is made internally at all of the par-
ticipating companies. This is done without relying on the analysis of data but more on experi-
ence. Participant 5 stated: “If you know how to do in the lab, which steps you need, then we can
also do it like this in big in the production”. Therefore, the opinions of the employees who are
involved in the prototype phase are considered in this decision. Additionally, Participant 9 men-
tioned: “We are not that big of a company to directly set the process for the capacity which will
hopefully be running in a few years. We start slow. So we also have time to structure the

33
process”. Thus, SMEs often do not have the resources to set up the final process from the start.
Therefore, this decision about the process is done in steps. The companies did not mention that
they survey employees or other users of the final process. This could be useful because by
listening to their opinion their needs and knowledge are considered (Tidd & Bessant, 2018).
In conclusion, the decisions made in the execute phase are for most of the participating
SMEs not based on data but on the feedback of an individual customer or on own experience.
Involving the individual customers is still beneficial since they can provide valuable feedback
about whether current ideas are in line with their needs (Mirkovski et al., 2016). Only the two
companies who offer a software product make use of digital prototypes in order to test the
software.
4.2.4 Launch Phase
The decision of how the final innovation should look like before launching it is based on the
feedback of an individual customer for six of the companies. However, two of the participants
use a test user group in order to find out whether the current design fulfills their need. Those
two companies offer software, which makes it possible to provide it to the test user group dig-
itally. Participant 3 said: “So we can test our product in a test phase and we can ask users if it
is user-friendly and if it does what it needs to do”. This ensures that the software provides the
functionalities the users demand and that every feature is understood by the users. “They help
us by looking at it from an external perspective. Their feedback is via meetings, for example
calls or emails”, Participant 2 mentioned. Including users in the testing can be beneficial be-
cause it can also indicate for which functionalities customers would pay a premium and which
are not demanded by the customers (Zhan et al., 2017). Also the literature indicates that espe-
cially software can be tested with consumers (Russo-Spena & Mele, 2012). One of the partici-
pants mentioned that his company uses a test market for new innovations. Participant 6 stated:
“We test something new in a small part of the market and look how it performs. So we test
whether people demand it and decide based on the collected data if we roll it out”. This test
shows whether it makes sense to actually launch the innovation in the whole market. Based on
quantitative data, which is collected during the test phase, the company decides whether the
innovation is profitable enough to roll out. Through this, the probability of launching an inno-
vation which becomes a failure can decrease. It gets clear that a test user group or a test market
is only used by the two companies which provide software products and by the B2C company.
Also no customer surveys or A/B testing are used by the other companies because they align
the innovation to the needs of individual customers and not to a larger target group.
For the promotion it stands out that most of the companies stated that they actually do
not do any promotion. For instance, Participant 5 mentioned: “Actually, we don’t have any
marketing. Our sales people go to potential customers and tell them what we have but we do
not promote our products otherwise”. This is due to the fact that they consider their market to
be relatively small so that potential customers already know them. Also Participant 1A stated
that they barely do any promotions expect for promoting their products on their own websites.
In contrast, other participants aim to find a suitable strategy for their promotion. For example,
Participant 6 argued that the decision of how to promote their innovations is mainly driven by
the cost efficiency. He states, for instance: “As a small company our marketing budget is lim-
ited, so we need to use it in a controlled way. If you use the internet, such as Google, everything
is transparent and you get data for everything so that you can understand and retrace it”.
Therefore, for an SME, the decisions about how to promote the innovation might be based on
the costs relating to it. Furthermore, Participant 7 stated that they recently decided to involve a
marketing agency which will take care of the promotion. This is due to the fact that the resources
are missing to do it within the company. The two companies who make use of a test user group
consider the test users’ feedback in order to determine how to promote the innovation. By

34
analyzing the feedback, they know which value propositions are most important to the consum-
ers and can focus on those in the communication. Therefore, these companies use data to decide
how to promote their innovation. This can be beneficial since the innovation might seem more
appealing to the consumers when communicating the most important features.
The price decision is made by all of the companies by doing a cost calculation. In this
calculation, all of the costs associated to the innovation are included and added up. Next to this,
the participants stated that they add a margin to come to the final price. This margin is based
on different aspects. Participant 8 mentioned that this margin is also based on the exclusivity
of the project: “If the customer wants exclusivity, we calculate that in the price because we
cannot sell it to other customers then. That’s of course much more costly for us”. Additionally,
Participant 5 said that the margin also changes depending on the amount the customer orders.
Participant 6 said: “Every week we look at how expensive it is at other sites, do a comparison
and adapt prices accordingly”. For this, they create visualizations of the price developments
of competitors. Moreover, they also analyze the capacity utilization and adapt the prices in case
they are not fully booked. In consequence, most of the companies mostly base the decision
about the pricing on the costs related to the innovation. However, some adaptions are made by
changing the margin. Company 6 is using a dynamic approach, which takes competing offer-
ings and changes in the demand into consideration. This approach can lead to an improved
financial performance (Omar et al., 2019). Furthermore, it seems like it is especially appropri-
ated for the tourism industry.
Since most of the participating companies create an innovation for a specific customer,
the decision about where to launch the innovation does not need to be made anymore. However,
Company 6 mentioned that they do a market analysis in order to elaborate where the demand
is the highest. Participant stated: “We look at data of, for instance: How many people live in
that region? How often do they search for the innovation on Google? How high is the purchas-
ing power?” Thus, by doing this analysis they find out in which region the consumers are de-
manding the innovation and are actually able to buy it. Consequently, this decision is based on
data for Company 6. For the other companies it is not based on data.
Overall, the companies which offer digital software and the one B2C company use data
in their decision-making in the launch phase. The other companies base their decisions mostly
on the feedback of individual customers and on internal calculations which are based on exist-
ing knowledge about the process and experience.
4.2.5 Post-Launch Adaption Phase
After the innovation has been launched, three of the companies do not make adjustments to the
innovation. Therefore, the decision of how the innovation can be sustained for the long term is
not made at those companies. Company 5, for instance, argued: “Products are not developed
without the request of a specific customer and afterwards, not that much is happening any-
more”. This might be due to the fact that each customer receives a product adjusted to their
individual needs. Other customers do not receive the same product and thus, it is not necessary
to make changes to it after it has been sold. Participant 4 stated something similar: “Most of
our products are pretty unique for one customer”. Hence, Company 4 has the same reason as
Company 5 for not making adjustments to the product after the launch. However, Participant
1B states a different reason for his company: “It is very difficult to make changes in the phar-
maceutical market. Then you have to make a dossier on every change. I think in some other
markets it will be easier”. This indicates that depending on the industry a company is operating
in, changes to a product might be difficult to make and are connect to a high effort.
Two participants mentioned that the analysis of the customers’ behavior is helping in
deciding whether the innovation has to be changed. Participant 6 stated that every week they
make a comparison between the to-be and the as-is state in order to find out what is performing

35
good and what is performing worse than expected. Based on this, it is decided which innovation
or which feature needs to be adapted. Participant 3 said: “With, for example, Google Analytics
we know which functions customers are using and which not and if they find their way in the
application. So we track the visitors’ usage of the software and on that basis we make improve-
ments”.
A customer survey is used to discover improvement potentials by three of the compa-
nies. All three participants stated that the customers get a short survey in order to find out
whether they have been satisfied with the services and the products of the company. For in-
stance, Participant 7 said that they use the results of the survey “to improve the process and
meet up with clients expectations, which is really hard because not all clients expect the same”.
Using surveys to receive feedback can be an important source of improvement potentials
(Bosch-Sijtsema & Bosch, 2015). Two of the companies make use of rating scale questions in
order to receive a numerical value which can be compared easily. However, through this, they
do not get insights into the reasoning behind the given score. One of the three companies makes
use of open questions in order to receive improvement potentials. However, Participant 7 states:
“We analyze the survey results in a crappy way. The answers are collected in a portal at the
back end of the website but it’s not really analyzed. It’s flat text which is just read by an em-
ployee and forwarded to the quality manager”. By making use of sentiment or semantic anal-
ysis, this process might be sped up because the employee would not need to filter all the answers
first. Additionally, Participant 7 mentioned that they use employee suggestions in order to im-
prove processes and products after the launch. Through this, insights are gathered from the
work floor. Next to the customer feedback via online surveys, direct customer feedback is used
by the companies to improve their innovations. This is done on an individual customer basis.
Participant 3 argued: “We try to stay in contact with the users of our products and we learn
from their experience. It is important to listen to data but also to listen to the customers about
their experience”. Through this, they can discover improvement potentials.
The collection of quality data is used by four of the companies to find out what needs
to be improved. This includes that the companies are keeping record of which problems occur
and how high the quality of the product is. Through this, they can see which problems keep
occurring and can try to find a solution for it. This is documented and visualized by the com-
panies so that they can see quickly where improvement potential exists. Participant 2, for ex-
ample, mentioned: “We keep track of all the problems that occur. We have a new automated
dashboard for it”. The other companies still look at the data in a manual way, which “takes a
lot of time” (Participant 9). However, the monitoring of the quality of the products can ensure
that quality issues are discovered and can be changed timely.
Sensors in the products are not used by the participating companies. Nonetheless, Par-
ticipants 9 stated that “if you could use sensors in the product – if that’s allowed by the cus-
tomer, of course – then you would get so much data. You could learn what do with your prod-
ucts”. Through this, it would be possible to improve the products based on the actual usage of
the customers. However, “it’s really difficult to implement in the world because everybody is
protecting their data” (Participant 9). This could also be a reason why the other companies are
not using sensors in their products, although it is helpful to identify consumer needs (Ervelles
et al., 2016).
In conclusion, the sustain phase is based on data by the majority of the companies. This
is done in different way, such as using online analytics, online surveys, or the usage of a quality
documentation. Through this, the companies try to ensure that the innovation is sustained for a
longer time by listening to the experience of the customer and by monitoring the quality level.

36
4.2.6 Learn Phase
In order to learn from the innovation process and improve it accordingly, four of the companies
stated that they make use of process indicators. These process indicators include, for instance,
a percentage of requests that actually become a product or the comparison between precalcu-
lated costs and actual costs. Participant 4 said: “We monitor these indicators and we set a per-
centage for it. And if it does not meet it, we need to find out why”. With the process indicators,
the companies can discover whether there is the necessity to adapt the process. Therefore, the
decision whether the innovation process needs to be changed can be done based on this data.
Four companies use management meetings to decide whether the innovation process
needs to be changed. In those meetings, the management discusses whether they see the need
for a change in the process and how they could change it. This can be based on the process
indicators but also on experience. For instance, Participant 5 said: “That’s more based on ex-
perience. We look at what is going well and what not and how it can be improved”. Conse-
quently, the companies who do not make use of process indicators do not use data but experi-
ence as a basis for this decision. Next to this, Participant 7 argued that it is important to include
the employees in this decision because their experience can be valuable and the employees “feel
heard about their complaints or suggestions and that makes them feel committed to the com-
pany. When they see that their suggestions are implemented, it’s something they’re proud of”.
This indicates that even if the decision is based on experience and not on data it is important to
not only consider the opinion and experience of the management but also of the work floor
employees.
In conclusion, four of the companies actually make use of process indicators as a basis
for deciding whether the innovation process needs to be adapted. The other companies base this
decision on experience. By basing it only on experience, important field of actions might be
overlooked. Besides, none of the companies makes use of benchmarking, which might be help-
ful to see how other companies manage their innovation process (Tidd & Bessant, 2018).
4.2.7 General Overview
Table 6 provides an overview of what the participating companies use as the basis for their
decisions in the different stages of the innovation process. The list includes methods which are
based on the literature but also additional ones mentioned by the participants. Therefore, it in-
cludes methods which are data-driven and ones which are not. Thus, the left column shows
whether it is data-driven (DD) or rather whether it is likely to be data-driven. The table also
makes it possible for the SMEs to see where there might be room for improvement. Some of
the companies may also use a method without analyzing data, even though it is a method for
which it would be possible. Furthermore, there might be improvement potential for the usage
of data for companies even though they already make use of data-driven decision-making.
In the idea generation phase, the most used methods are ones which are not data-driven,
namely to rely on individual customer requests or collaborations with single customers and to
visit events such as conferences, seminars, or fairs. However, five of the SMEs explicitly men-
tioned that they search for inspiration by looking into current literature or by analyzing what
competitors are doing. Therefore, data also plays an important role for SMEs in the search
phase. Some of the SMEs also use other data-driven methods, such as conducting an online
customer survey or looking at existent patens from other companies.
The selection of ideas is done at eight of the companies by the management team. There-
fore, this is not based on a data-driven method. The most important criterium for the selection
is for seven of the companies the potential profit of the innovation. The calculation of how
much profit it might create can be based on experience but also on the analysis of market po-
tentials.

37
In order to acquire the necessary knowledge and to decide which skills and resources
are necessary for an innovation, most of the companies rely on collaborations with either
knowledge institutes, suppliers, customers, or other partners. Through these collaborations the
SMEs receive research results including data based on which they can decide what is necessary.
The two other companies rely on own research through which they also receive data which is
analyzed for the decision.
For the execution part in the development phase, it stands out that the participating com-
panies are following different strategies. Next to this, this phase is not data-driven for almost
all of the participating companies. Only two companies rely on digital prototypes since they
provide software to their customers. In general, the decisions about how the innovation should
look like is based on experience and on the desires of an individual customer. Therefore, this
phase is not data-driven for most of the participants.
Also in the launch phase, most of the companies do not rely on data to make decisions.
Six of the companies stated that they consider the feedback of individual customers in order to
decide how the final innovation should look like. Moreover, also six of the companies use a
cost-plus calculation in combination with the addition of an individual margin as basis for the
price of the innovation. There are, however, three of the participating companies (Company 2,
3, and 6) which use more data-driven decision-making in this phase since they use a test group
or a test market to define the final design, the promotion, and also rely on an analysis of the
market to determine the price.
In the post-launch adaption phase, more data-driven decision-making is used. Four com-
panies rely on the analysis of data about the quality of the innovation in order to discover fields
of action, two use the analysis of customer behavior online and three conduct online surveys in
order to identify improvement potentials. One of the companies uses also quantitative data to
analyze where there is potential for improvement.
Four of the participating companies use data in the learn phase for the decision whether
the innovation process needs to be adapted. This data results from the usage of process indica-
tors, such as a comparison between the pre-calculated and the actual costs. The other five com-
panies rely on experience and the discussion within the management team. In consequence,
these companies do not make use of data-driven decision-making in the learn phase.
In general, it gets obvious that there are similarities at the nine companies. The majority
of the companies make decisions in the innovation process in collaboration with individual
customers. Therefore, data is only used for particular decisions. For instance, two companies
(Company 4 and 5) stated that they do not use data-driven decision-making. Nonetheless, there
are also differences between the companies, which can also be seen in Table 6. It especially
stands out that the companies which offer digital products (Company 2 and 3) and the one B2C
company (Company 6) use data-driven decision-making to a higher extent.
Table 6: Basis for Decision-Making in the Innovation Process
DD Basis for decision-making 1 2 3 4 5 6 7 8 9
Idea Generation
✓ Data from social media, websites, etc.
✓ Existing patents from other companies ✓
✓
Literature and market research (e.g. competitors,
journals) ✓ ✓ ✓ ✓ ✓
✓ Focus group discussions
✓ Social media for active involvement of customers

38
✓ Crowdsourcing
Individual customer requests and collaborations ✓ ✓ ✓ ✓ ✓ ✓ ✓
✓ Customer survey or feedback ✓ ✓
Supplier and knowledge institutes collaborations ✓
Seminars, conferences, fairs, etc. ✓ ✓ ✓ ✓ ✓ ✓
✓ Employee online suggestions
Idea Selection
Criteria
Fit to company ✓ ✓
✓ Potential profit ✓ ✓ ✓ ✓ ✓ ✓ ✓
Customer willing to collaborate ✓
Way
Higher management makes decision ✓ ✓ ✓ ✓ ✓ ✓ ✓ ✓
Customers make decision ✓
Formal process for selection
✓ Voting on social media by customers
✓ Voting by employees
Development
Knowledge Acquisition
✓ Collaboration with research or knowledge institutes ✓ ✓ ✓
✓ Collaboration with suppliers ✓ ✓ ✓ ✓ ✓
✓ Collaboration with customers ✓ ✓
✓ Collaboration with other partners ✓
✓ Own research ✓ ✓ ✓ ✓
Experience ✓
Execution
✓ Design: Involvement of users/customers ✓
✓ Design: Involvement of employees
✓ Design: Involvement of other externals, e.g. suppliers ✓ ✓
✓ Design: Crowdsourcing on social media
Design: Show prototypes to individual customer ✓ ✓ ✓ ✓ ✓ ✓ ✓
✓ Design: Digital prototypes ✓ ✓
✓ Design: 3D printing for prototypes ✓
Design: Adaption of proven concepts ✓
✓ Structures: Surveying employees and other users
Structures: Individual employees decide ✓
Structures: Decision made in steps ✓
Launch
✓ Final design: Testing with users/customers ✓ ✓
✓ Final design: Test market ✓

39
✓ Final design: A/B testing
✓ Final design: Online customer survey
Final design: Feedback of individual customer ✓ ✓ ✓ ✓ ✓ ✓
✓ Promotion: Analysis of testing phase ✓ ✓
Promotion: Involvement of suppliers/other stakeholders
✓ Promotion: Analysis of competing offerings
Promotion: No promotion except for own website ✓ ✓
Promotion: Based on cost efficiency ✓
Promotion: Marketing agency ✓
✓ Price: Analysis of customer preferences or competitors ✓ ✓
✓ Price: Consideration of dynamics in the market ✓
Price: Cost calculation plus margin ✓ ✓ ✓ ✓ ✓ ✓
✓ Location: Market research about demand, etc. ✓
✓ Location: Analysis of competing offerings
Location: For specific or limited number of customers ✓ ✓ ✓ ✓ ✓ ✓
Post-Launch Adaption
✓ Online surveys to receive feedback ✓ ✓ ✓
✓ Quantitative data, e.g. sales data ✓
✓ Analysis of customer behavior online ✓ ✓
Direct customer feedback ✓
✓ Text data from social media, etc.
✓ Usage of sensors embedded in product
No change after launch ✓ ✓ ✓
✓ Analysis of data about quality of innovation ✓ ✓ ✓ ✓
Employee suggestion ✓
Learn
✓ Post-project reviews at end of project ✓ ✓ ✓ ✓
Benchmarking
Experience ✓ ✓ ✓ ✓ ✓ ✓ ✓
Employee suggestion ✓
Management meetings
✓
✓ ✓ ✓

40
5 Discussion
5.1 Theoretical Implications
5.1.1 Perception of data-driven decision-making
The first research question deals with SMEs’ perception of data-driven decision-making. The
research reveals the following dimensions of data-driven decision-making according to the par-
ticipating SMEs. First, data-driven decisions are decisions which are based on data. Second,
the analysis of the data is necessary in order to create meaning from the data. Third, feelings
are still part of the decision-making, but the analysis of data ensures that feelings are not the
main driver. Fourth, data-driven decision-making has to be seen as a continuous process.
Through this, the current literature is extended by indicating what SMEs’ understanding of data-
driven decision-making is. This is interesting since the usage of data analytics is lagging behind
at SMEs compared to large companies (Parra & Tort-Martorell, 2016). However, the results
reveal that data-driven decision-making can be difficult to define for SMEs, which might be
due to the fact that they do not know to what extent a decision needs to be based on data in
order to call it data-driven. This raises the need for a more comprehensive definition in order to
increase the understanding. Furthermore, the interviews show that the SMEs consider data-
driven decision-making as more important when a company is becoming larger. For an SME
with a lower number of customers it seems to be easier to talk individually to a customer and
to fulfill individual requirements. This gets more difficult when the company grows. Moreover,
it might also become more difficult to keep an overview of the business when the organization
is larger due to an increasing number of employees. For this, it can be helpful to make use of
data-driven decision-making because decisions can be justified more easily.
In order for SMEs to make use of data-driven decision-making, some preparations are
necessary. There might be the necessity to adapt current business processes. With current busi-
ness processes it might not be possible to implement the collection or the analysis of the data.
Next to this, employees need to be trained before being able to make use of data-driven deci-
sion-making. Otherwise skills might be missing and data might be misinterpreted. Moreover, it
seems like own expertise for implementing suitable software is often missing at SMEs. If the
preparations are not made, data could be misinterpreted, which could lead to a competitive
disadvantage (McAfee & Brynjolsson, 2012; Reijkumar et al., 2018).
The theory suggested that data-driven decision-making offers advantages to companies.
These advantages suggested by theory are competitive advantage, improved business perfor-
mance, increased speed, and smarter and more efficient decisions. The research shows that the
participating SMEs are aware of these benefits. Besides, they also added that increased predict-
ability is another advantage of data-driven decision-making. This shows that data-driven deci-
sion-making is indeed a core competence to be successful (Reijkumar et al., 2018) – also for
SMEs. However, the results show that data-driven decision-making also comes along with chal-
lenges. The literature suggested that the corporate culture, privacy concerns, data quality, suit-
able tools, employees’ skills, and the definition of the business processes might be challenges
related to data-driven decision-making. All of those have also been mentioned by the partici-
pants. Next to those, the participants added that the data collection, the unpredictability, the
time consumption, and the amount of data are also challenges which they perceive or expect.
From this, the data collection is perceived as the biggest challenge for most of the companies,
which indicates that there is room for improvement at SMEs especially regarding the collection
of data.
The results indicate that SMEs mostly make use of descriptive analytics. This might be
due to its simpler nature compared to diagnostic, predictive, and prescriptive analytics.
41
However, it would be helpful to use a combination of all four methods. By doing so, the com-
panies could create a more holistic view (Frazzetto et al., 2019). Next to this, the SMEs do not
make use of the full potential of data visualizations due to mostly relying on Excel. By making
use of other software, the analyses could be enhanced. Since the companies only make use of
visualizations of the data, there are also potentials regarding the usage of other techniques, such
as data mining or text mining, for instance NLP or machine learning. This can be helpful since
a considerable amount of the data found online is in textual form.
5.2.2 Data-driven decisions in the innovation process
The second research question is about to what extent data is used to support decisions in the
innovation process of SMEs. In the idea generation phase, the SMEs mostly rely on customer
requests and seminars, conferences, or fairs, which shows that the decision about what could
be innovated is not based on data for most of the participating SMEs. This might be due to the
desire for personal contact to the customers. Since the SMEs in this sample have a limited
number of customers, personal contact and also the individual personalization seems to be pos-
sible. Furthermore, involving the customers is a good way to compensate for a lack of resources
(Chang & Taylor, 2016) and can help to ensure that the innovation fulfills the customers’ de-
mands. Nevertheless, by focusing only on customer requests, important opportunities might be
missed by an SME. The SMEs in this research do not make use of social media or online forums
to search for new ideas. This could be because the reach of SMEs – and especially those active
in the B2B area – on social media seems to be limited and therefore, the interaction between
customers and the company could be low. Next to this, the companies might not consider it to
be necessary to interact with their customers on social media since they try to stay in contact
with the customers on an individual basis.
The decision about which innovation to select for implementation, is made by calculat-
ing the potential profit and using this as a decision basis. Therefore, this decision is not made
on intuition by the SMEs. That the companies rely on this data, implies that they do not want
to take high risks related to an innovation which might not lead to a profit. Moreover, the se-
lection is made by the higher management in most of the cases and the customers are only
involved in one of the participating SMEs. This might be due to the fact that the participating
SMEs mostly do not select an idea from a larger pool of ideas but focus on one request of a
customer at a time. Other employees are mostly not involved in making the decision at the
SMEs, which could be due to simpler hierarchies and a higher involvement of the higher man-
agement in the daily business compared to larger organizations. Furthermore, the research re-
vealed that the SMEs in this sample do not have a formal process for the selection of their ideas,
which could limit the success of the innovations (Eling et al., 2016). This might be because
SMEs consider their innovation projects as not frequent or large enough in order to require a
formal process.
For the development phase, the results reveal that the knowledge acquisition is based
on data to a high extent for the SMEs. Suppliers and universities are often involved due to the
fact that it can compensate for missing resources in a small company (Weber & Heidenreich,
2018). Therefore, the SMEs do not need to hire own researchers but can profit from the exper-
tise of other companies/institutes. Next to this, SMEs also conduct own research, which might
be to keep the control over the project and to save time. In the execution stage of the develop-
ment phase, most of the SMEs in this sample do not base their decisions on data. This is since
the companies mostly rely on experience from previous projects and on the feedback of indi-
vidual customers. Involving a higher number of customers in this phase might be considered to
be too time consuming or not effective enough. However, the involvement of individual cus-
tomers can still be beneficial since it can provide valuable feedback about whether current ideas
are in line with the customer’s needs (Mirkovski et al., 2016). Digital prototypes are only used

42
by the SMEs which offer digital products because the other SMEs do not consider it to have an
added value. Experiencing the physical product can therefore be seen as important to the SMEs.
The research also shows that the decisions in the launch phase are for the majority of
the participating SMEs not based on data. For the final design, this might be because they want
to satisfy one individual customer and not a larger target group. Nonetheless, the results indicate
that testing concepts with users might be easier for SMEs which offer digital products. The one
B2C SME uses a test market, which provides important insights about the possible success of
an innovation. The other participating SMEs do not make use of that because they only target
individual B2B customers. Therefore, the feedback of the customers is received directly via,
for instance, meetings or email communication without the need for collecting larger amounts
of data. Furthermore, most of the SMEs do not promote their new innovations but sell it to the
customer who requested it, as they might believe that other customers do not have the same
demand. However, opportunities might be lost by not promoting it since potential customers
are not aware of the product. For the decision about the price, a cost calculation plus margin is
used as a basis by the majority of the SMEs, which is due to the fact that the SMEs do not want
to take the risk that costs are not covered, which would lead to a loss. However, also competing
offerings are not taken into account in a sophisticated way by the majority of the companies,
which might be because they consider offerings of competitors as not similar enough to com-
pare it. The SMEs do not research where to best launch the innovation, which is because they
do not launch it for a bigger market but for a specific customer. The B2C company in this
sample conducts research about the market and about possible locations in order to reach a
bigger target group and ensure the success of the innovation.
The majority of the SMEs in this research use data in the post-launch adaption phase to
measure the quality and the success of the innovation. Through this they want to ensure that the
innovation is creating a profit and that the quality is sufficient so that customers do not get
dissatisfied. Three of the companies also send out customer surveys, through which they receive
interesting insights which can be used to improve the innovation. By doing so, the companies
want to make sure that customers keep being satisfied and the innovation stays successful in
the long term. However, the analysis of the results is done without using more sophisticated
analytics. Semantic or sentiment analysis might be good additions. Also for companies which
do not offer software the usage of analytics, such as Google Analytics, can help in finding out
which products/services are most demanded by analyzing what customers search for on the
company’s website. That some of the companies do not change their innovations after the
launch is because they only produced it for one individual customer. In consequence, they do
not consider that other companies might be interested in the same product after slightly adapting
the innovation. Through this, opportunities might be missed by the companies. Also in this
phase, social media is not used by the companies to decide whether the innovation has to be
adapted. Again, this might be due to the lower reach of SMEs on social media and the focus on
individual customers.
Almost half of the participating SMEs uses data in order to decide whether the innova-
tion process itself needs to be adapted. For this, they use process indicators which show whether
there is the necessity for an adaption. This seems to be a suitable way for the SMEs due to its
measurability. However, the remaining SMEs do only rely on experience and the results of
management meetings. This might also be partly because they do not have a defined innovation
process and thus, also no defined procedure on how to measure or improve it. Benchmarking is
not used by the companies, which could be because the SMEs assume that competitors are not
similar enough regarding their products or services.
In general, it can be said that the extent of data-driven decision-making depends on the
phase of the innovation process. For instance, in the execution of the development phase most
of the SMEs do not base their decisions on data. This shows that there is the potential to imple-
ment it to a higher extent. The identified benefits of provide a motivation to SMEs to implement

43
data-driven decision-making. Faster and more reliable decisions are also crucial for the inno-
vation process and might therefore be a motivation to implement it to a higher extent in the
future. Nonetheless, SMEs need to understand what data-driven decision-making entails and
which possibilities there are related to it. So far, it seems like SMEs do not make use of data
for many decisions in the innovation process because they do not know that and how it can
provide a benefit for a specific decision. Therefore, it is important that it will be researched in
more detail for which decisions in the innovation process data can provide the strongest ad-
vantage. Moreover, especially the data collection seems to be difficult for SMEs, which shows
that SMEs needs to improve their data collection processes in order to be able to enjoy the
benefits of data-driven decision-making in the innovation process.
However, there are also differences between the participating SMEs. Two of the SMEs
stated that they do not use data-driven decision-making at all. Both of these companies are
producing textiles, which might indicate that SMEs in this industry use data-driven decision-
making to a lower degree. Surprising is that there are companies who do barely document any-
thing, which makes it almost impossible to analyze any data. Moreover, especially the two
SMEs which offer digital products make use of data-driven decision-making to a higher extent,
which can be due to the acquaintance with the digital environment. Besides, the participating
B2C company is using data to support many of their decisions. This might be because the B2C
company wants to reach as many customers as possible and thus, analyzes their behavior in
order to investigate how to best reach them. In contrast, the B2B companies have less customers
but customers buy larger amounts. Thus, they might not feel the necessity to analyze the be-
havior of the whole target group but focus on individual customers.
5.2 Practical Implications
Next to the theoretical implications, there are practical implications for the participating com-
panies and other SMEs. The participants acknowledge that data-driven decision-making is cru-
cial when an organization is becoming larger. Therefore, in order to grow, they need to consider
implementing data-driven decision-making to a higher extent in their innovation process. More-
over, SMEs need to adapt their business processes in such a way that data collection becomes
possible so that they have a basis for their analysis. In case own expertise for implementing
suitable software is missing, the SMEs should hire experts for it. By using not only descriptive
analytics but also diagnostic, predictive, and prescriptive analytics, the SMEs can create a more
holistic view. Next to this, it could be beneficial for the SMEs to not only focus on data visual-
izations but to also make use of other techniques, such as text mining.
In the idea generation phase of the innovation process, patents can be a good way to
elaborate what other companies in the market are doing. This is only considered by one of the
participating SMEs and offers therefore a potential for the other companies. It can be done in
an automated way by using text mining (Woo et al., 2019), but also the manual way can provide
interesting insights and can help to not lag behind competitors. Besides, using social media
could add value by providing an easy and cheap way to stay in contact with customers. Through
this they can receive feedback which might offer inspiration for new innovations. This is also
possible with a smaller reach on social media.
By involving customers in the idea selection phase, insights about the customers’ pref-
erences can be taken into account by the SMEs. Next to this, involving other employees than
the higher management might offer the benefit that their experience can complement the deci-
sion-making (Onarheim & Christensen, 2012). Therefore, the SMEs should consider involving
those employees in the decision-making. Furthermore, the definition of a formal process on
how to select an innovation can be helpful to create an equal basis for different innovation
projects.

44
Basing the decisions in the execution part of the development phase to a higher extent
on data can add new insights for the SMEs and might thus improve the innovations. For this,
the customers can be involved in this phase but also other partners might be able to add value
due to a high expertise. Moreover, the usage of digital prototypes can help to make the decision
about the design faster (Brossard et al., 2018). Therefore, the companies should consider it for
the first prototypes of new innovations.
In the launch phase, some of the SMEs do not promote their innovations. However, by
promoting it with the benefits it can offer to customers, new customers might be acquired. Alt-
hough the innovation has been demanded by a specific customer, other customers might have
a similar demand. For the pricing decision, the SMEs should also analyze competing offerings
to not offer a product with a too high or too low price depending on the demanded positioning
in the market.
In the post-launch adaption phase, the SMEs should acknowledge that after launching
an innovation for an individual customer, other companies/consumers might be interested in
something similar. Therefore, they need to consider to slightly adapt the innovation also after
it has been launched. Additionally, social media should also be taken into account in order to
identify how the innovation needs to be adapted. Also smaller companies can build up an inter-
action with their customers on social media.
The SMEs should not only consider the opinion and experience of the management in
order to make decisions in the learn phase. Instead, they should take the opinion of the employ-
ees who are involved in the innovation process into account. By doing so, the employees feel
appreciated and might be more motivated. Additionally, using benchmarking can offer benefits
to the SMEs because it allows to see how other companies manage their innovation process,
which could give interesting ideas for an improved approach.
5.3 Limitations
There are limitations of the research, which should be acknowledged. First, due to the qualita-
tive nature of this research with the conduction of nine interviews, generalizing the findings is
not possible. Therefore, the results shown in this research do not indicate that other SMEs do
not use data-driven decision-making in different ways and to a different extent. Even in this
research, the participating SMEs showed differences in terms of extent and way of usage of
data-driven decision-making in their innovation process.
Second, it has to be considered that single informant bias can be a methodological lim-
itation. This is because in eight of the nine interviews, only one interviewee participated for
each company. This decreases the validity of the research because the interviewed participant
of the SME might not have all relevant information in order to provide a holistic overview of
the practices of the company.
Third, it is impossible to indicate precisely what the extent of data-driven decision-mak-
ing for each decision in the innovation process is. This is due to the fact that it has not specifi-
cally been asked for each of the decisions separately. Instead, the extent of data-driven decision-
making for the various decisions in the innovation process is based on the interpretations made
by the researcher. Consequently, the actual extent of data-driven decision-making might deviate
from the results presented in this research.
5.4 Directions for future research
There are further venues of research, which should be considered in the future. First, it should
be considered to focus on creating a more comprehensive definition of data-driven decision-
making due to the difficulties in defining it for the participating SMEs. Through this, it will be

45
clearer to SMEs what data-driven decision-making entails and whether it could add value to
them. When the understanding and the added value of data-driven decision-making becomes
clearer, more SMEs might consider implementing it to a higher extent.
Second, in order to create generalizable results, a quantitative research study can be
conducted. The quantitative research can create statistically significant results. For instance, it
can be tested in which phase of the innovation process it is most important to base the decisions
on data in order to increase the success rate of a company’s innovations. In case of a qualitative
design, future research can avoid single informant bias by interviewing multiple participants
from one company. This can ensure that all relevant aspects of one company are taken into
account and a holistic picture is created. Through this, the validity of the research can be in-
creased. In the future, it might be interesting to research qualitatively how SMEs can implement
data-driven decision-making to a higher extent by interviewing SMEs which have more expe-
rience with it.
Third, a research concerning data-driven decision-making in the innovation process of
SMEs should be conducted separately for B2B and B2C companies. In this current research,
only one B2C company has been involved. However, it got clear that there are differences be-
tween this company and the other participating B2B companies. Therefore, it is interesting to
investigate whether this difference remains when a larger sample of B2B and B2C are included.
Consequently, conclusions can be drawn on whether B2C companies are using data-driven de-
cision-making to a higher extent or in a different way than B2B companies.
5.5 Conclusion
This study has shown to what extent SMEs use data-driven decision-making in their innovation
process. For this, the SMEs’ perception of data-driven decision-making and the extent of data-
driven decision-making in their innovation process have been investigated by conducting semi-
structured interviews with nine SMEs. This study shows that there is a basic understanding of
the term data-driven decision-making but also that there is the need for a more comprehensive
definition. This is important so that SMEs understand the concept and how it can add value to
their company. Furthermore, it is argued that data-driven decision-making comes along with
benefits as well as challenges, which are acknowledged by the participating SMEs. Moreover,
the results indicate that the extent of data-driven decision-making is different for the participat-
ing SMEs, which can be, for instance, due to the products/services they offer or the industry in
which they are active. Finally, the research shows that there is room for improvement regarding
the data usage in the innovation process of SMEs. There are multiple possibilities highlighted
in this study which the SMEs do not make use of, which offer potential for the future. None-
theless, due to the beforementioned limitations of this study, future research is necessary to
create generalizable results.

46
References
Agostini, L., Galati, F., & Gastaldi, L. (2019). The digitalization of the innovation process –
Challenges and opportunities from a management perspective. European Journal of
Innovation Management, 23(1), 1-12. DOI 10.1108/EJIM-11-2019-0330
Baba, V. V., & HakemZadeh, F. (2012). Toward a theory of evidence based decision mak-
ing. Management Decision, 50(5), 832–867.
https://doi.org/10.1108/00251741211227546
Blair, E. (2015). A reflexive exploration of two qualitative data coding techniques. Journal of
Methods and Measurement in the Social Sciences, 6(1),
14. https://doi.org/10.2458/v6i1.18772
Breuer, P., Moulton, J., & Turtle, R. (2013). Applying advanced analytics in consumer com-
panies. Retrieved from McKinsey: https://www.mckinsey.com/industries/consumer-
packaged-goods/our-insights/applying-advanced-analytics-in-consumer-companies
Broniecki, P., & Hanchar, A. (2017). Data innovation for international development: An over-
view of natural language processing for qualitative data analysis. In 2017 Internatio-
nal Conference on the Frontiers and Advances in Data Science (FADS) (pp. 92-97).
IEEE.
Brossard, M., Erntell, H., & Hepp, D. (2018). Accelerating product development: The tools
you need now. Retrieved from McKinsey: https://www.mckinsey.com/business-func-
tions/operations/our-insights/accelerating-product-development-the-tools-you-need-
now
Brynjolfsson, E., & McElheran, K. (2016). The rapid adoption of data-driven decision-ma-
king. In American Economic Review (Vol. 106, pp. 133–139). American Economic
Association. https://doi.org/10.1257/aer.p20161016
Brynjolfsson, E., Hitt, L., & Kim, H. (2011). Strength in numbers: How does data-driven de-
cision-making affect firm performance? In International Conference on Information
Systems 2011, ICIS 2011 (Vol. 1, pp. 541–558). AIS/ICIS Administrative Office.
https://doi.org/10.2139/ssrn.1819486
Candi, M., & Beltagui, A. (2019). Effective use of 3D printing in the innovation pro-
cess. Technovation, 80–81, 63–73. https://doi.org/10.1016/j.technova-
tion.2018.05.002
Cao, G., Duan, Y., & Li, G. (2015). Linking business analytics to decision making effective-
ness: A path model analysis. IEEE Transactions on Engineering Management, 62(3),
384-395.
Chang, W., & Taylor, S. A. (2016). The effectiveness of customer participation in new prod-
uct development: A meta-analysis. Journal of Marketing, 80(1), 47–64.
https://doi.org/10.1509/jm.14.0057
Chen, H., Chiang, R. H., & Storey, V. C. (2012). Business intelligence and analytics: From
big data to big impact. MIS quarterly, 1165-1188.
Coleman, S., Göb, R., Manco, G., Pievatolo, A., Tort-Martorell, X., & Reis, M. S. (2016).
How Can SMEs Benefit from Big Data? Challenges and a Path Forward. Quality and
Reliability Engineering International, 32(6), 2151–2164.
https://doi.org/10.1002/qre.2008
Cooper, R. G., & Kleinschmidt, E. J. (1986). An investigation into the new product process:
Steps, deficiencies, and impact. The Journal of Product Innovation Management,
3(2), 71–85. https://doi.org/10.1016/0737-6782(86)90030-5
Delen, D., & Zolbanin, H. M. (2018). The analytics paradigm in business research. Journal of
Business Research, 90, 186–195. https://doi.org/10.1016/j.jbusres.2018.05.013

47
Eling, K., Griffin, A., & Langerak, F. (2016). Consistency Matters in Formally Selecting In-
cremental and Radical New Product Ideas for Advancement. Journal of Product In-
novation Management, 33, 20–33. https://doi.org/10.1111/jpim.12320
Erevelles, S., Fukawa, N., & Swayne, L. (2016). Big Data consumer analytics and the trans-
formation of marketing. Journal of Business Research, 69(2), 897–904.
https://doi.org/10.1016/j.jbusres.2015.07.001
European Commission. (2015). What is an SME? Retrieved from European Commission:
https://ec.europa.eu/growth/smes/business-friendly-environment/sme-definition_en
Eveleens, C. (2010). Innovation management; a literature review of innovation process mo-
dels and their implications. Science, 800(2010), 900.
Fichman, R. G., Dos Santos, B. L., & Zheng, Z. (2014, June 1). Digital innovation as a funda-
mental and powerful concept in the information systems curriculum. MIS Quarterly:
Management Information Systems. University of Minnesota.
https://doi.org/10.25300/misq/2014/38.2.01
Forman, J., & Damschroder, L. (2007). Qualitative content analysis. In Empirical methods for
bioethics: A primer. Emerald Group Publishing Limited.
Frankenberg, K., Weiblen, T., Csik, M., & Gassmann, O. (2013). The 4I-framework of busi-
ness model innovation: a structured view on process phases and challenges. Interna-
tional Journal of Product Development, 18, 249-273. DOI:
10.1504/IJPD.2013.055012
Frazzetto, D., Nielsen, T. D., Pedersen, T. B., & Šikšnys, L. (2019). Prescriptive analytics: a
survey of emerging trends and technologies. VLDB Journal, 28(4), 575–595.
https://doi.org/10.1007/s00778-019-00539-y
Füller, J., Matzler, K., Hutter, K., & Hautz, J. (2012). Consumers' creative talent: Which cha-
racteristics qualify consumers for open innovation projects? An exploration of asym-
metrical effects. Creativity and Innovation Management, 21(3), 247-262.
Gama, F., Frishammar, J., & Parida, V. (2019). Idea generation and open innovation in SMEs:
When does market‐based collaboration pay off most?. Creativity and Innovation Ma-
nagement, 28(1), 113-123.
Ganotakis, P., & Love, J. H. (2012). The innovation value chain in new technology-based
firms: Evidence from the U.K. Journal of Product Innovation Management, 29(5),
839–860. https://doi.org/10.1111/j.1540-5885.2012.00938.x
Graneheim, U. H., & Lundman, B. (2004). Qualitative content analysis in nursing research:
Concepts, procedures and measures to achieve trustworthiness. Nurse Education To-
day, 24(2), 105-112.
Gubbins, C., & Dooley, L. (2014). Exploring Social Network Dynamics Driving Knowledge
Management for Innovation. Journal of Management Inquiry, 23(2), 162–185.
https://doi.org/10.1177/1056492613499203
Gürdür, D., El-khoury, J., & Törngren, M. (2019). Digitalizing Swedish industry: What is
next?: Data analytics readiness assessment of Swedish industry, according to survey
results. Computers in Industry, 105, 153–163. https://doi.org/10.1016/j.com-
pind.2018.12.011
Hammedi, W., Van Riel, A. C. R., & Sasovova, Z. (2011). Antecedents and consequences of
reflexivity in new product idea screening. Journal of Product Innovation Manage-
ment, 28(5), 662–679. https://doi.org/10.1111/j.1540-5885.2011.00831.x
He, W., & Wang, F. K. (2016). A process-based framework of using social media to support
innovation process. Information Technology and Management, 17(3), 263-277.
Hofstetter, R., Aryobsei, S., & Herrmann, A. (2018). Should You Really Produce What Con-
sumers Like Online? Empirical Evidence for Reciprocal Voting in Open Innovation
Contests. Journal of Product Innovation Management, 35(2), 209–229.
https://doi.org/10.1111/jpim.12382

48
Hoornaert, S., Ballings, M., Malthouse, E. C., & Van den Poel, D. (2017). Identifying new
product ideas: waiting for the wisdom of the crowd or screening ideas in real time.
Journal of Product Innovation Management, 34(5), 580-597
Hossain, M., & Islam, K. Z. (2015). Ideation through online open innovation platform: dell
ideastorm. Journal of the Knowledge Economy, 6(3), 611-624.
Jacobs, D., & Snijders, H. (2008). Innovation routine: how managers can support repeated in-
novation. Stichting Management Studies.
Klingebiel, R., & Rammer, C. (2014). Resource allocation strategy for innovation portfolio
management. Strategic Management Journal, 35(2), 246–268.
https://doi.org/10.1002/smj.2107
Kolomvatsos, K., & Hadjiefthymiades, S. (2017). Learning the engagement of query proces-
sors for intelligent analytics. Applied Intelligence, 46(1), 96–112.
https://doi.org/10.1007/s10489-016-0821-z
Leech, B. L. (2002). Asking questions: Techniques for semistructured interviews. In PS - Po-
litical Science and Politics (Vol. 35, pp. 665–668). American Political Science Asso-
ciation. https://doi.org/10.1017/S1049096502001129
Leung, L. (2015). Validity, reliability, and generalizability in qualitative research. Journal of
Family Medicine and Primary Care, 4(3), 324. https://doi.org/10.4103/2249-
4863.161306
Liberatore, M. J., Pollack-Johnson, B., & Heller Clain, S. (2017). Analytics capabilities and
the decision to invest in analytics. Journal of Computer Information Systems, 57(4),
364–373. https://doi.org/10.1080/08874417.2016.1232995
Lindič, J., Baloh, P., Ribire, V. M., & Desouza, K. C. (2011). Deploying information techno-
logies for organizational innovation: Lessons from case studies. International Jour-
nal of Information Management, 31(2), 183–188. https://doi.org/10.1016/j.ijin-
fomgt.2010.12.004
Long, Q. (2018). Data-driven decision making for supply chain networks with agent-based
computational experiment. Knowledge-Based Systems, 141, 55–66.
https://doi.org/10.1016/j.knosys.2017.11.006
Love, J. H., Roper, S., & Bryson, J. R. (2011). Openness, knowledge, innovation and growth
in UK business services. Research Policy, 40(10), 1438–1452.
https://doi.org/10.1016/j.respol.2011.05.016
Marr, B. (2020). The 9 Best Tools For Data Visualization Available Today. Forbes. Retrieved
from: https://www.forbes.com/sites/bernardmarr/2020/05/22/the-9-best-analytics-
tools-for-data-visualization-available-today/#70b73dd84743
McAfee, A., & Brynjolfsson, E. (2012). STRATEGY & COMPETITION Big Data: The
Management Revolution. Harvard Business Review, 90(10), 60–68.
Meyer, C., McGuire, T., Masri, M., & Shaikh, A.W. (2013). Four steps to turn Big Data into
action. Retrieved from McKinsey: https://www.mckinsey.com/business-func-
tions/marketing-and-sales/our-insights/four-steps-to-turn-big-data-into-action
Mirkovski, K., Von Briel, F., & Lowry, P. B. (2016). Semantic learning-based innovation
framework for social media. It Professional, 18(6), 26-32.
Mount, M., & Martinez, M. G. (2014). Social media: A tool for open innovation. California
Management Review, 56(4), 124–143. https://doi.org/10.1525/cmr.2014.56.4.124
Mousavi, S. M., Torabi, S. A., & Tavakkoli-Moghaddam, R. (2013). A Hierarchical Group
Decision-Making Approach for New Product Selection in a Fuzzy Environ-
ment. Arabian Journal for Science and Engineering, 38(11), 3233–3248.
https://doi.org/10.1007/s13369-012-0430-z
Mulgan, G., & Albury, D. (2003). Innovation in the public sector. Strategy Unit, Cabinet
Office, 1(1), 40.

49
Muninger, M. I., Hammedi, W., & Mahr, D. (2019). The value of social media for innovation:
A capability perspective. Journal of Business Research, 95, 116–127.
https://doi.org/10.1016/j.jbusres.2018.10.012
Nambisan, S. (2018). Architecture vs. ecosystem perspectives: Reflections on digital innova-
tion. Information and Organization, 28(2), 104–106. https://doi.org/10.1016/j.infoan-
dorg.2018.04.003
Nambisan, S., Lyytinen, K., Majchrzak, A., & Song, M. (2017). Digital Innovation Manage-
ment: Reinventing Innovation Management Research in a Digital World. MIS Quar-
terly, 41(1), 223–238. https://doi.org/10.25300/misq/2017/41:1.03
NewVantage Partners. (2012). Big Data Executive Survey: Themes & Trends. Retrieved from
NewVantage Partners: http://newvantage.com/wp-content/uploads/2012/12/NVP-
Big-Data-Survey-Themes- Trends.pdf, Access on: 30.12.2012.
Niebel, T., Rasel, F., & Viete, S. (2019). BIG data–BIG gains? Understanding the link be-
tween big data analytics and innovation. Economics of Innovation and New Techno-
logy, 28(3), 296-316.
Nishikawa, H., Schreier, M., & Ogawa, S. (2013). User-generated versus designer-generated
products: A performance assessment at Muji. International Journal of Research in
Marketing, 30(2), 160-167.
Nooteboom, B. (2000). Learning and innovation in organizations and economies. OUP Oxford.
O'Brien, K. (2020). Innovation types and the search for new ideas at the fuzzy front end: Where
to look and how often?. Journal of Business Research, 107, 13-24.
Omar, Y. M., Minoufekr, M., & Plapper, P. (2019). Business analytics in manufacturing: Cur-
rent trends, challenges and pathway to market leadership. Operations Research Per-
spectives, 6. https://doi.org/10.1016/j.orp.2019.100127
Onarheim, B., & Christensen, B. T. (2012). Distributed idea screening in stage-gate develop-
ment processes. Journal of Engineering Design, 23(9), 660–673.
https://doi.org/10.1080/09544828.2011.649426
Opdenakker, R. (2006). Advantages and disadvantages of four interview techniques in quali-
tative research. Forum: Qualitative Social Research, 7(4), Art. 11.
Parra, X., & Tort-Martorell, X. (2016). Assessment of information-driven decision-making in
the SME. In Proceedings of the 21st International Conference on Information Qual-
ity, ICIQ 2016. MIT Information Quality Program.
Poetz, M. K., & Schreier, M. (2012). The value of crowdsourcing: can users really compete
with professionals in generating new product ideas?. Journal of product innovation
management, 29(2), 245-256.
Provost, F., & Fawcett, T. (2013). Data Science and its Relationship to Big Data and Data-
Driven Decision Making. Big Data, 1(1), 51–59.
https://doi.org/10.1089/big.2013.1508
Rejikumar, G., Aswathy Asokan, A., & Sreedharan, V. R. (2018, February 17). Impact of
data-driven decision-making in Lean Six Sigma: an empirical analysis. Total Quality
Management and Business Excellence, pp. 1–18. Routledge.
https://doi.org/10.1080/14783363.2018.1426452
Rindfleisch, A., O’Hern, M., & Sachdev, V. (2017). The Digital Revolution, 3D Printing, and
Innovation as Data. Journal of Product Innovation Management, 34(5), 681–690.
https://doi.org/10.1111/jpim.12402
Ross, J. W., Beath, C. M., & Quaadgras, A. (2013). You may not need big data after all. Har-
vard Business Review, 91(12).
Rothwell, R. (1994). Towards the Fifth-generation Innovation Process. International Marke-
ting Review. https://doi.org/10.1108/02651339410057491

50
Russo-Spena, T., & Mele, C. (2012). “Five Co-s” in innovating: A practice-based view. Jour-
nal of Service Management, 23(4), 527–553.
https://doi.org/10.1108/09564231211260404
Salerno, M. S., Gomes, L. A. D. V., Da Silva, D. O., Bagno, R. B., & Freitas, S. L. T. U.
(2015). Innovation processes: Which process for which project? Technovation, 35,
59–70. https://doi.org/10.1016/j.technovation.2014.07.012
Schweitzer, F. M., Buchinger, W., Gassmann, O., & Obrist, M. (2012). Crowdsourcing: Le-
veraging innovation through online idea competitions. Research-Technology Ma-
nagement, 55(3), 32-38.
Sedera, D., Lokuge, S., Grover, V., Sarker, S., & Sarker, S. (2016). Innovating with enterprise
systems and digital platforms: A contingent resource-based theory view. Information
and Management, 53(3), 366–379. https://doi.org/10.1016/j.im.2016.01.001
Sengupta, A., & Dev, C. S. (2011). Service innovation: Applying the 7-i model to improve
brand positioning at the Taj Holiday Village Goa, India. Cornell Hospitality Quar-
terly, 52(1), 11–19. https://doi.org/10.1177/1938965510371443
Standing, C., & Kiniti, S. (2011). How can organizations use wikis for innovation? Technova-
tion, 31(7), 287–295. https://doi.org/10.1016/j.technovation.2011.02.005
Stockstrom, C. S., Goduscheit, R. C., Lüthje, C., & Jørgensen, J. H. (2016). Identifying valua-
ble users as informants for innovation processes: Comparing the search efficiency of
pyramiding and screening. Research Policy, 45(2), 507–516.
https://doi.org/10.1016/j.respol.2015.11.002
Thomas, D. R. (2006). A General Inductive Approach for Analyzing Qualitative Evaluation
Data. American Journal of Evaluation, 27(2), 237–246.
https://doi.org/10.1177/1098214005283748
Tidd, J., & Bessant, J. (2009). Managing Innovation: Integrating Technological, Market and
Organizational Change. Chichester, England: John Wiley & Sons.
Tidd, J., & Bessant, J. (2018). Managing Innovation: Integrating Technological, Market and
Organizational Change (3rd ed.). John Wiley & Sons.
Trabucchi, D., & Buganza, T. (2019). Data-driven innovation: switching the perspective on
Big Data. European Journal of Innovation Management, 22(1), 23–40.
https://doi.org/10.1108/EJIM-01-2018-0017
Troisi, O., Maione, G., Grimaldi, M., & Loia, F. (2019). Growth hacking: Insights on data-
driven decision-making from three firms. Industrial Marketing Management.
https://doi.org/10.1016/j.indmarman.2019.08.005
Tobiassen, A. E., & Pettersen, I. B. (2018). Exploring open innovation collaboration between
SMEs and larger customers. Baltic Journal of Management.
Tumbas, S., Berente, N., & vom Brocke, J. (2018). Digital innovation and institutional entre-
preneurship: Chief Digital Officer perspectives of their emerging role. Journal of In-
formation Technology, 33(3), 188–202. https://doi.org/10.1057/s41265-018-0055-0
Urbinati, A., Bogers, M., Chiesa, V., & Frattini, F. (2019). Creating and capturing value from
Big Data: A multiple-case study analysis of provider companies. Technovation, 84–
85, 21–36. https://doi.org/10.1016/j.technovation.2018.07.004
Verloop, J., & Wissema, J. G. (2004). Insight in innovation: managing innovation by under-
standing the laws of innovation. Elsevier.
Walsh, J. P., Lee, Y. N., & Nagaoka, S. (2016). Openness and innovation in the US: Collabo-
ration form, idea generation and implementation. Research Policy, 45(8), 1660-1671.
Weber, B., & Heidenreich, S. (2018). When and with whom to cooperate? Investigating
effects of cooperation stage and type on innovation capabilities and success. Long
Range Planning, 51(2), 334–350. https://doi.org/10.1016/j.lrp.2017.07.003
Wielki, J. (2015). The social and ethical challenges connected with the big data phenome-
non. Polish Journal of Management Studies, 11(2), 192–202.

51
Witell, L., Kristensson, P., Gustafsson, A., & Löfgren, M. (2011). Idea generation: customer
co‐creation versus traditional market research techniques. Journal of Service Ma-
nagement.
Woo, H. G., Yeom, J., & Lee, C. (2019). Screening early stage ideas in technology develop-
ment processes: a text mining and k-nearest neighbours approach using patent infor-
mation. Technology Analysis & Strategic Management, 31(5), 532-545.
Yarmohammadi, M., Rezvani, M., & Alborzi, M. (2017). How Complementors Screen new
Product Ideas: A Qualitative Multiple Case Study. In European Conference on Inno-
vation and Entrepreneurship (pp. 669-676). Academic Conferences International Li-
mited.
Yoo, Y., Henfridsson, O., & Lyytinen, K. (2010). The new organizing logic of digital innova-
tion: An agenda for information systems research. Information Systems Re-
search, 21(4), 724–735. https://doi.org/10.1287/isre.1100.0322
Zhan, Y., Tan, K. H., Ji, G., Chung, L., & Tseng, M. (2017). A big data framework for facili-
tating product innovation processes. Business Process Management Journal, 23(3),
518–536. https://doi.org/10.1108/BPMJ-11-2015-0157

52
Appendix 1: Literature Review
On the database Web of Science, a literature review has been conducted. The search terms and
filters can be seen below with the according number of results. In some articles, articles or
books have been cited which were helpful for this paper. These have been used, as well.
Types of decision
Search terms:
"types of decisions" OR "types of decision" OR "decision
types" OR "decision type" 769
Refined by
Document types Article OR Book chapter 709
Web of science categories
Management OR Psychology Social OR Business OR
Psychology Applied OR Psychology Multidsciplinary 116
Languages English OR German 113
Publication years 2001-2020 92
Reading abstract 24
Full text 13
Data-driven Decision-Making
Search term
"data-driven decision making" OR "data-based
decision making" OR "data-driven decision-making"
OR "data-based decision-making" OR
"evidence-based decision-making" OR "evidence-
based decision making" 1848
Publication year 2011-2020 1480
Document type
ARTICLE OR BOOK REVIEW OR BOOK CHAPTER OR
REVIEW 1211
Categories
MANAGEMENT OR COMPUTER SCIENCE THEORY
METHODS OR COMPUTER SCIENCE ARTIFICIAL
INTELLIGENCE OR COMPUTER SCIENCE
INFORMATION SYSTEMS OR COMPUTER SCIENCE
SOFTWARE ENGINEERING OR BUSINESS OR
COMPUTER SCIENCE INTERDISCIPLINARY
APPLICATIONS 112
Abstract 32
Full text 16
Innovation
Search terms
"innovation management process" OR "digital innovation" OR
"Innovation process phases" OR "phases of innovation process" OR
"innovation process stages" OR "stages of innovation process" OR
"innovation process" AND "stages" OR "Innovation process" And
"phases" OR "process of innovation" 5058
Categories Management OR business 632
Document type Article OR review OR book chapter 443
Language English OR German 414
Years 2011-2020 303
Index Social Science Index 218
Abstract 64
Full text 29

53
Decisions innovation process
Search terms "idea search" OR "idea screening" 118
Refined by
Publication years 2011-2020 84
Languages English 83
Abstract 18
Full text 9
Search terms "idea generation" AND innovation 698
Refined by
Publication years 2011-2020 529
Languages English OR German 528
Index Social Science Index 285
Categories Management OR Business 173
Abstract 20
Full text 5
Search terms
commercialization AND "innovation process" OR launch AND "innovation
process" OR implementation AND "innovation
process" OR prototyping AND "innovation process" 770
Publication years 2011-2020 553
Language English OR German 529
Index Social Science 214
Abstract 43
Full text 12

54
Appendix 2: Interview Questionnaire
I am conducting this interview as part of my master thesis. Through this, I aim to find out how
data can be used to support the decisions in the innovation process.
There are no right or wrong answers, it is only about your personal experiences and opinions.
Furthermore, your answers are anonymous, thus, nobody will know that you gave these an-
swers. You can always say when you want to stop with this interview or do not want to answer
a specific question.
Do you agree to the interview being recorded so that I can transcribe it afterwards?
1 Participant
1.1 What is your current position in the company?
1.2 What are your responsibilities (in short)?
1.3 Since when are you in this position?
2 Data-driven decision-making
2.1 How would you define “data-driven decision-making”? → refers to decisions based on
analysis of data instead of experience or intuition. An example: company is analyzing text
data, e.g. from social media or customer forums by using text mining to find out how the
current product/service should be changed in order to increase customer satisfaction.
2.2 Do you currently use data-driven decision-making? If not, are you planning to do so?
2.3 Why do you (consider to) use data-driven decision-making? Why don’t?
2.3.1 Which benefits do you experience or expect?
2.4 Did you make preparations for data-driven decision-making or do you plan to do so? E.g.
Adaption of corporate culture, consideration of privacy concerns, data quality and soft-
ware, trainings for employees, definition of process
2.5 Which challenges do you expect or experience for your SME regarding data-driven deci-
sion-making? E.g. missing/not suitable software, missing skills, data amount and quality,
data collection
3 Innovation process
The innovation process can be divided into different phases, which are idea generation, idea
selection, development, launch, post-launch adaption, and learn.
In the idea generation phase, you are looking for opportunities for innovation and scan the en-
vironment for new ideas.
3.1 How do you decide what you can innovate as a company?
3.2 Where do you search for new ideas?
The idea selection phase is about selecting which of the ideas you want to choose for further
development.
3.3 How do you decide which idea should be progressed and which not?
3.4 Based on what criteria do you decide which idea should be selected?
The development phase is about acquiring the necessary knowledge and resources for the in-
novation. Afterwards, the acquired knowledge and skills have to be transformed into actions
and output. This can include the creation of prototypes and the set-up of structures.
Knowledge acquisition
3.5 How do you know which skills and knowledge you need in order to implement the inno-
vation?
3.6 How do you gain the knowledge and skills? E.g. collaborations

55
Execution
3.7 How do you decide how the innovation should look like? Design etc.
3.8 How do you develop prototypes?
3.9 How do you decide how the implementation/launch will be structured?
The launch phase is about the actual commercialization of the innovation.
3.10 How do you decide how the actual product should look like?
3.11 How do you decide how you promote the innovation?
3.12 How do you decide how much the innovation should cost?
3.13 How do you decide where and when you want to launch the innovation?
The post-launch adaption phase is about sustaining the innovation for the long term, which
includes monitoring and adjusting the innovation.
3.14 How do you decide whether the innovation needs to be adapted after the launch?
The learn phase is about learning throughout the process in order to improve the innovation
process itself.
3.15 How do you decide whether the innovation process itself can be improved?

56
Appendix 3: Code Book
Understanding of data-driven decision-making
Code Description
Description of data-driven decision-making How the participants define data-driven de-
cision-making
Problems in defining The participants experiences problems in
defining what data-driven decision-making
is
Perceived benefits
Code Description
Better decisions Data can improve the decisions made
Competitive advantage DDD lead to a competitive advantage
Improved business performance The business performance is improved by
DDD
Increased speed and flexibility The speed and flexibility of decision-mak-
ing is improved by DDD
Need for data-driven decision-making Explanation of when participant thinks
DDD is necessary
Increased predictability DDD can help by predicting what will hap-
pen
Perceived challenges
Code Description
Organizational culture The organizational culture does not fit to
DDD
Privacy concerns Privacy of customers etc. needs to be pro-
tected which can be a challenge
Data quality The data quality is not always sufficient to
base decisions on
Suitable tools Suitable tools are not available to enable
DDD
Employees' skills Employees do not have sufficient skills for
DDD
Adaption of business processes Current processes do not fit to DDD
Unpredictability Challenge to predict what will happen in the
future
Right data not available The data necessary for DDD is not available
Not enough data available The amount of data available is too low to
base decisions on

57
Time consuming DDD is considered to be more time con-
suming
Amount of data Challenges in processing a large amount of
data
Preparations
Code Description
Adaptions in systems Systems need to be adapted or implemented
to enable DDD
Adaptions in processes Processes neet to be adapted to enable DDD
Employee training Employees need to be trained to acquire
necessary skills for DDD
Process indicators Process indicators need to be created
Search
Code Description
Customer collaboration/request The collaboration with customers or the re-
quest of customers leads to new ideas for in-
novation
Collaboration with suppliers The collaboration with suppliers leads to
new ideas for innovation
Collaboration with knowledge institutes The collaboration with knowledge institutes
leads to new ideas for innovation
Seminars, conferences, fairs The visit at seminars, conferences, or fairs
leads to new ideas
Market research Market research is conducted in order to
discover new ideas
Inclusion of stakeholders Stakeholders are included to come up with
new ideas
Customer survey Customer survey is basis for new ideas
Select
Code Description
Criteria Criteria on which decision about which
ideas are implemented are made
Way Way in which decision is made

58
Development: Knowledge acquisition
Code Description
Collaboration Collaboration with partners (suppliers,
knowledge institutes, …) helps in deciding
which knowledge is necessary and in acqui-
sition of knowledge
Literature research Literature research is conducted in order to
define which knowledge is necessary and to
acquire it
Experience Experience is used to define which re-
sources and skills are necessary for an inno-
vation
Development: Execution
Code Description
Prototypes Way in which prototypes of the innovation
are created
User test Users test innovation
Set up of structures How structures for the implementation are
set up
Launch
Code Description
Final design How the final design of the innovation
should look like
Pricing How the innovation is priced
Promotion How the innovation is promoted
Place Where the innovation is launched
Post-launch adaption
Code Description
No changes after launch The innovation is not changed after it has
been launched
Usage of analytics Analytics are used in order to find out how
innovation needs to be adapted
Customer survey Customer survey is used in order to find out
how innovation needs to be adapted
Documentation Documentation is used to find out how in-
novation needs to be adapted
Employee suggestions Employees make suggestions to help im-
proving the innovation

59
Direct customer feedback Customers give direct feedback about prod-
uct and what should be adapted
Learn
Code Description
ISO Standard ISO standard is used to structure, document,
and monitor the process
Meetings Meetings are used to discuss how the inno-
vation process can be adapted
Process indicators Process indicators are used to indicate
where the innovation process can be
adapted
Experience Improvements of the process are based on
experience
Employee suggestions Employees make suggestions about how to
improve the innovation process
Usage of data-driven decision-making
Code Description
Systems in usage Systems which are currently used in the or-
ganization
Responsible person Person who is responsible for making deci-
sions
Techniques Techniques that company uses to analyze
data, e.g. data visualization, data mining,
text mining
Extent of data-driven decision-making Extent of DDD in comparison to decision
based on experience or intuition