Embed Size (px)
Citation preview
D A T A - D R I V E N D E C I S I O N - M A K I N G S O L U T I O N S
IDMS™ Sample Score Reports
Listening. Learning. Leading.
Great decisions start with good data.
IDMS Reports
Educational Testing ServiceCopyright © 2005 by Educational Testing Service. All rights reserved. Educational Testing Service, ETS, and the ETS logo are registered trademarks of Educational Testing Service. INSTRUCTIONAL DATA MANAGEMENT SYSTEM, IDMS, SYSTEM 5 and the SYSTEM 5 logo are trademarks of Educational Testing Service.
1
IntroductionIDMS Reports
The IDMS system is an integrated approach that, through a web based design, delivers user-friendly data to the desktop of educators to drive instructional practices that improve student achievement. Educators can use data to align curriculum, instruction and assessments; understand performance trends; and meet achievement goals.
Educators at Every Level Can Focus on StandardsThe real power of the IDMS system is that teachers will know what standards to teach, when to teach them, the materials required and when to assess students for standards mastery.
The IDMS system allows educators to
• view their state standards with the essential standards identifi ed (standards most critical for a student to master and advance to the next grade level)
• pace those standards over the school year and align materials to this paced curriculum
• build interim assessments
• analyze interim assessment results down to the student and standard level
• report on state tests and AYP accountability
• build grade books and report cards
The IDMS system makes test data meaningful, actionable and easy to use:
• Identify school performance challenges, and student strengths and weaknesses
• Recognize student improvement areas using formative assessment and data-driven analysis
• Target intervention to improve student achievement and school performance
• Direct improvement efforts and personalize student interventions and supplemental learning activities
Sample Score ReportsInside this booklet are samples of IDMS reports. The critical data from these reports has been proven reliable by research. Using the IDMS system, educators are empowered to enhance the quality of learning in their schools.
For more information about the IDMS system, log on to www.ets.org/k12learn2. Or call us at 1-866-ETSLEARN.
Instructional Data Management System™ (IDMS™)
IDMS Reports
DMS is going to make it very, very possible for schools and teachers and principals to have user-friendly data right at their fi ngertips ... with pushing a few buttons ... and not spend all kinds of time trying to fi gure out what the strengths and weaknesses are. And that’s going to make a huge diff erence in being able to deliver instruction that is based on need.”Dr. Augustin OrciDeputy Superintendent, Instruction Unit Clark County School DistrictLas Vegas, NV
I“
3
ContentsIDMS Reports — Table of Contents
Page
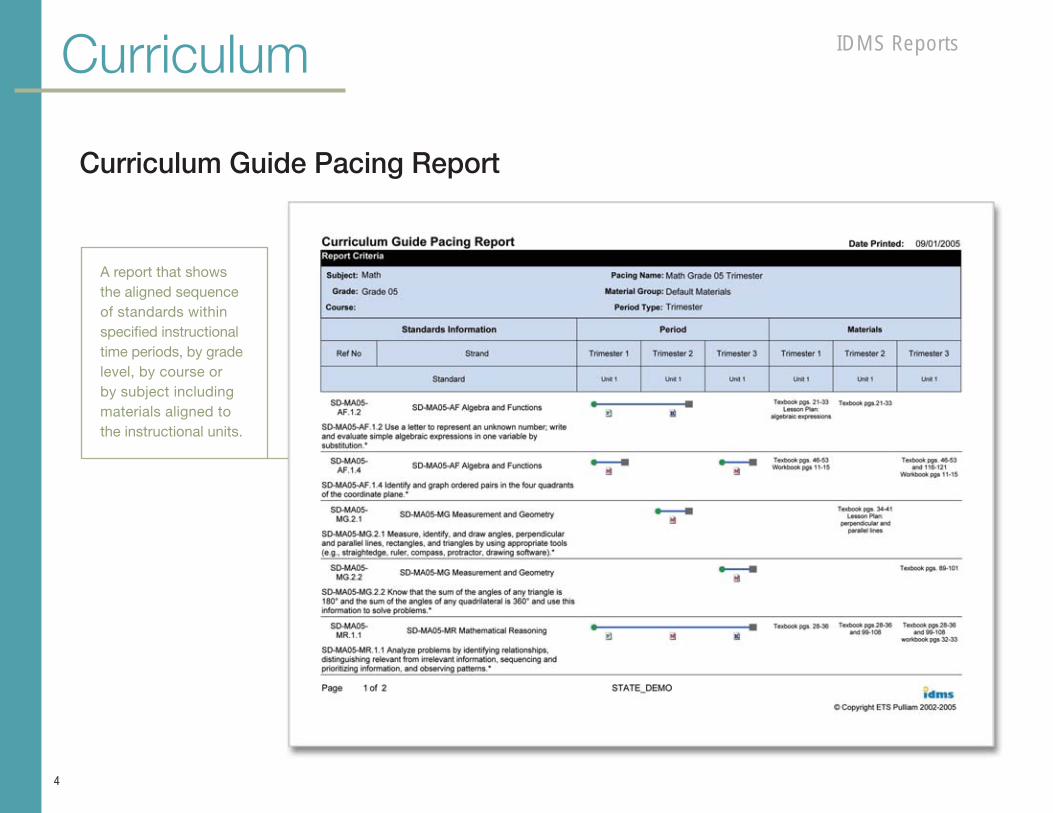
4 Curriculum ReportA report that shows the aligned sequence of standards within specifi ed instructional time periods, by grade level, by course or by subject, including materials aligned to the instructional units.
5 Grades & Report CardView grades and reports on student performance in relation to standards.
6-13 Local Test ReportsDistrict, school and classroom Interim Assessment results are presented by student, by standard and by profi ciency level. Item Analysis reports are also available.
14-19 Accountability ReportsView your state Adequate Yearly Progress requirements and analyze state test results through the lens of NCLB AYP criteria.
20-32 State Test ReportsAnalyze student performance through the lens of the total test (performance level results) or by strand/cluster.
IDMS Reports
4
Curriculum
A report that shows the aligned sequence of standards within specifi ed instructional time periods, by gradelevel, by course or by subject including materials aligned to the instructional units.
Curriculum Guide Pacing Report

IDMS Reports
5
Grades
Sample Report Card Standards-based report card customized to your district.
IDMS Reports
6
Local Tests
Assessment Report
Assessment Query Report
Item Analysis Report
Student Results
Assessment Analysis Report
e are now in our fi fth year using IDMS and it keeps getting better! IDMS allows teachers and administrators to track and disaggregate state testing information and student benchmarks that our district creates. Our teachers can now make instructional decisions based on data rather than a gut feeling.”Gay LewisDistrict Technology Resource TeacherCentral USDFresno, CA
W“
Local TestsIDMS Reports
7
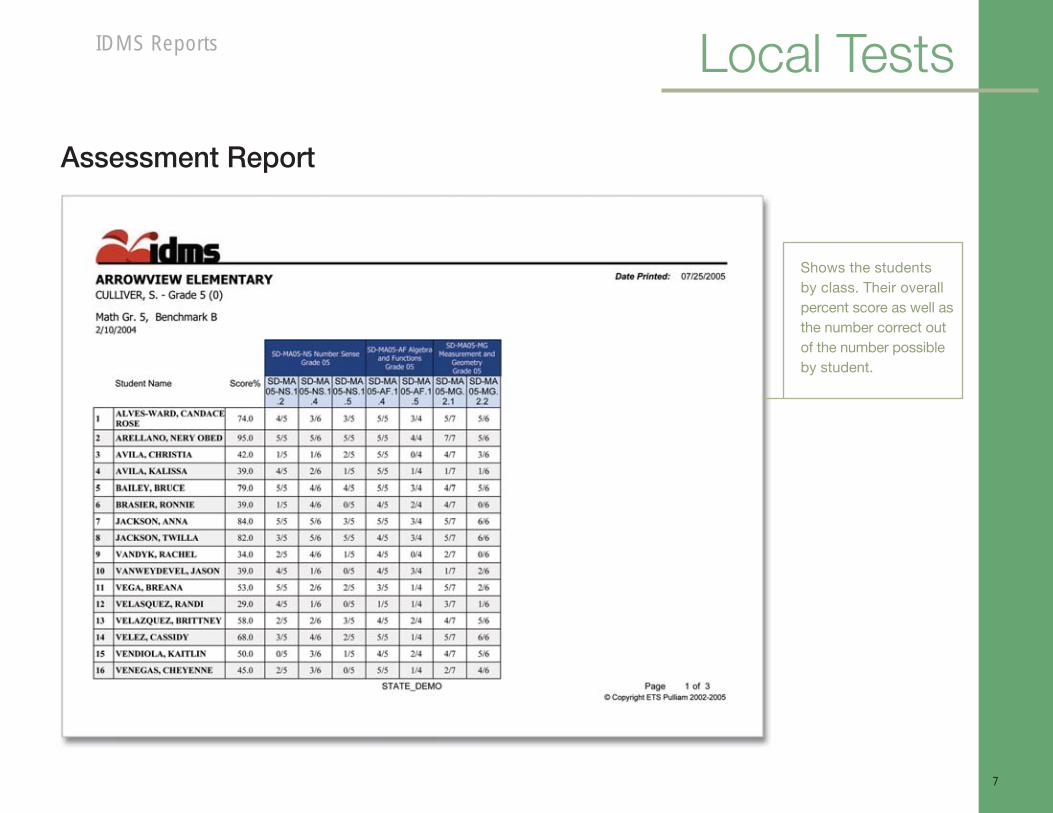
Shows the students by class. Their overall percent score as well as the number correct out of the number possible by student.
Assessment Report
IDMS Reports
8
Local Tests
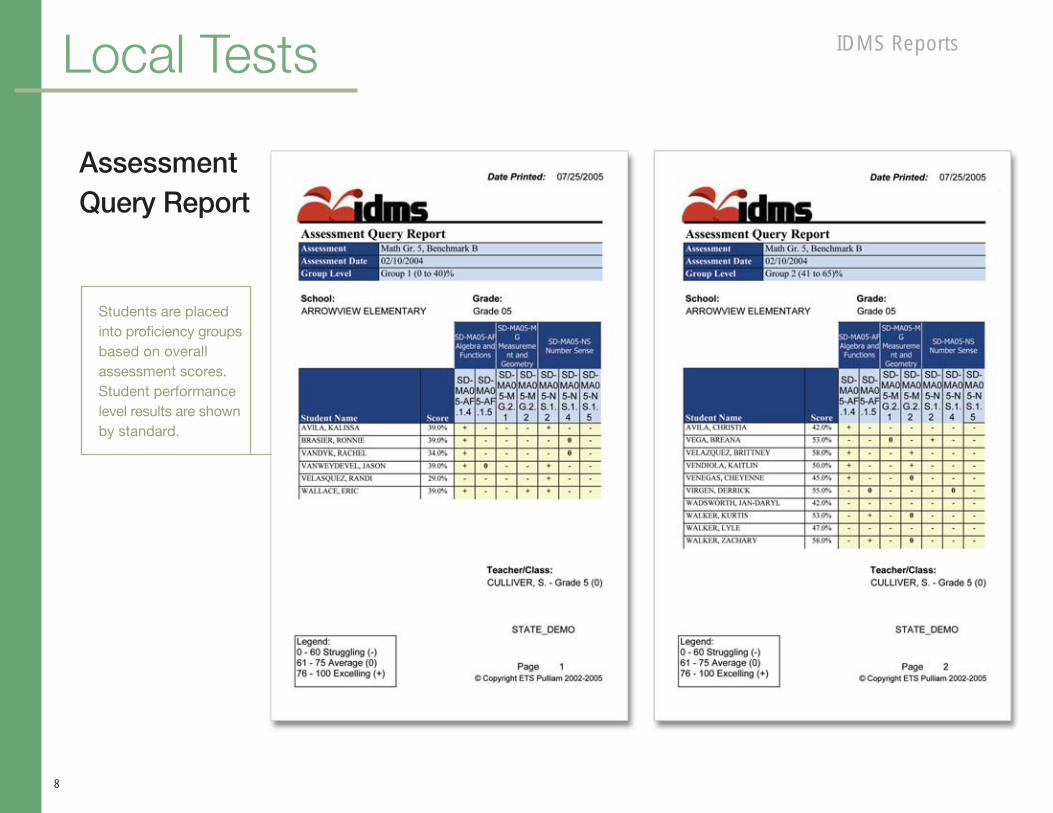
Students are placed into profi ciency groups based on overall assessment scores. Student performance level results are shown by standard.
Assessment Query Report

Local TestsIDMS Reports
9
The statistics estimated for this report include the number of students choosing each response option (multiple-choice items); the number of students at each score point (constructed-response items); item diffi culty; item-total correlation; and test summary statistics.
Item Analysis Report
IDMS Reports
10
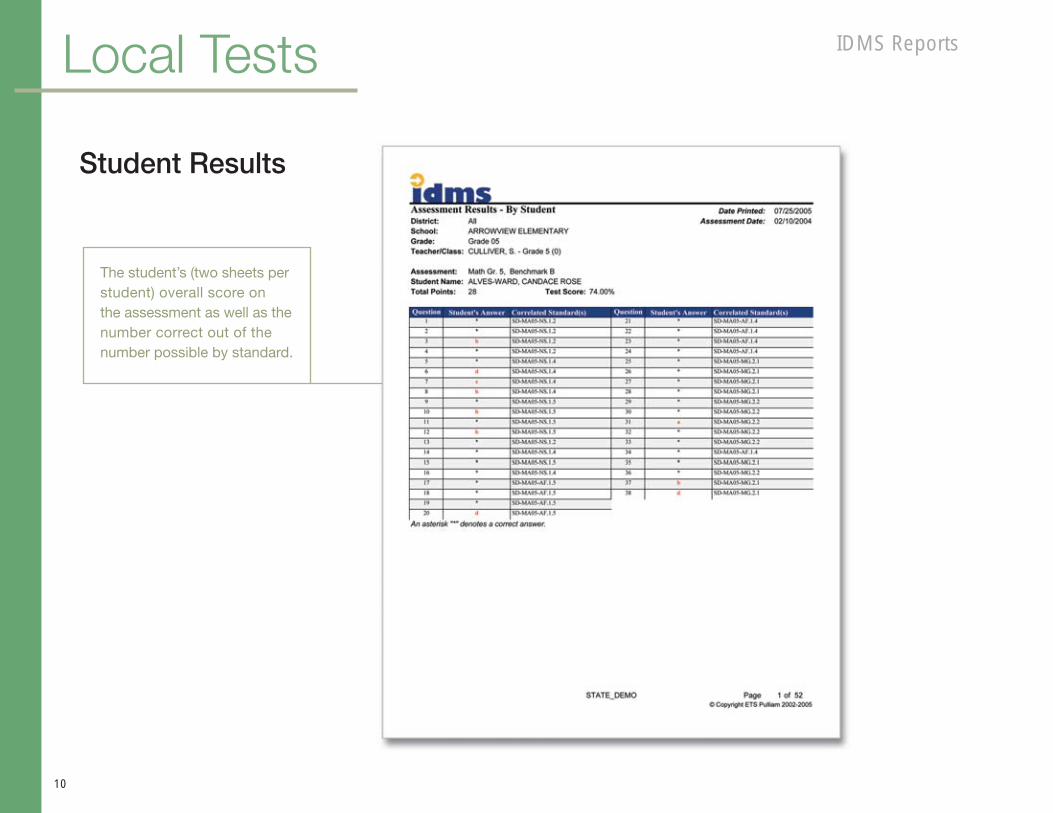
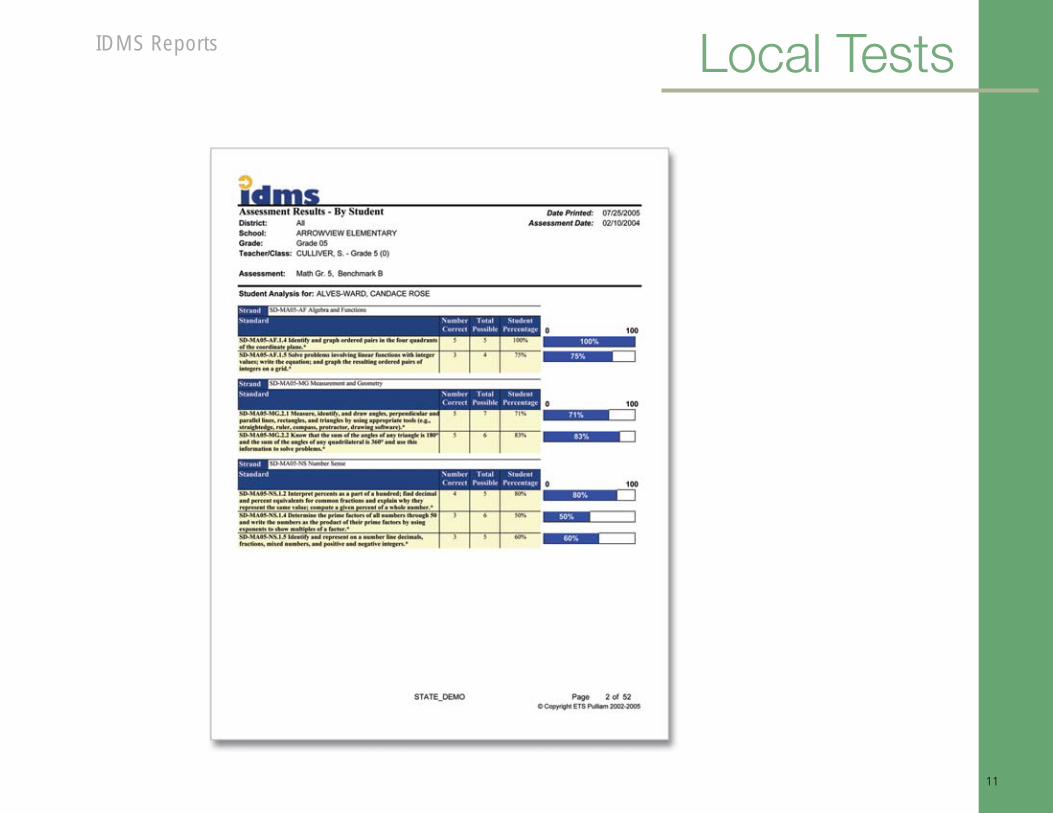
Local Tests
The student’s (two sheets per student) overall score on the assessment as well as the number correct out of the number possible by standard.
Student Results
Local TestsIDMS Reports
11

IDMS Reports
12
Local Tests
The number of questions on the assessment and the standards that are aligned to each question.
Assessment Analysis Report

Local TestsIDMS Reports
13
A comparison of results on multiple assessments by percentage as well as the number of items correct out of the number of possible disaggregated by district, by site, by class or by student down to the standard level.
Assessment Analysis Report

IDMS Reports
14
Accountability
AYP Forecast Report
Annual Detail Report
Two-Year Change Report
ne of the key reasons that we chose IDMS is because of its fl exibility. IDMS off ers teachers as well as school administrators, region level administrators and central offi ce administrators the ability to look at data that is specifi c to their needs. Teachers are able to identify the low, medium and high achieving students and rather than just having a one size fi ts all curriculum, they can adapt their lessons to best fi t their students.”Dr. Karlene McCormick-LeeAssistant SuperintendentResearch, Accountability and Innovation Clark County School District Las Vegas, NV
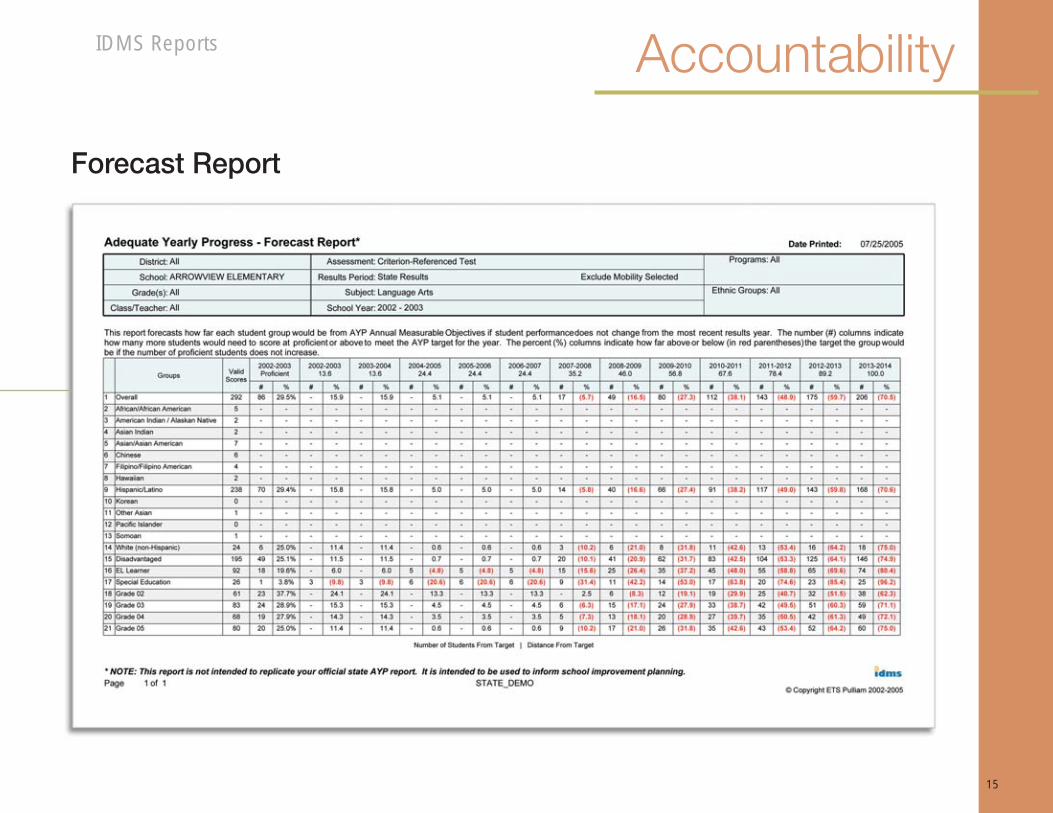
O“This report forecasts how far each student group will be from AYP based on the most recent results.
AccountabilityIDMS Reports
15
Forecast Report
IDMS Reports
16
Accountability
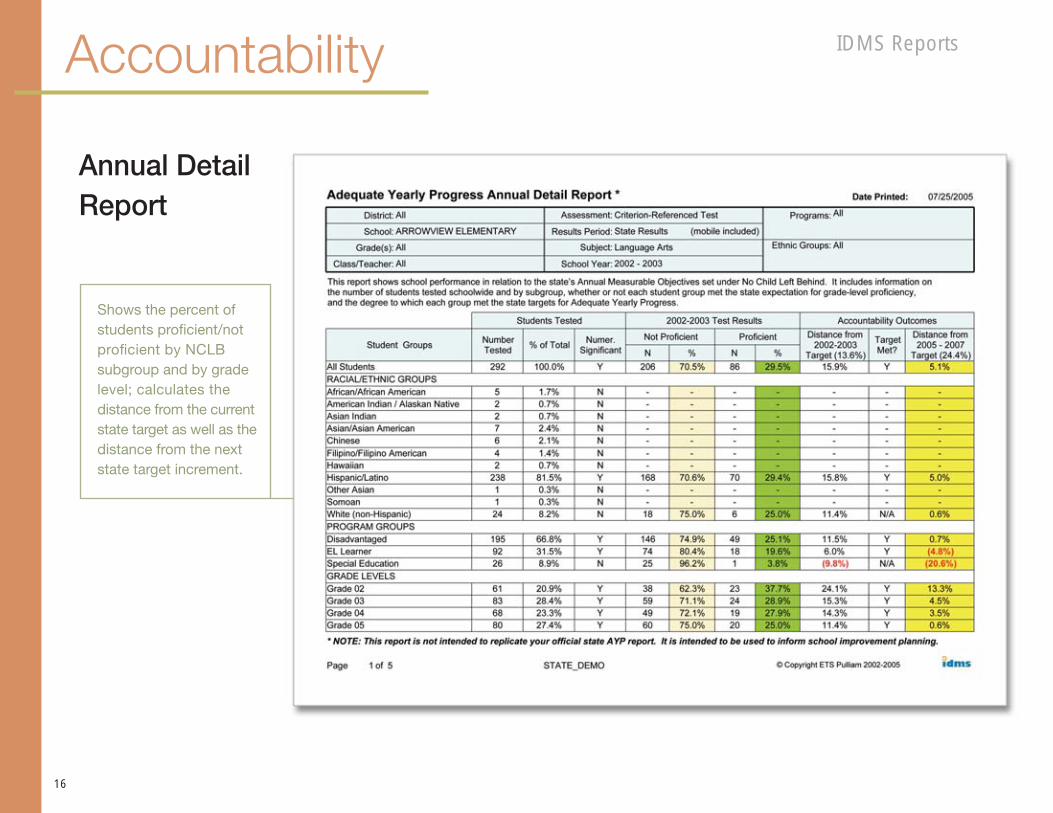
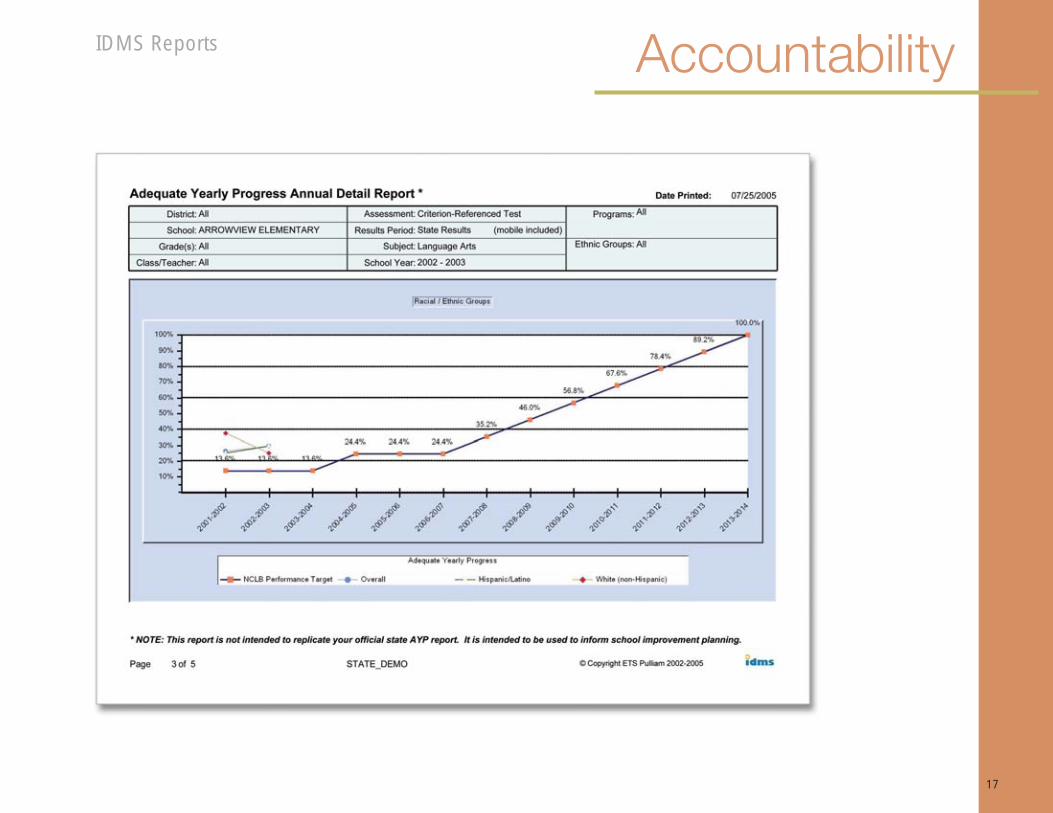
Shows the percent of students profi cient/not profi cient by NCLB subgroup and by grade level; calculates the distance from the current state target as well as the distance from the next state target increment.
Annual Detail Report
AccountabilityIDMS Reports
17
IDMS Reports
18
Accountability
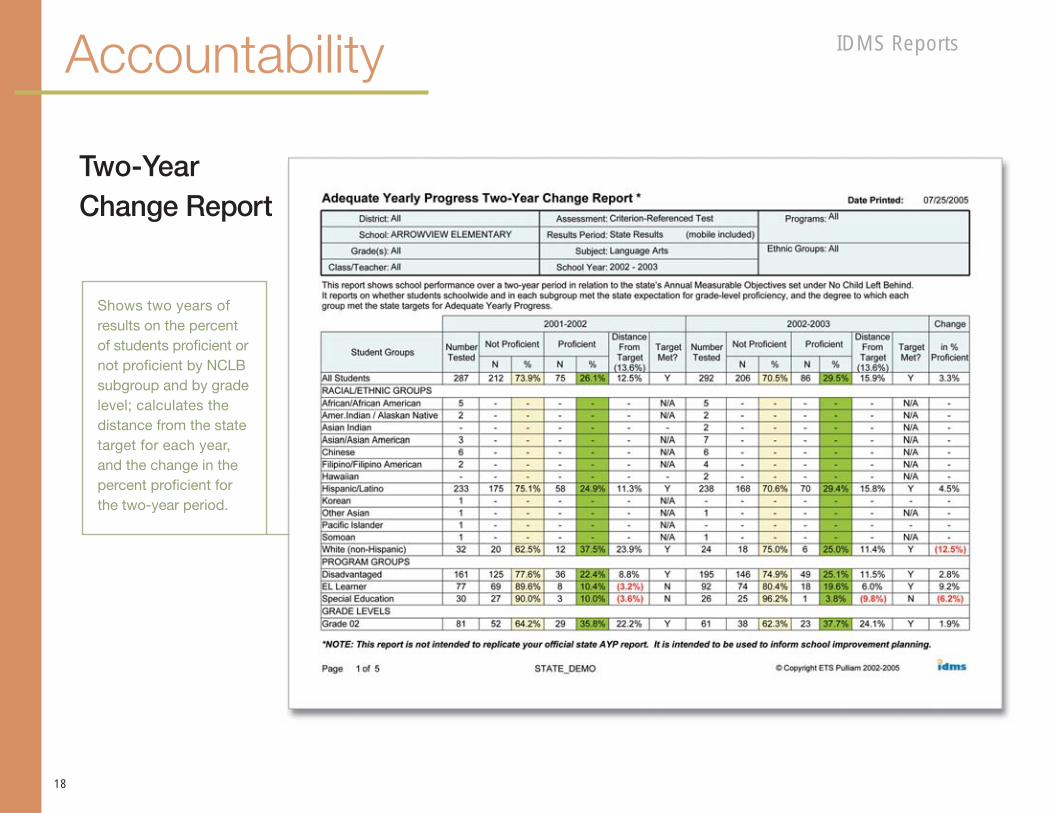
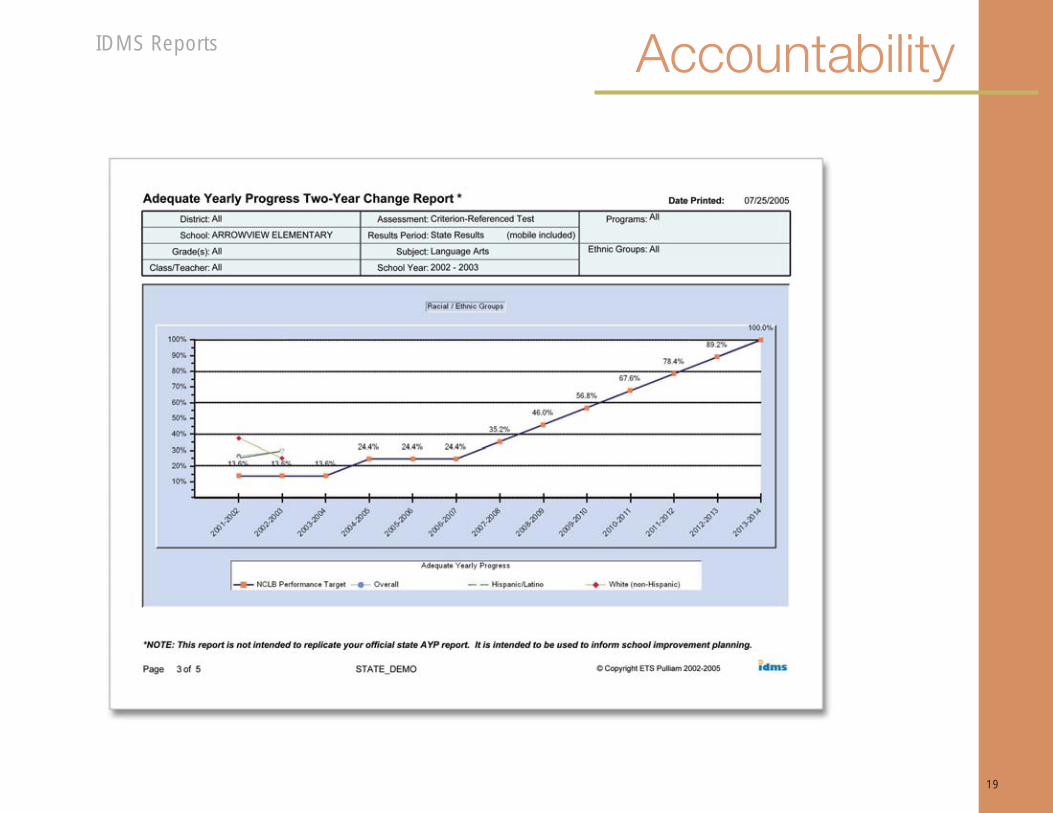
Shows two years of results on the percent of students profi cient or not profi cient by NCLB subgroup and by grade level; calculates the distance from the state target for each year, and the change in the percent profi cient for the two-year period.
Two-Year Change Report
AccountabilityIDMS Reports
19
State Tests
20
IDMS Reports
Grade Level Summary
Profi ciency Report — Subgroups
Performance Level Report — Subgroups
Performance Level Report — Teacher/Class List
Performance Level Report — Ranked Student List
Performance Level Report — Alphabetical Student List
Strand/Cluster Results — Subgroups
Strand/Cluster Results — Student List
Strand/Cluster Profi ciency — Ranked List
Student Performance Summary
he biggest change with IDMS was that it brought timely, useful data to teachers at the grade level and individual student level. Teachers were now able to track each student’s performance down to the specifi c standard. We are seeing great improvement in all our schools, including our signifi cant subgroups. But perhaps the most notable change is how much more attuned our teachers are to the standards, and to improving student performance.”Ketti DavisTechnology Supervisor for Central Unifi ed
T“
21
State TestsIDMS Reports
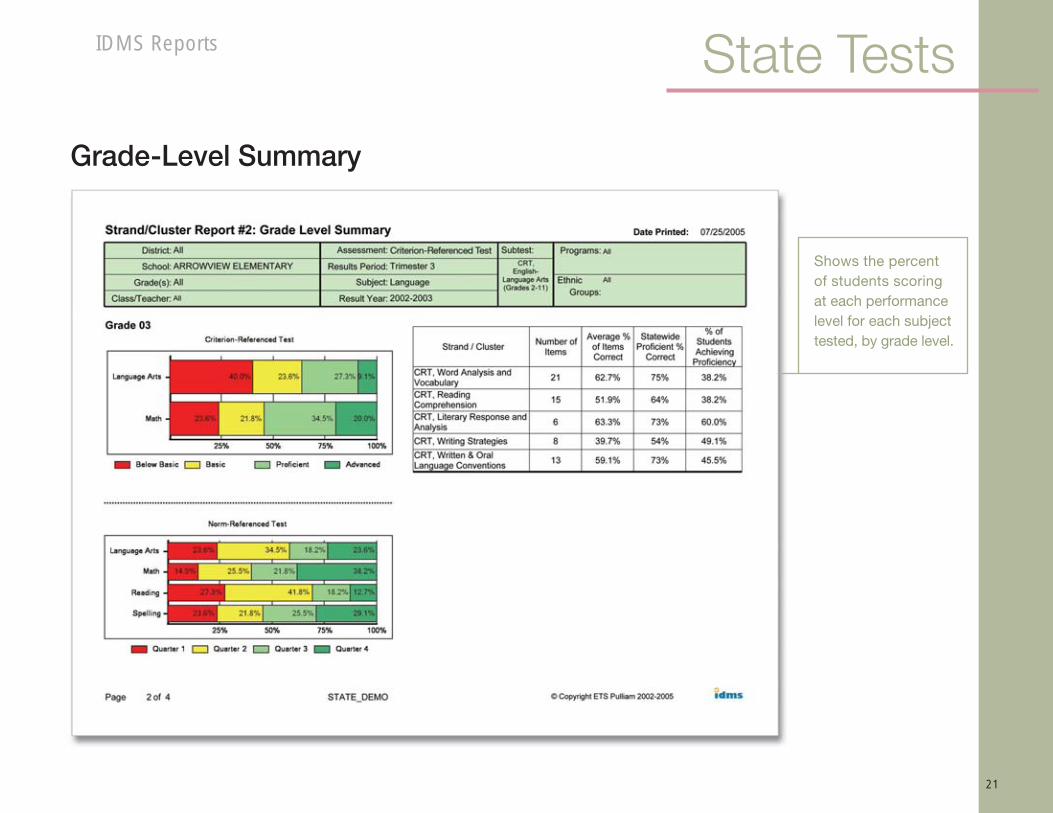
Grade-Level Summary
Shows the percent of students scoring at each performance level for each subject tested, by grade level.
State Tests
22
IDMS Reports
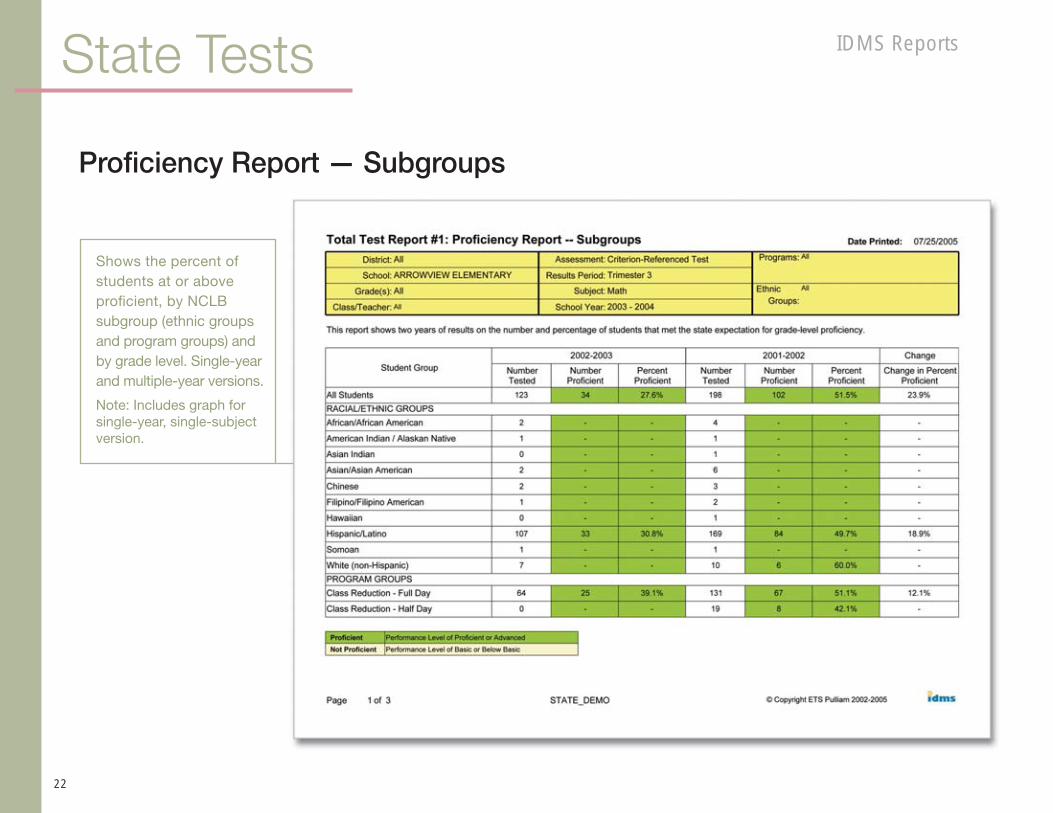
Shows the percent of students at or above profi cient, by NCLB subgroup (ethnic groups and program groups) and by grade level. Single-year and multiple-year versions.
Note: Includes graph for single-year, single-subject version.
Profi ciency Report — Subgroups
23
State TestsIDMS Reports
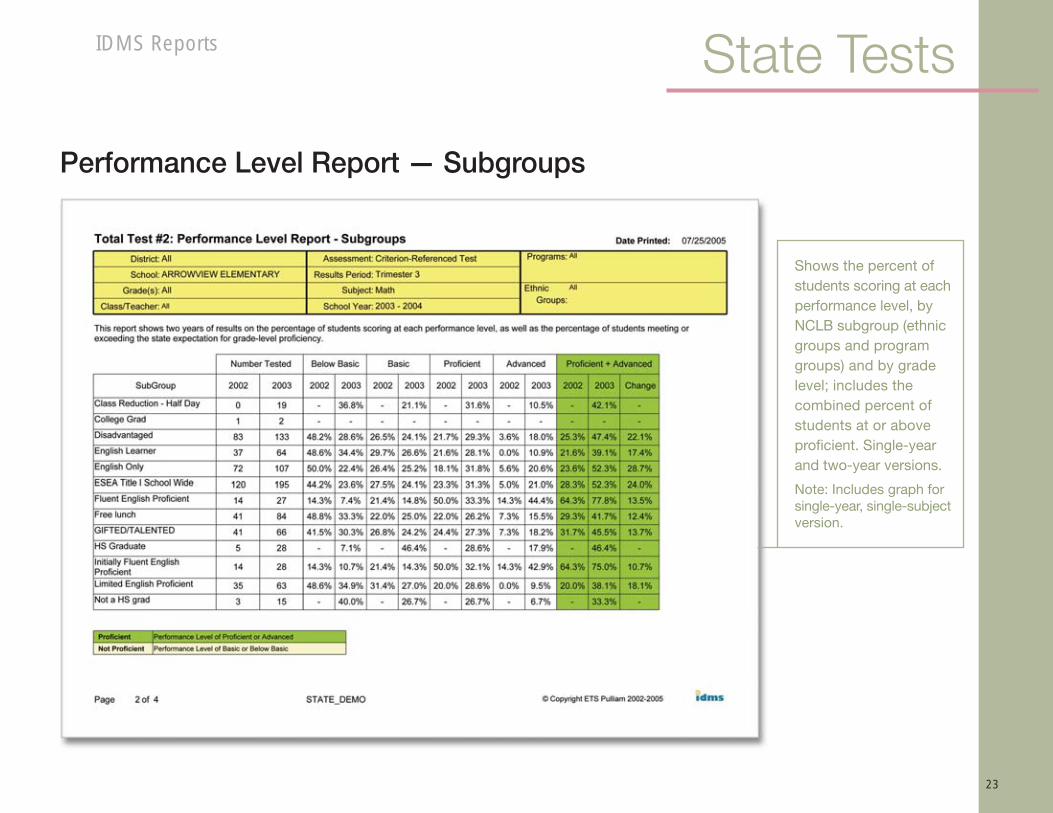
Performance Level Report — Subgroups
Shows the percent of students scoring at each performance level, by NCLB subgroup (ethnic groups and program groups) and by grade level; includes the combined percent of students at or above profi cient. Single-year and two-year versions.
Note: Includes graph for single-year, single-subject version.
State Tests
24
IDMS Reports
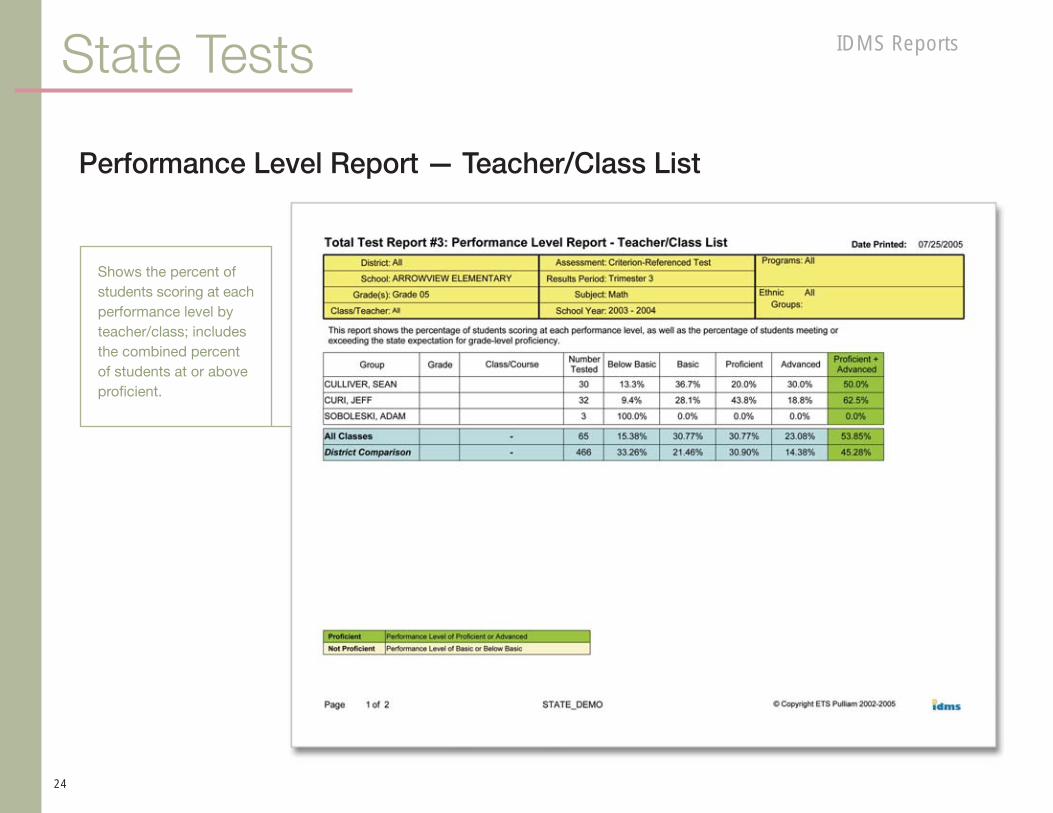
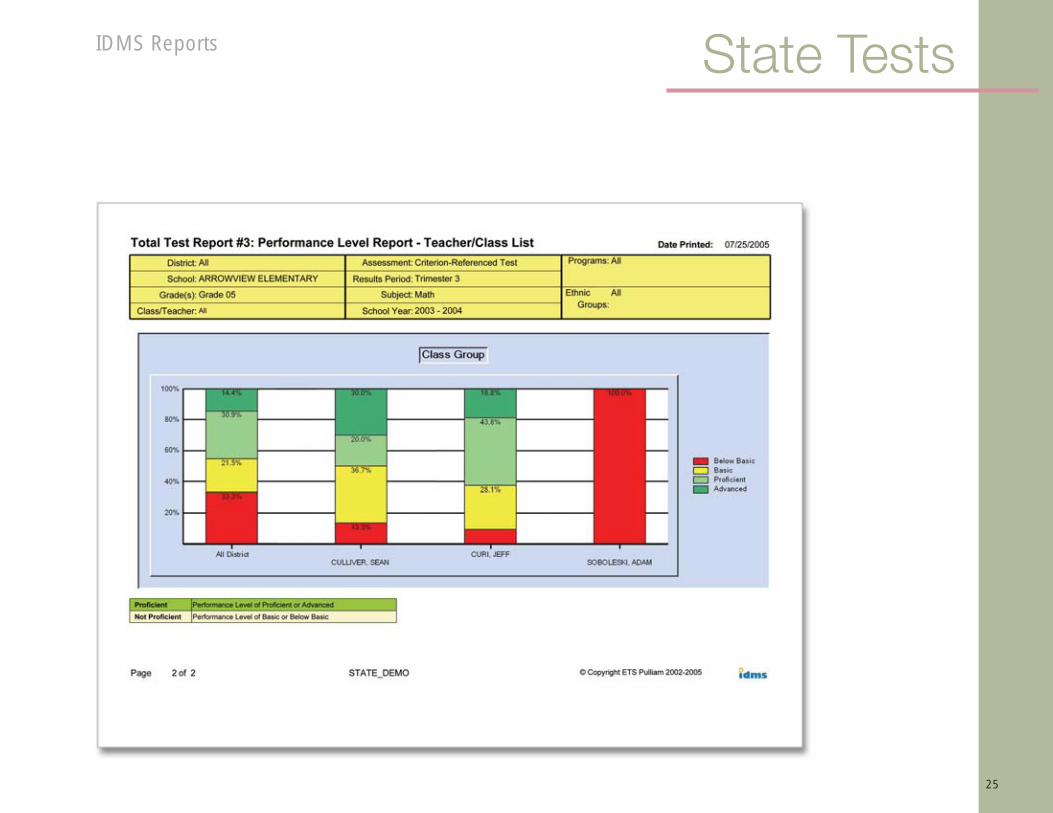
Shows the percent of students scoring at each performance level by teacher/class; includes the combined percent of students at or above profi cient.
Performance Level Report — Teacher/Class List
25
State TestsIDMS Reports
State Tests
26
IDMS Reports
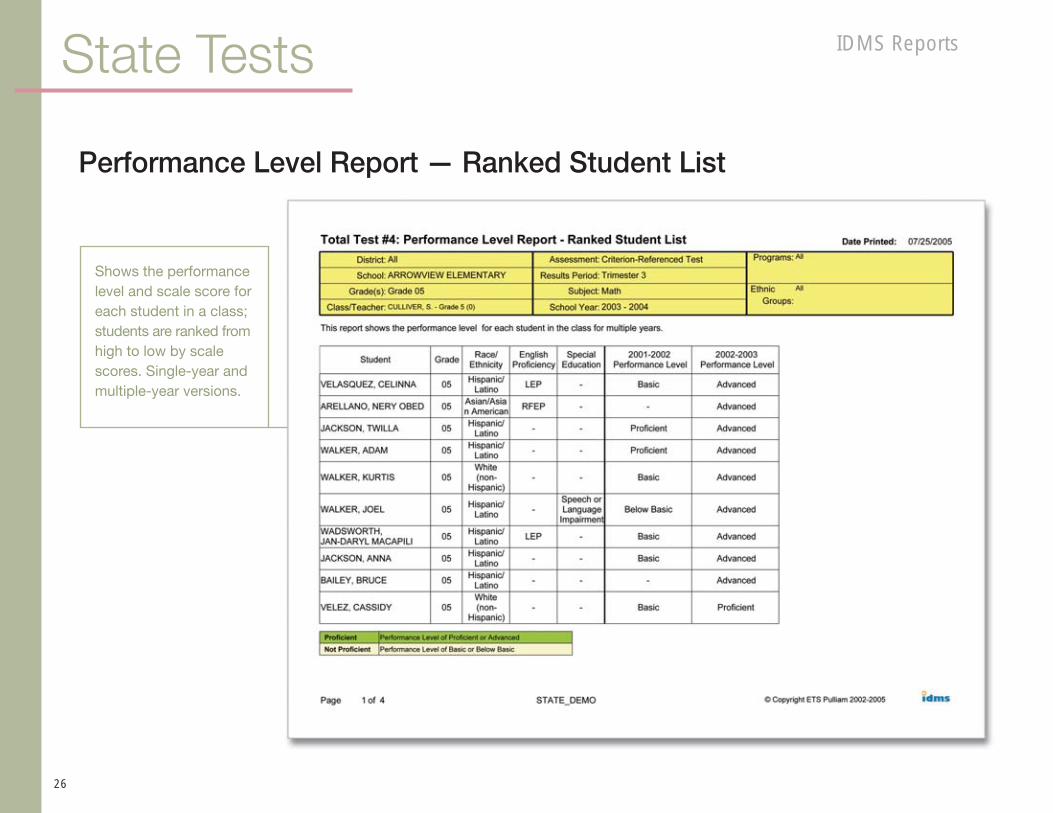
Shows the performance level and scale score for each student in a class; students are ranked from high to low by scale scores. Single-year and multiple-year versions.
Performance Level Report — Ranked Student List
27
State TestsIDMS Reports
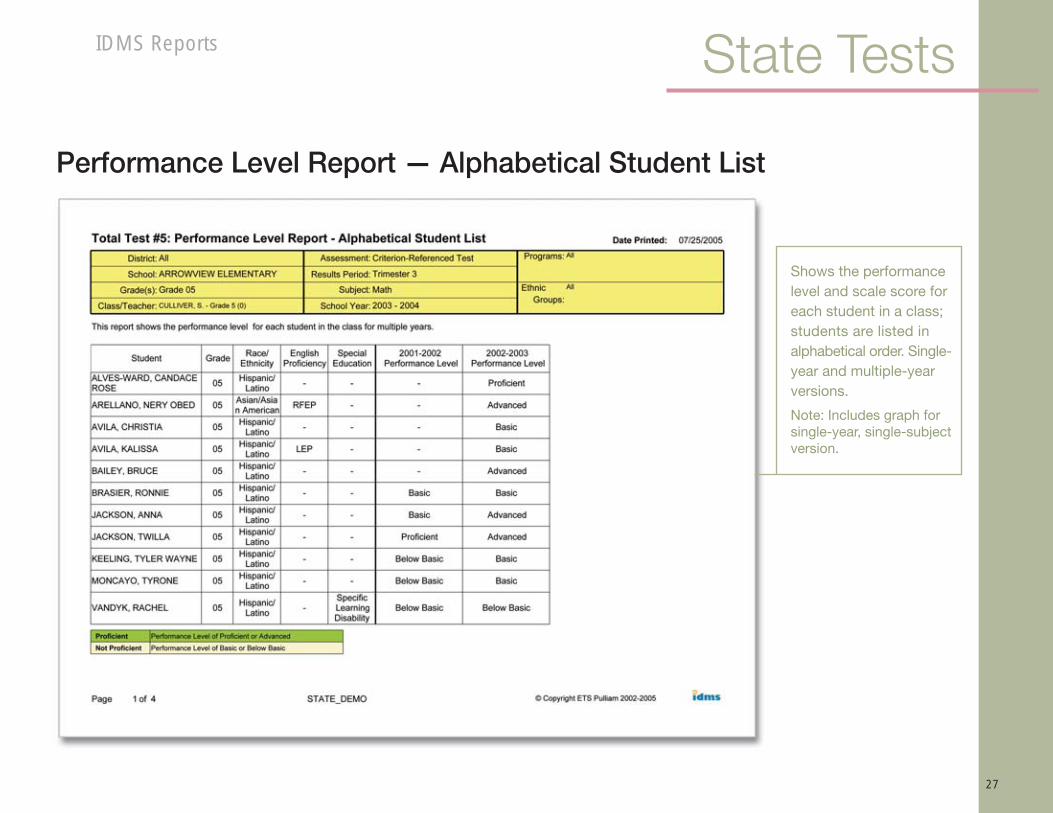
Shows the performance level and scale score for each student in a class; students are listed in alphabetical order. Single-year and multiple-year versions.
Note: Includes graph for single-year, single-subject version.
Performance Level Report — Alphabetical Student List
State Tests
28
IDMS Reports
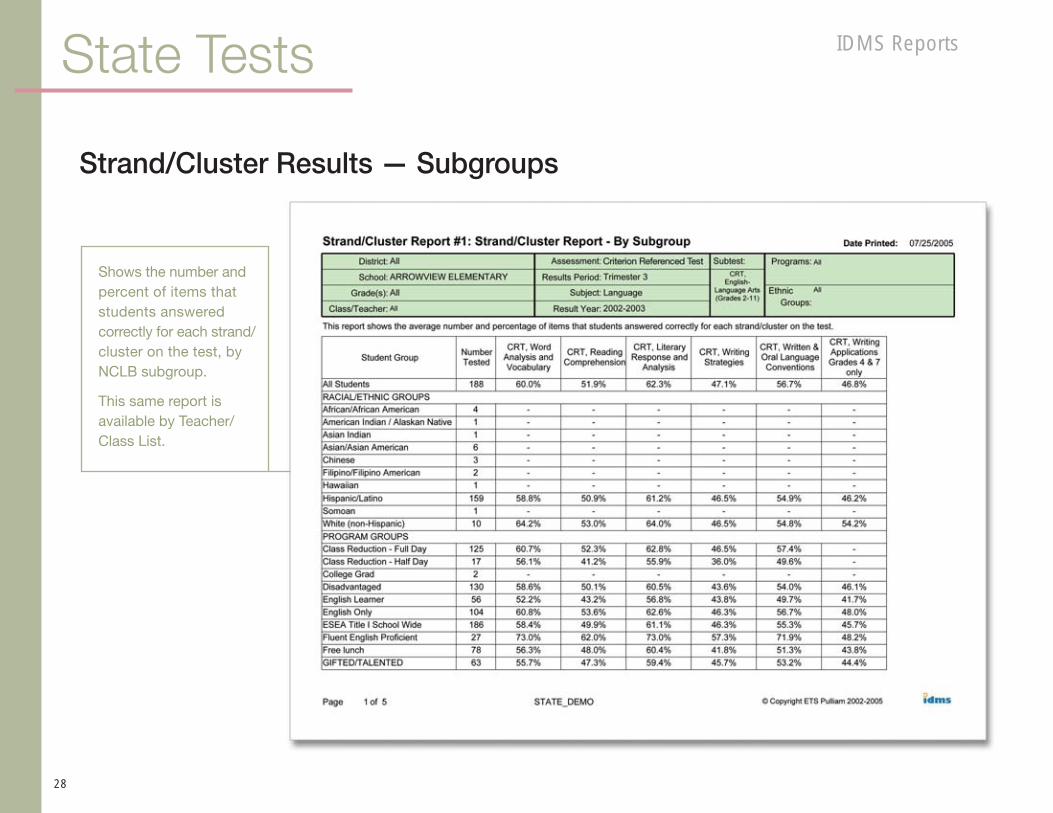
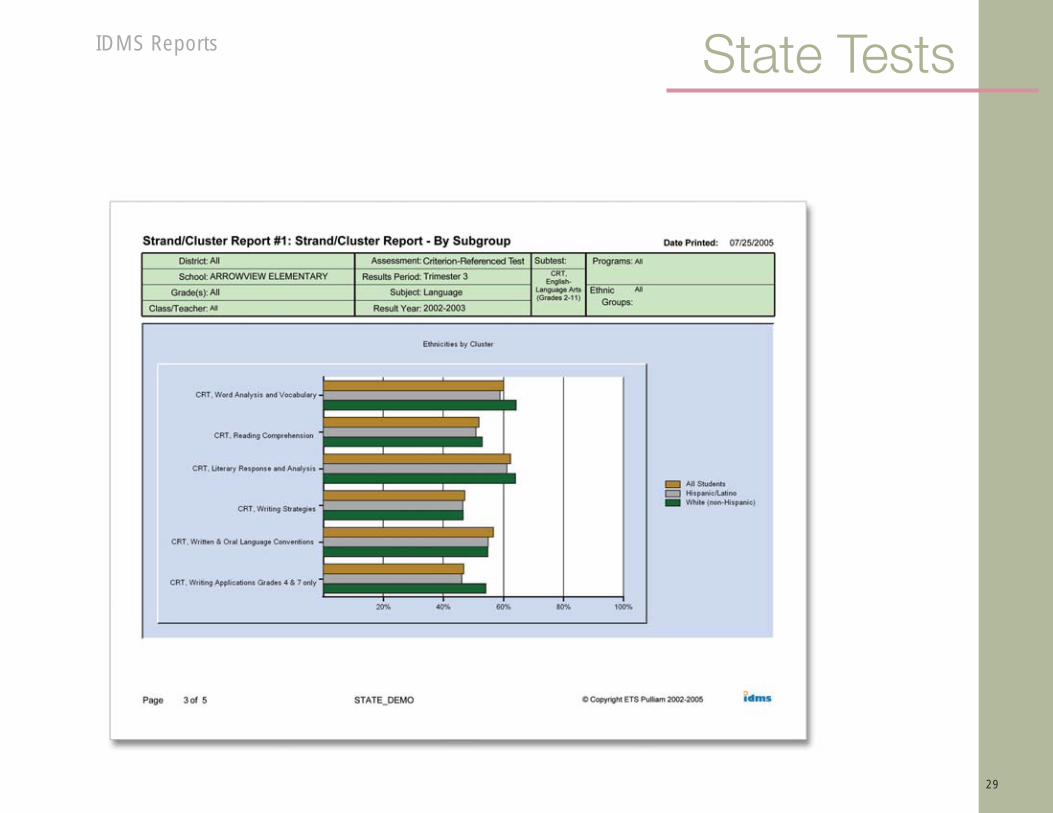
Shows the number and percent of items that students answered correctly for each strand/cluster on the test, by NCLB subgroup.
This same report is available by Teacher/Class List.
Strand/Cluster Results — Subgroups
29
State TestsIDMS Reports
State Tests
30
IDMS Reports
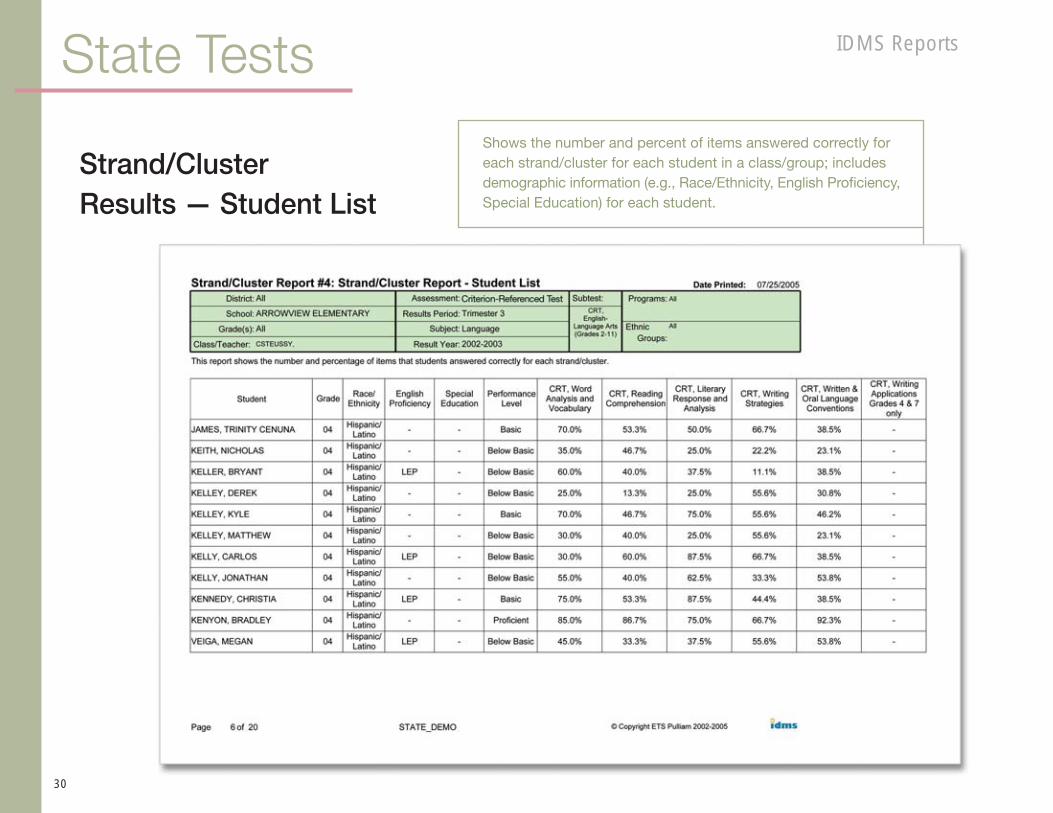
Shows the number and percent of items answered correctly for each strand/cluster for each student in a class/group; includes demographic information (e.g., Race/Ethnicity, English Profi ciency, Special Education) for each student.
Strand/Cluster Results — Student List

31
State TestsIDMS Reports
Shows the number and percent of items answered correctly for each student in a class/group, with a separate list for each strand/cluster; students are ranked from high to low for each cluster.
Strand/Cluster Profi ciency — Ranked List
State Tests
32
IDMS Reports
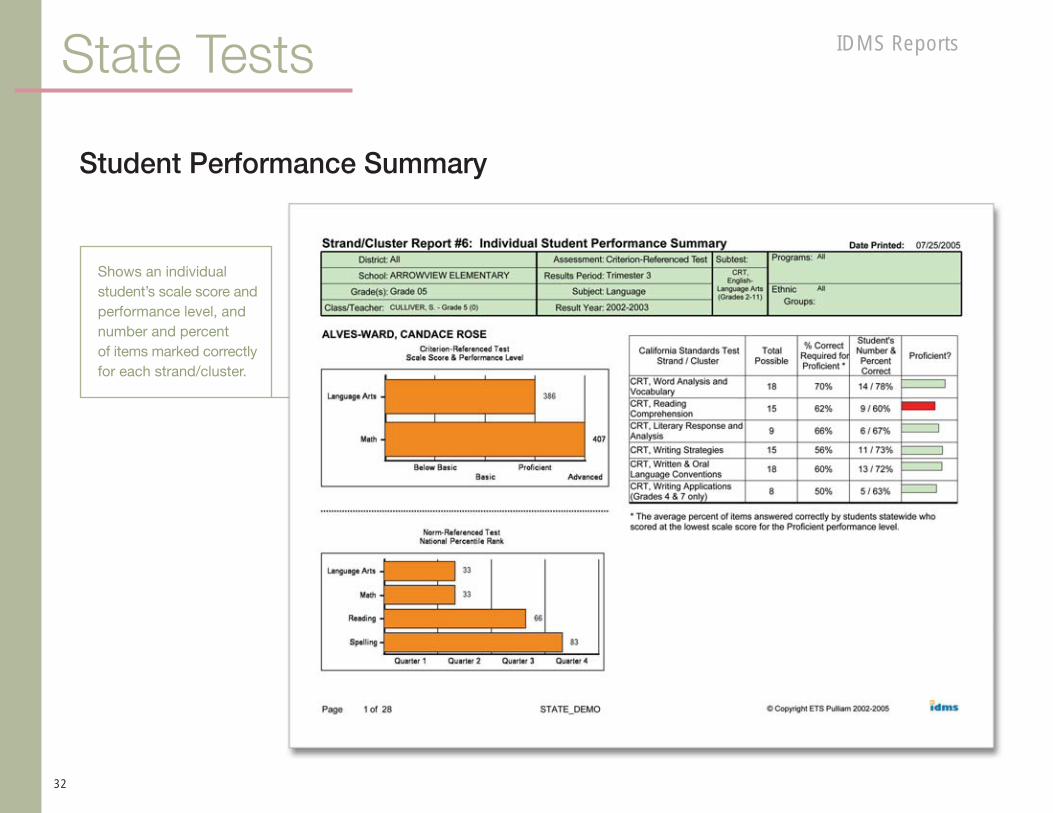
Shows an individual student’s scale score and performance level, and number and percent of items marked correctly for each strand/cluster.
Student Performance Summary

IDMS Reports
Listening. Learning. Leading.
Instructional Data Management System™ (IDMS™)
The IDMS system is part of a suite of services and resources offered by ETS to help schools and districts use data more effectively. These critical tools are aligned to individual state standards and provide valuable evidence in support of decisions that best serve the needs of students and teachers.
ETS products and services are designed to help you meet or exceed your AYP targets. For more information about the IDMS system and other tools, log on to www.ets.org/k12learn2. Or call us at 1-866-ETSLEARN.