Embed Size (px)
Citation preview

DATA DRIVEN
SORP 2016
applied tools for recreation planning and management

OUR AGENDA
• Overview• PG&E Case Study: Sign Inventory
and Assessment• PG&E Case Study: FERC
Compliance• Questions and Discussion

OVERVIEW


THE RISE OF OPEN DATA


CHEAPER AND MORE ACCESSIBLE

MANY APPLICATIONS
• Management• Planning • Design• Performance Evaluation• Public Engagement

FIELD DATA COLLECTION


ASSET MANAGEMENT


USER-GENERATED DATA


Maptionnaire Questionnaire

Maptionnaire Questionnaire

VISITATION PATTERNS


CASE STUDY:
Sign Inventory and Assessment Using Collector for ARCGIS
John MintzRecreation PlannerPacific Gas and Electric Company

OVERVIEW
1. The Tool – Collector for ARCGIS
2. The Application – Recreation Sign Inventoryand Condition Assessment
3. Additional features of Collector for ARCGIS

THE TOOL: Collector for ARCGIS
• Field data collection using iPhone, Android phones, and tablets
• Web based “Cloud” tool, so data is accessible by others viacomputers, phones and tablets.
• Integrated into the ArcGIS platform
• Configurable using ArcGIS Onlineand Portal for ArcGIS

Potential Recreation Applications for Collector
• Asset Management (i.e. signs, facilities, sites..)
• Recreation Use Collection (people, vehicles, activities..)
• Recreation Impacts (user created sites, trails, trash…)
• Recreation Resource Attributes (rapid types, veg cover…).
• Collaboration (Use Web Maps with fellow employees, contractors, and public)

Publishing Maps for Collector
GroupCollectors 1, 2, 3
Collector 3
Collector 2
Collector 1
ArcMap HostedFeature Service(s)
Web Map

FIELD APPLICATIONPit 3, 4, 5 Hydroelectric ProjectRecreation Signs Inventory and Condition Assessment
Objectives:
1. Obtain accurate inventory of recreation signs
2. Annually identify signs that need to be replaced or repaired

PIT 3,4,5 RECREATION SITES

PIT 3,4,5 RECREATION SITES

Types of Recreation Signs Surveyed
Road
Safety
Information Boards
Site EntranceResource Protection
Interpretive

Sign LocationsFrom Cell Phone

Sign Data FieldsFrom Cell Phone
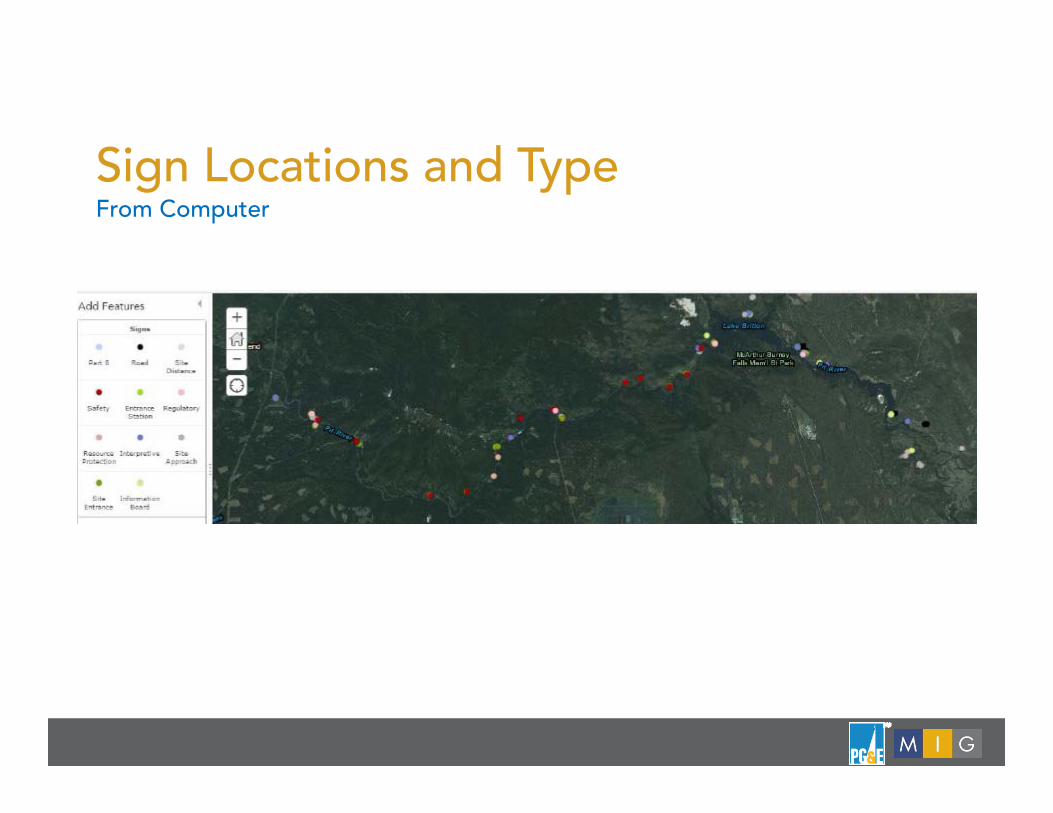
Sign Locations and TypeFrom Computer

Sign Data Fields and ValuesFrom Computer
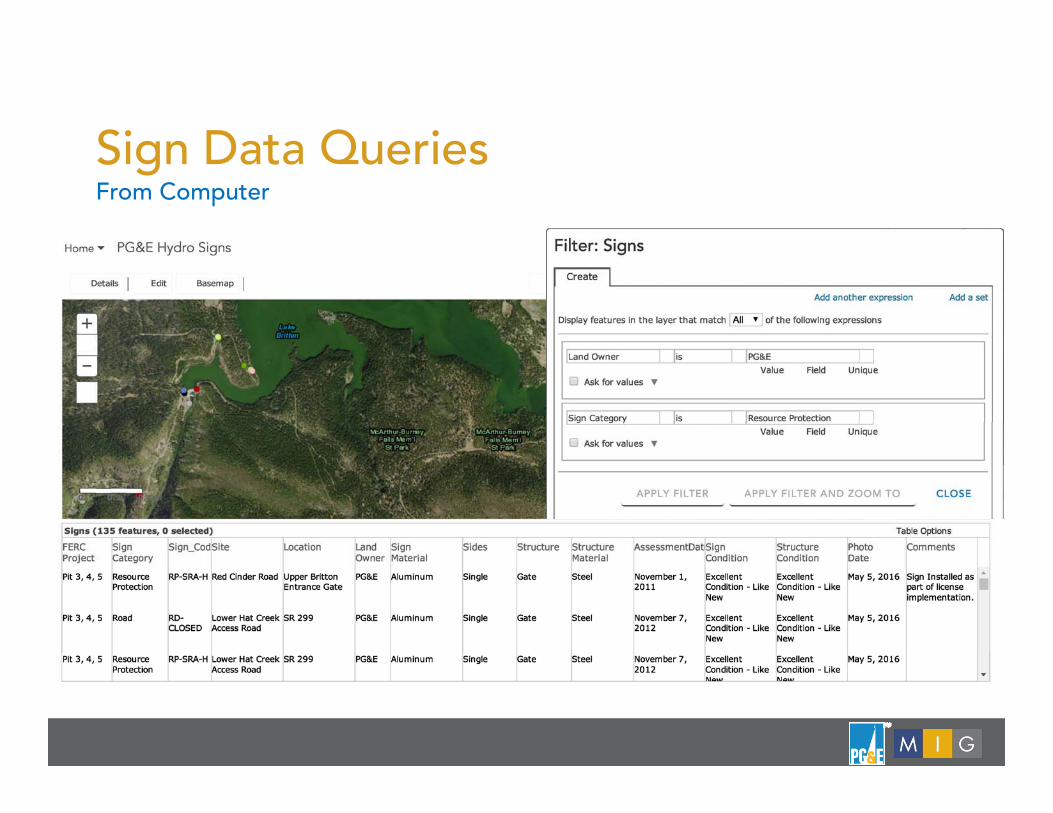
Sign Data QueriesFrom Computer

Sign Data Field ValuesLocation Information
FERC Project Site Location GPS Land OwnerPit 3‐4‐5 Northshore Campground Describe location within
sitePG&E
Hat Creek Jamo Point Boat Launch USFSMcloud Pit Ferry Crossing Picnic Area BLM
Pit 3 Reach StateCountyPrivate
Inventory InformationSign Category Sign Code Sign Material Sign Sides Sign Structure Structure MaterialPart 8 BF‐REG‐CAMP Aluminum Single Sign Post WoodRoad P8‐S‐2L Aluminum Clad Plywood Double Double Post SteelSite Distance RD‐SA2‐SYMB Plastic Info Board ‐ 1 Panel AluminumEntrance Station R‐E1A EcoStyrene Info Board ‐ 2 Panel PlasticRegulatory RP‐TRAIL Fiberglass Info Board ‐ 3 PanelResource Protection S‐RSVR‐5MPH Foam Board Info Board ‐ 4 PanelInterpretive … Paper GateSite Approach TreeSite Entrance Interpretive ‐ 1 PanelInformation Boards Interpretive ‐ 2 Panel
Interpretive ‐ 3 Panel

Sign Data Field Values

Collector – Other Features
• App is free and GIS maps are accessed through the web
• Use off-line by downloading aerial
• Collects points, lines, and polygons
• Can set to 2 meter accuracy level
• Add videos
• Export info to a csv file
• Field data entry forms are relatively quick and easy to create

Collector – Other Features• Easy access to other publically available GIS maps
from the government and other users

Next Steps
• Developing ability to order signs via company’s SAP intranet site using sign code

Next Steps
• Add permit road ROW field
• Change Condition Field to estimated years of life remaining, so can input into 5 year budget projections
• Apply to other recreation facilities (i.e. water system)

Summary
• Collector is a relatively simple and easy field data collection tool for ARCGIS
• Multi-user, web based “Cloud” Tool
• Figuring out what you are going to collect and how you are going to use it is frequently the hardest part of the process.

CASE STUDY: FORM 80 COMPLIANCE

BACKGROUND
PG&E manages 26 Hydro Projects including…
• 66 Developments• 107 Reservoirs• 330 Recreation sites
FERC Form 80 submission is required to be at recreational developments
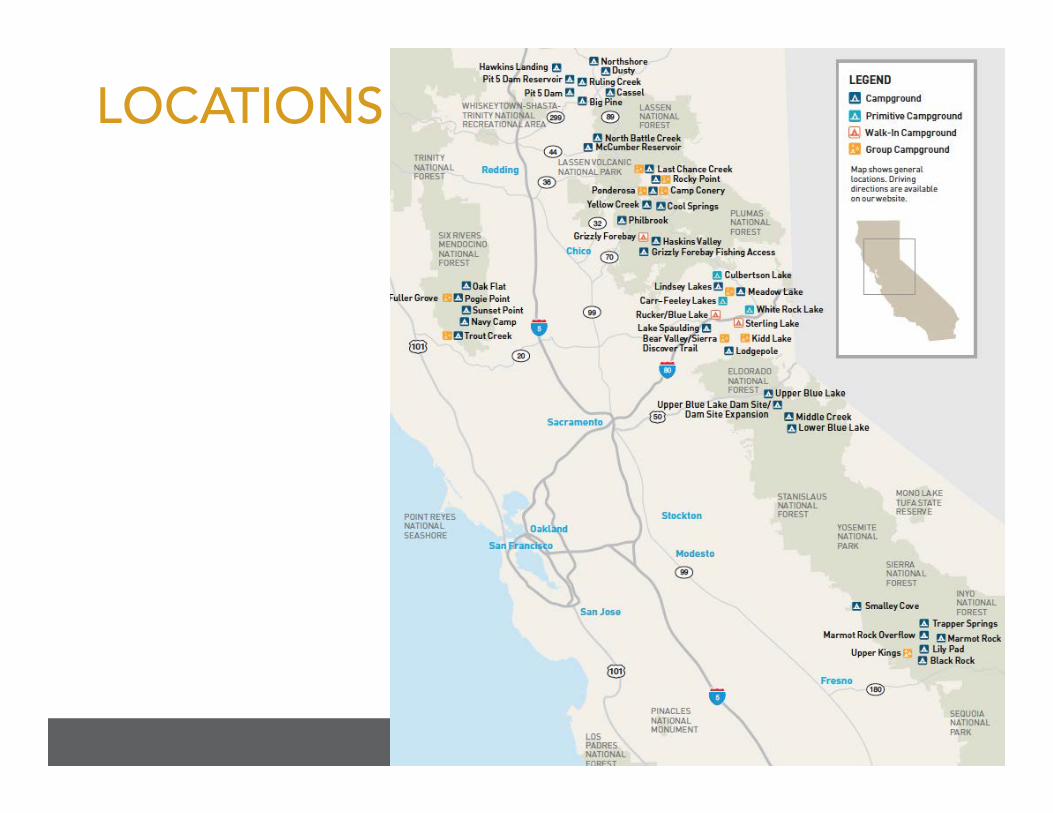
LOCATIONS

FERC FORM 80
• Every Six Years• Estimate of:
• Annual and Peak Recreation Use
• Facility Capacity• Required for most federally
licensed hydroelectric projects

CHALLENGE FOR PG&E
• Large Geographic Area• Multiple jurisdictions• Reporting is required at all developments in the same year
• Some licenses require the submission of supplementary reports

DATA COLLECTION BACKGROUND
Use the best data available: • Based on campground
occupancy records, day use fees, group camp reservations, responses to surveys by resort owners/managers.
But these data are not available at non-fee and/or remote locations• Time intensive to reach these
locations• Use may be very low at these sites
(particularly on weekdays)Therefore:• Weekend/Holiday observations
occur in these locations

SOLUTION
Develop effective and efficient monitoring effort• Hire local staff (often affiliated with concession operations or
campground “caretakers”)• Easy to understand standardized protocol• Focus on peak days (Holidays/Saturdays) during peak times
• Addresses key issue of facility capacity when occupancy rate is greatest
• Decision to build new facilities based on weekend use• Apply use factor based on more intensive field efforts

DATA COLLECTED BY FIELD STAFF
• Number of Visitors, Vehicles or Trailers• Number of Units (campsites, picnic sites, parking spaces) Occupied

SAMPLE DATA FORM

OTHER DATA USED TO CALCULATERECREATION USE AT DAY USE SITES • Average Group size (Persons per Vehicle)• Turnover Rate (based on average length of stay)• Recreation Use Factor (Compares relative weekend use with
weekday use)• Length of recreation season

QUESTIONS AND DISCUSSION

OVERALL TAKEAWAYS
• It is a rapidly changing landscape• Think through the methodology• Keep it simple – improves quality• Choose the right solution/methodology for your organization
and/or project• Interoperability• Cost• Time
• Pilot: Start small, test and adapt


![Data-Driven and Keyword-Driven Test[1]](https://img.pdfslide.net/doc/110x75/577ce76d1a28abf103951d8d/data-driven-and-keyword-driven-test1.jpg)