Embed Size (px)
Citation preview
Data-Driven Methods for Setting Reading Proficiency
Benchmarks2018
A study funded by Pearson Education
This publication was produced for Room to Read®. It was prepared by RTI International.

Data-Driven Methods for Setting Reading Proficiency Benchmarks
Prepared byMatthew Jukes, Chris Cummiskey, Melissa Gargano, and Peggy Dubeck RTI International3040 Cornwallis Road Post Office Box 12194Research Triangle Park, NC 27709-2194

Table of Contents1. Background ................................................11.1 Goals of Benchmarking ...................................... 1
Tracking Fluency vs. Comprehension ..................1
Benchmarks vs. Targets .............................................2
1.2 Aims and Outline of the Report ........................2
How do different methods of estimating a benchmark compare? .....................2
2. Data ............................................................ 3
3. Methods to Set and Evaluate Benchmarks ........................... 5
3.1 Current Approaches to Benchmarking ................................................. 5
3.2 Benchmarking Methods ....................................5
Method Descriptions .................................................. 5
Comparison of Benchmark Levels ........................6
3.3 Evaluating Benchmarks .....................................7
Comparison of Benchmark Precision .................. 7
Comparison of Ability to Predict Comprehension .............................................9
4. Determinants of Benchmark Level and Precision ...............................12
4.1 Properties of the Sample .................................. 12
Sample Size .................................................................... 12
Student Performance ............................................... 13
Explaining the Relationship Between Student Ability and Benchmarking ................... 17
4.2 Properties of the Assessments ........................ 21
Internal Reliability of Comprehension Passages .......................................22
Benchmarks Set Using Different Passages .....................................................23
4.3 Properties of the Language ..............................27
Literature on Language Characteristics and Reading Fluency ............................................... 30
Characteristics of Languages in This Study .................................................................32
Language of Assessment ........................................33
5. Determining Benchmarks at Early Stages of Reading Development .......................................... 34
5.1 Benchmarking Using Reading Accuracy .............................................. 35
5.2 Adjusting Parameters of the Logistic Regression Benchmarks ....................37
6. Methods of Assessing Comprehension ..................................... 41
6.1 Assessing Comprehension Using the Sentence Choice Test ......................41
6.2 Assessing Comprehension With and Without Time Limits ...................... 42
7. Conclusions ..............................................447.1 Comparison of
Benchmarking Methods ..................................44
7.2 Determining Benchmarks at Early Stages of Reading Development ....................46
7.3 Benchmarking at Different Grade Levels ......................................46
7.4 Alternate Methods of Assessing Comprehension .............................. 47
7.5 Benchmarking Across Languages ................. 47
7.6 Requirements for Producing Reliable Benchmark Estimates ......................48
8. References* .............................................49
Appendix A. Summary of Analyses Conducted .................................. 52
BENCHMARKING REPORT 2018 | iii

List of Figures and Tables
Figures
7 Figure 1. Box plots comparing four benchmarking methods applied to 21 datasets with more than 150 students and comprehension reliability > 0.5. Box plots show median benchmark levels and quartiles.
8 Figure 2. Box plot showing mean and range of benchmark estimate confidence intervals from each of three methods. Each boxplot contains 21 values, representing the confidence interval from each dataset with more than 150 students and comprehension reliability > 0.5.
9 Figure 3. Illustration of sensitivity, specificity, and correct classification, for students who read above 80% comprehension or below 80% comprehension.
13 Figure 4. Confidence intervals in logistic regression benchmarks by sample size, based on all 75 datasets.
14 Figure 5. Logistic regression method benchmark levels vs. proportion of sample with 80% comprehension, based on all 75 datasets.
15 Figure 6. Mean method benchmark levels vs. proportion of sample with 80% comprehension, based on all 75 datasets.
16 Figure 7. Logistic regression benchmarks by grade in two example datasets from Laos and Nepal.
17 Figure 8. Logistic regression benchmarks by grade. Graph includes 69a estimates for each combination of grade and passage for each language.
18 Figure 9. ORF frequency and comprehension vs. fluency for grade 2 students reading passage 2 in Laos 2016.
19 Figure 10. Estimates of the probability of achieving 80% comprehension among grade 2 students reading passage 2 in Laos 2016.
20 Figure 11. ORF frequency and comprehension vs. fluency for grade 4 students reading passage 2 in Laos 2016.
21 Figure 12. Estimates of the probability of achieving 80% comprehension by grade 4 students reading passage 2 in Laos 2016.
22 Figure 13. Scatter plot of comprehension question reliability (Cronbach’s alpha statistic) and logistic regression benchmark confidence intervals from 72 datasets.
23 Figure 14. Proportion of sample reaching 80% comprehension for reading passage 1 vs. reading passage 2.
24 Figure 15. Logistic regression method benchmark estimate for reading passage 1 vs. reading passage 2.
25 Figure 16. Distribution of differences in logistic regression benchmarks between pairs of passages administered to the same sample of students.
26 Figure 17. Distribution of differences in median method benchmarks between pairs of passages administered to the same sample of students.
28 Figure 18. Boxplot of benchmark levels by language. Box plots show range of estimates of samples (35 in total) with multiple grades combined.
38 Figure 19. Benchmarks set using different p values in the logistic regression method. Data from Nepal, grade 2 passage a.
39 Figure 20. Benchmark estimates from the logistic regression method with probability values varying from 0.3 to 0.8. Methods are applied to 21 datasets with more than 150 students and comprehension reliability > 0.5.
40 Figure 21. Logistic regression method benchmark estimates of the fluency level required for half of the sample to read with 80% comprehension vs. 60% comprehension. Methods are applied to 21 datasets with more than 150 students and comprehension reliability > 0.5.
BENCHMARKING REPORT 2018 | iv

Tables
4 Table 1. Number of datasets: Benchmarking samples by country, language, year, organization, and grade.
10 Table 2. Example data used for sensitivity and specificity calculations using data from Nepal 2017, grade 2, passage a. Benchmark from the logistic regression method is 33.6 cwpm.
10 Table 3. Data for sensitivity and specificity calculations using data from Nepal 2017, grade 2, passage a. Benchmark from the mean method is 42.5 cwpm.
11 Table 4. Mean (SD) sensitivity, specificity, and correct classification of benchmarks from all data sets.
27 Table 5. The mean (maximum) absolute difference between pairs of passages in benchmark levels, by passage reliability and sample size (cwpm).
29 Table 6. Benchmarks and key characteristics of all 35 combined datasets.
32 Table 7. Key characteristics of languages included in this study.
33 Table 8. Number of datasets (out of a total of 75 datasets separated by grade), linguistic characteristics of reading passages, and benchmarks by language.
34 Table 9. Proportion of students in each sample whose mother tongue (L1) was the language of assessment.
36 Table 10. Students classed as having high (>=30 cwpm) or low fluency and high (>=80%) or low accuracy. Statistics show the percentage of the total students in each category and the percentage within each category reading with at least 80% comprehension, from 35 combined datasets.
37 Table 11. Sensitivity, specificity, and correct classification of benchmarks set using fluency or accuracy alone and both fluency and accuracy.
41 Table 12. Comparison of benchmarking statistics using passage comprehension questions and sentence choice test as methods for assessing comprehension.
43 Table 13. Comparison of benchmarks for timed vs. untimed administration of reading passages in Nepal.
44 Table 14. Comparison of benchmarks (cwpm) set using 1-minute vs. 3-minute time limit, by different methods.
45 Table 15. Comparing strengths and weaknesses of four approaches to fluency benchmarking.
BENCHMARKING REPORT 2018 | v
1. Background
There is increasing interest in improving early grade reading globally. The Early Grade Reading Assessment (EGRA) measures reading performance and includes comprehensive measures of several key reading skills (RTI International, 2015).
The comprehensive nature of the EGRA means that some interpretation is needed when the tool is used to track improvement of an education system. Benchmarks were introduced to simplify that interpretation by focusing on a single indicator—typically oral reading fluency—against which coun-tries could measure children’s reading progress. Benchmarking involves defining a minimum value indicating proficiency on a particular measure—such as 40 correct words read per minute (cwpm) in an oral reading fluency assessment. The process of benchmarking gives policy makers an opportunity to define proficiency for a particular reading skill and thus provide a goal for schools, teachers, and the system as a whole. Benchmarks also allow for easier monitoring of progress, as they provide the number (or proportion) of students reaching a proficiency level, which can be easier to interpret than the mean reading fluency score of a population.
1.1 Goals of Benchmarking
1.1.1 Tracking Fluency vs. ComprehensionThe goal of primary grade literacy instruction is to see children reading fluently and with comprehension. It has proved challenging to derive a reliable and consistent measure of reading comprehension that can be used in benchmarking exercises. Instead, oral reading fluency has been used as a proxy for read-ing comprehension (Abadzi, 2011). Compared to comprehension, reading fluency is straightforward to measure, can be measured consistently, and is relatively easy to explain to parents and teachers. The EGRA Toolkit (RTI International, 2015) recommends that reading proficiency be defined in terms of comprehension. Thus, data can be used to assess the level of reading fluency that is indicative of good comprehension. Typically, this has involved measuring fluency rates of students with 80% comprehen-sion (four out of five questions answered correctly about the passage). This method requires a reliable assessment of comprehension which can be challenging in general (Sweet & Snow, 2003) and for the EGRA tool in particular (Bartlett, Dowd, & Jonason, 2015).
Another approach is to set normative fluency benchmarks, defining expected rates of oral reading fluency independent of comprehension. This approach could aim to set normative fluency benchmarks for each grade or else use a sample of students in higher grades to define a level of oral reading fluency at which students in lower grades are aiming.
In summary, benchmarking exercises aim to address one or both of the following questions:
• What level of oral reading fluency is indicative of comprehension?
• What level of oral reading fluency is the norm for students who are proficient readers?
This report is concerned primarily with data analysis that addressed the first of these two questions.
BENCHMARKING REPORT 2018 | 1
BACKGROUND

1.1.2 Benchmarks vs. TargetsIn addition to setting a benchmark, education policy makers may also choose to set a target for the proportion of students in each grade achieving the benchmark. Thus, an education system may set a fluency benchmark of 40 cwpm, with a target of 50% of grade 2 students and 80% of grade 3 students expected to reach this benchmark. The EGRA Toolkit recommends that benchmarks be “ambitious, but realistic and achievable” (RTI International, 2015; p.132). However, it is also recommended (RTI International, in press) to set the benchmark at a figure that is meaningful in the development of lit-eracy in the local context (e.g., a fluency benchmark that is indicative of comprehension) and to set the target accordingly. Thus, benchmarks inform targets, not the other way around. In this view, it is not good practice to lower a benchmark simply because insufficient numbers of students are achieving it. A better approach adopted by a few countries is to adopt an intermediate benchmark (see Section 3.1).
1.2 Aims and Outline of the ReportThis report uses data from multiple benchmarking exercises in nine languages to address key questions related to benchmarking. The analyses relate to the use of oral reading fluency as a proxy for comprehension, the first of the two questions outlined at the end of Section 1.1.1
Section 2 describes the data used throughout the report.
Section 3 explores the use of different methods to set oral reading fluency benchmarks against comprehension levels. They key question addressed was:
How do different methods of estimating a benchmark compare?We compared several different statistical methods in terms of the level and the precision of the benchmark they produce.
Section 4 uses one of the fluency benchmarking methods described in Section 3 (the logistic regression method) and applies it to addressing other research questions about fluency benchmarks.
What factors determine the level and precision of a benchmark estimate? What are the implications for fluency benchmarking tools and data collection methods?
We look at how benchmark levels and precision are affected by properties of the assessments (reliability of comprehension questions, difficulty of the questions) and properties of the sample (sample size, number of students passing the benchmark, grade level).
How do benchmarks compare across languages?
We assess how well comprehension levels can be predicted from oral reading fluency (ORF) data in different languages. Is fluency a good predictor of comprehension even in shallow orthographies (a spelling system with consistent letter-sound relationships)? We also investigate properties of the lan-guage (e. g., sentence and word length) that may influence benchmark levels.
BENCHMARKING REPORT 2018 | 2
BACKGROUND

Section 5 explores benchmarking at early stages of reading development and in higher grades. They key question addressed was:
How can benchmarks be set at different levels of reading proficiency?
We examine results of setting benchmarks at different grade levels and different levels of ability. This helps us to understand how and whether benchmarks should be adjusted when moving to higher grades. We also investigate methods for benchmarking proficiency in samples where very few children are reading fluently and whether the addition of reading accuracy data can help predict comprehen-sion for beginner readers.
Section 6 examines different approaches to assessing comprehension and their implications for flu-ency benchmark setting. They key question addressed was:
How can comprehension be reliably assessed?
We investigate a new method of assessing comprehension using the sentence choice test and compare it with the existing method of asking comprehension questions about an oral reading passage. We also compared benchmarking in passages with and without time limits and methods using an alterna-tive measure of comprehension.
In Section 7 we draw implications from the analyses for benchmarking practice in general.
2. Data
We analyzed datasets with reading fluency and comprehension data from nine languages in seven countries. In total, we analyzed 26,867 EGRAs. For some research questions, we ran separate analyses for each combination of grade, language, country, year, and passage, producing a total of 75 datasets (Table 1).
Most of these datasets (72 in total) involved the same reading passages given to multiple grades. For most analyses below, we combined datasets from multiple grades into single multi-grade datasets, resulting in a total of 35 datasets. We excluded samples of less than 150 students (6 dataset) and those with comprehension questions with poor reliability (Cronbach’s alpha < 0.5; an additional 8 datasets) except where we were examining the influence of sample size and reliability on benchmarking results. Thus, in most cases, analyses were conducted with datasets of reasonable sample size and validity—totaling 21 datasets. Each analysis generated several statistics such as an estimated benchmark and its precision. The statistics generated in each analysis are detailed in Appendix A. These statistics were compiled into a meta-dataset across all the benchmarking samples. This meta-dataset was used as the basis for all the analyses described below. Each benchmark estimate is an observation in this meta-analysis regardless of the sample size used to determine the estimate.
BENCHMARKING REPORT 2018 | 3
DATA

Table 1 Number of datasets: Benchmarking samples by country, language, year, organization, and grade.
Country Language Year Orga Grade
1 2 3 4 Total
Bangladesh Bangla 2017 RtR 2 2
Cambodia Khmer 2016 RtR 2 2 4
2017 RtR 2 2 2 6
India Hindi 2015 RtR 4 4 8
Laos Lao 2016 RtR 4 3 7
2017 RtR 2 2 2 6
Nepal Nepali 2016 RtR 3 3 6
2017 RtR 2 2 2 6
2016 RtR 4 2 2 6
South Africa Sepedi 2015 RtR 3 3 6
Xitsonga 2015 RtR 3 3 6
Sri Lanka Sinhala 2015 RtR 3 3 6
Tamil 2015 RtR 3 3 6
Total 6 18 27 24 75
aRtR = Room to Read; RTI = RTI International
BENCHMARKING REPORT 2018 | 4
DATA

3. Methods to Set and Evaluate Benchmarks
3.1 Current Approaches to BenchmarkingBefore examining different approaches to setting fluency benchmarks, we first review the current recommended approach. The following steps are recommended in the EGRA Toolkit (RTI International, 2015; p. 133):
• Step 1: Begin by discussing the level of reading comprehension that is acceptable as demonstrating full understanding of a given text. Most countries have settled on 80% or higher (usually, four or more correct responses out of five questions) as the desirable level of comprehension.
• Step 2: Given a reading comprehension benchmark, EGRA data are used to show the range of ORF scores—measured in cwpm—obtained by students able to achieve the desired level of compre-hension. Discussion then is needed to determine the value within that range that is put forward as the benchmark. Alternatively, a range can indicate the levels of skill development that are acceptable as “proficient” or meeting a grade-level standard (for example, 40 to 50 cwpm).
A recent review of benchmarking practices in international education (RTI International, in press) found that most countries used comprehension data to benchmark ORF. The most common methods involve calculating the mean or median of reading fluency scores among students with 80% comprehension (see Section 3.2.1). Some countries set multiple benchmarks. For example, the Kenya Tusome program adopted an intermediate fluency benchmark indicative of non-zero comprehension in addition to one calibrated at a 75% comprehension level. Other countries set multiple benchmarks using ranges of ORF chosen by experts, but not based on a relationship with comprehension data.
3.2 Benchmarking MethodsWe compared different methods in terms of the level of benchmark set and the precision of the benchmark. We first describe the methods before describing results of comparisons.
3.2.1 Method DescriptionsWe compared methods of estimating benchmarks, and for each method, we estimate the benchmark and 95% confidence intervals around the estimate. Throughout the document we refer to the methods we compare as “the mean method,” “the median method,” “the logistic regression method,” and “the linear regression method.”
BENCHMARKING REPORT 2018 | 5
METHODS TO SET AND EVALUATE BENCHMARKS

Mean method
In this method, the fluency benchmark is calculated as the mean ORF of all students who have 80% comprehension or higher. The confidence intervals are calculated from the standard error of the estimated mean.
Median method
This method is similar to the mean method. The benchmark is calculated as the median ORF of all students with at least 80% comprehension. Confidence intervals are calculated using the non-parametric rank test.1 Confidence interval calculations are less reliable than for the other two methods.
Logistic regression model
In this method, a logistic regression model is fitted. The outcome variable is binary based on whether students achieve 80% comprehension. The independent variable is ORF from the same passage. The logistic regression estimated the probability of reaching 80% comprehension at each level of ORF. Throughout this paper we report benchmarks as the predicted fluency at which students have a 0.5 probability of reaching 80% fluency. This is designed so that the benchmark is set at a level where roughly half of students read with 80% comprehension. (Later, in Section 5.2, we report the results of adjusting the logistic regression method using different probability values, ranging from 0.5 to 0.9). The method of assessing the confidence interval on the benchmark estimate involves a few steps. First, the estimates from the statistical model are used to produce fitted probabilities for each student’s ORF (see Figure 10 for an example). Each fitted probability has a 95% confidence interval. The lower and upper bounds are then used to find the range for ORF for which a fitted probability of 0.5 falls within these bounds. The description under Section 4.1.3 below gives a detailed example of this method.
Linear regression model
In this method, a linear regression model is fitted. The outcome variable is the percentage of comprehension questions answered correctly. The independent variable is ORF. This method involves fitting a straight line to model the relationship between fluency and comprehension and estimating the fluency level at which the line reaches 80% comprehension. The 95% confidence intervals are fitted and the ORF upper and lower bound are estimated at 80% comprehension.
3.2.2 Comparison of Benchmark LevelsFigure 1 shows boxplots with the median and quartiles for each of the benchmarking levels. The graph shows that the mean and median methods produce similar estimates with the logistic regression method producing lower estimates and the linear regression method producing higher estimates. It is to be expected that the logistic regression method produces lower estimates because it aims to iden-tify a fluency level at which half of students read with understanding, whereas the mean and median methods identify a fluency level at which a large majority of students read with understanding.
1 The median confidence interval is determined by identifying data points of a certain rank order. The median’s lower 95% confidence interval is obtained from the value of the data point ranked in n/2-(1.96√n)/2 position, where n is the size the of the sample. The upper 95% confidence interval is obtained from the value of the data point ranked in 1+ n/2+(1.96√n)/2 position. Information can be found at //www.ucl.ac.uk/ich/short-courses-events/about-stats-courses/stats-rm/Chapter_8_Content/confidence_interval_single_median/
BENCHMARKING REPORT 2018 | 6
METHODS TO SET AND EVALUATE BENCHMARKS

Figure 1.
Box plots comparing four benchmarking methods applied to 21 datasets with more than 150 students and comprehension reliability > 0.5. Box plots show median benchmark levels and quartiles.
3.3 Evaluating BenchmarksThe above analysis shows that different methods produce different benchmark levels. Which method is preferable? What makes a good benchmark? In this section, we examine two aspects of the quality of benchmarks—their precision (Section 3.3.1) and their ability to predict comprehension (Section 3.3.2).
3.3.1 Comparison of Benchmark PrecisionWe define the precision of estimates as the width of the 95% confidence interval, the difference between the upper estimate and the lower estimate. We focus on the precision of the mean and regres-sion methods because the precision of the median method is harder to estimate accurately. Figure 2 shows that the mean method produces tighter confidence intervals (mean 9.4 cwpm) than the logistic regression method (mean 14.7 cwpm) or the linear regression method (14.1 cwpm). There was also less variation in the confidence intervals of the mean method compared to that in the other two methods.
BENCHMARKING REPORT 2018 | 7
METHODS TO SET AND EVALUATE BENCHMARKS

Figure 2.
Box plot showing mean and range of benchmark estimate confidence intervals from each of three methods. Each boxplot contains 21 values, representing the confidence interval from each datasets with more than 150 students and comprehension reliability > 0.5.
It is important to reflect on the interpretation of the confidence intervals for each method. Sample size is a major determinant of the precision estimate (the width of the confidence intervals). The mean and median method confidence intervals depend on the size of the sample of students who scored at least 80% on comprehension. The confidence intervals of the regression methods depend on the overall sample size.
For the mean and median methods, precision is influenced by the variation in ORF scores among the students who scored 80%+ in comprehension. The width of the confidence intervals for the regression methods depends on the fit between fluency and comprehension. The confidence intervals will be nar-rower if there is a strong relationship. The relation between fluency and comprehension does not directly affect the confidence interval estimates when using the mean and median method. Thus, the mean and median methods may produce a precise estimate of fluency that is not necessarily indicative of good comprehension (e.g., there may be many students who have the same or higher level of fluency, but do not read with comprehension). For this reason, the narrow confidence intervals for the mean and median methods may give false confidence in the precision if the appropriate checks and analyses are not made.
BENCHMARKING REPORT 2018 | 8
METHODS TO SET AND EVALUATE BENCHMARKS

Comparison of Ability to Predict ComprehensionWe compared the three methods of benchmark estimates in their ability to predict comprehension. A benchmark is predictive if it is both sensitive and specific. A benchmark is sensitive if a high proportion of students who read with 80% comprehension are above the ORF benchmark. The benchmark is spe-cific if most students with less than 80% comprehension are below the oral fluency benchmark. Given any dataset, as a benchmark level is raised, the sensitivity decreases and the specificity increases.
The concepts of sensitivity, specificity, and correct classification are illustrated in Figure 3. The figure illustrates fluency levels of students who read with less than 80% comprehension (red data points) and 80% comprehension or above (green data points). In the graph on the left, the fluency benchmark (blue line) is set relatively low at 34 cwpm. This makes the benchmark very sensitive to students who read with comprehension; 97% of students (all but one of 33 students) who read with comprehension are above the benchmark. However, several students who read with less than 80% comprehension have fluency levels above the benchmark too. In fact, only 64% of students (16/25) who do not read with comprehension are correctly classified as such by the fluency benchmark. Overall 83% of students are correctly classified by the benchmark (the proportion of students in the lower left and upper right quadrants). The graph on the right shows that raising the level of the benchmark to 52 cwpm reduces sensitivity (to 48%) to a greater extent than it raises specificity (to 84%), leading to an overall drop in correct classification rate (to 64%). We conclude that the benchmark on the left is a better predictor of comprehension than the one on the right. In practice, we could make gradual adjustments to the benchmark to optimize overall correct classification.
Figure 3.
Illustration of sensitivity, specificity, and correct classification, for students who read above 80% comprehension or below 80% comprehension.
METHODS TO SET AND EVALUATE BENCHMARKS
BENCHMARKING REPORT 2018 | 9

The concepts of sensitivity and specificity are illustrated further using data from an EGRA in Nepal in 2017 conducted with grade 2 reading passage a (Tables 2 and 3). This dataset was chosen because it provides values of sensitivity and specificity that are typical (close to the average) of overall analyses. As with the previous section, for this analysis we used 21 datasets that had sample sizes of 150 or greater and had reliable comprehension measures.
Table 2.
Example data used for sensitivity and specificity calculations using data from Nepal 2017, grade 2, passage a. Benchmark from the logistic regression method is 33.6 cwpm.
Below Benchmark[Identified -]
Above Benchmark[Identified +] Total
< 80% Comprehension [-] 60 (True -) 27 (False +) 87
> = 80% Comprehension [+] 29 (False -) 64 (True +) 93
Total 89 91180
(Total Sample)
For each model, we report three statistics.
• Sensitivity = number who read 33.5 cwpm or more and scored 80% or more on comprehension / total number who scored 80% or more on comprehension = 64/93 = 68.8%
• Specificity = number who read less than 33.5 cwpm and scored less than 80% on comprehen-sion/ total number who scored less than 80% on comprehension = 60/87 = 69.0%
• Correct Classification = total number who are correctly classified by the benchmark/total sample = (64+60)/180 = 68.9%
This correct classification statistic is a combination of specificity and sensitivity. It is the overall propor-tion of pupils who are correctly classified by the benchmark (i.e., students who read with comprehension and are above the benchmark or do not read with comprehension and are below the benchmark).
Table 3.
Data for sensitivity and specificity calculations using data from Nepal 2017, grade 2, passage a. Benchmark from the mean method is 42.5 cwpm.
Below Benchmark Above Benchmark Total
< 80% Comprehension 73 14 87
> = 80% Comprehension 52 41 93
Total 125 55 180
METHODS TO SET AND EVALUATE BENCHMARKS
BENCHMARKING REPORT 2018 | 10

The mean method produces a benchmark of 42.5 cwpm, higher than the logistic regression method benchmark of 33.6 cwpm. As a result, the logistic regression benchmark produces lower sensitivity (41/93=44.1%), higher specificity (73/87 = 83.9%), and a lower overall correct classification rate (114/180 = 63.3%).
Table 4 shows mean and standard deviation (SD) of the sensitivity, specificity, and correct classification statistics for all datasets.
Table 4.
Mean (SD) sensitivity, specificity, and correct classification of benchmarks from all data sets.
Sensitivity Specificity Correct Classification
N Mean SD Mean SD Mean SD
Logistic Regression 21 62.9% (14.2) 81.4% (13.4) 76.5% (9.0)
Mean 21 45.6% (4.0) 88.5% (6.5) 72.4% (9.3)
Median 21 51.1% (1.9) 87.1% (7.2) 73.5% (9.4)
Table 4 shows that the logistic regression method has greater sensitivity and lower specificity than the other two methods. This finding is understandable given that the logistic regression method tends to produce lower benchmarks. Lower benchmarks are more sensitive because they include more true positives. They are also less specific because they include more false negatives. The three methods have similar overall correct classification rates and represent a combination of sensitivity and specificity.
The results presented here do not point clearly to a preference of one method over another. They do, however, suggest a method to determine which benchmarks are preferable with a given dataset. It may also be possible to make small adjustments to benchmarks to optimize sensitivity and specificity. Techniques for adjusting parameters of the logistic regression method are described in Section 5.2.
Throughout the rest of the report we use the logistic regression method as the primary analysis technique for several reasons. The regression methods estimate benchmark precision based on the strength of the relationship between fluency and comprehension. This relationship is important to consider when assessing the quality of a benchmark. The mean and median methods can produce misleadingly precise estimates even when the relationship between fluency and comprehension is weak. We chose logistic regression over linear regression because it estimates the probability of students achieving a benchmark. This probability figure is a useful statistic in subsequent analyses and intuitive to interpret. A secondary consideration is that the linear regression method may not be appropriate for a discrete outcome variable with only 6 values (0-5 comprehension questions correct).
METHODS TO SET AND EVALUATE BENCHMARKS
BENCHMARKING REPORT 2018 | 11

4. Determinants of Benchmarks Level and Precision
In Section 3, we outlined methods to evaluate benchmarks and argued that the logistic regression method was particularly useful because it produced a probability statistic that is easy to interpret and a meaningful estimate of benchmark precision. The logistic regression method is particularly useful in investigating the factors that determine a benchmark level and its precision, the subject of this section.
The factors we examine include properties of the sample (Section 4.1), assessments (Section 4.2), and language (Section 4.3). The final section (4.4) looks at benchmarks set with different reading passages. The aim of all these analyses is to understand the factors that influence benchmark estimates and precision estimates, so that we can advise on approaches to data collection methods, sampling tech-niques, and analyses for establishing useful benchmarks.
4.1 Properties of the SampleThere are several aspects of the sample that can affect benchmarking results, and some of these are related to one another. Initially we treat the properties of the sample as independent factors and then discuss how they are related, where appropriate.
For analyses in this question, we use the estimate determined by the logistic regression as a primary indicator of benchmark level. For the sake of comparison in some analyses we use the median method, which is preferred over the mean method because it is more robust to outliers (see Section 7). However, the mean method produces more valid confidence intervals, and we use this method when compar-ing benchmark precision. The first determinants of benchmark level and precision we examined were properties of the sample. These properties include the sample size and student performance.
4.1.1 Sample SizeA scatter graph of sample size vs. precision for the logistic regression method (not shown) suggested that the estimates with lowest precision were found in 48 datasets with sample sizes of 150 of less. On this basis, we categorized samples sizes as those below 150 (48 data sets), those between 150–500 (21 data sets), and those above 500 (6 RTI datasets from Nepal, each with a sample size of between 2700 and 2900). Figure 4 shows the confidence intervals for the logistic regression by each of the sample size categories. The key aspect of the graph is the maximum confidence intervals in each category. For sample sizes below 150, confidence intervals can be as high as 70 cwpm. For large sample sizes between 150 and 500, the maximum confidence interval is about 35 cwpm.
DETERMINANTS OF BENCHMARKS LEVEL AND PRECISION
BENCHMARKING REPORT 2018 | 12

Figure 4. Confidence intervals in logistic regression benchmarks by sample size, based on all 75 datasets.
4.1.2 Student PerformanceWe analyzed the impact of average student performance on benchmark levels. We categorize this under “properties of the sample,” but the issue is closely related to the difficulty level of the reading passage, a property of the test rather than of the sample. Figure 5 shows that benchmarks are set at a lower level when a large proportion of the sample (greater than 0.6 or 60%) reads with 80% com-prehension (the lower right portion of the figure). In general, there is a steady decrease in benchmark level with an increasing proportion of students with 80% comprehension in the right-hand side of the graph. Below 60%, there is not a strong relationship between average student performance and benchmark level.
DETERMINANTS OF BENCHMARKS LEVEL AND PRECISION
BENCHMARKING REPORT 2018 | 13

Figure 5.
Logistic regression method benchmark levels vs. proportion of sample with 80% comprehension, based on all 75 datasets.
DETERMINANTS OF BENCHMARKS LEVEL AND PRECISION
BENCHMARKING REPORT 2018 | 14
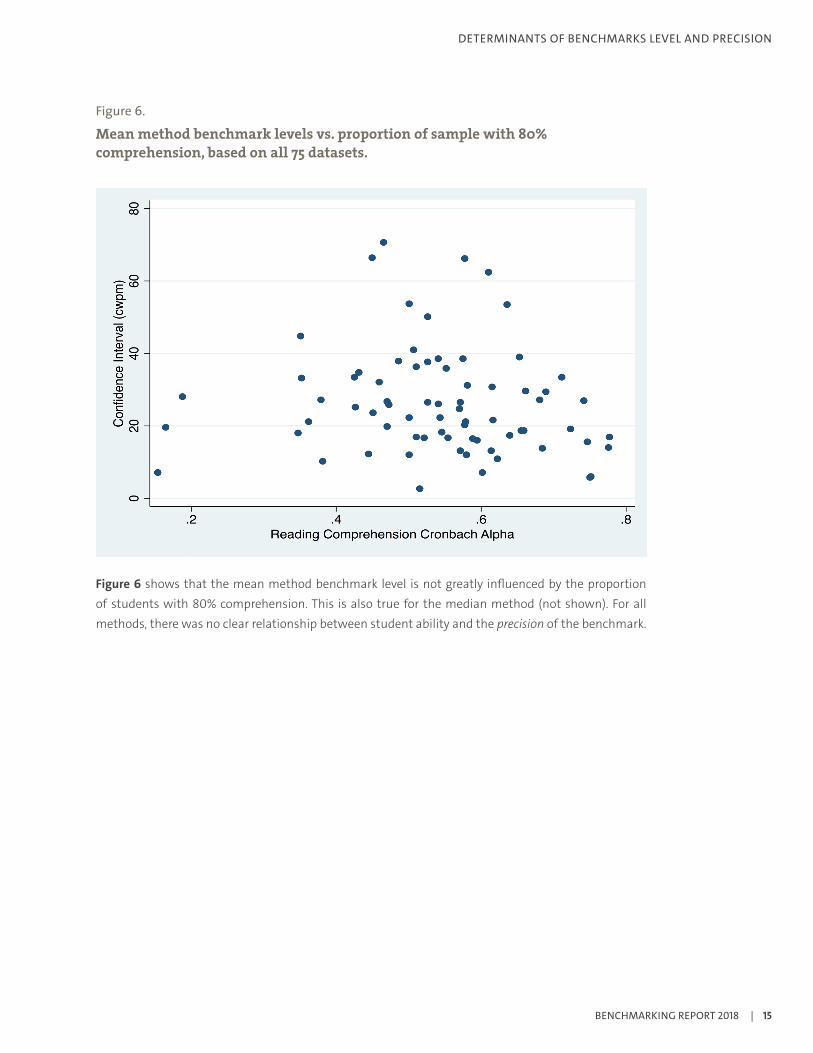
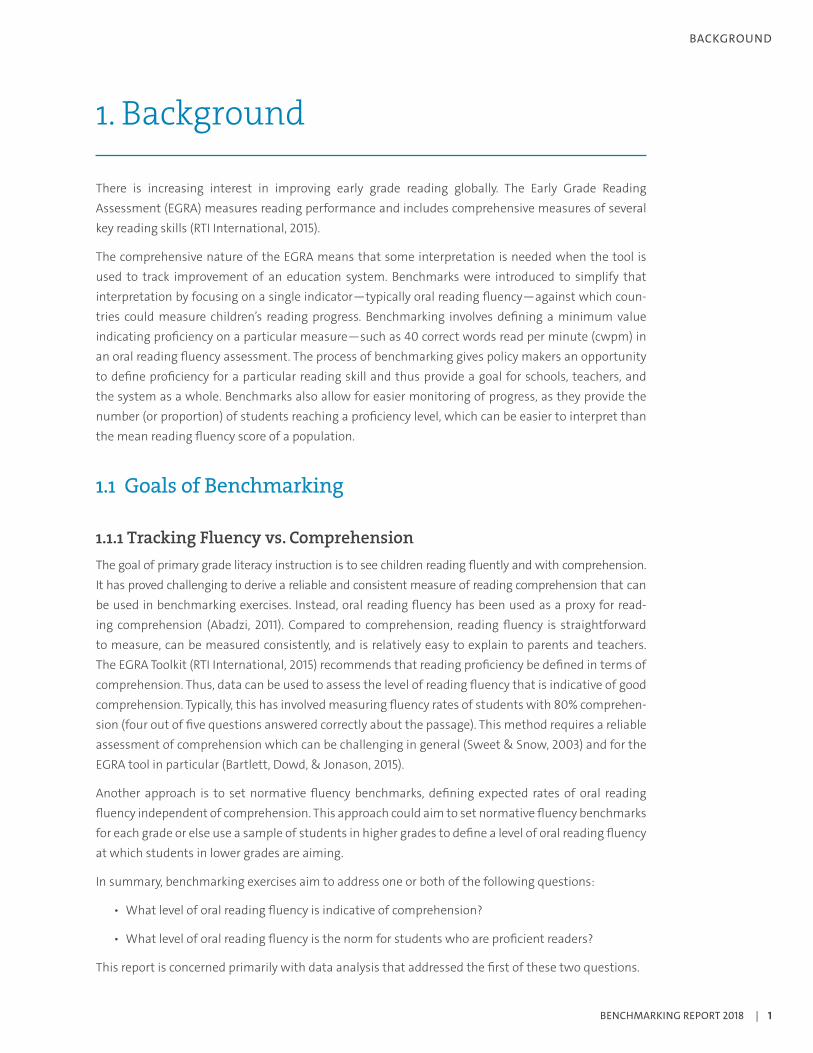
Figure 6.
Mean method benchmark levels vs. proportion of sample with 80% comprehension, based on all 75 datasets.
Figure 6 shows that the mean method benchmark level is not greatly influenced by the proportion of students with 80% comprehension. This is also true for the median method (not shown). For all methods, there was no clear relationship between student ability and the precision of the benchmark.
DETERMINANTS OF BENCHMARKS LEVEL AND PRECISION
BENCHMARKING REPORT 2018 | 15

The relationship between student performance and logistic regression method benchmark level (Figure 7) results in lower benchmarks being set for higher grades (Figure 8).
Figure 7.
Logistic regression benchmarks by grade in two example datasets from Laos and Nepal.
DETERMINANTS OF BENCHMARKS LEVEL AND PRECISION
BENCHMARKING REPORT 2018 | 16

Figure 8.
Logistic regression benchmarks by grade. Graph includes 69a estimates for each combination of grade and passage for each language.
4.1.3 Explaining the Relationship Between Student Ability and BenchmarkingIt may be a counterintuitive finding that benchmarks are lower in higher grades and for higher ability samples. An example using Laos 2016 EGRA data from one reading passage helps to explain the relationship.
Figure 9 shows the relationship between fluency and comprehension on passage 2 for grade 2 students in Laos. The ORF density histogram along the bottom of the plot shows the numbers of students at various ORF levels. There are very few students with ORF greater than 60 cwpm. The connected red data points show the mean reading comprehension calculated in buckets with a width of 5 cwpm. The mean reading comprehension is calculated regardless of the number of students in the bucket. The small number of students in buckets above 60 cwpm leads to much variability seen in mean comprehension.
a Estimates for benchmarks in grade 1 are not included in this graph because they are few and unreliable.
DETERMINANTS OF BENCHMARKS LEVEL AND PRECISION
BENCHMARKING REPORT 2018 | 17

The graph shows that there is a steady increase in comprehension from 0–50 cwpm, with mean comprehension reaching 80% between 50 and 60 cwpm. Overall, 31% of the sample read with at least 80% comprehension.
Figure 9.
ORF frequency and comprehension vs. fluency for grade 2 students reading passage 2 in Laos 2016.
Figure 10 shows the fitted probability of reaching 80% comprehension by reading fluency level, based on a logistic regression analysis of the data shown in Figure 9. The fitted graph has a reasonable slope and produces fitted probabilities from 0.1 to 0.9 over the range of 0–90 cwpm. The benchmark is set at the reading fluency level corresponding to a probability of 0.5, which is 41 cwpm. The confidence interval lines show that we have 95% confidence that the fluency benchmark is between 34 and 53 cwpm, giving a reasonable confidence interval width of 19 cwpm.
DETERMINANTS OF BENCHMARKS LEVEL AND PRECISION
BENCHMARKING REPORT 2018 | 18
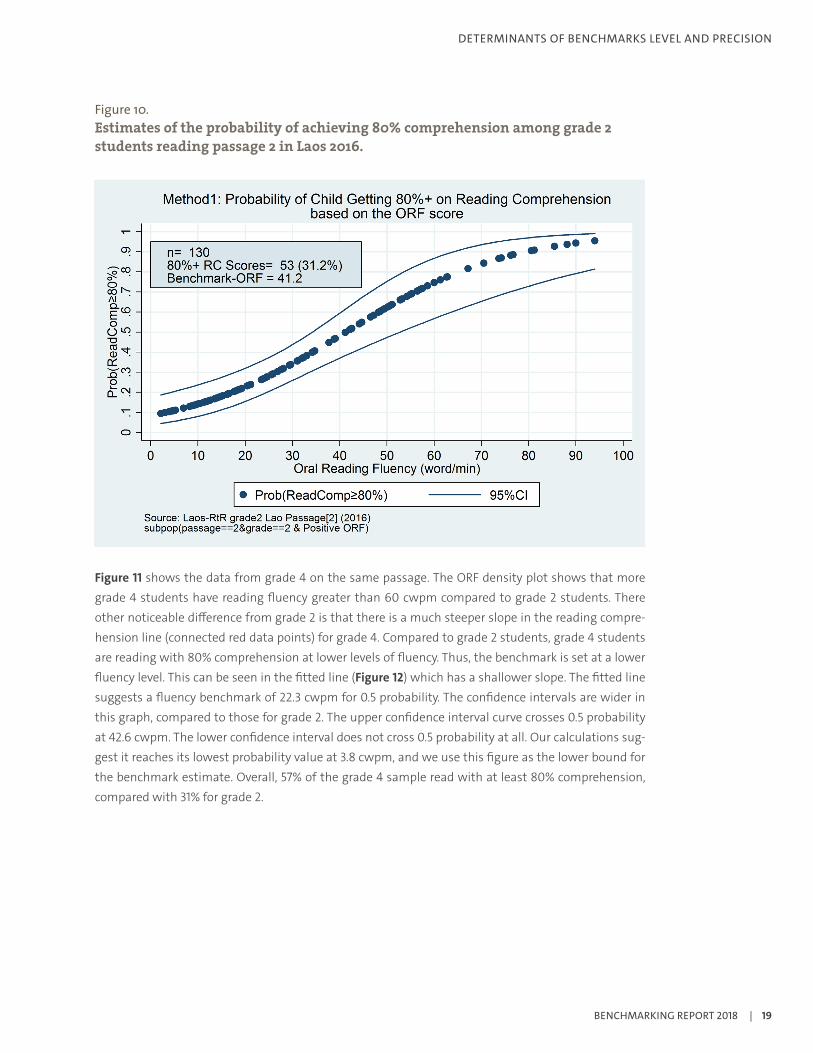
Figure 10. Estimates of the probability of achieving 80% comprehension among grade 2 students reading passage 2 in Laos 2016.
Figure 11 shows the data from grade 4 on the same passage. The ORF density plot shows that more grade 4 students have reading fluency greater than 60 cwpm compared to grade 2 students. There other noticeable difference from grade 2 is that there is a much steeper slope in the reading compre-hension line (connected red data points) for grade 4. Compared to grade 2 students, grade 4 students are reading with 80% comprehension at lower levels of fluency. Thus, the benchmark is set at a lower fluency level. This can be seen in the fitted line (Figure 12) which has a shallower slope. The fitted line suggests a fluency benchmark of 22.3 cwpm for 0.5 probability. The confidence intervals are wider in this graph, compared to those for grade 2. The upper confidence interval curve crosses 0.5 probability at 42.6 cwpm. The lower confidence interval does not cross 0.5 probability at all. Our calculations sug-gest it reaches its lowest probability value at 3.8 cwpm, and we use this figure as the lower bound for the benchmark estimate. Overall, 57% of the grade 4 sample read with at least 80% comprehension, compared with 31% for grade 2.
DETERMINANTS OF BENCHMARKS LEVEL AND PRECISION
BENCHMARKING REPORT 2018 | 19

Figure 11.
ORF frequency and comprehension vs. fluency for grade 4 students reading passage 2 in Laos 2016.
DETERMINANTS OF BENCHMARKS LEVEL AND PRECISION
BENCHMARKING REPORT 2018 | 20

Figure 12.
Estimates of the probability of achieving 80% comprehension by grade 4 students reading passage 2 in Laos 2016.
The pattern described above is illustrative of an overall pattern found across all datasets. In general, benchmark estimates are lower when reading comprehension levels of the sample are higher. It is important to be aware of this relationship when selecting a sample for a benchmarking exercise. Benchmarks derived from one grade may not be applicable in another. Counterintuitively, benchmarks set using grade 4 data may be too low for grade 2; grade 2 students reaching the grade 4 benchmark may not be reading with comprehension.
These results also argue against the practice of setting higher benchmarks for higher grades, if the aim of the benchmark is in part to be indicative of proficient reading comprehension. Another conclusion from this analysis is that benchmark estimates approach zero and become unreliable for samples where most children are reading with 80% comprehension. The implication is that the ability of the sample should be matched to the aims of the benchmarking exercise. We return to these issues in Section 5.
4.2 Properties of the AssessmentsThis section examines how fluency benchmarks are affected by the characteristics of the reading passages used. We examine how benchmark precision is influenced by the internal reliability of com-prehension questions and then compare benchmark estimates from different passages on the same sample of students.
DETERMINANTS OF BENCHMARKS LEVEL AND PRECISION
BENCHMARKING REPORT 2018 | 21

4.2.1 Internal Reliability of Comprehension PassagesA key determinant of the precision of benchmark estimates is the reliability of the reading comprehension measure. We assess reliability of the passages using the Cronbach’s alpha statistic. This statistic is a measure of the correlation among responses to the comprehension questions. The statistic will be high if students who answer question 1 correctly, say, also answer the other questions correctly. Figure 13 shows that the Cronbach’s alpha internal reliability statistic for comprehension questions largely varied from around 0.4 to 0.8, although three outlying datasets had internal reliability of less than 0.2. Acceptable reliability is typically defined as being 0.7 or above. Figure 13 shows that the least reliable estimates—those with confidence intervals of 40 cwpm or more—are all derived from comprehension questions with internal reliability below the 0.7 threshold. The data suggest that good comprehension question reliability is associated with narrow confidence intervals, but the reverse is not necessarily the case: low comprehension reliability is not always associated with large confidence intervals. Nevertheless, the implications are clear that ensuring good reliability of comprehension questions is an important part of setting accurate benchmarks. Reliability of comprehension questions can be improved through pilot testing passage reading tests and removing or editing unreliable questions.
Figure 13.
Scatter plot of comprehension question reliability (Cronbach’s alpha statistic) and logistic regression benchmark confidence intervals from 72 datasets.a
a Excluding three datasets from Nepal for which precision estimates could not be calculated
DETERMINANTS OF BENCHMARKS LEVEL AND PRECISION
BENCHMARKING REPORT 2018 | 22

4.2.2 Benchmarks Set Using Different PassagesFor datasets where more than one passage was used, we compared benchmark estimates and comprehension levels for the two passages. Figures 14 and 15 show the relationship between key statistics from passage 1 and passage 2. Figure 15 shows that there is a strong relationship (r= .86) between the proportion of students achieving 80% comprehension on passage 1 and the proportion of students achieving 80% comprehension on passage 2. There was a similarly strong relationship between logistic regression method benchmarks (r= .72, Figure 16) for the two passages.
Figure 14.
Proportion of sample reaching 80% comprehension for reading passage 1 vs. reading passage 2.
DETERMINANTS OF BENCHMARKS LEVEL AND PRECISION
BENCHMARKING REPORT 2018 | 23

Figure 15.
Logistic regression method benchmark estimate for reading passage 1 vs. reading passage 2.
We conducted further analysis to examine the variation in benchmarks derived from different passages. We compared benchmarks derived from different passages read by the same sample of students. For 26 datasets, there were at least two passages available for comparison. For 13 datasets, there were three passages available for comparison. In the latter case, we calculated differences for all three com-parisons (passage 1 vs. passage 2, passage 1 vs. passage 3, and passage 2 vs. passage 3).
Figures 16 and 17 show the distribution of the differences in logistic regression and mean method benchmarks between pairs of passages. There was more variability between passages for the logistic regression method. There were 17 comparisons where the logistic regression method differed by more than 20 cwpm (Figure 16), compared with only 4 such comparisons for the median method (Figure 17).
DETERMINANTS OF BENCHMARKS LEVEL AND PRECISION
BENCHMARKING REPORT 2018 | 24

Figure 16.
Distribution of differences in logistic regression benchmarks between pairs of passages administered to the same sample of students.
DETERMINANTS OF BENCHMARKS LEVEL AND PRECISION
BENCHMARKING REPORT 2018 | 25

Figure 17.
Distribution of differences in median method benchmarks between pairs of passages administered to the same sample of students.
The biggest differences between benchmarks were found in South Africa, 2015 (both Sepedi and XiTsonga); Sri Lanka, 2015 (Sinhala only); and Nepal, 2016.
The above analyses include all datasets, regardless of sample size or the internal reliability of passages. Table 5 describes the level of disagreement between pairs of passages according to the internal reliability of the passage comprehension questions and the size of the sample. The largest variation between pas-sages occurs for small sample sizes, especially when one of the passages has poor internal reliability. Large variation between passages is found for the logistic regression method, but not for the median method. When the sample size is larger than 150, the benchmarks set are more consistent. A pair of passages give benchmark estimates that differ on average by around 10 cwpm.
DETERMINANTS OF BENCHMARKS LEVEL AND PRECISION
BENCHMARKING REPORT 2018 | 26

Table 5.
The mean (maximum) absolute difference between pairs of passages in benchmark levels, by passage reliability and sample size (cwpm).
Sample size < 150 Sample size > = 150
One or more passages with internal reliability < 0.5
Logistic regression 23.5 (55.7) 5.7 (11.2)
Median method 8.1 (24.5) 5.6 (19.0)
Number of pairs 19 7
Both passages with internal reliability > = 0.5
Logistic regression 15.2 (38.5) 9.3 (21.7)
Median method 7.8 (21.8) 11.6 (29.8)
Number of pairs 19 10
The overall conclusion of these findings is that there is some variability in benchmark levels set using different passages. For larger samples, we expect benchmarks set using reliable comprehension ques-tions to vary by around 10 cwpm. The implication is that it may be difficult to set benchmarks with any greater precision than 10 cwpm. A second implication is that the accuracy of benchmarks can be improved by using more than one passage and by taking a mean of the benchmarks produced for each passage.
4.3 Properties of the LanguageFigure 18 shows that there was considerable variation in benchmark levels by language.2 Khmer had the highest benchmarks, with the other languages at levels similar to each other. Sepedi and XiTsonga had the greatest variation in benchmark levels between different datasets (involving different grades and different passages).
2 Data from Nepal in 2016 and in Hindi were collected using a 1-minute time limit for passage reading. This method artificially inflated benchmarks comparted to the 3-minute time limit method used with other datasets. Based on analysis presented later we re-estimated benchmarks with comprehension calculated as a percentage of items attempted, rather than as a percentage of total items. See Section 6.2 for details.
DETERMINANTS OF BENCHMARKS LEVEL AND PRECISION
BENCHMARKING REPORT 2018 | 27

Figure 18.
Boxplot of benchmark levels by language. Box plots show range of estimates of samples (35 in total) with multiple grades combined.
We first consider the reliability of benchmarks in each language. Figure 14 shows that benchmark estimates for Bangla, Hindi, Khmer, and Lao are within a reasonably narrow range. The estimates for all languages are listed in Table 6 with key characteristics of each of the 35 samples. Risk factors for unreliable benchmark estimates are shaded in pink. These include R-squared less than 0.1 (i.e., poor model fit), small sample size, too many (> 60%) students reading with 80% comprehension, and low comprehension question reliability (<= 0.5). Datasets with these characteristics tended to have logistic regression benchmark estimate confidence intervals (CI) greater than 20 cwpm (also shaded in pink). Datasets in Sepedi, Sinhala, Tamil, and XiTsonga had unreliable comprehension questions and/or a large proportion of students reading with 80% comprehension. In addition, both Sri Lankan data sets (Tamil and Sinhala) had small sample sizes. For Sinhala, the model fit was poor with R-squared less than 0.1 for all three passages. In one case, the R-squared was zero, implying no relationship between fluency and comprehension. This dataset produced an outlier estimate of 112 cwpm for the fluency benchmark. This estimate was excluded from analyses and is not included in Figure 18. In general, we found that languages with a narrow cluster of benchmark estimates were those with few risk factors for unreliable estimates. Datasets with a wide range of estimates typically had
DETERMINANTS OF BENCHMARKS LEVEL AND PRECISION
BENCHMARKING REPORT 2018 | 28

several risk factors for unreliable estimates. The one exception to this pattern was Nepali. By and large, Nepali datasets had characteristics associated with reliable benchmarks. In spite of this, a large spread of benchmark estimates was produced for Nepali. There is no clear explanation for this variation in Nepali benchmarks. It is worth noting that Nepal was the only country where bench-marks were set by two different organizations (Room to Read and RTI) and was the country where most students were being tested in a second languages (discussed below after Table 8). We next turn to linguistic factors to understand differences in benchmark levels.
Table 6.
Benchmarks and key characteristics of all 35 combined datasets.
Language Year Grade Passage NProportion with 80%
comprehension
Comprehension question
reliability
Median Benchmark
(cwpm)
Logistic Regression Benchmark
(cwpm)
Logistic Regression
CI (cwpm)
R2
Bangla 2017 3 1 431 0.44 0.50 46.3 41.9 11.7 0.13
Bangla 2017 3 2 431 0.49 0.62 54.0 40.5 10.6 0.18
Hindi 2015 1-2 1 454 0.21 0.68 63.8 48.2 10.0 0.52
Hindi 2015 1-2 2 453 0.25 0.52 64.4 44.8 13.0 0.48
Hindi 2015 1-2 3 444 0.27 0.09 77.0 43.5 13.0 0.57
Hindi 2015 1-2 4 433 0.18 0.58 65.6 57.5 15.0 0.44
Khmer 2016 2-3 1 301 0.36 0.58 82.0 67.5 18.0 0.24
Khmer 2016 2-3 2 300 0.34 0.59 81.0 67.2 19.0 0.24
Khmer 2017 2-4 1 540 0.33 0.55 61.4 59.6 15.8 0.15
Khmer 2017 2-4 2 540 0.38 0.59 77.1 58.7 11.4 0.28
Lao 2016 2,4 1 279 0.38 0.54 50.2 43.2 17.2 0.16
Lao 2016 2,4 2 290 0.42 0.64 48.4 37.2 18.0 0.13
Lao 2016 2 3 152 0.26 0.71 43.1 41.5 33.1 0.11
Lao 2016 2,4 4 268 0.41 0.74 47.5 35.3 12.5 0.22
Lao 2017 2-4 1 667 0.49 0.49 52.4 43.9 11.8 0.07
Lao 2017 2-4 2 667 0.54 0.60 54.5 39.4 8.0 0.15
Nepali 2016 3-4 1 254 0.16 0.57 51.0 67.4 24.9 0.21
Nepali 2016 3-4 2 245 0.34 0.76 54.0 46.7 11.0 0.38
DETERMINANTS OF BENCHMARKS LEVEL AND PRECISION
BENCHMARKING REPORT 2018 | 29

Language Year Grade Passage NProportion with 80%
comprehension
Comprehension question
reliability
Median Benchmark
(cwpm)
Logistic Regression Benchmark
(cwpm)
Logistic Regression
CI (cwpm)
R2
Nepali 2016 3-4 3 217 0.37 0.57 44.0 44.2 13.6 0.20
Nepali 2017 2-4 1 375 0.55 0.59 43.0 31.2 10.0 0.13
Nepali 2017 2-4 2 356 0.45 0.46 39.0 39.7 14.0 0.08
Nepali (RTI) 2016 1-3 1 8467 0.14 0.63 35.0 29.5 3.0 0.47
Nepali (RTI) 2016 1-3 2 8475 0.13 0.76 33.2 32.2 4.0 0.32
Sepedi 2015 3-4 1 181 0.52 0.49 54.9 44.7 13.1 0.13
Sepedi 2015 3-4 2 179 0.80 0.43 62.1 20.4 21.3 0.10
Sepedi 2015 3-4 3 180 0.34 0.44 63.1 72.9 25.8 0.09
Sinhala 2015 3-4 1 99 0.58 0.53 61.0 46.6 34.9 0.09
Sinhala 2015 3-4 2 99 0.77 0.54 68.0 18.8 33.8 0.09
Sinhala 2015 3-4 3 99 0.43 0.57 60.0 112.4 20.7 0.00
Tamil 2015 3-4 1 99 0.69 0.49 63.2 29.1 31.7 0.15
Tamil 2015 3-4 2 95 0.76 0.48 61.0 22.6 27.9 0.14
Tamil 2015 3-4 3 94 0.76 0.58 56.9 30.5 15.5 0.35
XiTsonga 2015 3-4 1 179 0.47 0.50 75.0 63.2 16.5 0.21
XiTsonga 2015 3-4 2 180 0.61 0.57 65.6 39.3 25.9 0.10
XiTsonga 2015 3-4 3 181 0.65 0.43 57.3 31.5 21.7 0.12
Note: Bolded type indicates risk factors for unreliable benchmark estimates.
4.3.1 Literature on Language Characteristics and Reading Fluency
We aimed to investigate features of the 10 languages that could influence the benchmark levels found. Before discussing data from our study, we briefly review the literature addressing this issue.
Much of the existing comparisons among languages begins by examining transparency. Katz and Frost (1992) described the orthographic depth hypothesis and how the difference in orthography can influence reading acquisition. The orthographic depth, or the transparency, of a language refers to the consistency between the sounds and the written symbols that represent them. A language that has sounds that map to symbols in a one-to-one correspondence are described as having a shallow,
DETERMINANTS OF BENCHMARKS LEVEL AND PRECISION
BENCHMARKING REPORT 2018 | 30

or transparent, orthography. For example, the Kiswahili word “kitabu” has six symbols that each map to one of its six sounds. Conversely, an orthography that is less consistent in the relationships between sounds and symbols is considered deep, or opaque. An example is the English word “weigh” which has two sounds that map to five symbols.
Research has shown that a reader who does not encounter difficulties learning to read a shallow orthography, may have difficulty learning to read a deep orthography. (Ellis et al., 2004; Landerl et al., 1997; Wydell & Butterworth, 1999). An influential paper by Seymour and colleagues (2003) com-pared young readers from 13 European languages to understand how the linguistics differences of a language’s orthography influence word reading automaticity in that language. They found that the complexity of the syllable and the depth of the orthography influences the rate of successful reading acquisition. More specifically, they found that learning to read in a shallow orthography (e.g., Greek, Spanish) is twice as fast as learning to read in a deep orthography (e.g., English, French). They argue that children learning to read in a deep orthography can take 2.5 years compared to 1 year for a shallow orthography. Relatedly, Ziegler and colleagues (2010) found that the predictors of reading acquisition were the same across alphabetic languages (Dutch, Finnish, French, Hungarian, Portuguese) but that the importance of the predictors aligned if the orthographies were similarly shallow or similarly deep.
In addition to transparency, there are other language features and contextual factors that influence learning to read. An obvious difference between alphabets and alpha-syllabaries is the number of symbols3 that one needs to learn to be a reader in that language. In an alphabetic orthography (e.g., English), the average number of symbols to learn is between 20–30. In an alpha-syllabary the aver-age number of symbols is much higher (400) and therefore takes longer to learn. Nag (2007) found that it took 3 to 4 years to master the symbols of the alpha-syllabary used in the Kannada language.
Another visual feature of a language that influences word reading accuracy is word length. Languages that have an agglutinative structure combine more morphemes within white space differentiating words. The words are longer. Furthermore, because morphemes will change to match the meaning of the word or phrase, in a language that relies on an agglutinative structure, there are few identical words repeated in beginning text. Repetition is necessary to become automatic with word reading, and the lack of it influences reading development. For example, the language isiZulu has a transpar-ent orthography, as it has consistent one-to-one symbols to sound relationship as well as having consistent syllable structure. However, it was hypothesized that these advantages would be modi-fied by having morphologically complex word units consisting of roots and affixes that constantly change, seen in the reliance on the agglutinative structure.
This hypothesis was supported by Van Rooy and Pretorius (2013) who showed that beginning readers had lower accuracy reading for the agglutinating language (isiZulu) compared to the alphabetic lan-guage (English). The apparent advantages of a transparent alphabetic orthography were outweighed by the effects of the agglutinative structure and the longer words.
3 It has been estimated that it takes up to 6 years to learn Chinese symbols (Shu, Chen, Anderson, Wu, & Xuan, 2003).
DETERMINANTS OF BENCHMARKS LEVEL AND PRECISION
BENCHMARKING REPORT 2018 | 31

4.3.2 Characteristics of Languages in This Study
We reviewed characteristics of the 10 languages in this report. Table 7 identifies key characteristics of each language. We focus on factors that may affect fluency rates or the fluency-comprehension relationship. Agglutination is included because it involves having longer words, which results in a lower fluency rate (in words per minute) and also results in delays in learning to read compared to languages with shorter words. The final column shows the number of graphemes present in the language. Languages with more graphemes take longer to learn. All of the Asian languages are alpha-syllabaries, whereas the two South African languages (Sepedi and XiTsonga) use the Latin alphabet. All languages had transparent orthographies. Khmer is notable for having 130 graphemes, almost twice as many as any of the other languages.
Table 7.
Key characteristics of languages included in this study.a
Language Writing system(linguistic unit) Script Agglutination Grapheme
inventory
Bengali Alpha-syllabary (abugida) Devangani No 57
Hindi Alpha-syllabary (abugida) Devangani No 66
Khmer Alpha-syllabary (abugida) Khmer No 130
Lao Alpha-syllabary (abugida) Lao No 78
Nepali Alpha-syllabary (abugida) Devangani No 47
Sepedi Alphabet Latin Yes 42
Sinhala Alpha-syllabary (abugida) Sinhali No 71
Tamil Alpha-syllabary (abugida) Tamil Yes 47
XiTsonga Alphabet Latin Yes 26
aData in Table 7 were compiled from the works cited in the reference list that are noted with an asterisk (*).
Table 8 summarizes key aspects of our dataset by language. There was considerable variation in mean words per sentence across the passages used, from 3.9 words per sentence in Tamil to 11.3 words per sentence in XiTsonga. Word length varied from 1.2 syllables per word in Khmer to 2.9 syl-lables per word in Sinhala and Tamil.
DETERMINING BENCHMARKS AT EARLY STAGES OF READING DEVELOPMENT
BENCHMARKING REPORT 2018 | 32

Table 8.
Number of datasets (out of a total of 75 datasets separated by grade), linguistic characteristics of reading passages, and benchmarks by language.
Language Number of datasets
Mean words per sentence
Mean syllables per word
Mean logistic regression
benchmark (cwpm)
Bengali 2 5.5 1.8 41.2
Hindi 8 5.2 2.2 56.0
Khmer 10 5.6 1.2 63.6
Lao 13 6.3 1.3 32.3
Nepali 18 4.3 2.6 40.1
Sepedi 6 7.5 1.7 45.2
Sinhala 6 5.9 2.9 37.0
Tamil 6 3.9 2.9 27.5
XiTsonga 6 11.3 2.0 43.0
We examined bivariate relationships between key linguistic characteristics and benchmark levels. Few clear relationships emerged, probably because of considerable variation in other confounding factors—such as grade levels, comprehension levels of the sample, and comprehension question reliability—between languages. Also, small sizes, both in terms of number of students per dataset and the number of languages, may have played a factor in this limitation.
4.3.3 Language of Assessment
When children are assessed in a language other than their mother tongue, they are likely to show delayed development of oral reading fluency. In these cases, it is possible that benchmark estimates may be set at a higher level. Table 9 shows that almost all students were assessed in their mother tongue, except in datasets from Nepal and India. It is hard to draw firm conclusions on the influ-ence of language of assessment on the benchmark levels presented in Figure 14. To help interpret findings, it is recommended that the students’ home language be collected for any benchmarking exercise in which the population is known to speak more than one language.
DETERMINING BENCHMARKS AT EARLY STAGES OF READING DEVELOPMENT
BENCHMARKING REPORT 2018 | 33
Table 9.
Proportion of students in each sample whose mother tongue (L1) was the language of assessment.
Country Language Year Orgb % of L1
Bangladesh Bangla 2017 RtR 100%
Cambodia Khmer 2016 RtR 100%
2017 RtR 99%
India Hindi 2015 RtR 63%
Laos Lao 2016 RtR 90%
2017 RtR 100%
Nepal Nepali 2016 RtR 43%
2017 RtR 56%
2016 RTI 33%
South Africa Sepedi 2015 RtR >90%a
Xitsonga 2015 RtR >90%a
Sri Lanka Sinhala 2015 RtR 100%
Tamil 2015 RtR 100%
aEstimate based on separate datasetbOrganization collecting data—Room to Read (RtR) or RTI International
5. Determining Benchmarks at Early Stages of Reading DevelopmentFluency benchmarks are only useful for tracking progress of an education system if reasonable numbers of students are achieving the benchmark fluency level. In cases where only a small percentage of stu-dents reach the benchmark at the end of grade 1, for example, the results can be discouraging.
Furthermore, results reported in terms of numbers of students reaching a fluency benchmark of 40 cwpm fail to capture progress made by a student improving from 0 cwpm to 30 cwpm, for example. As a result, some countries have used benchmarks at lower levels of fluency for lower grades. These lower benchmarks are often set using the judgement of policy makers and other experts, but are not
DETERMINING BENCHMARKS AT EARLY STAGES OF READING DEVELOPMENT
BENCHMARKING REPORT 2018 | 34

derived from data-driven analyses of the relationship between fluency comprehension or students’ typical learning trajectories. In this section, we consider two different data-driven approaches to setting benchmarks for lower levels of reading proficiency—before students read fluently and with comprehension. The first method uses information about students’ reading accuracy. The second method involves adjusting parameters in logistic regression models presented above.
5.1 Benchmarking Using Reading Accuracy
Reading accuracy is defined as the percentage of words a student correctly read out of the total number of words that student attempted. Accurate reading is also part of ORF, because only words read correctly are counted in a student’s fluency rate. However, reading accuracy, as defined above, is calculated independent of reading rate. It is expressed as a proportion of the words read, however many are read in the passage time limit. Unlike fluency, the relationship between accuracy and com-prehension has not been examined extensively. Typically, children learn to read accurately before they read fluently. It is possible that children who read accurately but slowly may be reading with comprehension before their fluency rate reaches the benchmark.
Reading accuracy statistics were available in all 35 datasets. Table 10 shows the proportion of students with high and low fluency and high and low accuracy. The proportion was calculated for each sample and an unweighted average of all proportions was calculated across datasets. To be consistent across datasets we defined “high fluency” as reading at least 30 cwpm. High accuracy was defined as correctly reading at least 90% of the words attempted. These definitions were based on our interpretation from scatter plots of the lowest levels of fluency and accuracy at which some students read with comprehension. Most of the students in our samples had both high fluency and high accuracy (50.4%) or low fluency and low accuracy (35.3%). Fewer students had high accuracy and low fluency (6.0%) or low accuracy and high fluency (8.3%).
Levels of reading comprehension differed significantly in the four categories. Few (9.0%) students with low fluency and low accuracy read with comprehension (defined as 80% comprehension or above). A similar proportion of students with low fluency and high accuracy (37.0%) or high fluency and low accuracy (37.1%) read with comprehension. As would be expected, students read with a higher rate of comprehension (67.3%) when they read with both accuracy and fluency.
DETERMINING BENCHMARKS AT EARLY STAGES OF READING DEVELOPMENT
BENCHMARKING REPORT 2018 | 35

Table 10.
Students classed as having high (>=30 cwpm) or low fluency and high (>=80%) or low accuracy. Statistics show the percentage of the total students in each category and the percentage within each category reading with at least 80% comprehension, from 35 combined datasets.
Fluency < cwpm Fluency > = cwpm
% of sample > % comprehension % of sample > %
comprehension
Accuracy < 90% 35.3% 9.0% 8.3% 37.1%a
Accuracy > = 90% 6.0% 37.0%b 50.4% 67.3%
a2 of 35 samples have no students with low accuracy and high fluencyb1 of 35 datasets has no students with low fluency and high accuracy
We investigated whether an accuracy benchmark was more effective at predicting comprehension than a fluency benchmark. In order to do this, we constructed three separate logistic regression models to set benchmarks based on (i) fluency only, (ii) accuracy only, and (iii) fluency and accuracy combined. We assessed the benchmarks for their ability to predict which students read with comprehension, following the approach used in Section 3.2.2. Table 11 compares the specificity, sensitivity, and correct classification of the three methods. The three benchmarks produced fairly similar statistics. Fluency benchmarks were set at a slightly higher level than accuracy benchmarks, such that they had slightly lower sensitivity and higher specificity than accuracy benchmarks. The correct classification rate was similar—around 75%—whether setting benchmarks based on accuracy alone, fluency alone, or accuracy and fluency combined. Similarly, the fit of the three models was comparable, in a range from 0.20 to 0.26.
DETERMINING BENCHMARKS AT EARLY STAGES OF READING DEVELOPMENT
BENCHMARKING REPORT 2018 | 36

Table 11.
Sensitivity, specificity, and correct classification of benchmarks set using fluency or accuracy alone and both fluency and accuracy.
Datasets Sensitivity Specificity Correct classification R2
Fluency only 33 67.7 70.4 74.6 0.23
Accuracy only 33 73.8 60.9 73.3 0.20
Fluency and Accuracy 33 79.8 62.2 76.3 0.26
The implication of these analyses relates to the ability of accuracy and fluency benchmarks to serve as a proxy for comprehension. Results show that either measure by itself is an adequate proxy for comprehension. Accuracy benchmarks were not more effective than fluency benchmarks at identifying students at earlier stages of reading development.
Our somewhat surprising conclusion is that fluency and accuracy are equally as effective at setting benchmarks indicative of comprehension. There is little advantage to combining fluency and accuracy in setting a benchmark.
5.2 Adjusting Parameters of the Logistic Regression Bench-marksAnother approach to setting lower benchmarks involves adjusting parameters from the logistic regression models presented above. In the analyses in previous sections, the logistic regression method estimated fluency benchmarks at which the probability of reading with comprehension was 0.5. This method results in a benchmark at which about 50% of the sample would be expected to read with comprehension. To produce a lower benchmark, the probability value in the estimate can be adjusted to produce an estimate of reading fluency at which 40% of the sample can read with comprehension, for example. Figure 19 illustrates this approach applied to one dataset from grade 2 in Nepal. The graph shows output from the logistic regression model. Blue datapoints are estimates of the probability of reading with comprehension for a given reading fluency level. The two surrounding blue lines represent the upper and lower bounds of the estimates. The graph illustrates the different benchmark levels derived by identifying the fluency level associated with different p values, from 0.3 to 0.8. The derived benchmarks range from 17.7 cwpm (for p=0.3) to 59.5 cwpm (for p=0.8). The graph shows that the confidence in the estimates (the range from lower to upper bound represented by the thin blue lines) is highest for p values of around 0.5. The range widens considerably at below p=0.3 and above p=0.8, where estimates are unlikely to be precise. These results suggest that an appropriate p value for this data set lies between 0.4 and 0.7 in order to obtain sufficiently precise estimates. In general, p values should be chosen to allow for acceptable levels of precision.
DETERMINING BENCHMARKS AT EARLY STAGES OF READING DEVELOPMENT
BENCHMARKING REPORT 2018 | 37

Figure 19.
Benchmarks set using different p values in the logistic regression method. Data from Nepal, grade 2 passage a.
Figure 20 summarizes the results of applying the above methods to all datasets. Logistic regression benchmarks were generated for each dataset with probability values ranging from 0.3 to 0.8. The corresponding mean benchmark estimates across datasets vary from 32 cwpm to 77 cwpm. The variability in benchmark level is similar at each probability value. It should be noted, however, that Figure 20 shows data only from samples with more than 150 students, where the reliability of comprehension passages was at least 0.5. Analyses suggest that lower benchmark estimates are more vulnerable to these sample characteristics. When smaller samples with less reliability were included in the analysis, the estimates with lower p values became unstable.
DETERMINING BENCHMARKS AT EARLY STAGES OF READING DEVELOPMENT
BENCHMARKING REPORT 2018 | 38

Figure 20.
Benchmark estimates from the logistic regression method with probability values varying from 0.3 to 0.8. Methods are applied to 21 datasets with more than 150 students and comprehension reliability > 0.5.
An alternate approach involves using a lower cut-off for the definition of proficient reading comprehension. Throughout this report, we have used a cut-off of 80% for reading comprehension in all analyses. Figure 21 compares estimates from logistic regression benchmarks produced using a 80% cut-off and a 60% cut-off, respectively. The estimate produced by the 60% cut-off for reading comprehension is significantly lower at 26.3 cwpm compared to the 48.8 cwpm for the 80% reading comprehension cut-off. As with analyses presented in Figure 20, the estimate produced by a 60% reading comprehension cut-off was sufficiently precise, but only when large and reliable samples were used. When smaller samples with less reliability were included in the analysis, the estimates for the 60% comprehension cut-off became unstable.
BENCHMARKING REPORT 2018 | 39
DETERMINING BENCHMARKS AT EARLY STAGES OF READING DEVELOPMENT

Figure 21.
Logistic regression method benchmark estimates of the fluency level required for half of the sample to read with 80% comprehension vs. 60% comprehension. Methods are applied to 21 datasets with more than 150 students and comprehension reliability > 0.5.
In conclusion, this section demonstrates two data-driven methods of setting lower fluency benchmarks that may be more suitable for beginner readers. The parameters of the p value in the logistic regression analysis and the reading comprehension cut-off can both be adjusted according to the achievement levels of the target population and the aims of the benchmarking exercise. This flexibility will be useful for policy makers wishing to set fluency benchmarks at different levels. It can also be helpful in the benchmarking exercise to produce more reliable estimates. As discussed in Section 4.1, benchmark estimates became unreliable when 60% or more of the sample were reading with 80% comprehension. In such cases, a more accurate benchmark could be set by adjusting the p value upwards, so that the benchmark estimated is more closely matched with the achievement level of the benchmarking sample.
BENCHMARKING REPORT 2018 | 40
DETERMINING BENCHMARKS AT EARLY STAGES OF READING DEVELOPMENT

6. Methods of Assessing Comprehension
6.1 Assessing Comprehension Using the Sentence Choice TestWe tested a method for setting benchmarks in which comprehension was assessed using a sentence choice reading test. The test involved students’ reading 20 sentences such as “A tiger lives in the forest” and indicating whether they thought the sentence was true or false. Each true sentence had a matching false sentence: “A tiger lives in a house.” The order of sentences in the tool was determined randomly so that pairs of sentences were typically not presented one after the other. Students were required to give the correct answer to both sentences in a pair in order to receive credit for a correct answer. Thus, scores ranged from 0–10 correct pairs of answers. Students qualified as having 80% comprehension if they gave correct answers for 8 out of the 10 pairs of sentences.
This method has one key advantage over the more common method of assessing comprehension through questions about the passage. When the sentence choice test is used, the methods of assessing comprehension and fluency are independent from each other, thus avoiding the possibility of artificially inflating the relationship between the two scores.
The method was applied in 2017 resulting in 20 datasets from Bangladesh, Nepal, Laos, and Cambodia. All students completed both types of comprehension assessments—passage comprehension and sentence choice—and thus we could compare estimated benchmarks and other statistics from the two methods.
Table 12.
Comparison of benchmarking statistics using passage comprehension questions and sentence choice test as methods for assessing comprehension.
Variable N Passage comprehension Sentence choice test
Mean SD Mean SD
Proportion with 80% comprehension 20 0.51 0.18 0.54 0.24
Measure reliability 20 0.47 0.15 0.80 0.09
R-squared 20 0.13 0.08 0.28 0.20
Benchmark estimate 20 38.7 21.9 35.1 18.3
METHODS OF ASSESSING COMPREHENSION
BENCHMARKING REPORT 2018 | 41

Variable N Passage comprehension Sentence choice test
Mean SD Mean SD
Benchmark precision 20 22.0 14.3 14.2 6.9
Sensitivity 20 68.0 26.0 74.9 28.6
Specificity 20 57.6 32.9 58.7 39.9
Correct classification 20 71.2 8.2 80.8 7.3
We calculated the correlation between the two comprehension measures for each dataset. Over the 20 datasets, the average correlation was 0.537, with a range of 0.083 to 0.751. All six datasets with correlations below 0.5 were from Laos, where the poor correlation likely resulted from ceiling effects. For the three datasets with the lowest correlation, the proportion of students with at least 80% comprehension was 0.85 or more on the sentence choice test and at 0.75 or more on the passage reading comprehension questions.
Table 12 shows that the two methods of assessing comprehension produced similar proportions of students with 80% comprehension and similar benchmark estimates. The sentence choice test had greater internal reliability and led to a better model fit (higher R-squared). As a result, benchmark estimates were more precise for the sentence choice test. The sentence choice test also resulted in slightly better specificity and correct classification rates.
The conclusion of these analyses is that the sentence choice test method might be preferable for assessing comprehension and setting fluency benchmarks.
6.2 Assessing Comprehension With and Without Time LimitsBenchmarking methods can vary according to the time limit given to students to read a passage. One method involves stopping the student after a fixed amount of time (typically 60 seconds) and then asking them only those comprehension questions that correspond to the portion of the passage read. We refer to this as the “time limit” method. Another method involves allowing students to read to the end of the passage if they don’t complete the passage in 60 seconds. We refer to this as the “no time limit” method. We also use the term “no time limit” when sufficient time is given such that all students would reasonably be expected to complete the passage. This method approximates an approach with no time limit.
One of the challenges in estimating benchmarks in the time limit method is that the number of comprehension questions asked is contingent on the student’s fluency rate. This creates an artificially strong relationship between fluency and comprehension. Understanding how to score the comprehension of a student who has not completed the passage can be challenging. For example, consider a student who reads around 40% of the passage such that they are asked 2 of the 5 comprehension questions and
METHODS OF ASSESSING COMPREHENSION
BENCHMARKING REPORT 2018 | 42

answer 1 of them correctly. By one consideration, the student’s comprehension level is 50% (1 question answered out of 2). This would be a valid assessment of their comprehension levels if we assume that the student would have continued to answer roughly 50% of the remaining comprehension questions correctly. However, we could assume with equal validity that a student with such a low fluency rate would struggle to answer any of the later (and often more difficult) comprehension questions correctly. We could assign them a comprehension score of 20% (1 out of 5 answered correctly). Which of these two methods is the most accurate reflection of student ability?
Data from Nepal help us to address this question empirically (Table 13). In these data, students were asked to read one passage. The assessor marked down the word the student was attempting when 60 seconds passed (time-limited score). The assessor then allowed the student to continue until the student completed the passages (no-time-limit score). For the time-limited score we calculated comprehension according to two different methods. In the first method, comprehension was calculated as a percentage of the total number of comprehension questions (in this case, 6). Thus, a student would be considered to have 80% comprehension if they correctly answered either 5 or 6 comprehension questions. The second method involved calculating reading comprehension as a percentage of the number of comprehension questions attempted. We set a minimum standard: students needed to attempt at least 3 questions to be considered having 80% comprehension. Thus, students could reach the 80% comprehension target by answering 3 questions out of 3 correctly, 4 questions out of 4 correctly, 4 or 5 questions out of 5, or 5 or 6 questions out of 6.
Table 13.
Comparison of benchmarks for timed vs. untimed administration of reading passages in Nepal.
Gr. N Admin Comp. measureProportion with 80%
comp. correct
Logistic regression
benchmark
Benchmark confidence
intervals
Median method
benchmark
2 2762 Time limit /total 0.019 52.8 18.5 49.0
2 2762 Time limit /attempted 0.092 29.3 4.3 33.0
2 2765 No time limit /total 0.109 31.3 5.8 29.7
3 2891 Time limit /total 0.082 53.0 7.0 54.0
3 2891 Time limit /attempted 0.241 28.9 3.1 37.0
3 2895 No time limit /total 0.259 32.1 5.5 35.6
Table 13 shows that the estimated logistic regression benchmark in grade 2 is quite similar for the no-time-limit method (31.3 cwpm) and the time-limit method when comprehension is calculated as a percentage of questions attempted (29.3 cwpm). The benchmark estimate is considerably higher
BENCHMARKING REPORT 2018 | 43
METHODS OF ASSESSING COMPREHENSION

for the time-limit method when comprehension is calculated as a percentage of total questions (53.0 cwpm). The confidence intervals for this latter method are much wider (18.5 cwpm) than for the other two methods (4.3 cwpm and 5.8 cwpm). The results of these comparisons for the logistic regression benchmark in grade 2 apply were also found in grade 3 and with the median method benchmark in both grades.
The conclusion from these analyses is that the no-time-limit method is the most effective way of measuring fluency for benchmarking exercises. When a 1-minute limit is used, a more accurate benchmark is produced when reading comprehension is calculated out of questions attempted.
Given this conclusion, it is worth revisiting the benchmarking estimates produced in earlier analyses. In previous analyses, we had calculated comprehension as a percentage of total questions associated with the passage, contrary to the recommendations from the analysis in Table 13. Overall, 8 of the 35 datasets (with different grades combined) used a 1 minute time limit. Seven of the 21 higher quality datasets (with a sample size of more than 150 and a comprehension question reliability >0.5) used a time limit of 1 minute. Table 14 shows the benchmarks set using a 1-minute and 3-minute time limit for these 21 datasets. The benchmarks set with a 1-minute time limit are, on average, 10 cwpm lower for the logistic regression method, 8 cwpm lower for the mean method, and less than 5 cwpm lower for the median method. These findings are consistent with the analysis presented in Table 13.
Table 14.
Comparison of benchmarks (cwpm) set using 1-minute vs. 3-minute time limit, by different methods.
Time Limit N Logistic regression Mean Median
1 minute 7 55.8 65.6 60.8
3 minutes 14 45.3 57.6 56.2
7. Conclusions
7.1 Comparison of Benchmarking MethodsWe compared four methods of producing fluency benchmarks. Table 15 compares the strengths and weaknesses of these four approaches. The mean and median methods are simpler to use than the regression methods. The median method is less affected than the median method by extreme values of reading fluency. The regression methods are relatively robust to the effect of outliers, assuming there is a good model fit and data are otherwise of good quality.
BENCHMARKING REPORT 2018 | 44
CONCLUSIONS

A key characteristic of both regression methods is that they model the relationship between fluency and comprehension. If there is not a strong relationship between these two variables, the fluency benchmark estimates will be less reliable. By contrast, the mean and median methods will produce benchmark estimates with a deceptive level of precision when the relationship between fluency and comprehension is not strong.
Similarly, the logistic regression method failed to produce precise estimates if the data were not of high quality. Sample sizes of less than 150 were more likely to result in imprecise estimates for the logistic regression than for the mean and median methods. High student ability was more likely to lead to unrealistically low benchmark estimates and imprecise benchmark estimates (i.e., with large confidence intervals) for the logistic regression method. The logistic regression method produced benchmarks that were also more influenced by using different reading passages, compared to the mean and median methods. This influence was more pronounced for small sample sizes.
In general, the logistic regression method relies on a strong relationship between fluency and comprehension and on good quality data. The mean and median methods produce benchmark values even when the data are not reliable. This is a weakness of these latter methods, rather than a strength. In situations where the mean/median methods are used, it is important to check the relationship between fluency and comprehension and the quality of the data set—sample size, reliability, appropriate achievement levels—independently.
A final advantage of the regression methods is that parameters in the model can be tweaked to adjust the benchmark level as required, as discussed in Section 5.2.
Table 15.
Comparing strengths and weaknesses of four approaches to fluency benchmarking.
Mean Median Logistic regression
Linear regression
Ease of use Simple Simple Advanced Advanced
Robust to outliers No Yes Yes Yes
Models fluency-comprehension relationship
No No Yes Yes
Produces benchmark values even with unreliable data
Yes Yes No No
Adjustable benchmarking level No No Yes Yes
In summary, the regression methods have a number of advantages over the mean and median methods for use in benchmarking exercises. We found that the logistic regression method was easier to interpret and adjust. It also had a better fit to the data. We recommend this method of fluency
CONCLUSIONS
BENCHMARKING REPORT 2018 | 45

benchmark setting for those with sufficiently advanced knowledge of statistics. The mean and median methods have the advantage of being simple to use. The median method is slightly preferable because it is robust to outliers. If these methods are used, additional care should be taken to ensure that there is a good relationship between fluency and comprehension in the dataset. It is also important to be check that the data meet minimum standards of sample size and comprehension measure reliability, and have appropriate achievement levels (e.g., that match the level of benchmark being set).
The above conclusion refers to the practical application of setting benchmarks. In addition, benchmarking may be carried out for research purposes, as illustrated by the main sections of this report. When used in research, regression methods have the advantage of producing meaningful estimates of the precision of benchmarks. This allowed us to address a number of the research questions concerning the linguistic factors and sample characteristics that affect benchmark levels and precision, discussed below.
7.2 Determining Benchmarks at Early Stages of Reading DevelopmentThe logistic regression method is more flexible than the mean and median methods because the parameters in the model can be adjusted. This gives policy makers the option to set empirically based benchmarks at different levels of student ability; for example, lower benchmarks can be set for beginner readers.
We found that using 60% comprehension as a standard of reading proficiency results in reliable benchmarks at lower levels of reading fluency. Benchmarks set using this lower level of reading comprehension are possibly more vulnerable to small sample sizes and unreliable data.
The use of a 90% accuracy benchmark was not more sensitive at early stages of reading than a fluency benchmark. In general, fluency benchmarks and accuracy benchmarks were quite similar in their ability to predict comprehension.
The above recommendations (benchmarking fluency against either 60% or 80% comprehension) apply when a significant proportion of students read with comprehension. If the vast majority (e.g., more than 90%) of students cannot comprehend text, then benchmarking activities should consider replacing fluency with lower order skills such as letter recognition, decoding, or accuracy at less than 90%.
7.3 Benchmarking at Different Grade LevelsOur results showed, counterintuitively, that samples from higher grades led to lower levels of benchmarks. The implication is that the level of fluency required for comprehension does not increase with age. It is a common practice for education systems to set higher fluency benchmarks at higher grades. Our analyses do not argue against this practice but they do draw attention to the goals of benchmarking in such cases. If the goal of benchmarking is to identify a level of fluency at which comprehension is 80% or greater, we would recommend using the same benchmark in higher grades, and increase the target for the number of students reaching this benchmark at each grade level (see discussion in Section 1.1). This recommendation applies to all grades for which a significant proportion of students achieve 80% comprehension (see Section 7.2 above).
CONCLUSIONS
BENCHMARKING REPORT 2018 | 46

An alternative approach is to set higher fluency benchmarks in higher grades based on normative sampling of ORF. In this approach, benchmarks represent the fluency levels typical of competent students in that grade, rather than the fluency levels required for comprehension. It is also possible to set benchmarks that represent a combination of the two skills of fluency and comprehension. For example, in Ethiopia, data were used to establish grade-specific cutoff points for three classifications of reading ability above zero (RTI International, in press):
• Reading fluently with full comprehension
• Reading with increasing fluency and comprehension
• Reading slowly and with limited comprehension
A clear conclusion from this analysis is that one should be clear about the goal of benchmarking exercises before they begin.
7.4 Alternate Methods of Assessing ComprehensionThe sentence choice test had a greater internal reliability and led to a better model fit for the logistic regression method, compared to the passage comprehension questions. As a result, benchmark estimates were more precise for the sentence choice test. We recommend continuing to use the sentence choice test as a measure of comprehension and gathering additional data on its reliability. The test can be piloted and developed independently of the passages, ensuring good reliability before benchmarking exercises begin. Ideally, a bank of questions should be piloted and 10 pairs of sentences should be picked at random to avoid students’ becoming familiar with one form of the test.
7.5 Benchmarking Across LanguagesOur analyses show that fluency and comprehension were consistently related, despite our data coming only from languages with a shallow orthography. The implication is that comprehension-based fluency benchmarks can be estimated reliably in transparent languages.
Benchmark levels differed significantly between languages. These data support the current widespread practice of setting separate benchmarks across languages. The logistic regression method suggests one approach to setting comparable benchmarks across languages. This could be applicable to metrics applied across countries, such as the Sustainable Development Goal 4.1.1 indicator of the proportion of students with a minimum proficiency in reading.
BENCHMARKING REPORT 2018 | 47
CONCLUSIONS

7.6 Requirements for Producing Reliable Benchmark EstimatesGuidance for reliable benchmark estimates (particularly for the logistic regression method) that emerged from these analyses include the following.
• If a sufficient sample of EGRA data have already been collected for the target population, analyses of these data can provide useful benchmark estimates. This could be a cost-effective and statisti-cally sound way of obtaining benchmark estimates, assuming the conditions for producing reliable benchmarks (discussed in this paper) are met.
• The larger the sample size, the more precise your estimates will be. Sample sizes of 150 or greater produced more precise benchmark estimates in this study. Sample size requirements change with sample characteristics, so it is difficult to provide a blanket recommendation. However, we recommend conservatively increasing the sample size from the 150 minimum suggested by these data. RTI International has internal guidelines to use a minimum of 400 students for benchmarking.
• In addition to the total number of students in the sample, it is important to have enough students at the right levels of comprehension and reading fluency in order to match the goals of the bench-marking exercise. For the goal of the exercise in this paper—estimating fluency levels at which there is a 0.5 probability of reading with 80% comprehension—we found that a sample with more than 60% of students reading with 80% comprehension led to unstable or imprecise estimates. Although we didn’t find floor effects in the current study, these are likely to be problematic for setting benchmarks too. We recommend a combination of a) selecting a sample that is represen-tative of the target population; and b) increasing the probability value so that it matches – or is slightly higher than - the proportion of the sample reading with comprehension. For example, if 60% of the sample read with comprehension, a p value of 0.7 may be appropriate.
• Benchmark estimates are more reliable when comprehension questions have internal reliability greater than 0.7. The reliability of comprehension questions should be assessed in pilot work before the benchmarking exercise begins. Piloting should be used to improve or replace compre-hension questions with low reliability.
• Given the variability in benchmarks by reading passage, it would be advisable to use at least two reliable reading passages to set benchmarks. If the two passages produce similar benchmarks, this will add confidence to the estimates. If there is a large difference between the two estimates, further investigation can be carried out to understand the source of the variation.
BENCHMARKING REPORT 2018 | 48
CONCLUSIONS

References*
Abadzi, H. (2011). Reading fluency measurements in EFA FTI partner countries: Outcomes and improvement prospects. Global Partnership for Education (GPE) Working Paper Series on Learning, No. 1. Retrieved from http://documents.worldbank.org/curated/en/925221468179361979/Reading-fluency-measurements-in-EFA-FTI-partner-countries-outcomes-and-improvement-prospects
Bartlett, L., Dowd, A. J., & Jonason, C. (2015). Problematizing early grade reading: Should the post-2015 agenda treasure what is measured? International Journal of Educational Development, 40, 308–314. doi: 10.1016/j.ijedudev.2014.10.002
*Chang, L.Y. (2015). Visual orthographic variation and learning to read across writing system (Unpublished doctoral dissertation). University of Pittsburgh, Pittsburgh, PA.
*Chang, L.Y., Plaut, D.C., & Perfetti, C.A. (2016). Visual complexity in orthographic learning: Modeling learning across writing system variations. Scientific Studies of Reading, 20(1), 64–85.
*Chang, L. Y., Chen, Y. C., & Perfetti, C. A. (2017). GraphCom: A multidimensional measure of graphic complexity applied to 131 written languages. Behavior Research Methods, 1–23.
Ellis, N. C., Natsume, M., Stavropoulou, K., Hoxhallari, L., Daal, V. H., Polyzoe, N., Tsipa, M-L., & Petalas, M. (2004). The effects of orthographic depth on learning to read alphabetic, syllabic, and logographic scripts. Reading Research Quarterly, 39(4), 438–468.
*Ilao, J. P., Santos, T.I.D., & Guevara, R.C.L. (2012, February). Comparative analysis of actual language usage and selected grammar and orthographical rules for Filipino, Cebuano-Visayan and Ilokano: A corpus-based approach. A report for the Electrical and Electronics Engineering Institute, University of the Philippines Diliman, Philippines.
*Janson, T. (2001). Consonants in Changana/Tsonga. South African Journal of African Languages, 21(1), 16–32.
Katz, L., & Frost, R. (1992). The reading process is different for different orthographies: The orthographic depth hypothesis. In Frost, R., & Katz., L. (Eds.) Orthography, Phonology, Morphology, and Meaning (pp. 67–84). Amsterdam: Elsevier North Holland Press.
Landerl, K., Wimmer, H., & Frith, U. (1997). The impact of orthographic consistency on dyslexia: A German-English comparison. Cognition, 63(3), 315–334.
*Lew, S. (2013). A linguistic analysis of the Lao writing system and its suitability for minority language orthographies. Writing Systems Research, 6(1), 25-40. doi: 10.1080/17586801.2013.846843
*Linguasphere Register. (2017). Retrieved from http://www.linguasphere.info
REFERENCES
BENCHMARKING REPORT 2018 | 49

*Makalela, L., & Fakude, P. (2014). ‘Barking’ at texts in Sepedi oral reading fluency: Implications for edumetric interventions in African languages. South African Journal of African Languages, 34(sup1), 71–78. doi: 10.1080/02572117.2014.896538
*Nag, S. (2007). Early reading in Kannada: The pace of acquisition of orthographic knowledge and phonemic awareness. Journal of Research in Reading, 30(1): 7–22. Doi: 10.1111/j.1467-9817.2006.00329
*Nkuna, P. H. (2013). Orthographic considerations regarding the Class 4 noun prefix and some verb stems in Xitsonga. South African Journal of African Languages, 33(1), 75–78.
*Project Gutenberg Self-Publishing Press. (2017). Tsonga language. Retrieved from http://self.gutenberg.org/articles/eng/Tsonga_language
*Rao, C., Vaid, J., Srinivasan, N., & Chen, H. C. (2011). Orthographic characteristics speed Hindi word naming but slow Urdu naming: evidence from Hindi/Urdu biliterates. Reading and Writing, 24(6), 679–695. doi: 10.1007/s11145-010-9256-9
RTI International, (in press). EGRA benchmarks and standards research report. A report for All Children Reading – Asia (ACR – Asia). Washington, DC: United States Agency for International Development.
RTI International. (2015). Early Grade Reading Assessment (EGRA) toolkit, Second Edition. Washington, DC: United States Agency for International Development.
Seymour, P. H., Aro, M., & Erskine, J. M. (2003). Foundation literacy acquisition in European orthographies. British Journal of psychology, 94(2), 143–174.doi: 10.1348/000712603321661859
Shun, H., Chen, X., Anderson, R.C., Wu, N., & Xuan, Y. (2003). Properties of school Chinese: Implications for learning to read. Child Development 74(1), 27–47. doi: 10.1111/1467-8624.00519
*SIL International. (2017). Ethnologue: Languages of the World. Retrieved from https://www.ethnologue.com/.
Sweet, A. P., & Snow, C. E. (2003). Rethinking reading comprehension. New York: Guilford Press.
*Talavera, J., Matsushita, M., & Pelagio, E. (no date). The sound systems of Inivadoy and Ilokano: An acoustic phonetics approach. A paper presented at Division Seminar, Workshop on Working Orthography, Finalization of the Four Major Mother Tongues in Benguet, Benguet, Philippines. Retrieved from https://www.researchgate.net/publication/304347732_The_Sound_Systems_of_Inivadoy_and_Ilokano_An_Acoustic_Phonetics_Approach
Van Rooy, B., & Pretorius, E.J. (2013). Is reading in an agglutinating language different from an analytic language? Southern African Linguistics and Applied Language Studies, 31(3), 281–297.
*WALS: The World Atlas of Language Structures. (2017). Retrieved from http://wals.info/.
*Wilsenach, C. (2013). Phonological skills as predictor of reading success: An investigation of emergent bilingual Northern Sotho/English learners. Per Linguam: A Journal of Language Learning, 29(2), 17–32.
BENCHMARKING REPORT 2018 | 50
REFERENCES

*Winskel, H., & Padakannaya, P. (Eds.). (2014). South and Southeast Asian Psycholinguistics. Cambridge: Cambridge University Press.
Wydell, T.N., & Butterworth, B. (1999). A case study of an English-Japanese bilingual with monolingual dyslexia. Cognition, 70, 273-305. doi: 10.1016/S0010-0277(99)00016-5
Ziegler, J. C., Bertrand, D., Tóth, D., Csépe, V., Reis, A., Faísca, L., Saine, N., Lyytinen, H., Vaessen, A., & Blomert, L. (2010). Orthographic depth and its impact on universal predictors of reading: A cross-language investigation. Psychological science, 21(4), 551–559. doi: 10.1177/0956797610363406
*Works cited with an asterisk were used to compile data in Table 7.
BENCHMARKING REPORT 2018 | 51
REFERENCES

Appendix A. Summary of Analyses Conducted
Method Output
M1 – Logistic regression – 80% Comprehension vs. cwpm
(Note: estimates will be available for multiple passages on some samples)
Plot of fluency vs. comprehension (with counts for fluency)
Estimated benchmark
Eye ball – Confidence interval (CI)
Pseudo R2
Output from estat command: Sensitivity, Specificity, Correctly Classified overall
M4 – Mean / Median of readers RC > 80% Mean ORF
Confidence intervals
Median ORF
Sign rank test for CI
M5 – Mean/Median of competent grade 8 readers
Mean ORF
Confidence intervals
Median ORF
Confidence interval on median
M6 – Logistic regression of 80% comprehension vs. accuracy (% words correct)
Plot of Accuracy vs. comprehension (with counts for fluency)
Estimated benchmark
Confidence interval
Pseudo R2
Eye-ball range between two inflection points from fitted graph
Output from estat command: Sensitivity, Specificity, Correctly Classified overall
BENCHMARKING REPORT 2018 | 52
APPENDIX A. SUMMARY OF ANALYSES CONDUCTED

Method Output
M7 – Logistic regression of > RC 75% of Ques-tions Attempted for timed tests vs. cwpm
Benchmarks:
3/3 correct
4/4 correct
4,5/5 correct
5,6/6 correct
Only where data available – probably only Nepal? The aim is to compare benchmarks with untimed data
Plot of Fluency vs. Comprehension (with counts for fluency)
Estimated benchmark
Confidence interval
Pseudo R2
Eye-ball range between two inflection points from fitted graph
Output from estat command: Sensitivity, Specificity, Correctly Classified overall
Methods Using Alternate Comprehension Measures (where available)
M10 – Logistic regression -80% Comprehension on sentence choice test vs. cwpmComprehension measured of sentence choice test
Plot of fluency vs. comprehension (with counts for fluency)
Estimated benchmark
Confidence interval
Pseudo R2
Eye-ball range between two inflection points from fitted graph
Output from estat command: Sensitivity, Specificity, Correctly Classified overall
Methods Using Accuracy Measures
M8 – Logistic regression – 60% reading comprehension
Plot of fluency vs. comprehension (with counts for fluency)
Estimated benchmark
Eye ball - Confidence interval
Pseudo R2
Eye-ball range between two inflection points from fitted graph
Output from estat command: Sensitivity, Specificity, Correctly Classified overall
BENCHMARKING REPORT 2018 | 53
APPENDIX A. SUMMARY OF ANALYSES CONDUCTED

Method Output
M9 – Logistic Regression – with 80% com-prehension as outcome, including following predictors:cwpm, accuracy_binary (above or below 80%), cwpm x accuracy_binary
Plot of fluency vs. comprehension (with counts for fluency) with different curves for high accuracy and overall
Estimated benchmark for high/low accuracy?
Confidence interval
Pseudo R2
Output from estat command: Sensitivity, Specificity, Correctly Classified overall for the 3 models
Tables of High/Low Fluency (above or below 30 wpm) and High/Low Accuracy (above or below 80%)
N
Mean RC
N of RC > 80%
N of RC > 60%
Additional Background Information
Language Language name
Orthography (deep, shallow, other)
Alphabetic vs. other
Grapheme inventory
Agglutinating versus others
Passage difficulty Number of words
Average word length
Readability formula
BENCHMARKING REPORT 2018 | 54
APPENDIX A. SUMMARY OF ANALYSES CONDUCTED

BENCHMARKING REPORT 2017 | 55
BACKGROUND
World Change Starts with Educated Children.®
www.roomtoread.org


![Benchmarks - May, 2011 | Benchmarks Onlineit.unt.edu/sites/default/files/benchmarks-05-2011.pdf · Benchmarks - May, 2011 | Benchmarks Online 4/28/16, 9:13:42 AM] By Patrick McLoud,](https://img.pdfslide.net/doc/110x75/5fe545814aa19825752e7bae/benchmarks-may-2011-benchmarks-benchmarks-may-2011-benchmarks-online-42816.jpg)