Embed Size (px)
Citation preview

Data Driving Women’s Financial Inclusion: Rwanda’s Experience
CASE STUDY
SummarySex-disaggregated financial services data from surveys and financial providers can help countries to ensure women’s financial inclusion. This case study explores the experience of Rwanda, where the government’s focus on efficiency and data has led to the collection and use of financial inclusion gender data. This data has been generated from a range of stake-holders and used to better understand the state of women’s financial inclusion in the country.
Rwanda’s efforts in women’s financial inclusion data began through the collection of demand-side data (survey data collected from clients), which showed steady improvements in financial inclusion. Formal financial access, including both bank and non-bank financial institutions, has substantially increased for women in Rwanda, from 36 percent to 63 percent in just four years (from 2012-2016), and the gender gap in access to savings is small. However, 2016 demand-side data also shows that only 24 percent of women are using commercial banks and that there is a 13 percentage point gender gap in mobile money account ownership.
These findings from demand-side data prompted increased interest in complementary supply-side data. The National Bank of Rwanda (BNR, the central bank) initiated new efforts to collect and standardize sex-disaggregated supply-side admin-istrative data from banks and other financial service providers (FSPs). This data showed that between 2008-2013, while there was increased bank account ownership by women, it was not sufficient to close the gender gap. In 2013, new bank accounts opened by women accounted for 30.5% of all new ac-counts opened in that year. However, women and men did reach near gender parity in savings account ownership and a targeted government policy was successful in narrowing the gender gap in microf-inance account ownership. Supply-side data from 2008-2013 also demonstrates that women repaid loans more consistently than men, even as they accounted for a lower number and value of bank loans overall. With additional improvements on sex-disaggregated supply-side data, this data can be used to demonstrate the business case for serving women clients and creating tailored financial products and services that meet their needs.
In Rwanda, a strong policy and legal framework of gender mainstreaming within all government agencies, a culture of data-driven, evidence-based policymaking and monitoring, and strong cross-government collaboration drives the significant collection and use of women’s financial inclusion data.
The Women’s Financial Inclusion Data (WFID) PartnershipThe Women’s Financial Inclusion Data (WFID) partnership includes the Alliance for Financial Inclusion (AFI), Data2X, the Financial Alliance for Women (FAFW, formerly the Global Banking Alliance for Women), the Inter-American Development Bank (IDB), IDB Invest, the International Finance Corporation (IFC), the Inter-national Monetary Fund (IMF), and the World Bank Group (WBG). The WFID partnership is the leading platform for women’s financial inclusion data and works to increase awareness of the importance of sex-disaggregat-ed financial services data, as well as coordinate efforts and interventions to maximize its collection and use. Current efforts include global advoca-cy and awareness-raising; showcasing best practices and country experiences through knowledge products and case studies; and working to harmonize definitions and indicators.

2
Data Driving Women’s Financial Inclusion: Rwanda’s ExperienceCASE STUDY
BackgroundThere are two key features of the Rwandan govern-ment that create an enabling environment for data collection and use related to women’s financial in-clusion: a commitment to expanding financial inclu-sion and overall support for data collection and use.
Commitment to expanding financial inclusion, in-cluding women’s financial inclusion
Rwanda has ambitious economic growth and inequal-ity reduction goals. Vision 2020, Rwanda’s national development framework, sets out a plan for Rwan-da to become a middle-income country by 2020 on
a foundation of equality and non-discrimination for all.1 In-deed the country has made great strides in recent years, growing its GDP from $1.7bn in 2000 to $9.1bn in 2017.2 Vision 2020 includes gender equality as a cross-cutting theme and the Government of Rwanda (GoR) has taken steps to drive women’s finan-cial inclusion as part of their larger economic efforts.
In addition to Vision 2020, the GoR has numerous policies and programs dedicated to enabling wom-en’s financial inclusion, including a dedicated Strat-egy on Women and Youth Access to Finance since 2012, which was recently updated through 2020.3 Each of these initiatives also include commitments to collect data to track policy impact.
Overall support for data col-lection and use on women’s financial inclusion
These policy frameworks are further bolstered by an overall culture of data-driven deci-sion-making within the govern-ment. The GoR supports sta-tistical data collection across multiple sectors and ensures that the National Institute of Statistics Rwanda (NISR) is well-resourced and remains an independent entity. The NISR works closely across the entire GoR, and with external stake-holders. As a result, Rwanda has high quality national data; the World Bank gave Rwanda a statistical capacity indicator of 78. 9 in 2018.4
“The country has a clear vision with where they want to go and un-derstanding that data is critical for them to move forward…Data is power.”
– Fatou Lo Deputy Representative
UN Women Rwanda
“Whatever we do, it must be supported by evi-dence…You might plan badly because you have incorrect information; when you have correct information, it allows you to do a good analy-sis and respond to the root causes of the issues, instead of reacting to consequences…We have understood the impor-tance of data: you can’t convince people without the right information.”
– Rose Rwabuhihi, Chief, Gender Monitoring Office
(GMO)
Table 1: Enabling Policies and Programs for Women’s Financial Inclusion5
POLICIES AND PROGRAMS FOCUS
GoR’s Seven-Year Program Commitment to ensure that at least 50% of all UMURENGE SACCO, microfinance, and bank loans go to women.
2010-present
Financial Sector Strategic Plan Emphasizes financial inclusion for the underserved, especially women.
2013-2018
National Microfinance Policy Implementation Strategy
Access to financial services particularly for women and youth. The evaluation of this policy considered it successful.
2013-2017
National SME Development Policy Gender is a principal cross-cutting area of the SME policy. 2010
Women and Youth Access to Finance Strategy
Supports the creation of cooperatives and increasing the number of women accessing loans.
2012-2020
The Women’s Guarantee Fund (WGF)
Facilitates women entrepreneurs and women-owned SMEs to obtain commercial bank and microfinance loans without traditional collateral. The WGF provides up to 75% of a credit guarantee and a grant of 15% of the total loan disbursed, and is managed by the Business Development Fund.
2009-present
1 Republic of Rwanda, Ministry of Finance and Economic Planning, 2000. “Rwanda Vision 2020.”2 The World Bank, Data on GDP (current US$) for Rwanda from 1960-2017.3 Republic of Rwanda, Ministry of Gender and Family Promotion, 2016. “Final Report of the Strategy on Women and Youth Access to Finance.”4 World Bank, Statistical Capacity Indicator Dashboard, 2018.5 Republic of Rwanda, Gender Monitoring Office, 2017. “Gender and Access to Finance.”

3
Data Driving Women’s Financial Inclusion: Rwanda’s ExperienceCASE STUDY
Rwanda’s 2003 Constitution also set up the Gender Monitoring Office (GMO), an accountability body mandated to uphold Rwanda’s commitments to and implementation of gender equality at all levels. As part of its monitoring role, the GMO serves as a hub for information and data on gender equality, operat-ing from a clear sense that Rwanda cannot “deliver” on gender equality without data.
BNR, the central bank, focuses on and monitors fi-nancial inclusion as part of its legal mandate and collects sex-disaggregated supply-side financial in-clusion data. In addition to its external commitments to women’s financial inclusion, BNR is also commit-ted to gender mainstreaming within its staff and has achieved gender parity in its board and management composition as of May 2019 (see Box 1). BNR also developed a national strategy on financial inclusion and set provisional targets along with the Ministry of Finance and Economic Planning (MINECOFIN). The national strategy on financial inclusion contains spe-cific gender targets.
Rwanda’s focus on data- driven decision-making has led to an increase in demand-side gender dataThe combination of financial inclusion policy priorities and a data-driven policy culture has led to a strong enabling environment for collection and use of high-quality demand-side financial inclusion gender data.
One major source of financial inclusion data is FinScope, a national survey implemented by Access to Finance Rwanda (AFR—see Box 2), which covers a nationally representative sample of adults aged 16+. Vision2020 includes a national commitment to financial inclusion and its monitoring is based on FinScope data - the final Vision2020 target is for 90% of the population to have access to financial services, defined as both formal and informal finan-cial services, by 2020 (FinScope reported 86% in 2017, and in 2019, BNR notes access is at 89%).
There are also a wide range of additional stakehold-ers who support the collection of demand-side data on women’s access to and use of financial services. In the government, GMO, BNR, NISR, and the min-istries of gender and finance all contribute to ef-forts related to financial inclusion. UN Women also supports key efforts to collect data and has second-ed a statistician as the gender focal point within NISR to help gender mainstream all statistical activity, including on financial inclusion.
BNR has undertaken a Gender Equality Seal (GES) program initiative with the GMO and UNDP to promote internal gender mainstream-ing. This program aims to:
• Enhance the collective capacity of BNR to examine its activities from a gender perspective and identify strengths and weaknesses in promoting gender equality;
• Sharpen organizational learning on gender through team-building, information-sharing and reflection;
• Examine gender-sensitivity of human re-source policies and gender balance of staff at different levels;
• Assess the level of resources for gender mainstreaming and activities;
• Assess the extent of gender mainstream-ing in terms of development and delivery of gender- sensitive services and products;
• Generate understanding of the extent to which gender mainstreaming has been internalized and acted upon by staff.
Box 1 BNR’s Gender Equality Seal
Access to Finance Rwanda (AFR) was estab-lished in 2010, following the 2008 FinScope, as a private company with multilateral and pri-vate sector donors, working with partners to support national strategies and interventions on financial inclusion. AFR’s projects span the development of SACCOs and savings groups, risk mitigation, small-holder farmers, digital financial services, and market development. Many of AFR’s projects are implemented by the GoR, private sector, cooperatives, or NGOs, and all must have a gender component with a deliberate approach to target women. AFR’s ambition is to target 1 million people for AFR interventions in 5 years; at least 30% must be women.
Box 2 Access to Finance Rwanda

Data Driving Women’s Financial Inclusion: Rwanda’s ExperienceCASE STUDY
4
As an illustration of the cross-governmental collab-oration, for example: GMO works with NISR to pro-pose sex-disaggregated indicators and the NISR regularly consults with GMO and the Ministry of Gender Equality and Family Promotion (MIGEPROF) on its gender data collection. In 2017, GMO’s statis-tician met with local government officials, with the support of NISR, to mainstream gender-related in-dicators that all districts will track and report on—which include financial inclusion indicators. BNR’s Deputy Governor also chairs the NISR Board, which ensures coordination between the central bank and NISR on financial services data. BNR also shares its data regularly with GMO for use in their gender mon-itoring and advocacy. In addition, MINECOFIN and the Ministry of Local Affairs support the FinScope’s survey outreach at the district level.
Demand side data has been used to drive govern-ment-led women’s financial inclusion effortsFinScope demand-side data findings have been critical to driving financial inclusion policy within GoR. After the publication of the 2008 survey find-ings, which showed that only 21% of Rwandans were accessing formal financial services,6 the GoR developed a policy on savings and credit coop-eratives to reach sectors with low levels of formal financial institutions. These cooperatives, called UMURENGE-SACCOs, commonly known as SAC-COs, reach rural areas, making it more convenient for women to access financial services. In 2012, financial inclusion doubled to 42%, an increase that was attributed to the SACCOs policy.7 SACCOs’ operational costs were first covered by the GoR, but became self-sustaining by 2014.
Table 2: Overview of financial products/services uptake by gender
Female %
Male %
Gender gap in percentage points
Total %
Financially included
86 90 4 88
Formally served 63 74 11 68
Banked 24 29 5 26
Other formal (non-bank)
60 71 18 64
Informally served 71 71 0.1 71
Excluded 14 10 -3.8 12
Source: FinScope Rwanda 2016. Note that percentages overlap, as individuals can be counted in multiple categories. Percentages are rounded.
The 2016 FinScope included a thematic deep dive on gender to provide more granular figures on wom-en’s financial inclusion, as requested by the GoR and UN Women. This analysis found that 86% of women have access to formal or informal financial products and services, as compared to 90% of men (see Table 2). Of the 86% of women who have access to finan-cial products and services, 63% are formally served (24% commercially banked and 60% with products or services from non-commercial financial institu-tions such as SACCOs and mobile money) while 71% are informally served (mainly driven by the growth of informal savings groups). This falls short of the tar-get of 80% formal financial inclusion for women. By comparison, 74% of men were found to have access to formal financial products and services; 28.5% of men use commercial banks, while 71% are served by formal non-bank institutions. The 2016 FinScope also revealed that a higher proportion of women (24%) than men (17%) relied exclusively on informal mechanisms for banking. There is also a significant gender gap in mobile money account ownership (46% of men versus 33% of women).
6 FinMark Trust, 2008. “FinScope Rwanda 2008: Technical Report.”7 Access to Finance Rwanda, 2012. “FinScope: Financial Inclusion in Rwanda 2008-2012.”
*using almost exclusively formal mechanisms such as mobile money
Commercial bank accounts
Savings rates in the last 12 months
Commercial bank loans Insurance Mobile moneyRemittances*
39%
33%
3%8%
84%87%
48% 46%
5% 10%
24%29%
Women Men
BOX 3 Summary of 2016 FinScope Findings by Gender

5
Data Driving Women’s Financial Inclusion: Rwanda’s ExperienceCASE STUDY
The 2016 FinScope observed only a slight difference in savings rates with 16% of women not saving at all, as compared to 13% of men, and while women and men saved for similar reasons (to cover living expenses during times of hardship), women were more likely to save using informal savings groups. Additionally, women were more likely to borrow from informal groups or friends and family, rather than through a commercial bank.
The 2016 FinScope showed that women’s access to formal finance had increased significantly between 2012 (36%) and 2016 (63%).8 Specifically, credit provision grew from 2012 to 2016 in informal and other formal (non-bank) sectors— 62% of adults said they borrowed from these sectors in 2016.9 The survey also found that the most significant deter-minant of formal financial inclusion in Rwanda is in-come—Rwandans who do not have sources of regu-lar income or who have low levels of income are less likely to be financially included. Gender, age, geo-graphic location, and educational level are additional determinants.10
The 2016 FinScope study on gender also clearly illustrates the opportunity and demographic pro-file of women who should be targeted in financial inclusion efforts: “women residing in rural areas, who are young (below 30 years of age) and older women (above the age of 50 years), with no or low levels of formal education, and those who generate an income from piece work or agricultural activities (including those receiving a salary from a farmer.”11
Insights from demand-side data led to increased inter-est in supply side dataOnce the 2016 FinScope data, including the themat-ic note on gender, was finalized, AFR planned a two day workshop with insight2impact (i2i, a global re-source center seeking to improve financial inclusion through data use) and FinMark Trust (a non-profit trust promoting financial inclusion) for financial ser-vice providers (FSPs). As a result of the workshop, many FSPs realized that they might not be serving their women clients as well as they had assumed. An AFR representative recalled of the event: “They asked, can we learn more? What should we do and how can we address [women clients]? The appetite was there to serve an unserved women’s market.” The FinScope data showed that there was a clear market of women in need of financial products and helped FSPs to develop a business for targeting these unserved women. AFR sent out an expression of interest to understand which banks were inter-ested in developing a financial product for women. Three FSPs responded to this expression of inter-est— two MFI banks, Umwalimu Sacco and Coopedu, and the Bank of Kigali, which is a commercial bank. From this, the Bank of Kigali introduced a product called Zamuka Mugore (uplifting women), which is a lending and savings scheme that allows women in small-scale businesses to access loans of up to 5 million Rwandan francs without collateral. AFR is continuing to work with these FSPs to design more targeted products.
“We felt that we rely on demand-side data, which is survey-based and every 4 years but what happens in between?...When we started, we had some fears that [the banks] would not like this because of transparency asks, but they have really surprised us with the level of compliance and coordination. One MD really challenged us to do this quick so that they can have industry data so that they can position themselves in their market strategy. Apart from complying, are they using the data? And enjoying the analytics?... If we don’t make use of the data that is here, we have wasted resources.”
– Dr. Monique Nsanzabaganwa, Deputy Governor, National Bank of Rwanda
8 Access to Finance Rwanda, 2016. “FinScope Insights: Women and Financial Inclusion in Rwanda: Promoting greater financial inclusion of women in Rwanda.”
9 Access to Finance Rwanda, 2016. “FinScope Rwanda 2016.”10 Access to Finance Rwanda, 2016. “FinScope Insights: Women and Financial Inclusion in Rwanda: Promoting greater financial inclusion of women in Rwanda.”11 Ibid.
2008-2013 BNR asked banks to report on the distribution of their loan portfolios and other variables. This data was used for the preparation of their annual statement to the government and in BNR’s decision-making.
2012 BNR increased its supply-side data requirements from financial institutions
2015 BNR partnered with the World Bank and MIX on a financial inclusion data initiative that helped with the assessment of data gaps, and set out key indicators to track and monitor financial inclusion. These included key indicators on gender, such as
products by sex; business sectors by sex; contracts by sex.
2008 2010 20132009 2011 20142012 2015
5

6
Data Driving Women’s Financial Inclusion: Rwanda’s ExperienceCASE STUDY
The collection and analysis of national demand-side data through FinScope spurred interest within BNR to measure financial inclusion more regularly. The GoR has now started to improve its sex-disaggregat-ed supply-side data collection and analysis to fur-ther explore how women (and men) who have finan-cial products and services could be better served.
Supply-side data (administrative data from banks and other FSPs) allows for regular and granular anal-ysis of the trends in account usage, borrowing and saving. Supply-side data can also more readily in-form decision-making within FSPs and drive the de-sign of products and services to serve women.
Starting in 2008 BNR experienced a high demand for financial inclusion data from within the GoR. At the same time, BNR was modernizing its technology, with an approach that included automation of data collection through an electronic data warehouse (see box 5). The data warehouse has automatic and granular supply-side data, including sex-disaggre-gated data, that will serve BNR’s data collection and analysis needs, as well as facilitate business intelli-gence analysis.
As part of strengthening and automating their data systems, BNR developed guidelines and consist-ent definitions (a “Data Dictionary”). This process required financial institutions to align internal defi-nitions to those defined by BNR, to ensure data integrity and quality. BNR has been in dialogue with its reporting FSPs to achieve a balance to gather a sufficient amount of data to monitor women’s finan-cial inclusion, without unduly burdening FSPs and damaging their customer experiences. BNR’s auto-mated and sustainable data warehouse will close key gender data gaps, including how many women are being served by the formal financial system.
While making important progress on sex-disag-gregating supply-side data, BNR has experienced some challenges, particularly around data qual-ity, completeness, and granularity with FSPs. Data quality is dependent on the FSPs’ data maintenance and management information systems. The banks have responded positively to the BNR’s process of automated data collection, as it supports harmoni-zation and streamlining of their own data process-es, but they have had customer trust issues (when banks ask customers for more information as part of their reporting requirements). Automation also brings potential security concerns for financial insti-tutions around confidentiality, as well as substantial resource and capacity requirements.
National IDs as key to sex-disaggregation
Rwanda’s comprehensive national ID system has allowed for BNR and FSPs to sex-disag-gregate their data more easily. Everyone over the age of 16 is issued a national ID, which contains a unique and lifelong identifying number (a national identity number or NIN). The 16-digit NIN includes whether the person is a Rwandan national, foreigner, or refugee, as well as year of birth, and their sex. Sex is indicated by the presence of the numbers 7 or 8 in the sequence of the NIN. All government organizations, banking institutions and telecom operators use the NIN as a customer identifier, rendering it close to a universal identifier. This allows for relatively straightforward sex-dis-aggregation, and can aid with double-count-ing issues in terms of account ownership.
The data warehouse is BNR’s automated data collection and analysis system, where granular data from FSPs is regularly and automatically updated. The objectives of the warehouse include: helping to enable efficient and quality data capture, access, shar-ing, analysis and reporting; reducing the regulatory cost of reporting; and enabling the development and use of busi-ness intelligence tools.
• Includes sex-disaggregated data by product, accounts opened; also includes data by business segment, SME or corporate-owned
• Covers 600 regulated stakeholders including banks, insurance, pension, microfinance, SACCOs, forex bureaus, revenue authority, credit refinance, telecommunication companies, money transfer operators, and private credit reference bureaus
• Integrates data from multiple sources together in a central pool• Business intelligence: the warehouse will enable report production,
dashboard use and these features may be available to external stakeholders
• Data is pushed every 15min through a flexible system that can easi-ly take on additions and modifications of business definitions
Box 4
BOX 5 BNR’s Supply-Side Data Warehouse

7
Data Driving Women’s Financial Inclusion: Rwanda’s ExperienceCASE STUDY
Supply side data has helped to build the case for FSPs to target women12
12 This section is based on sex-disaggregated supply-side bank data from 2008 to 2013; non-bank (MFIs and SACCOS) data from 2008 to 2017; 2018 data for pension schemes, all provided by the National Bank of Rwanda; and 2012 to 2014 data on mobile money transfers from the Rwanda Utilities Regulatory Authority.
Figure 1: Number of new bank accounts, by sex, and % share of total for women, 2008-2013
2008
26.5%
30.9%29.6% 32.4%
31% 30.5%
2010 20122009 2011 2013
1,000,000
800,000
600,000
400,000
200,000
0
35%
30%
25%
20%
15%
10%
5%
0%
From 2008-2013, women’s share of new bank accounts opened rose from 26.5% to 30.5% (Figure 1). By 2013, men held more than double the amount of new bank accounts compared to women indicating that the rate of increase in wom-en opening new accounts needs to accelerate in order to close the gender gap.
The number of women saving in banks increased signifi-cantly from 2008-2013 while the number of men holding savings accounts decreased. The gender gap in savings ac-counts at the end of this period was only 3.5 percentage points. By the end of this period, wom-en accounted for 48% of saving at banks, up from 29% in 2008 (Figure 2).
Women Men % Share of Women
Figure 2: Number of men and women saving in banks, by sex and % share for women, 2008-2013
2008
28.6%
42.1% 38.1%
47.9% 48.2%
2010 20122009 2011 2013
200,000
150,000
100,000
50,000
0
60%
50%
40%
30%
20%
10%
0%
Women Men % Share of Women
Access Bank Rwanda is a commercial bank in Rwanda that started a Women’s Market Initiative in 2015, which included the sex-disaggregation of individual and business accounts. This data is available and automated starting from 2015. Access Bank is working on improving their data collection, analysis and use to better understand gender trends in product usage and what their market opportunities are.
In addition to analyzing their own data for market research and product development, Access Bank also reviews FinScope data. In particular, the FinScope data that demonstrates women’s membership in savings groups is of high interest to Access Bank, who is currently looking at how to tap into this market and come up with savings solutions targeted to women. Access Bank also works with AFR for advice on segments of their target market, including sub-segments of women.
BOX 6 A Private Sector Perspective: Access Bank and Gender Data
In the 2008-2013 period, the number of bank loans to women increased, but gender gaps persisted in lending. Women accounted for 27.9% of loans and 25% of the overall value of loans (Figures 3 and 4).
Figure 3: Number of new bank loans, by sex, 2008-2013
2008 2010 20122009 2011 2013
Women Men
50,000
40,000
30,000
20,000
10,000
02008 2010 20122009 2011 2013
Figure 4: Value of new bank loans, by sex, 2008-2013
200,000,000
150,000,000
100,000,000
50,000,000
0
Women Men
Supply-side sex-disaggregated data demonstrates a range of key insights on women’s financial inclusion in Rwanda, including the preferences and needs of women customers, as well as the business opportunities for FSPs.

8
Data Driving Women’s Financial Inclusion: Rwanda’s ExperienceCASE STUDY
Smaller loans led to a decrease in aver-age value of loans, despite an increase in number of loans for both men and wom-en. The rise in the total value of loans is a reflection of the expansion of the market overall, and represents more people get-ting smaller loans. The average value of loans fell sharply from 2008 to 2010, after which we see a levelling out in the amount of credit disbursed (Figure 5).
In the 2008-2013 period, women repaid interest at more consistent rates than men. Men accounted for a higher number and value of non-performing loans (loans for which customers are not repaying in-terest at the agreed rate which impacts the amount of capital that banks have to lend as credit to other customers). In 2008, the percentage of total outstanding loans for women that were non-performing was 10% versus 12% for men. By 2013, the value of women’s non-performing loans accounted for just 1.5% of the entire outstanding bank loan book, whereas men accounted for 6.9% (Figure 6).
The 2009 SACCO policy was success-ful in reducing gender gaps in microf-inance (MFI) account ownership. From 2008-2017, there was a significant jump in the number of deposit accounts for both men and women, as well as the share of accounts held by women, especially from 2010 to 2011. This jump likely reflects the impact of the 2009 SACCO policy and sug-gests that it was effective in helping reduce gender gaps in MFI accounts and boost overall number of accounts held. While men opened more accounts than women throughout the 2008-13 period, women’s accounts increased by 344%, while men saw a smaller 162% increase (Figure 7). Over the entire period, women increased their number of deposit accounts nearly six fold and the gender gap reduced from 40% to 13.4%.
There is limited coverage for both women and men in pension schemes (an im-portant aspect of financial inclusion). The numbers of men and women con-tributing to such schemes have remained small and stable in recent years, hover-ing just under 300,000 for men and peak-ing at 140,000 for women in June 2018 before dropping to 130,000 in Septem-ber. In a country with a population of over 12 million, this group likely represents a very small proportion of privileged individuals.
2008 2010 20122009 2011 2013
Figure 6: Number and value of non-performing loans, by sex, 2008-2013
Women Men10,000
7,500
5,000
2,500
0
Figure 7: Number of deposit accounts at MFIs and SACCOs, by sex, and share for women, 2008-2017
Women Men % Share of Women
2008 2012
30%
42.1%
29.5%
42.1%
29%
41.9%
42.9%41.4% 42.5%
43.3%
2010 20142010 20152009 20132011 2016 2017
2,000,000
1,800,000
1,600,000
1,600,000
1,400,000
1,200,000
1,000,000
800,000
600,000
400,000
200,000
0
50%
45%
40%
35%
30%
25%
20%
15%
10%
5%
0%
2008 2010 20122009 2011 2013
Figure 5: Average value of new authorized loans, by sex, 2008-2013
Women Men150,000,000
100,000,000
50,000,000
0
Gender gaps are also present in mobile money transfers. According to data from the Rwanda Utilities Regula-tory Authority (RURA, which regulates telecommunications), from 2012-2014, while the percentage of women sending and receiving money via mobile mon-ey transfers increased slowly (from 28% to 35% in sending money; from 35% to 39% in receiving money), the gender gap remained significant, a gap of 31 percent-age points for rates of sending mobile money, and nearly 23 percentage points for receiving mobile money in 2014.13 This presents a clear opportunity for mobile money providers to target women as po-tential clients.

9
Data Driving Women’s Financial Inclusion: Rwanda’s ExperienceCASE STUDY
Demand-side and supply- side data have been used to spur women’s financial inclusionData collection is only as impactful as its use—whether for a policy or market approach to wom-en’s financial inclusion. Rwandan government actors routinely use both supply and demand-side data: GMO uses financial inclusion data produced by the NISR, BNR, and FinScope to advocate with the data through workshops, media (TV and radio shows), and for policy guidance. The GMO also works with banks and uses this data as an advocacy tool.
This gender data has also been used to inform key research and advocacy reports on financial inclu-sion. For example, with the support of the BNR, ONE UN Rwanda, and the Embassy of Sweden, GMO pro-duced a resource on “Gender and Access to Finance” targeted at policymakers and FSPs to illustrate the progress currently achieved, as well as the barriers that remain, and advocate for further expansion of women’s financial inclusion. Data is presented in ac-cessible infographics and visualizations to reach a wider range of audiences. The resource is intend-ed to help financial institutions to embed gender
13 Gender Monitoring Office, March 2019. “The State of Gender Equality in Rwanda: From Transition to Transformation.”14 International Capital Corporation, New Faces New Voices, National Bank of Rwanda, February 2019. “Assessing Financial Inclusion for Women in Rwanda.”
equality, through sharing critical gender data with user-friendly illustration of trends and information, as well as serving as a baseline on women’s access to finance for GMO. Similarly, the GMO’s 2019 State of Gender Equality report includes financial inclusion gender data and visualizations.
Women’s financial inclusion data has also been used to develop the report, “Assessing Financial Inclusion for Women in Rwanda,” led by the International Cap-ital Corporation, New Faces New Voices, National Bank of Rwanda. The study examines the context of the supply-side opportunity of serving women mainly using sex-disaggregated demand-side Fin-Scope data and other non-sex-disaggregated sup-ply-side indicators. The report maps the supply-side indicator of distribution of points of service vis-à-vis the female population distribution (from the nation-al census), to show that a higher concentration of points of services is observed where there is a lower density of the female population. The report further found that Rwandan FSPs do not conduct market research to understand their women clients, and while they do collect sex-disaggregated data on their clients for reporting to BNR, they are not using the data to develop tailored products and services for the women’s market. There is long-term interest by FSPs to eventually use the gender data to improve how they serve women, but they need technical assistance to do so.14
10
Data Driving Women’s Financial Inclusion: Rwanda’s ExperienceCASE STUDY
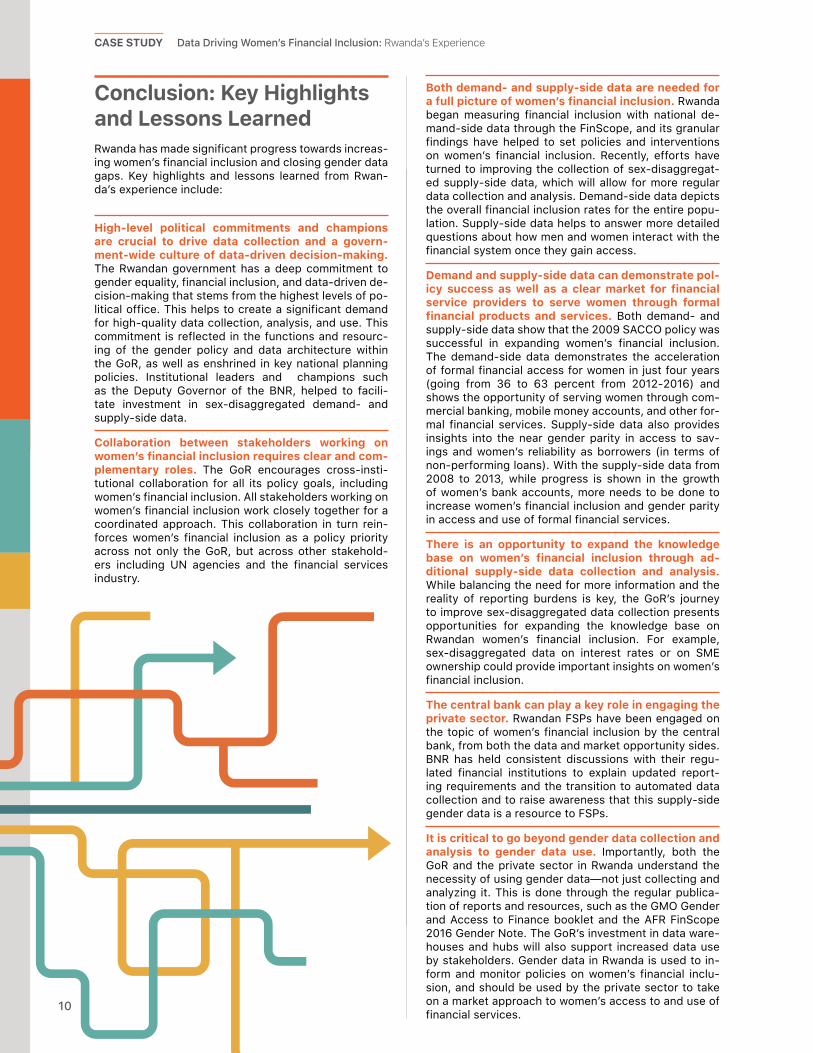
Both demand- and supply-side data are needed for a full picture of women’s financial inclusion. Rwanda began measuring financial inclusion with national de-mand-side data through the FinScope, and its granular findings have helped to set policies and interventions on women’s financial inclusion. Recently, efforts have turned to improving the collection of sex-disaggregat-ed supply-side data, which will allow for more regular data collection and analysis. Demand-side data depicts the overall financial inclusion rates for the entire popu-lation. Supply-side data helps to answer more detailed questions about how men and women interact with the financial system once they gain access.
Demand and supply-side data can demonstrate pol-icy success as well as a clear market for financial service providers to serve women through formal financial products and services. Both demand- and supply-side data show that the 2009 SACCO policy was successful in expanding women’s financial inclusion. The demand-side data demonstrates the acceleration of formal financial access for women in just four years (going from 36 to 63 percent from 2012-2016) and shows the opportunity of serving women through com-mercial banking, mobile money accounts, and other for-mal financial services. Supply-side data also provides insights into the near gender parity in access to sav-ings and women’s reliability as borrowers (in terms of non-performing loans). With the supply-side data from 2008 to 2013, while progress is shown in the growth of women’s bank accounts, more needs to be done to increase women’s financial inclusion and gender parity in access and use of formal financial services.
There is an opportunity to expand the knowledge base on women’s financial inclusion through ad-ditional supply-side data collection and analysis. While balancing the need for more information and the reality of reporting burdens is key, the GoR’s journey to improve sex-disaggregated data collection presents opportunities for expanding the knowledge base on Rwandan women’s financial inclusion. For example, sex-disaggregated data on interest rates or on SME ownership could provide important insights on women’s financial inclusion.
The central bank can play a key role in engaging the private sector. Rwandan FSPs have been engaged on the topic of women’s financial inclusion by the central bank, from both the data and market opportunity sides. BNR has held consistent discussions with their regu-lated financial institutions to explain updated report-ing requirements and the transition to automated data collection and to raise awareness that this supply-side gender data is a resource to FSPs.
It is critical to go beyond gender data collection and analysis to gender data use. Importantly, both the GoR and the private sector in Rwanda understand the necessity of using gender data—not just collecting and analyzing it. This is done through the regular publica-tion of reports and resources, such as the GMO Gender and Access to Finance booklet and the AFR FinScope 2016 Gender Note. The GoR’s investment in data ware-houses and hubs will also support increased data use by stakeholders. Gender data in Rwanda is used to in-form and monitor policies on women’s financial inclu-sion, and should be used by the private sector to take on a market approach to women’s access to and use of financial services.
High-level political commitments and champions are crucial to drive data collection and a govern-ment-wide culture of data-driven decision-making. The Rwandan government has a deep commitment to gender equality, financial inclusion, and data-driven de-cision-making that stems from the highest levels of po-litical office. This helps to create a significant demand for high-quality data collection, analysis, and use. This commitment is reflected in the functions and resourc-ing of the gender policy and data architecture within the GoR, as well as enshrined in key national planning policies. Institutional leaders and champions such as the Deputy Governor of the BNR, helped to facili-tate investment in sex-disaggregated demand- and supply-side data.
Collaboration between stakeholders working on women’s financial inclusion requires clear and com-plementary roles. The GoR encourages cross-insti-tutional collaboration for all its policy goals, including women’s financial inclusion. All stakeholders working on women’s financial inclusion work closely together for a coordinated approach. This collaboration in turn rein-forces women’s financial inclusion as a policy priority across not only the GoR, but across other stakehold-ers including UN agencies and the financial services industry.
Conclusion: Key Highlights and Lessons LearnedRwanda has made significant progress towards increas-ing women’s financial inclusion and closing gender data gaps. Key highlights and lessons learned from Rwan-da’s experience include:

11
Data Driving Women’s Financial Inclusion: Rwanda’s Experience
CASE STUDY

AcknowledgementsThis Women’s Financial Inclusion Data Partnership case study is authored by Stephanie Oula and Eleanor Carey of Data2X and Rita Kayibanda of the National Bank of Rwanda (BNR). The authors would like to acknowledge Mayra Buvinic (Data2X), Wilson Kamali (BNR), and Rebecca Ruf (Financial Alliance for Women), for their contributions and feedback to the case study, and Rachel Quint for editing. The authors wish to thank representatives of BNR, including Dr. Monique Nsanzabaganwa, Françoise Kagoyire, as well as other individuals and organizations, in particular Rose Rwabuhihi and the Gender Monitoring Office, Fatou Lo and UN Women Rwanda, as well as National Institute for Statistics Rwanda, Access to Finance Rwanda, and Access Bank for their generous participation and willingness to share their experiences in this case study.
Data Driving Women’s Financial Inclusion: Rwanda’s Experience
CASE STUDY
The GoR is advancing quickly in its efforts to build out a holistic data framework for women’s financial inclusion, with robust demand- and supply-side sex-disaggregated data. This data framework is critical to help Rwanda achieve its ambitious goal of 90% financial inclusion for all by 2020 and expand women’s financial inclusion. Gender data shows that there is a significant opportunity to increase women’s access to and use of financial services, and with this improved data, policymakers and financial service providers alike will be able to take respective action towards closing the gender gap in financial inclusion.