Embed Size (px)
Citation preview
Data Exchange 101Webinar transcript
Ok – so let’s get started and we’ll have a look at the Agenda.
• So today we are going to be taking a broad look at what the Data Exchange is, how it works and its benefits
• We will look at how to run and read standard reports and take a quick look at some of the Partnership Approach reports as well.
• For those of you that are going to be using the web-based portal to enter your data manually, we will also have a demonstration of that web-based portal to show you how intuitive and easy it is to use.
• And then at the end we will have a Q&A Section however as mentioned we will be answering questions right through the webinar today.
So what is the Data Exchange?
The Data Exchange is a program performance reporting tool, it is an easy to use IT system, and it accommodates the sectors varying business processes regardless of a providers size, type or delivery focus.
Now the Data Exchange was a project that began in October 2013 with extensive consultation with policy areas and service providers. This consultation informed the decisions of the Data Exchange and it created a single streamlined system which was focused on client outcomes.
The principles of the Data Exchange really were to reduce red tape by reducing the amount of data entry items and also reporting periods for service providers. It also captures outcomes that clients are achieving due to accessing to services and one of the other principles to working collaboratively with organisations to support the improvement of service delivery and program policy.
As the name the Data Exchange suggests, it reflects the two way partnership of information sharing between funding agencies and service providers. Now this enables providers to find smarter and more efficient ways of improving service delivery and understand the overall outcomes achieved for individuals, families and communities.
So, since being released in 2014, the Data Exchange has grown and is used by a number of funded programs so as you can see here, from July 2014 with Families and Children through to Aged Care coming on board from November 2015, the Tasmanian Government with their Department of Health and Human Services pilot in October 2016 through to NSW State Government Pilot in March 2017. So as of May of this year there are over 2,300 organisations and 11,000 users that are registered with the Data Exchange and numbers of users will increase as new programs on-board to the system. So, from June/July this year it will increase from 59 to 63 programs which will actually utilise the Data Exchange.
Now, as one of the principles was to cut red tape and reduce the number of reporting periods required by service providers, the Data Exchange has two, 6 month reporting periods per year.
So, the first spans from the 1st January through to the 30th June and the second is from the 1st July to the 31st December.
Service providers can enter their data for a reporting period at any point in time within that reporting period. Some may choose to enter their data every day, once a week, once a month or even every 3 months; it is really dependent on the organisation.
The Department though really does encourage organisations to enter data regularly because the reports are refreshed each night and can assist you in monitoring targets. So the more data that has been entered into the Date Exchange the more data and information an organisation has to draw out and use via reports.
Service providers also have a 30 day closing period at the end of each reporting period; these are the 30 th January and the 30th July each year. This extra time is a great opportunity for organisations to ensure that not only has their data been entered correctly but that the quality of their data is high as once again, it is this high quality data that will assist them in determining that the programs being delivered are targeting the right client groups and that the intending outcomes are being delivered.
Data Exchange101- Webinar transcript 1
For technical support; contact the Data Exchange Helpdesk by email [email protected] or on 1800 020 283.
So how can an organisation submit data to the Data Exchange?
As you can see on your screen there are 3 simple ways that an organisation can do this.
The first is the system-to-system transfer, the next one is XML Bulk upload and the third option is by the web-based portal.
XML and system-to-system are applicable for organisations wishing to use their own client management systems to meet reporting requirements. Organisations considering this approach should refer to the appropriate technical specifications which can be found on the Data Exchange website under the IT Access tab.
For organisations who either do not have a compatible software system or do not wish to enhance their software, these are able to report via the free web-based portal provided by the Department.
User support is available via the Data Exchange helpdesk and there are a number of task cards and e-Learning modules available on the Data Exchange website under the Training resources tabs. These resources will help organisations and users navigate the portal and enter their data effectively as that is something that we will run through after the session here.
No option is preferred by the Department, you should choose the method that best suits your business and organisation. But what we will do now is explore some of differences between each of these options.
System-to-system transfer means that you have and wish to continue to use your own client management system software. Your IT vendor can modify the specifications of the software so that Data Exchange relevant fields are automatically uploaded to the Data Exchange at regular intervals such as midnight each night.
Bulk XML upload is similar to system-to-system transfer, except that in this case your IT vendor can create a function where you manually bulk upload your data in XML format. This means that the relevant fields to the Data Exchange are extracted from your software as an XML file, and then a user must upload the file to the web-based portal. There is a size limit of 5MB of upload at one time, so uploading this regularly as well is recommended.
The e-Learning module on reference data and Bulk XML upload which both provide further instructions on how to do this.
Interestingly that code at the bottom, that’s an image that shows what an XML file looks like if you were to open it and read the code.
Technical specifications for both system-to-system and Bulk XML upload for your IT vendors are available on the Data Exchange website under IT access tab and we also have a 'Frequently asked questions document for technical questions' and 'Bulk XML upload errors and explanations' document available too. So they're very valuable handy resources to have a look at. As well we have the Helpdesk that can organise access for your IT vendor to a staging environment for testing and they're also able to answer any technical questions that your IT vendors may have.
The third option you can use is the web-based portal, and this allows a user to directly enter and report their data.
This is a free tool for providers who do not have their own client management software.
The web-based portal allows for recording client, service and outcomes data that meets all the data requirements for your programs and allows you and your staff to confidentially manage your client information.
The web-based portal however does not hold client contact phone numbers or client notes as this would not be in line with the privacy principles that the Data Exchange was designed around.
Your organisation can start off using one form of data entry such as the web-based portal and then they can actually at a later date, decide to change to either system-to-system or Bulk upload. You will need to ensure though that any client ID’s for the new method of upload are different or start after the last ID number allocated in the system that you were using before, otherwise any existing records that you have entered into either the web-based portal or into another system where the ID is being used again will be overwritten with the new information. So if your IT vendor is ever in doubt of the process, they can contact the DEX helpdesk for assistance.
As the web-based portal is a web service, it requires that your internet browser and Java script is up to date.
On screen you can see a listing of compatible browsers. This information is always available on the DEX website, in Task card 15 which is called ‘Supported browsers’.
If using an old browser, a user may experience graphics not displaying, there may be a jumbled home screen, elements that aren’t relevant to their program, or you might not be able to access certain records.
If this happens to you, check your browser and remember that the helpdesk is available for assistance.
Ok, so I might just go through and look at the questions that are coming through. There is one from Annabelle, "where would I find the XML document?" Thanks for that Annabelle, so if you go to the DEX DSS website, under IT Access, just scroll down the page and you'll find information on Bulk XML upload there and it will have the links to those documents.
Data Exchange 101 – Webinar transcript 2
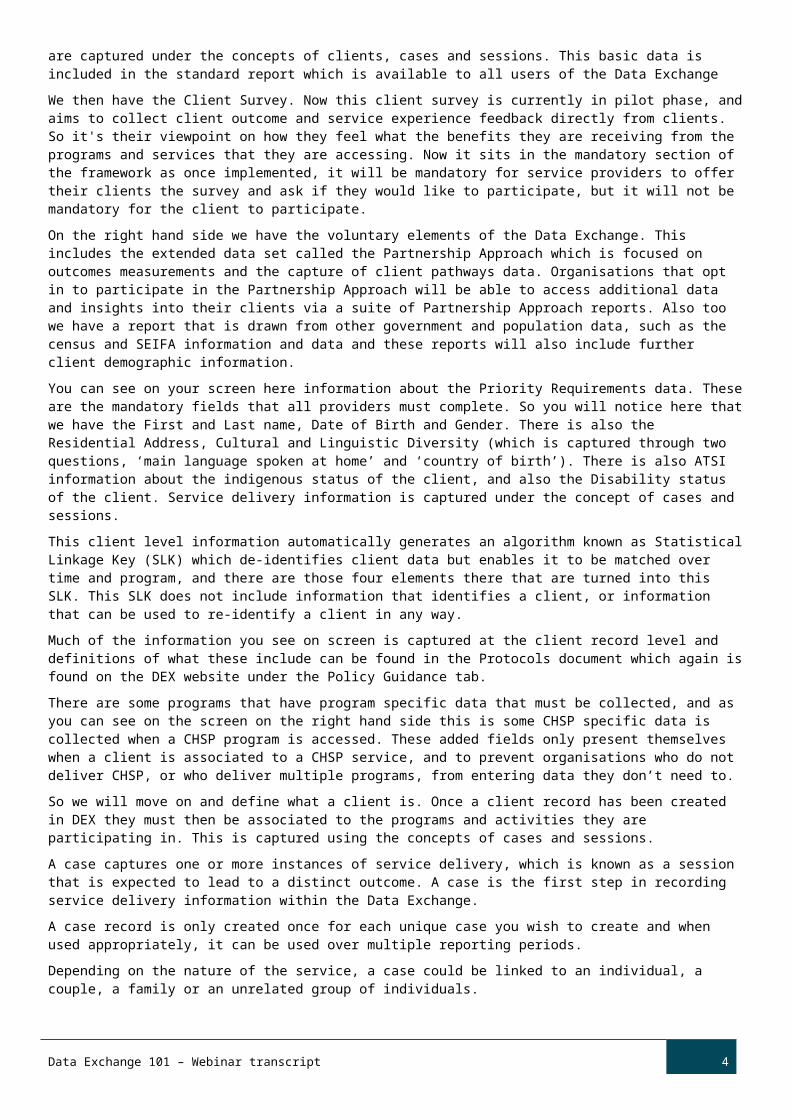
So a little bit more on the Data Exchange and as you can see on the screen, this is the framework. So we are going to be looking at and discussing the four different parts that make up the Data Exchange.
On the left in blue are mandatory elements of the Data Exchange. You have the Priority Requirements which are the basic data set that all service providers must report, and are captured under the concepts of clients, cases and sessions. This basic data is included in the standard report which is available to all users of the Data Exchange
We then have the Client Survey. Now this client survey is currently in pilot phase, and aims to collect client outcome and service experience feedback directly from clients. So it's their viewpoint on how they feel what the benefits they are receiving from the programs and services that they are accessing. Now it sits in the mandatory section of the framework as once implemented, it will be mandatory for service providers to offer their clients the survey and ask if they would like to participate, but it will not be mandatory for the client to participate.
On the right hand side we have the voluntary elements of the Data Exchange. This includes the extended data set called the Partnership Approach which is focused on outcomes measurements and the capture of client pathways data. Organisations that opt in to participate in the Partnership Approach will be able to access additional data and insights into their clients via a suite of Partnership Approach reports. Also too we have a report that is drawn from other government and population data, such as the census and SEIFA information and data and these reports will also include further client demographic information.
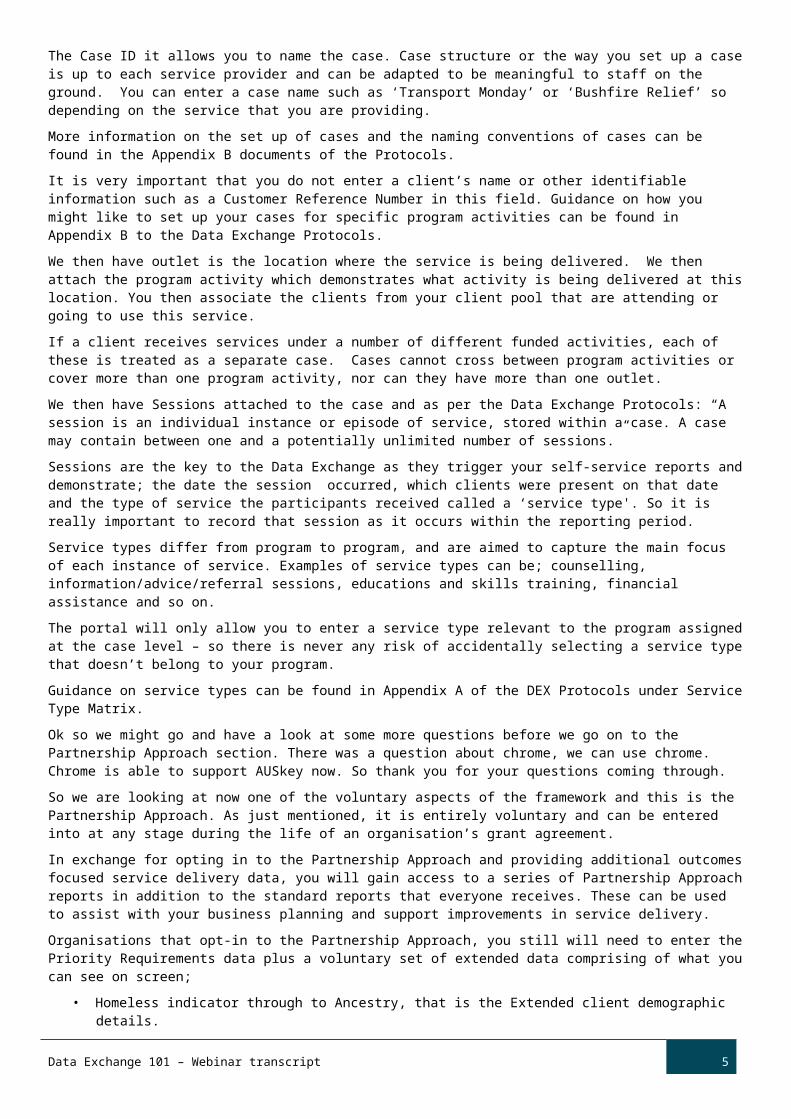
You can see on your screen here information about the Priority Requirements data. These are the mandatory fields that all providers must complete. So you will notice here that we have the First and Last name, Date of Birth and Gender. There is also the Residential Address, Cultural and Linguistic Diversity (which is captured through two questions, ‘main language spoken at home’ and ‘country of birth’). There is also ATSI information about the indigenous status of the client, and also the Disability status of the client. Service delivery information is captured under the concept of cases and sessions.
This client level information automatically generates an algorithm known as Statistical Linkage Key (SLK) which de-identifies client data but enables it to be matched over time and program, and there are those four elements there that are turned into this SLK. This SLK does not include information that identifies a client, or information that can be used to re-identify a client in any way.
Much of the information you see on screen is captured at the client record level and definitions of what these include can be found in the Protocols document which again is found on the DEX website under the Policy Guidance tab.
There are some programs that have program specific data that must be collected, and as you can see on the screen on the right hand side this is some CHSP specific data is collected when a CHSP program is accessed. These added fields only present themselves when a client is associated to a CHSP service, and to prevent organisations who do not deliver CHSP, or who deliver multiple programs, from entering data they don’t need to.
So we will move on and define what a client is. Once a client record has been created in DEX they must then be associated to the programs and activities they are participating in. This is captured using the concepts of cases and sessions.
A case captures one or more instances of service delivery, which is known as a session that is expected to lead to a distinct outcome. A case is the first step in recording service delivery information within the Data Exchange.
A case record is only created once for each unique case you wish to create and when used appropriately, it can be used over multiple reporting periods.
Depending on the nature of the service, a case could be linked to an individual, a couple, a family or an unrelated group of individuals.
The Case ID it allows you to name the case. Case structure or the way you set up a case is up to each service provider and can be adapted to be meaningful to staff on the ground. You can enter a case name such as ‘Transport Monday’ or ‘Bushfire Relief’ so depending on the service that you are providing.
More information on the set up of cases and the naming conventions of cases can be found in the Appendix B documents of the Protocols.
It is very important that you do not enter a client’s name or other identifiable information such as a Customer Reference Number in this field. Guidance on how you might like to set up your cases for specific program activities can be found in Appendix B to the Data Exchange Protocols.
We then have outlet is the location where the service is being delivered. We then attach the program activity which demonstrates what activity is being delivered at this location. You then associate the clients from your client pool that are attending or going to use this service.
If a client receives services under a number of different funded activities, each of these is treated as a separate case. Cases cannot cross between program activities or cover more than one program activity, nor can they have more than one outlet.
We then have Sessions attached to the case and as per the Data Exchange Protocols: “A session is an individual instance or episode of service, stored within a case. A case may contain between one and a potentially unlimited number of sessions.”
Data Exchange 101 – Webinar transcript 3
Sessions are the key to the Data Exchange as they trigger your self-service reports and demonstrate; the date the session occurred, which clients were present on that date and the type of service the participants received called a ‘service type'. So it is really important to record that session as it occurs within the reporting period.
Service types differ from program to program, and are aimed to capture the main focus of each instance of service. Examples of service types can be; counselling, information/advice/referral sessions, educations and skills training, financial assistance and so on.
The portal will only allow you to enter a service type relevant to the program assigned at the case level – so there is never any risk of accidentally selecting a service type that doesn’t belong to your program.
Guidance on service types can be found in Appendix A of the DEX Protocols under Service Type Matrix.
Ok so we might go and have a look at some more questions before we go on to the Partnership Approach section. There was a question about chrome, we can use chrome. Chrome is able to support AUSkey now. So thank you for your questions coming through.
So we are looking at now one of the voluntary aspects of the framework and this is the Partnership Approach. As just mentioned, it is entirely voluntary and can be entered into at any stage during the life of an organisation’s grant agreement.
In exchange for opting in to the Partnership Approach and providing additional outcomes focused service delivery data, you will gain access to a series of Partnership Approach reports in addition to the standard reports that everyone receives. These can be used to assist with your business planning and support improvements in service delivery.
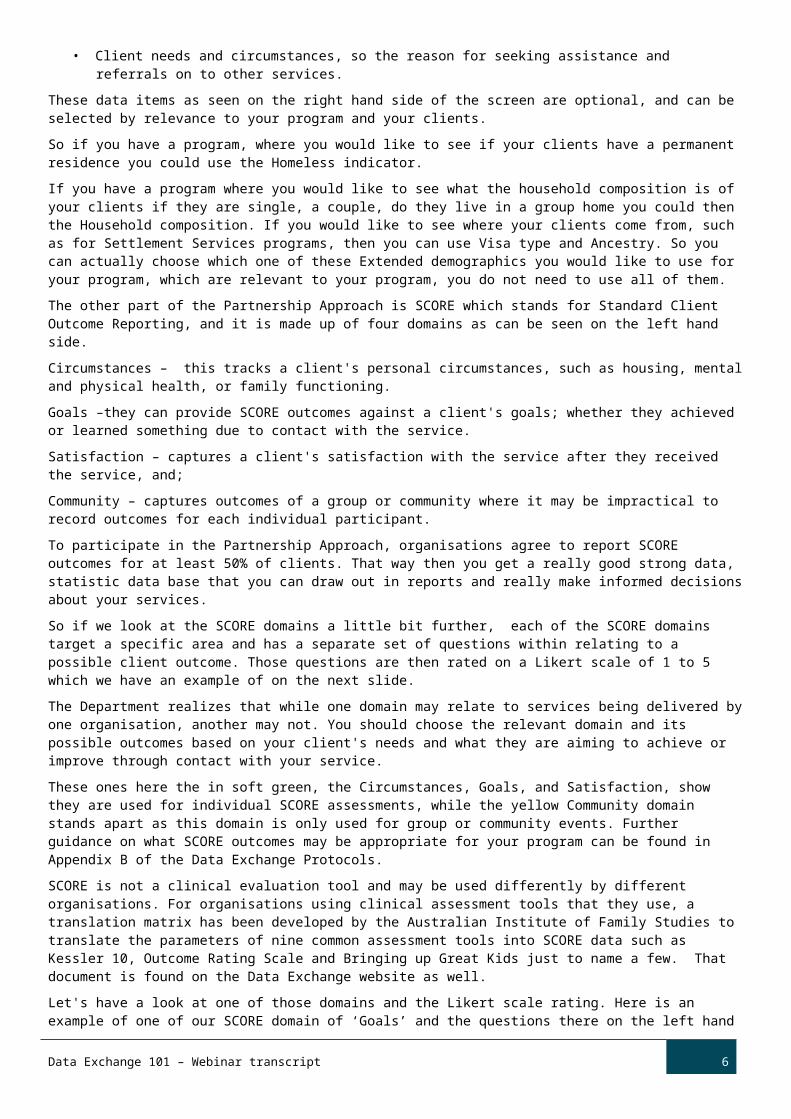
Organisations that opt-in to the Partnership Approach, you still will need to enter the Priority Requirements data plus a voluntary set of extended data comprising of what you can see on screen;
• Homeless indicator through to Ancestry, that is the Extended client demographic details.
• Client needs and circumstances, so the reason for seeking assistance and referrals on to other services.
These data items as seen on the right hand side of the screen are optional, and can be selected by relevance to your program and your clients.
So if you have a program, where you would like to see if your clients have a permanent residence you could use the Homeless indicator.
If you have a program where you would like to see what the household composition is of your clients if they are single, a couple, do they live in a group home you could then the Household composition. If you would like to see where your clients come from, such as for Settlement Services programs, then you can use Visa type and Ancestry. So you can actually choose which one of these Extended demographics you would like to use for your program, which are relevant to your program, you do not need to use all of them.
The other part of the Partnership Approach is SCORE which stands for Standard Client Outcome Reporting, and it is made up of four domains as can be seen on the left hand side.
Circumstances – this tracks a client's personal circumstances, such as housing, mental and physical health, or family functioning.
Goals –they can provide SCORE outcomes against a client's goals; whether they achieved or learned something due to contact with the service.
Satisfaction – captures a client's satisfaction with the service after they received the service, and;
Community – captures outcomes of a group or community where it may be impractical to record outcomes for each individual participant.
To participate in the Partnership Approach, organisations agree to report SCORE outcomes for at least 50% of clients. That way then you get a really good strong data, statistic data base that you can draw out in reports and really make informed decisions about your services.
So if we look at the SCORE domains a little bit further, each of the SCORE domains target a specific area and has a separate set of questions within relating to a possible client outcome. Those questions are then rated on a Likert scale of 1 to 5 which we have an example of on the next slide.
The Department realizes that while one domain may relate to services being delivered by one organisation, another may not. You should choose the relevant domain and its possible outcomes based on your client's needs and what they are aiming to achieve or improve through contact with your service.
These ones here the in soft green, the Circumstances, Goals, and Satisfaction, show they are used for individual SCORE assessments, while the yellow Community domain stands apart as this domain is only used for group or community events. Further guidance on what SCORE outcomes may be appropriate for your program can be found in Appendix B of the Data Exchange Protocols.
Data Exchange 101 – Webinar transcript 4
SCORE is not a clinical evaluation tool and may be used differently by different organisations. For organisations using clinical assessment tools that they use, a translation matrix has been developed by the Australian Institute of Family Studies to translate the parameters of nine common assessment tools into SCORE data such as Kessler 10, Outcome Rating Scale and Bringing up Great Kids just to name a few. That document is found on the Data Exchange website as well.
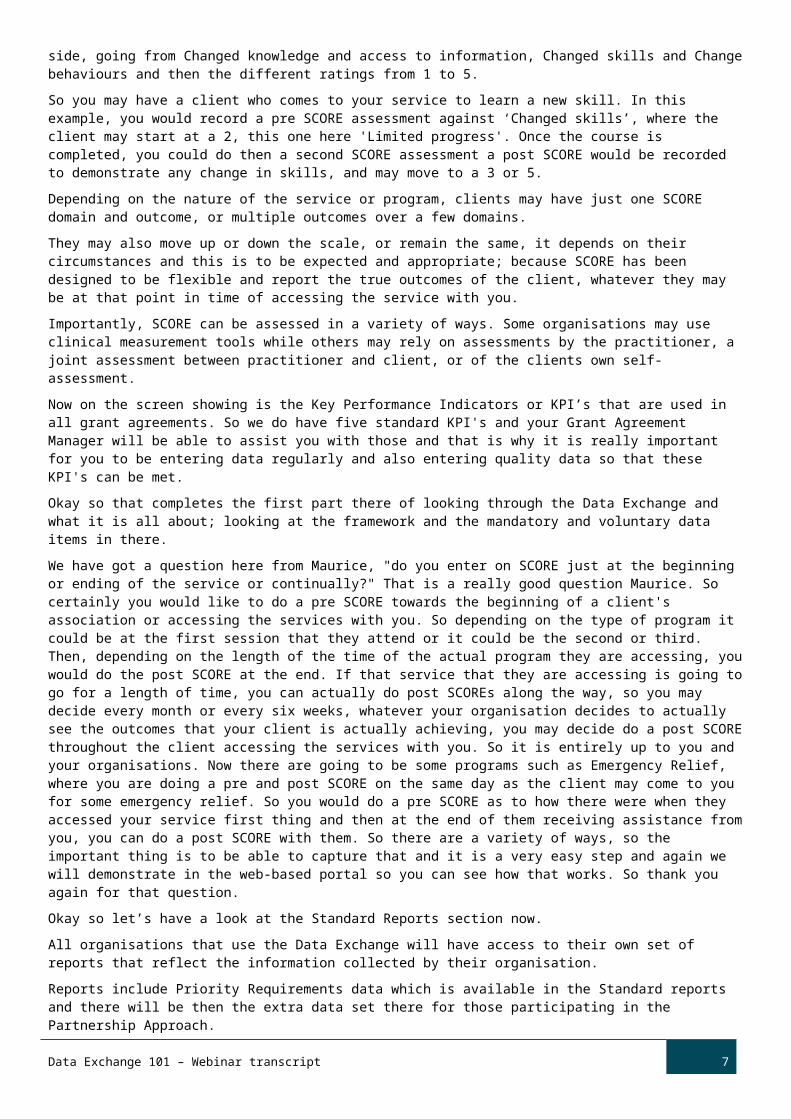
Let's have a look at one of those domains and the Likert scale rating. Here is an example of one of our SCORE domain of ‘Goals’ and the questions there on the left hand side, going from Changed knowledge and access to information, Changed skills and Change behaviours and then the different ratings from 1 to 5.
So you may have a client who comes to your service to learn a new skill. In this example, you would record a pre SCORE assessment against ‘Changed skills’, where the client may start at a 2, this one here 'Limited progress'. Once the course is completed, you could do then a second SCORE assessment a post SCORE would be recorded to demonstrate any change in skills, and may move to a 3 or 5.
Depending on the nature of the service or program, clients may have just one SCORE domain and outcome, or multiple outcomes over a few domains.
They may also move up or down the scale, or remain the same, it depends on their circumstances and this is to be expected and appropriate; because SCORE has been designed to be flexible and report the true outcomes of the client, whatever they may be at that point in time of accessing the service with you.
Importantly, SCORE can be assessed in a variety of ways. Some organisations may use clinical measurement tools while others may rely on assessments by the practitioner, a joint assessment between practitioner and client, or of the clients own self-assessment.
Now on the screen showing is the Key Performance Indicators or KPI’s that are used in all grant agreements. So we do have five standard KPI's and your Grant Agreement Manager will be able to assist you with those and that is why it is really important for you to be entering data regularly and also entering quality data so that these KPI's can be met.
Okay so that completes the first part there of looking through the Data Exchange and what it is all about; looking at the framework and the mandatory and voluntary data items in there.
We have got a question here from Maurice, "do you enter on SCORE just at the beginning or ending of the service or continually?" That is a really good question Maurice. So certainly you would like to do a pre SCORE towards the beginning of a client's association or accessing the services with you. So depending on the type of program it could be at the first session that they attend or it could be the second or third. Then, depending on the length of the time of the actual program they are accessing, you would do the post SCORE at the end. If that service that they are accessing is going to go for a length of time, you can actually do post SCOREs along the way, so you may decide every month or every six weeks, whatever your organisation decides to actually see the outcomes that your client is actually achieving, you may decide do a post SCORE throughout the client accessing the services with you. So it is entirely up to you and your organisations. Now there are going to be some programs such as Emergency Relief, where you are doing a pre and post SCORE on the same day as the client may come to you for some emergency relief. So you would do a pre SCORE as to how there were when they accessed your service first thing and then at the end of them receiving assistance from you, you can do a post SCORE with them. So there are a variety of ways, so the important thing is to be able to capture that and it is a very easy step and again we will demonstrate in the web-based portal so you can see how that works. So thank you again for that question.
Okay so let’s have a look at the Standard Reports section now.
All organisations that use the Data Exchange will have access to their own set of reports that reflect the information collected by their organisation.
Reports include Priority Requirements data which is available in the Standard reports and there will be then the extra data set there for those participating in the Partnership Approach.
Now with the Standard reports, these include a Standard Programme Report and an Organisation Overview Report.
These Standard Reports are available any time during the six month reporting period and will provide your organisation with up to date information on data entered within 24 hours of upload.
For example, if you entered data on a Tuesday afternoon, by Wednesday afternoon you would be able to see that data in these reports.
There are a number of benefits for organisations in being able to access and view these reports:
• Firstly, an organisation will have visibility of the data that has been entered.
• You’ll have visibility of the data quality and the integrity. So you’ll be able to see from the reports that this program should have this type of client in it, why not, and be able to then review how the data is being entered and collected.
• And, an organisation can promote the services that they are delivering with evidentiary support.
Data Exchange 101 – Webinar transcript 5
• As mentioned earlier sessions drive the reports so you will see data of clients and cases that have had sessions recorded against them within the reporting period. So really important to enter your data regularly.
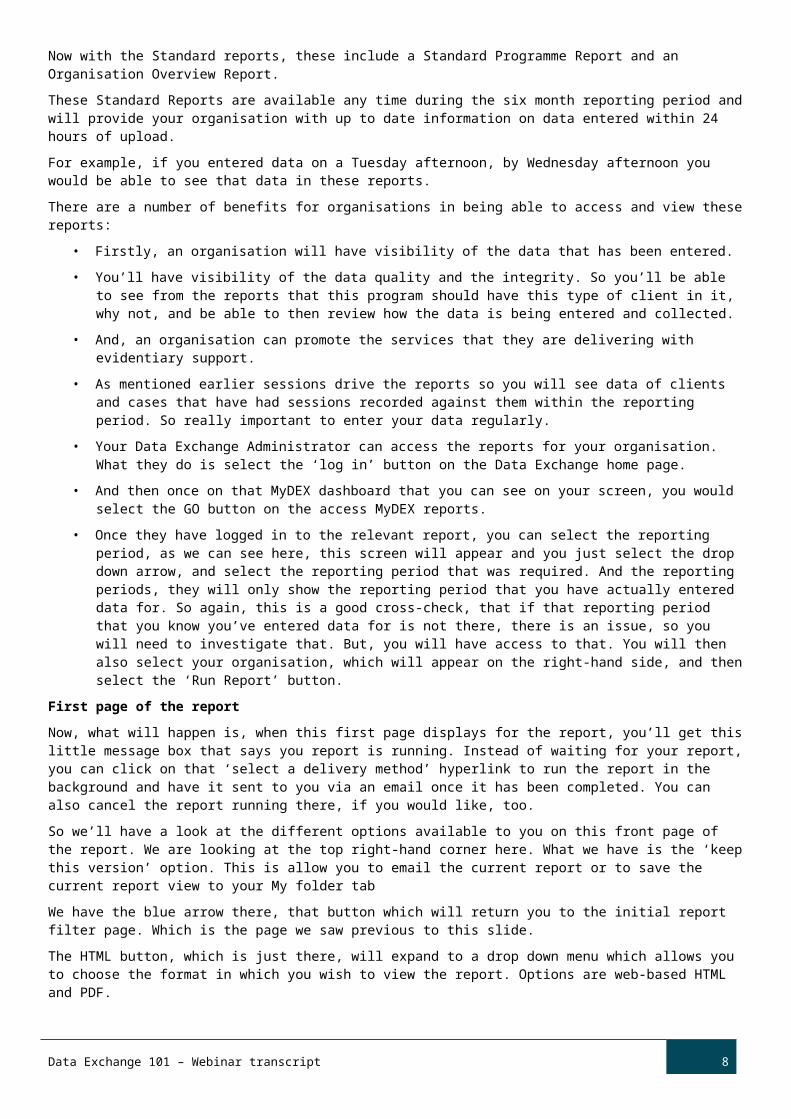
• Your Data Exchange Administrator can access the reports for your organisation. What they do is select the ‘log in’ button on the Data Exchange home page.
• And then once on that MyDEX dashboard that you can see on your screen, you would select the GO button on the access MyDEX reports.
• Once they have logged in to the relevant report, you can select the reporting period, as we can see here, this screen will appear and you just select the drop down arrow, and select the reporting period that was required. And the reporting periods, they will only show the reporting period that you have actually entered data for. So again, this is a good cross-check, that if that reporting period that you know you’ve entered data for is not there, there is an issue, so you will need to investigate that. But, you will have access to that. You will then also select your organisation, which will appear on the right-hand side, and then select the ‘Run Report’ button.
First page of the report
Now, what will happen is, when this first page displays for the report, you’ll get this little message box that says you report is running. Instead of waiting for your report, you can click on that ‘select a delivery method’ hyperlink to run the report in the background and have it sent to you via an email once it has been completed. You can also cancel the report running there, if you would like, too.
So we’ll have a look at the different options available to you on this front page of the report. We are looking at the top right-hand corner here. What we have is the ‘keep this version’ option. This is allow you to email the current report or to save the current report view to your My folder tab
We have the blue arrow there, that button which will return you to the initial report filter page. Which is the page we saw previous to this slide.
The HTML button, which is just there, will expand to a drop down menu which allows you to choose the format in which you wish to view the report. Options are web-based HTML and PDF.
• Reports in PDF format can be printed and/or saved to your computer. They can also be emailed to other staff in your organisation.
• The Excel Option is not available.
Finally on this section here, you have the ‘add the report’ button. This will allow you to add the report to your My Folder tab or add it to the webpage bookmarks.
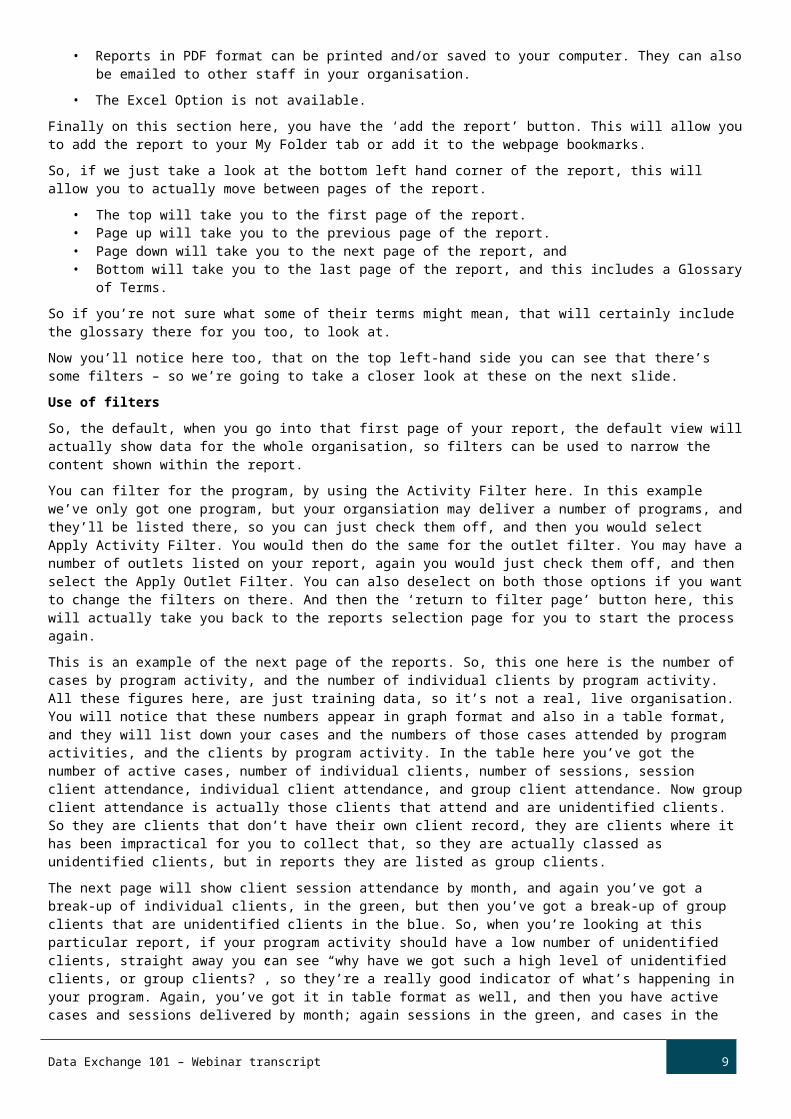
So, if we just take a look at the bottom left hand corner of the report, this will allow you to actually move between pages of the report.
• The top will take you to the first page of the report. • Page up will take you to the previous page of the report. • Page down will take you to the next page of the report, and • Bottom will take you to the last page of the report, and this includes a Glossary of Terms.
So if you’re not sure what some of their terms might mean, that will certainly include the glossary there for you too, to look at.
Now you’ll notice here too, that on the top left-hand side you can see that there’s some filters – so we’re going to take a closer look at these on the next slide.
Use of filters
So, the default, when you go into that first page of your report, the default view will actually show data for the whole organisation, so filters can be used to narrow the content shown within the report.
You can filter for the program, by using the Activity Filter here. In this example we’ve only got one program, but your organsiation may deliver a number of programs, and they’ll be listed there, so you can just check them off, and then you would select Apply Activity Filter. You would then do the same for the outlet filter. You may have a number of outlets listed on your report, again you would just check them off, and then select the Apply Outlet Filter. You can also deselect on both those options if you want to change the filters on there. And then the ‘return to filter page’ button here, this will actually take you back to the reports selection page for you to start the process again.
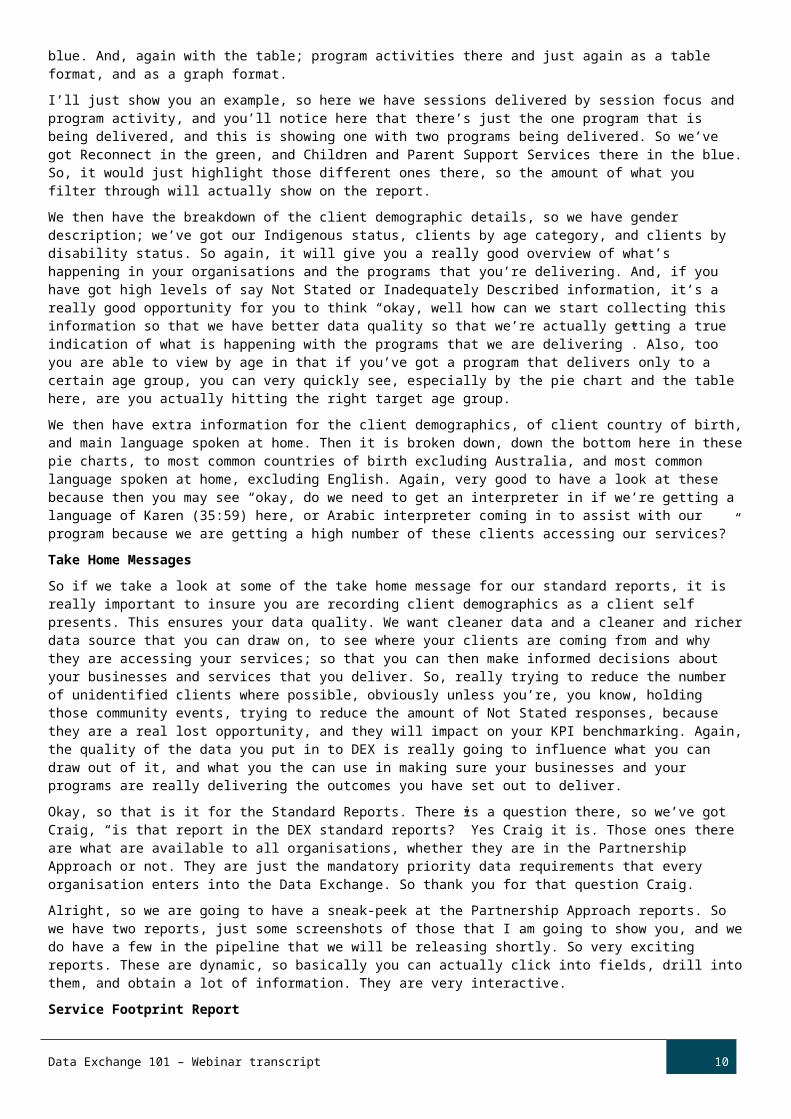
This is an example of the next page of the reports. So, this one here is the number of cases by program activity, and the number of individual clients by program activity. All these figures here, are just training data, so it’s not a real, live organisation. You will notice that these numbers appear in graph format and also in a table format, and they will list down your cases and the numbers of those cases attended by program activities, and the clients by program activity. In the table here you’ve got the number of active cases, number of individual clients, number of sessions, session client attendance, individual client attendance, and group
Data Exchange 101 – Webinar transcript 6
client attendance. Now group client attendance is actually those clients that attend and are unidentified clients. So they are clients that don’t have their own client record, they are clients where it has been impractical for you to collect that, so they are actually classed as unidentified clients, but in reports they are listed as group clients.
The next page will show client session attendance by month, and again you’ve got a break-up of individual clients, in the green, but then you’ve got a break-up of group clients that are unidentified clients in the blue. So, when you’re looking at this particular report, if your program activity should have a low number of unidentified clients, straight away you can see “why have we got such a high level of unidentified clients, or group clients?”, so they’re a really good indicator of what’s happening in your program. Again, you’ve got it in table format as well, and then you have active cases and sessions delivered by month; again sessions in the green, and cases in the blue. And, again with the table; program activities there and just again as a table format, and as a graph format.
I’ll just show you an example, so here we have sessions delivered by session focus and program activity, and you’ll notice here that there’s just the one program that is being delivered, and this is showing one with two programs being delivered. So we’ve got Reconnect in the green, and Children and Parent Support Services there in the blue. So, it would just highlight those different ones there, so the amount of what you filter through will actually show on the report.
We then have the breakdown of the client demographic details, so we have gender description; we’ve got our Indigenous status, clients by age category, and clients by disability status. So again, it will give you a really good overview of what’s happening in your organisations and the programs that you’re delivering. And, if you have got high levels of say Not Stated or Inadequately Described information, it’s a really good opportunity for you to think “okay, well how can we start collecting this information so that we have better data quality so that we’re actually getting a true indication of what is happening with the programs that we are delivering”. Also, too you are able to view by age in that if you’ve got a program that delivers only to a certain age group, you can very quickly see, especially by the pie chart and the table here, are you actually hitting the right target age group.
We then have extra information for the client demographics, of client country of birth, and main language spoken at home. Then it is broken down, down the bottom here in these pie charts, to most common countries of birth excluding Australia, and most common language spoken at home, excluding English. Again, very good to have a look at these because then you may see “okay, do we need to get an interpreter in if we’re getting a language of Karen (35:59) here, or Arabic interpreter coming in to assist with our program because we are getting a high number of these clients accessing our services?”
Take Home Messages
So if we take a look at some of the take home message for our standard reports, it is really important to insure you are recording client demographics as a client self presents. This ensures your data quality. We want cleaner data and a cleaner and richer data source that you can draw on, to see where your clients are coming from and why they are accessing your services; so that you can then make informed decisions about your businesses and services that you deliver. So, really trying to reduce the number of unidentified clients where possible, obviously unless you’re, you know, holding those community events, trying to reduce the amount of Not Stated responses, because they are a real lost opportunity, and they will impact on your KPI benchmarking. Again, the quality of the data you put in to DEX is really going to influence what you can draw out of it, and what you the can use in making sure your businesses and your programs are really delivering the outcomes you have set out to deliver.
Okay, so that is it for the Standard Reports. There is a question there, so we’ve got Craig, “is that report in the DEX standard reports?” Yes Craig it is. Those ones there are what are available to all organisations, whether they are in the Partnership Approach or not. They are just the mandatory priority data requirements that every organisation enters into the Data Exchange. So thank you for that question Craig.
Alright, so we are going to have a sneak-peek at the Partnership Approach reports. So we have two reports, just some screenshots of those that I am going to show you, and we do have a few in the pipeline that we will be releasing shortly. So very exciting reports. These are dynamic, so basically you can actually click into fields, drill into them, and obtain a lot of information. They are very interactive.
Service Footprint Report
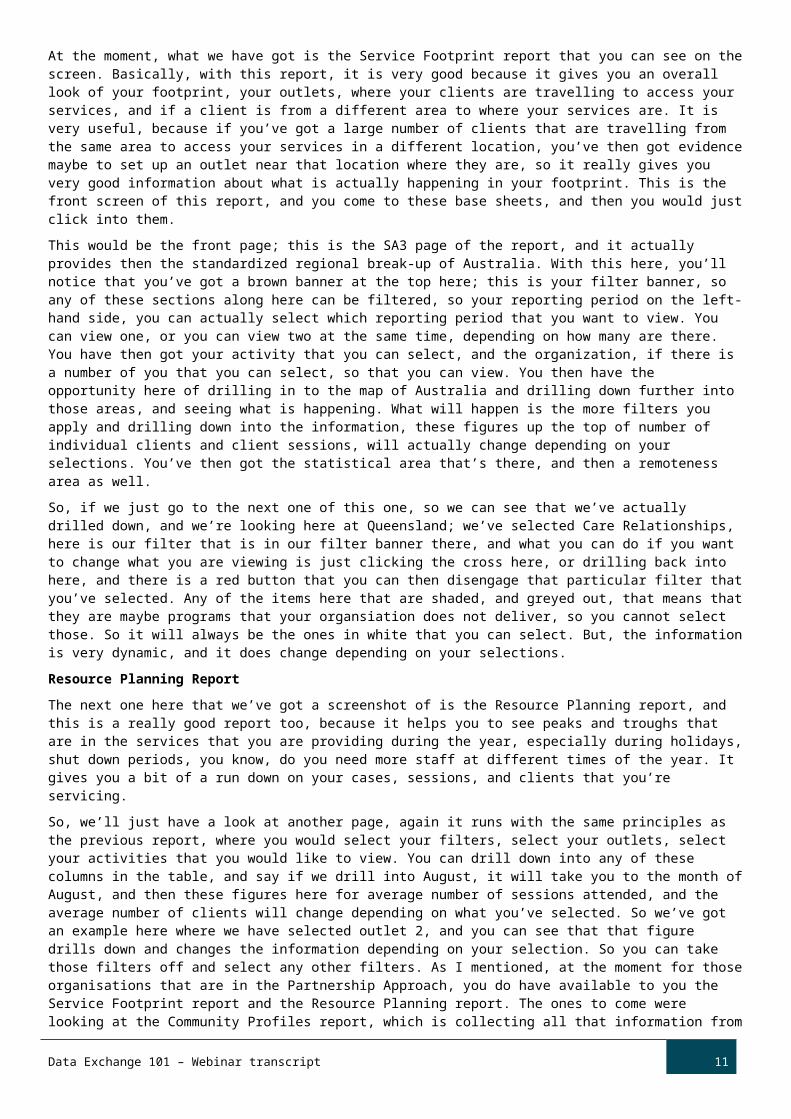
At the moment, what we have got is the Service Footprint report that you can see on the screen. Basically, with this report, it is very good because it gives you an overall look of your footprint, your outlets, where your clients are travelling to access your services, and if a client is from a different area to where your services are. It is very useful, because if you’ve got a large number of clients that are travelling from the same area to access your services in a different location, you’ve then got evidence maybe to set up an outlet near that location where they are, so it really gives you very good information about what is actually happening in your footprint. This is the front screen of this report, and you come to these base sheets, and then you would just click into them.
This would be the front page; this is the SA3 page of the report, and it actually provides then the standardized regional break-up of Australia. With this here, you’ll notice that you’ve got a brown banner at the top here; this is your filter banner, so any of these sections along here can be filtered, so your reporting period on the left-hand side, you can actually select which reporting period that you want to view. You can view one, or you can view two at the same time, depending on how many are there. You have then got your activity that you can select, and the organization, if there is a number of you that you can select, so that you
Data Exchange 101 – Webinar transcript 7
can view. You then have the opportunity here of drilling in to the map of Australia and drilling down further into those areas, and seeing what is happening. What will happen is the more filters you apply and drilling down into the information, these figures up the top of number of individual clients and client sessions, will actually change depending on your selections. You’ve then got the statistical area that’s there, and then a remoteness area as well.
So, if we just go to the next one of this one, so we can see that we’ve actually drilled down, and we’re looking here at Queensland; we’ve selected Care Relationships, here is our filter that is in our filter banner there, and what you can do if you want to change what you are viewing is just clicking the cross here, or drilling back into here, and there is a red button that you can then disengage that particular filter that you’ve selected. Any of the items here that are shaded, and greyed out, that means that they are maybe programs that your organsiation does not deliver, so you cannot select those. So it will always be the ones in white that you can select. But, the information is very dynamic, and it does change depending on your selections.
Resource Planning Report
The next one here that we’ve got a screenshot of is the Resource Planning report, and this is a really good report too, because it helps you to see peaks and troughs that are in the services that you are providing during the year, especially during holidays, shut down periods, you know, do you need more staff at different times of the year. It gives you a bit of a run down on your cases, sessions, and clients that you’re servicing.
So, we’ll just have a look at another page, again it runs with the same principles as the previous report, where you would select your filters, select your outlets, select your activities that you would like to view. You can drill down into any of these columns in the table, and say if we drill into August, it will take you to the month of August, and then these figures here for average number of sessions attended, and the average number of clients will change depending on what you’ve selected. So we’ve got an example here where we have selected outlet 2, and you can see that that figure drills down and changes the information depending on your selection. So you can take those filters off and select any other filters. As I mentioned, at the moment for those organisations that are in the Partnership Approach, you do have available to you the Service Footprint report and the Resource Planning report. The ones to come were looking at the Community Profiles report, which is collecting all that information from that population data, which is ABS, Census, SEIFA, and other data, so that it is all in one place, which is fantastic. Feedback we’ve been getting from the sessions for the Roadshow, that it is just brilliant because it is all in one place. And, there is other information, the Extended Demographics, because it will present back to you information regarding your client profiles. There is a CHSP Standard report, and there is also a SCORE report on its way too. So, these will be available to those organisations that are participating in the Partnership Approach, so very very fantastic, intuitive, dynamic reports.
That is the end of our demonstration so far, because we are just going to detour and we are going to do a demonstration of the web-based portal, in entering a client, case, and session so that you can see how that all works. So, we will just get that ready for you. And, keep those questions coming in, Angie and Adina are there answering that for you, so thank you for everybody who has participated and are answering the questions there, and asking those questions.
Web-based portal demonstration
Okay, so everybody should see the MyDEX dashboard on their screen. We will do a demonstration of the web-based portal, so you can see how wonderful and easy it is use, and again there are some task cards and e-Learning modules available on the website that actually go through and discuss step-by-step the processes involved for those organisations that are going to be using the web-based portal and entering their data that way.
When you log in, you will come to this screen and at the top right we have the Notifications button. This advises of any changes, updates or important notices for the Data Exchange, So for those service providers that aren’t going to be using the web-based portal but will be using system-to-system or Bulk upload, there will be other avenues for you to receive notifications including emails, so you are not going to miss out in that way.
As we mentioned earlier in the Standard reports, this is the MyDEX reports section that you would go to access reports. We then have the My Organisation field which the Org Administrator will have access to. If you are a 'View only' user you won't have access to this particular field, you won't see it when you log into the Data Exchange.
So we will go into the Manage organisation, as we have mentioned about the Partnership Approach. So Manage organisation is where you would have the indicator that you are in the Partnership Approach and you can see on this screen here that under Partnership Approach agreement that it is turned on yes. For example if that was No, and you do want to be part of the Partnership Approach, your Org Administrator would go into that select Yes and Save, and that would update the details there for you. This is also too where they would add Outlets and Program activities.
You will notice that on the right-hand side there is a 'I want to…' section, a very easy navigation to go to either the Home page, Find a case or Add a case as well, so there are many ways to get to where you want to in the web-based portal. So we will go back to the Home page. We will continue on to the My Organisation field, Manage users is where again, the Org Administrator would go in and add new users of their organisation to be able to access the web-based portal. There are three different types of users, including the Org Administrator user. You can have Editor access which allows a user to add and amend information that is in the web-based portal and then you also have a View only user and they can only just view the information, they wouldn’t be able to add any information or edit any information. You may recall early on in the session that we discussed Bulk XML upload.
Data Exchange 101 – Webinar transcript 8
So the Reference data upload files, this is where you would go to get that information and Upload files this is where you would go to upload your data into the Data Exchange.
We then have the Find client and Find case fields. With the Find client, the most recent client that you create in the Data Exchange will display, and these again are all fictional characters that we have used. You can also conduct a search of your clients using their Given name, Family name, Client ID, Tags, things like that, and select Search and then Clear to clear that. It is the same principles with the Find a case. You can search Case ID, Outlet and even search Cases created by me and then again the results there will display.
We then come to the Add client, case and session fields, so what we are going to do is add a client, case and session so that see how it all works. So firstly you will see that this is the first page of Add a client – Client details. So we will do a tour of the page. You will notice that at the top of the page is a status bar. So as you work through the different steps, this will all change colour and give you an indication of where you are in the process of adding a client to the Data Exchange manually. So you will notice too, that there are some fields that have an asterisk, these are mandatory fields, so they must be completed before you can proceed to the next page. So we will now add in our client, the first one (field) here is not mandatory but you can actually enter in your own Client ID if you like, if your organisation uses a particular number system that you'd like to maintain or you would like to name it a certain way, you can add a client ID here, however, please do not use identifying features such as a client's name in this or CRN numbers because that ID is going to be visible to the Department and using any of those particular information will contravene the privacy.
So we are going to add a client's name here, and then their Family name. You will notice that this is as the client presents, so the client is well within their rights if they want to provide or use a pseudonym, if they did you would tick that Name provided is a pseudonym box, in this case Samuel isn’t, it's his real name, so we are just going to leave that unchecked.
The next field is the Date of Birth, so again a client is well within their rights to not provide their full date of birth. It could be for personal, cultural or religious reasons or they may not know what their date of birth is. Now if that is the case, if they are not sure or if any of those situations occur, you can actually provide an estimated date of birth, so if you tick that box, you can then provide an estimated date of year. So if you think that person looks this amount of years, you would put the year that you think they would have been born in. In this case though we have got a date of birth for Samuel, so we can either pick a date from the calendar here or we can just type it in and making sure that all these fields are completed.
The next field is Gender, and again this is how the client presents, how they self-identify as, so we have the four choices that we would make a selection there.
The next field is tags, and the feedback that we have is that this is very handy for organisations to use. So what you can do is you can tag certain clients. You can see some of the choices that we have here, 'Anne's clients', 'Brendon's clients', 'Boxing group' and you can then do a search, say you are having a function or want to do an information session for all of Anne's clients, then you can do a search using that particular tag of 'Anne's clients'. So what you would do is type that in, so select 'Anne's clients' and select Add and then that tag will display at the top of that field box.
The next field that we have is the Consent fields and so they have been pre-ticked just to cut red tape. However, when you are entering client's details, you do need to obtain their consent for the Department to collect and store their personal information in the Data Exchange, and there is also consent there for future contact surveys, research and evaluation. Now if they didn’t consent to any of that, to the storing of personal information, you would un-tick that and then their name would display as Name Hidden. So in this case it is all okay, we are going to select the Next button and move on. Now you will notice that the status bar has now moved on to the next section that needs to be completed which is the Add a client – Residential address. You can enter in the client's full residential address however that is not mandatory – the house number and street name. What is mandatory though is the Suburb, State and Postcode, that is what we will enter and then we select Next.
Okay, we can see again, the status bar has moved along and we are at the Add a client – Demographic details. Now this is the CALD information – Country of Birth and Main language spoken at home. You can either select using the drop down or you can type in the client's Country of birth – the first letter, so in this case we will do a D for Denmark and select it that way, and the same then for the Main language spoken at home, you can either scroll down to where the main language is or type in the first letter and in this case we will use English and we are going to select that way there. Both these lists are from the ABS standard list. With the languages they include most Australian Indigenous languages and with the Country of birth list, it is the list based again from the Australian Bureau of Statistics. So if you feel or find that there is one missing, then please let our Helpdesk know.
The next mandatory section there is, ‘is the client of Aboriginal or Torres Strait Islander origin?’ And so we would make a selection based on how the client self-identifies. In this case it's No. Then we have the question regarding the Disability status of the client and again, how they are self-identifying. Definitions of Disability, impairments or conditions can be found in the Protocols so it is very good to actually have a review of that because there are some that we may think should be under this particular heading but it isn’t. So in this case with Samuel, he has self-identified as not having a disability, impairment or conditions so we select Next.
We are now at the Add a client review stage and this gives us an opportunity to just review the information that we have entered and then check if we do need to make any amendments, maybe we have made an error typing something in, maybe I've
Data Exchange 101 – Webinar transcript 9
spelt the name wrong or we've added something in error, so we can go actually go Back to correct that or if that record does not need to be entered then we would Cancel, but in this case everything is good so we will select Submit.
So we get the Add a client – Finish screen, straight away we can see the task bar that it is completed and we get a Client successfully added message. Now if there was an issue with it being saved, a message would come up here with what information we need, especially if new need to put extended data in for those particular programs that require more specific data to be entered in to and we can see that all that information is there.
We will also notice that there is a banner for the Partnership Approach. So if we select this Extended Demographics, and we will just go into this page and this is the Extended Demographics that talked about the Homeless indicator right through to Ancestry. So with this particular program, we do actually want to know the Household composition of Samuel and we would make our selection based on the choices there, and we save that. We can see that that has been successfully saved so if we go back to the Home page and we find out client, we can see Samuel's record has been created. The system has automatically given him a Client ID so we can note that down and is something that we can search on in the future if we needed to find a client we could use the client ID number field in here and do a search that way.
Okay the next step would be to attach Samuel to a case, so we are going to create a case. So we will use the 'I want to…' fields here of Add a case. Okay and you will notice here that we have got a Case ID, it is not mandatory so we can add a case ID in here, but please again no personal information such as a name or CRN number or anything that can identify the client due to privacy. So we will put in here a case ID and we are going to call this one Tuesday group and it is something that will be relevant to the program that you're delivering. Again, naming protocols and naming conventions can be found in Appendix B of the Protocol document. We are then going to select the outlet that this case is being delivered from so the outlet is the physical location that this is being delivered from. So in this particular instance it is going to be Sydney. We then select the Program activity and this is Problem Gambling. Now if this was a group session or maybe a community event, this is where we would add in a total number of unidentified clients associated with the case. It is not a mandatory field, so we can leave it as zero as it is not going to be a community event. We then select Next, so Tuesday group already exists, so we will actually change that and we will make that Tuesday Group 2.
Okay so the next step of Add a case is to attach the clients that are going to be part of that Tuesday Group 2 case. So we know that we are going to have Samuel, we've got Jessica, Jack and Bradley, so we've got those people are going to be involved in this case. So we would check their names there, Attach selected client, so they are the clients attached to the case and then we would select Next.
We then come to the Add a case –Review screen and this gives us an opportunity to have a look and say yep this is right, we've got this named correctly, we've got this amount of people attached to the case. If there is an issue, if we've missed someone, we can go back and select the other person/people involved, we can remove people or we can cancel out of it and not create the case at all, but in this instance, everything is fine and we are going to press Submit. Ok and again, we've got here the status bar is all finished, we've got that the successful creation message that it has been successfully added. It is giving us the message that a session must be added for clients to be added in reports. So again emphasising that clients and cases will only appear in your report if there is a session attached to it. We also have the Partnership Approach banner and the Referral source and reasons. So you would go into there if you are in the Partnership Approach and select the relevant items.
Everything is okay, so what we can do, is we can either, at the bottom of this page under the 'What can you do now?' heading there is a Add a session to this case hyperlink or we can go via that right hand side 'I want to..' so what we might do is scroll down and enter it by this way. So this is where we can add a session. We cannot add a session that hasn’t occurred yet, so any sessions for a future date, we cannot add. So it is any sessions that occur today or in a past date, but it needs to be within the reporting period. So we are going to add our session date, so we click on the calendar selection there and this session, because it is a Tuesday group, occurred on the 30th and the service type is an Intake/assessment, so we would select from the list that is involved and these are the service types that are related to that particular program. We haven’t got any unidentified clients attending this session because we know who all those clients are. And, this is for an interpreter, if we've got an interpreter present, we would select Yes or No, so this would include AUSLAN, if someone does have an interpreter present that does AUSLAN we would select Yes. But in this case, in this particular instance it is No so we will just leave that blank anyway as it is not mandatory, so we'll go Next.
We then come to the Add a session – Clients/support persons attended. We can go through and add our clients; we also have the option of attaching a particular person who is going to attend as a support person. These support people though will not be included in reports but they're actually providing assistance for the client there. In this session, even though we have got four people associated with this case, only three of them attended this session. Jack, Jessica and Samuel and we are going to select Attach selected clients. Again if we have made an error or we need to make an adjustment, we can select the Back button, or if no, it wasn’t Jessica that attended we can check Jessica, remove selected clients and select the correct person. So we will press Next.
We are now at the Review screen. So again we are just checking our information, everything looks correct so we are going to select Submit. Ok and here we have the review (Finish) screen again status bar showing that the process has been complete and that the session has been successfully added. We do have the banner here for SCORE for Partnership Approach, for Referrals to
Data Exchange 101 – Webinar transcript 10
other services or for SCORE and we've got also the clients that attended this session. What we might do just quickly is have a look at a SCORE assessment. So we will go in and Add a client SCORE. We select then the client, and we are selecting the Assessment phase. So this is the first session that Samuel has attended so we are going to give him a pre SCORE and we are going to have a look at then his Circumstances as the domain that we want to record the SCORE against. So when we do the post SCORE it will be against that same Assessment type. So we select Show Domains and it will then bring up the intended outcomes and the Likert scale here. So if you do need definitions for this client's Circumstances SCORE you would select this hyperlink and that will take you to a definitions box. Okay so we are looking at which one will best suit Samuel, so he is attending a Problem Gambling session so it is to do with Money Management at the moment this is having a negative impact on his life. So through the assessments that we have made on him through conversation or if it's the assessment tool that we have used or whether it's some sort of intake survey that we have used, we are going to list it as that SCORE and then we go Save and there we can see the Client SCORE there.
Now let's just say that the course has progressed so it has been six weeks and we are now going to do a post SCORE on Samuel because the program has finished. We will go back in and find his records and Add a SCORE. We are selecting Samuel again. The Assessment phase this time will be post as it is either during him attending this program or it is at the end of him accessing the service with us and we select the Assessment type – the same that we had as the pre and we have Show domains. You may recall that it was Money Management and it was at a 1 and so we are going to say now that after 6 weeks of attending our services, there has been improvement through the feedback that we have received through him (Samuel), through the surveys that we have undertaken with him, and we can select the SCORE there and we select Save. So it could be that that Samuel is also attending with this organisation, other different programs so we could do SCORE for that as well. So just very easily you can see how SCORE assessments can be recorded.
So what we are going to do is we will go to the home page because we would like to do is show you how to record another session for this particular case.
So we will go to the Find a Case section, now we can either search for our case using the case ID name, which is Tuesday Group 2, and there it is there, and there are the four people associated with it. So there are two different ways that we can add a session. We can select the Add a Session button, or we can copy a session. This is a really useful tool, because if we are going to have the same group of people related to this case, then we can just Copy the session and it will be a different date that we enter. So we will do Copy a session, we are going to select the date that he is attending, we are not doing intake or assessment, we are doing some education and skills training, so we are changing the particular service type, we are not changing zero, because we know who is attending, and we have got no interpreter present. We go Next, we’ve got Jack, he hasn’t attended the session there, these ones have attended. We are going to remove Jessica, because Jessica didn’t attend this particular session, so notice that her name jumps up to that top section of people who have attended previously but they didn’t attend this session. Go Next and review that screen, and Submit. Here we have the finished screen, the status showing it is complete, the session has been successfully added, and we’ve got the clients that have attended the session. We can then go in and continue to add more clients, more sessions, and cases, whatever the need may be. That is the end of the demonstration of the web-based portal for those of you that are going to be entering your data manually. Again, there is user support with task cards and e-Learning modules available on our website. Don’t forget you have got the Protocols document that will give you definitions for disability statuses and cases and sessions, and everything else like that. We’ve got the Appendix B that gives you naming conventions for your particular program, if there are any, and we’ve also got the translation matrix if you are using a clinical assessment tool that you need to convert into SCORE.
Now I would like to show you where some of those items are on our website. To access the website, in your search bar type DEX DSS, and that will display for you. On the website, you’ve got the Training Resources tab, where all the task cards and e-Learning modules are housed. IT Access tab which has information for system-to-system transfer, Bulk upload, and those documents about frequently asked questions, and upload errors and explanations. Policy Guidance tab has the Framework but also the Protocols document. For those of you in the Partnership Approach and will have access to those reports, there are also some Qlik support material for Partnership Approach reports here under the Self-Service Reports tab. Going back to the homepage, to register for training and webinars, select the Find Training tab, the button on the right-hand side.
Before we close-off for today, we might have a look at some of the questions. There was a question about group clients, and how they show on your reports. They are actually the unidentified clients, so clients that have maybe attended a community event, such as a community barbeque or a Harmony day. But if you are getting a high ratio of those group clients showing on your report and you shouldn’t be for your program, it is a good indication for you to maybe review process and see how you can improve your data quality. In regards to the Partnership Approach, that is voluntary but again we do encourage organisations to opt-in, because then you get availability to those beautiful suite of reports that are very interactive and dynamic, and can really provide added boost to your business. With those, you may decide at the moment that you don’t want to participate in the Partnership Approach, and that is fine, but you can maybe go through and start making those selections of those particular data items that might be relevant to you, then, you could contact your Grant Agreement Manager and discuss that with them. All they need to do then is to make a change in your grant agreement as a ‘notice of change’ and they can email that to you and you may decide in six months’ time to do that, then you’ve already got that data source there waiting for you because you have started to capture it.
Data Exchange 101 – Webinar transcript 11
I would like to thank everyone for their attendance today, if there is any further assistance that is required by you, then you have got information here about our email address for the helpdesk. You can also subscribe to receive alerts when new information is made available and that is on the Data Exchange website, there is a ‘subscribe’ button on the right-hand side. It has been wonderful having you with us today and thank you for all of your questions. Again, if you have got any other questions that haven’t been answered or you would like some assistance, please email our mailbox and we will be happy to respond. We look forward to having you with us next time.
Data Exchange 101 – Webinar transcript 12