Embed Size (px)
Citation preview
Data Exploration with GIS Viewsheds and Social Network Analysis
Giles Oatley∗1, Tom Crick†1 and Ray Howell‡2
1Department of Computing, Cardiff Metropolitan University, UK2Faculty of Business and Society, University of South Wales, UK
Summary
We present a novel exploratory method combining line of sight visibility (viewshed analysis)and techniques from social network analysis to investigate archaeological data. At increasing
distances different nodes are connected creating a set of networks, which are subsequentlydescribed using centrality measures and clustering coefficients. Networks with significant
properties are examined in more detail. We use this method to investigate the placement ofhillforts (nodes) in the Gwent region of south-east Wales, UK. We are able to determine
distances that support significant transitions in network structure that could have significantarchaeological validity.
KEYWORDS: Geographic networks, archaeological nodes, viewshed analysis, data mining,social network analysis
Extended Abstract
We present a novel exploratory method that combines line of sight visibility (viewshed analysis)with techniques from social network analysis to investigate archaeological data. Within data miningexist the fields of graph-based and spatial-based data mining. Graph-based data mining (Cook andHolder, 2006) has a close cousin in the long established field of social network analysis, a setof metrics that operates over graphs (networks) created from links (Wasserman and Faust, 1995).Metrics include those to find clusters within networks, to find points that have significant properties,for instance how central a point is. Spatial data mining likewise has an extensive history (Lu et al.,1993), and is the discovery of interesting patterns from spatial datasets.
At increasing distances different nodes are connected creating a set of networks, which are subse-quently described using centrality measures and clustering coefficients. Networks with significantproperties are examined in more detail. We use this method to investigate the placement of hillforts(nodes) in the Gwent region of south-east Wales, UK. Our methodology is applied to the area of
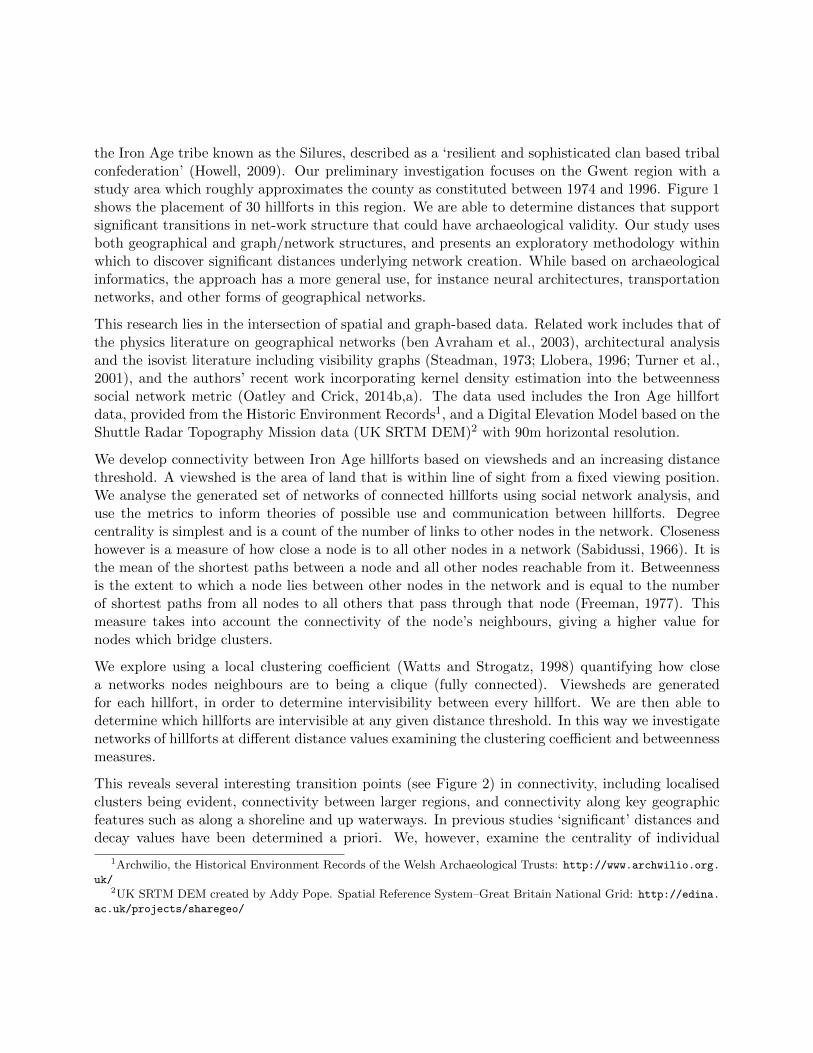
the Iron Age tribe known as the Silures, described as a ‘resilient and sophisticated clan based tribalconfederation’ (Howell, 2009). Our preliminary investigation focuses on the Gwent region with astudy area which roughly approximates the county as constituted between 1974 and 1996. Figure 1shows the placement of 30 hillforts in this region. We are able to determine distances that supportsignificant transitions in net-work structure that could have archaeological validity. Our study usesboth geographical and graph/network structures, and presents an exploratory methodology withinwhich to discover significant distances underlying network creation. While based on archaeologicalinformatics, the approach has a more general use, for instance neural architectures, transportationnetworks, and other forms of geographical networks.
This research lies in the intersection of spatial and graph-based data. Related work includes that ofthe physics literature on geographical networks (ben Avraham et al., 2003), architectural analysisand the isovist literature including visibility graphs (Steadman, 1973; Llobera, 1996; Turner et al.,2001), and the authors’ recent work incorporating kernel density estimation into the betweennesssocial network metric (Oatley and Crick, 2014b,a). The data used includes the Iron Age hillfortdata, provided from the Historic Environment Records1, and a Digital Elevation Model based on theShuttle Radar Topography Mission data (UK SRTM DEM)2 with 90m horizontal resolution.
We develop connectivity between Iron Age hillforts based on viewsheds and an increasing distancethreshold. A viewshed is the area of land that is within line of sight from a fixed viewing position.We analyse the generated set of networks of connected hillforts using social network analysis, anduse the metrics to inform theories of possible use and communication between hillforts. Degreecentrality is simplest and is a count of the number of links to other nodes in the network. Closenesshowever is a measure of how close a node is to all other nodes in a network (Sabidussi, 1966). It isthe mean of the shortest paths between a node and all other nodes reachable from it. Betweennessis the extent to which a node lies between other nodes in the network and is equal to the numberof shortest paths from all nodes to all others that pass through that node (Freeman, 1977). Thismeasure takes into account the connectivity of the node’s neighbours, giving a higher value fornodes which bridge clusters.
We explore using a local clustering coefficient (Watts and Strogatz, 1998) quantifying how closea networks nodes neighbours are to being a clique (fully connected). Viewsheds are generatedfor each hillfort, in order to determine intervisibility between every hillfort. We are then able todetermine which hillforts are intervisible at any given distance threshold. In this way we investigatenetworks of hillforts at different distance values examining the clustering coefficient and betweennessmeasures.
This reveals several interesting transition points (see Figure 2) in connectivity, including localisedclusters being evident, connectivity between larger regions, and connectivity along key geographicfeatures such as along a shoreline and up waterways. In previous studies ‘significant’ distances anddecay values have been determined a priori. We, however, examine the centrality of individual
1Archwilio, the Historical Environment Records of the Welsh Archaeological Trusts: http://www.archwilio.org.uk/
2UK SRTM DEM created by Addy Pope. Spatial Reference System–Great Britain National Grid: http://edina.
ac.uk/projects/sharegeo/
Figure 1: Hillforts in south-east Wales. Hillforts are displayed as white crosses on the front contourdisplay. The same terrain and hillforts (white circles) are displayed behind on a Digital ElevationModel (DEM). The DEM display shows that there are many other sites that could have been usedfor placement of hillforts.
nodes (hillforts) in these networks with the most significant values. We are interested in discover-ing interesting patterns and clusters and then investigating them a posteriori for (archaeological)validity. Among preliminary conclusions arising from this first phase of investigation is that themethodology employed can effectively inform our understanding of Iron Age social structures. Forexample, viewshed analysis confirms hypothesised clan-based clustering of hillforts in the regionwith extensive line of sight communication, not only within clusters, but also with other hillfortgroupings. The model of a clan-based confederation with regional emphasis, and possibly variation,but with wider connectivity sufficient to allow the cohesion necessary to have resisted the Romanadvance so effectively seems wholly appropriate. Future work will utilise fuzzy viewsheds instead ofthe standard binary viewshed, with distance decay functions based on the limits of normal humanvision and such features as the size of people, livestock, distances that smoke plumes can be seenand so on. We will also consider the integration of least-cost paths in landscapes.
Biography
Dr Giles Oatley is a Reader in Intelligent Systems at Cardiff Metropolitan University. He hasdeveloped decision support systems based on behavioural models from data mining, primarily for UKpolice forces, supported by the EPSRC, Home Office, HEFCE, Nuffield Foundation, and DTI. He hasa broad interest in anthropology and psychology, especially mindfulness and psychoanalysis.
Dr Tom Crick is a Senior Lecturer in Computing Science at Cardiff Metropolitan University. His
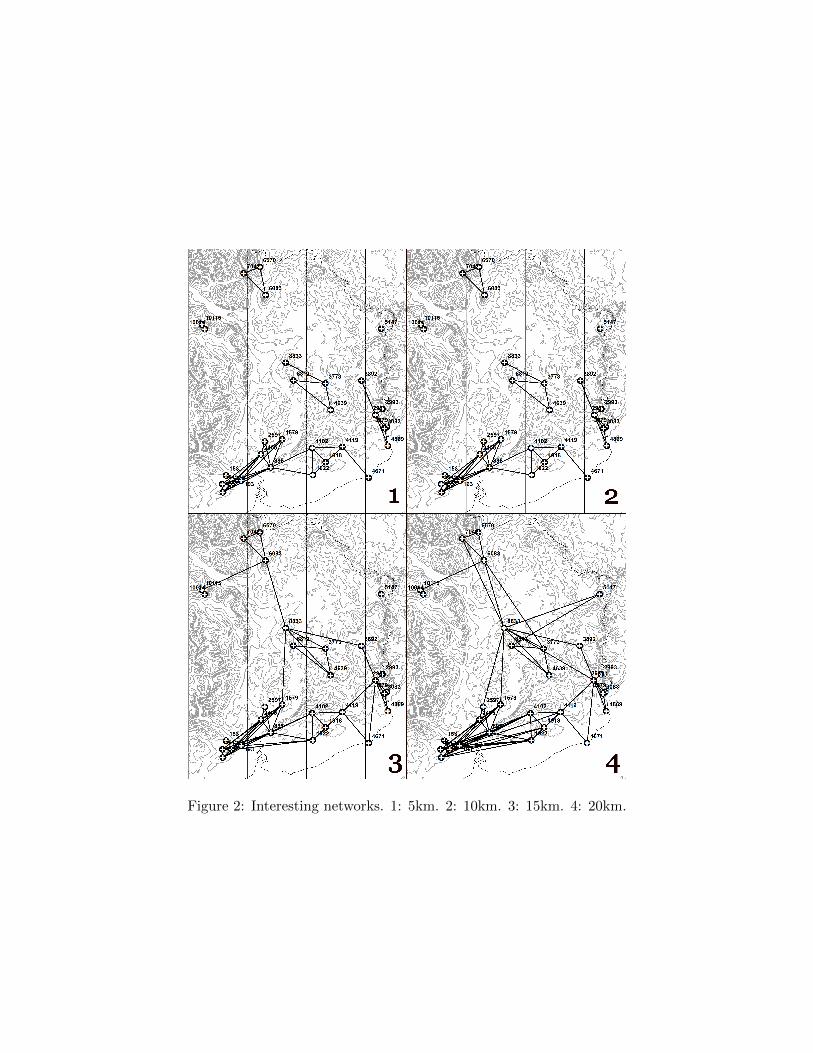
Figure 2: Interesting networks. 1: 5km. 2: 10km. 3: 15km. 4: 20km.
research is naturally interdisciplinary: optimisation, intelligent systems, data science and analytics,high performance computing and reproducibility. He is the Nesta Data Science Fellow, a 2014 Fellowof the Software Sustainability Institute and a member of HiPEAC , the European FP7 Network ofExcellence on High Performance and Embedded Architecture and Compilation.
Professor Ray Howell is Professor of Welsh Antiquity and Director of the South Wales Centrefor Historical and Interdisciplinary Research at the University of South Wales. He is a Fellow ofthe Society of Antiquaries of London. He is also Chairman of the Glamorgan Gwent ArchaeologicalTrust and the Glamorgan Gwent Historic Environment Record Charitable Trust.
References
ben Avraham, D., Rozenfeld, A. F., Cohen, R., and Havlin, S. (2003). Geographical embedding ofscale-free networks. Physica A, 330(1-2):107–116.
Cook, D. J. and Holder, L. B. (2006). Mining Graph Data. Wiley.
Freeman, L. C. (1977). A set of measures of centrality based on betweenness. Sociometry, 40(1):35–41.
Howell, R. (2009). Searching for the Silures: The Iron Age in South-East Wales. The History Press.
Llobera, M. (1996). Exploring the topography of mind: Gis, social space and archaeology. Antiquity,70(269):612–622.
Lu, W., Han, J., and Ooi, B. (1993). Discovery of General Knowledge in Large Spatial Databases.In Proceedings of the Far East Workshop on GIS (IEGIS’93), pages 275–289.
Oatley, G. and Crick, T. (2014a). Exploring UK Crime Networks. In 2014 International Symposiumon Foundations of Open Source Intelligence and Security Informatics (FOSINT-SI 2014). IEEEPress.
Oatley, G. and Crick, T. (2014b). Measuring UK Crime Gangs. In 2014 IEEE/ACM InternationalConference on Advances in Social Networks Analysis and Mining (ASONAM 2014). IEEE Press.
Sabidussi, G. (1966). The centrality index of a graph. Psychometrika, 31(4):581–603.
Steadman, P. (1973). Graph-theoretic representation of architectural arrangement. ArchitecturalResearch and Teaching, 2(3):161–172.
Turner, A., Doxa, M., O’Sullivan, D., and Penn, A. (2001). From isovists to visibility graphs: Amethodology for the analysis of architectural space. Environment and Planning B: Planning andDesign, 28(1):103–121.
Wasserman, S. and Faust, K. (1995). Social Network Analysis: Methods and Applications. Cam-bridge University Press.
Watts, D. J. and Strogatz, S. H. (1998). Collective dynamics of ‘small-world’ networks. Nature,393:440–442.