Embed Size (px)
Citation preview

Chapter 7Chapter 7
Data Extraction CookbookData Extraction Cookbook
Linda TaylorMinnesota Dept. of Transportation
Data Extraction Cookbook
External Customers Have Access to:
• System Data • Internal Tools &
Programs• Database
Information • System Resource
Materials
Data Extraction Workstation
The Workstation is Located at the Water’s Edge Facility in theTraffic Engineering Office on the 2nd Floor Behind the Secretary’s Station
Contact Person For Access: Kevin [email protected]
Data Extraction CookbookUser Requirements
• Register at the Front Desk• Data Pulls Conducted During Off-Peak
Periods• Bring CD or Floppy Disk to Store Data• Sign the Log Book in Metro Traffic • Provide Feedback
Resource Materials• Available on Website:
• All Detector Report• Stratified Zone Metering Algorithm• Ramp Metering Status• Freeway Ramp Metering Locations
Map
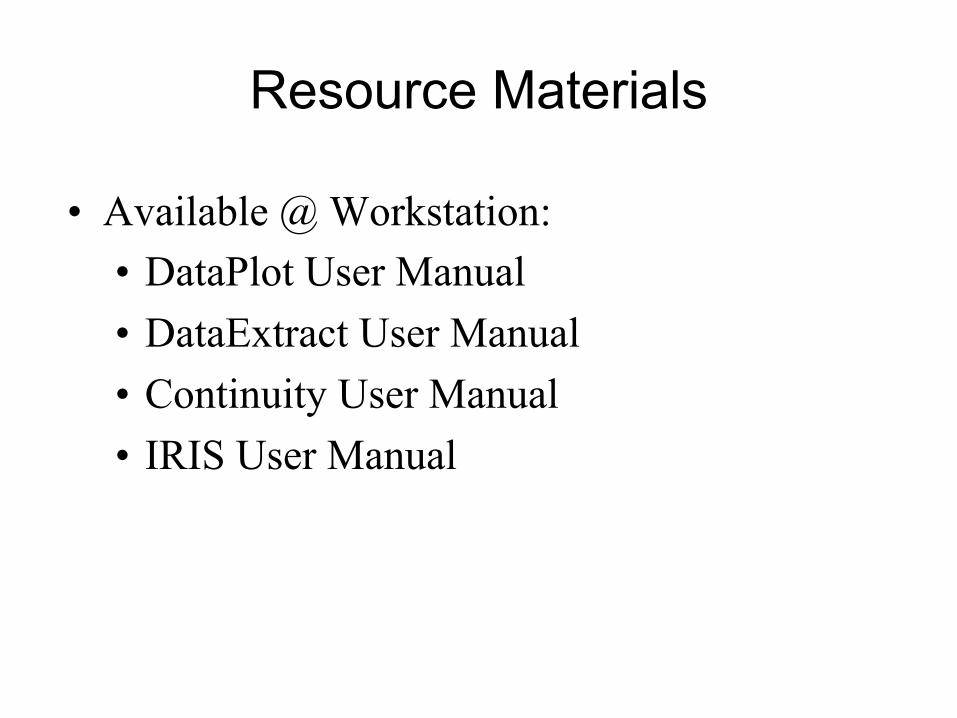
• Available @ Workstation:• DataPlot User Manual• DataExtract User Manual• Continuity User Manual• IRIS User Manual
Resource Materials
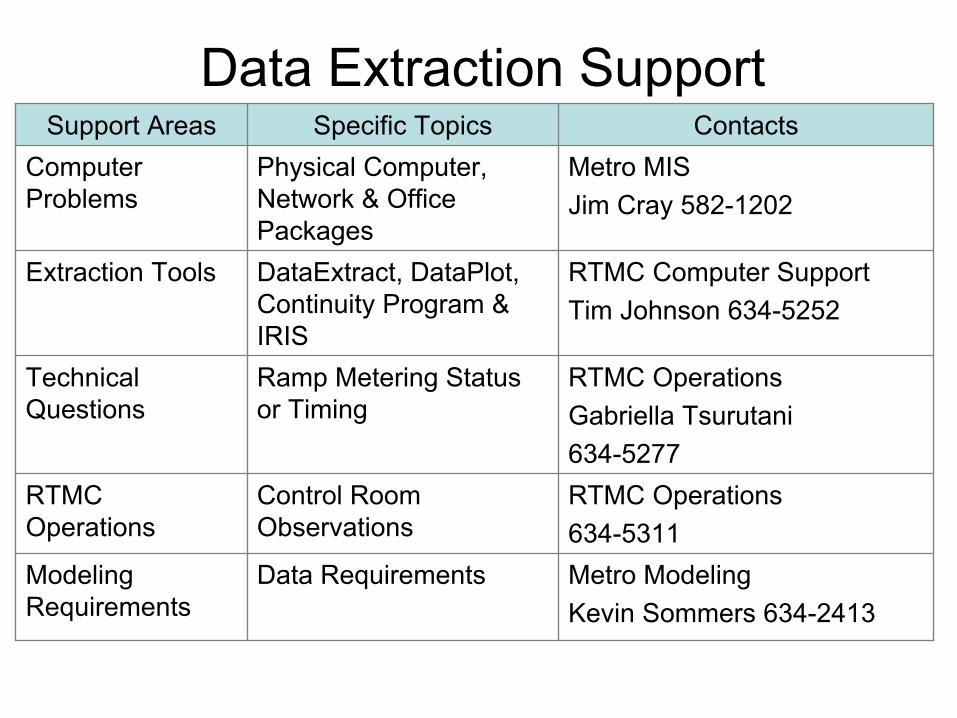
Data Extraction Support
Metro ModelingKevin Sommers 634-2413
Data RequirementsModeling Requirements
RTMC Operations634-5311
Control Room Observations
RTMC Operations
RTMC OperationsGabriella Tsurutani 634-5277
Ramp Metering Status or Timing
Technical Questions
RTMC Computer SupportTim Johnson 634-5252
DataExtract, DataPlot, Continuity Program & IRIS
Extraction Tools
Metro MIS Jim Cray 582-1202
Physical Computer, Network & Office Packages
Computer Problems
ContactsSpecific TopicsSupport Areas
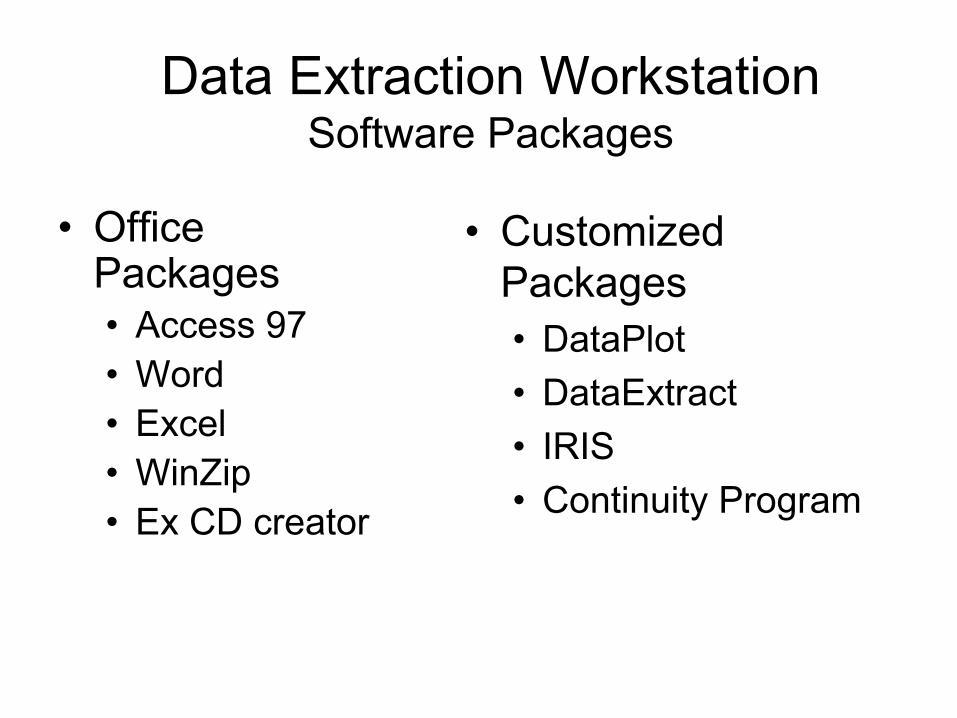
Data Extraction WorkstationSoftware Packages
• Office Packages• Access 97• Word • Excel • WinZip• Ex CD creator
• Customized Packages• DataPlot• DataExtract• IRIS• Continuity Program
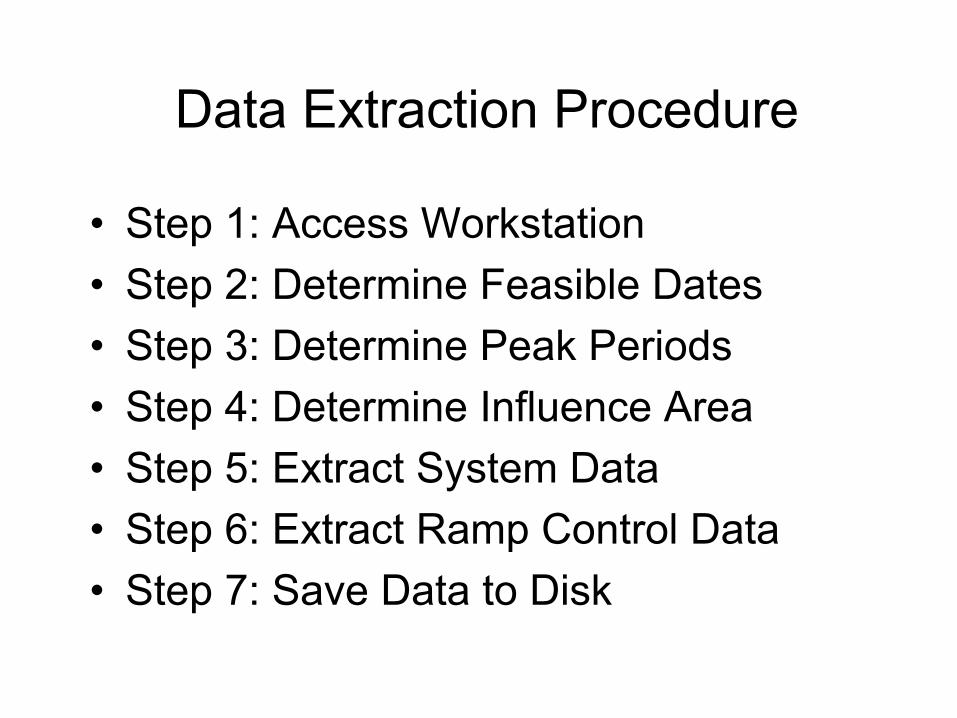
Data Extraction Procedure
• Step 1: Access Workstation • Step 2: Determine Feasible Dates• Step 3: Determine Peak Periods• Step 4: Determine Influence Area• Step 5: Extract System Data• Step 6: Extract Ramp Control Data• Step 7: Save Data to Disk
Access Workstation• Sign the Login Sheet• Computer Should be “on”
If Not Power Up Computer
• No Username or Password Required
• Use the Workstation Icons to Access Programs
Determine Feasible Dates
• September – October Timeframe• Eliminate Fridays, Weekends &
Mondays• Eliminate Holiday and Days Following a
Holiday• Eliminate Bad Weather Days• Eliminate Dates Impacted
by Incidents
Eliminate Bad Weather Days
• Log Onto the National Weather Service Website: http://www.crh.noaa.gov/mpx/mpxmoncli/
• Eliminate Dates That: • Column 7 : Precipitation .20 Inches or Greater• Column 8 : Snow • Column 16: Code Indicating Fog, Hail Etc.
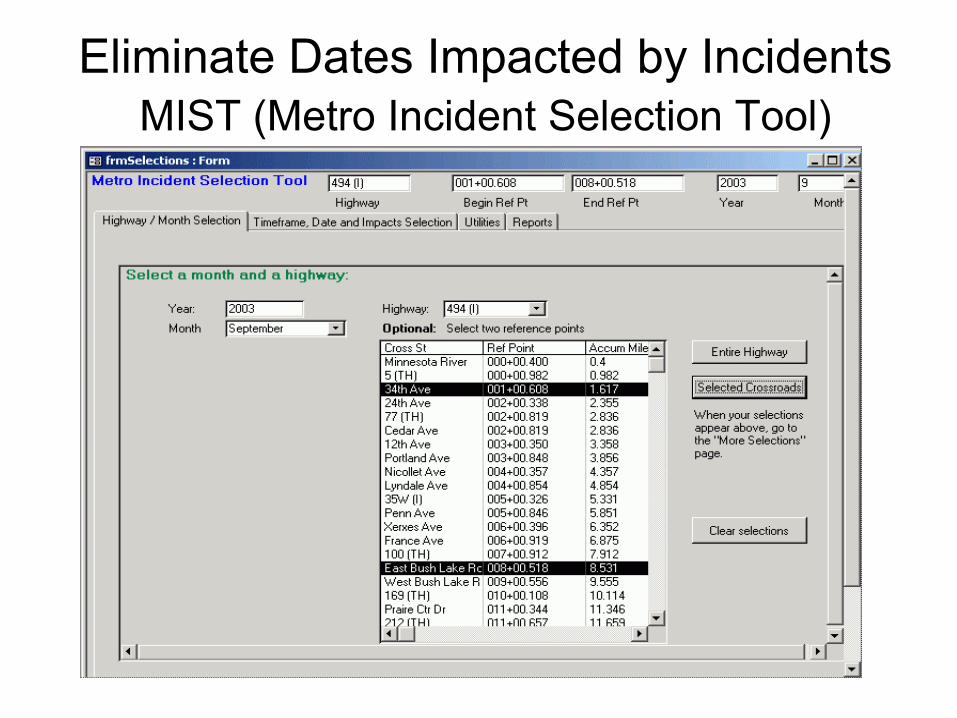
Eliminate Dates Impacted by IncidentsMIST (Metro Incident Selection Tool)
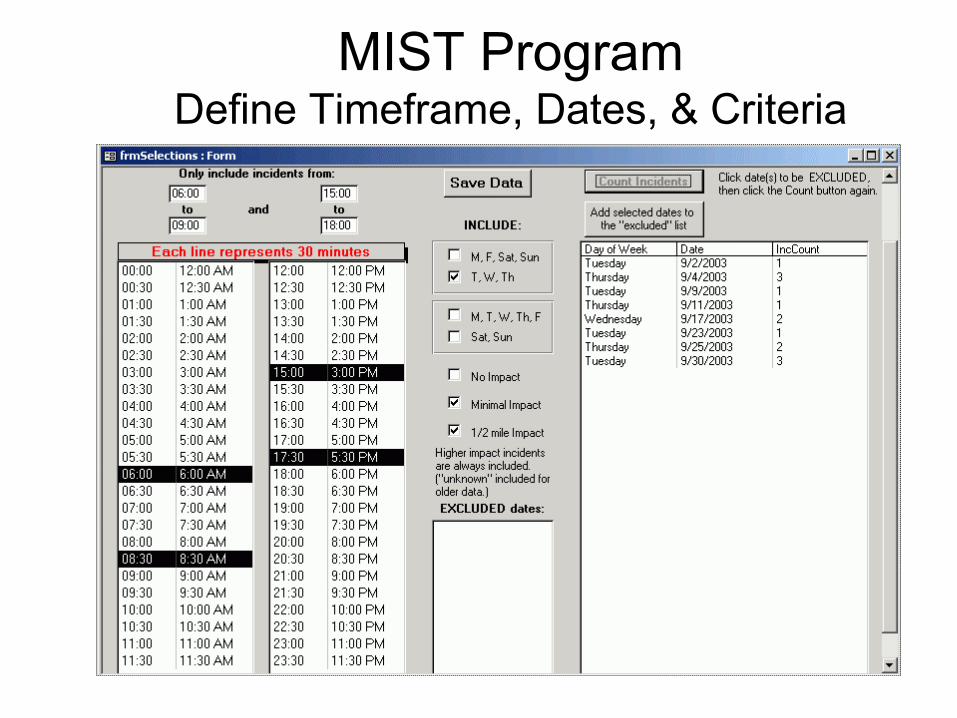
MIST ProgramDefine Timeframe, Dates, & Criteria
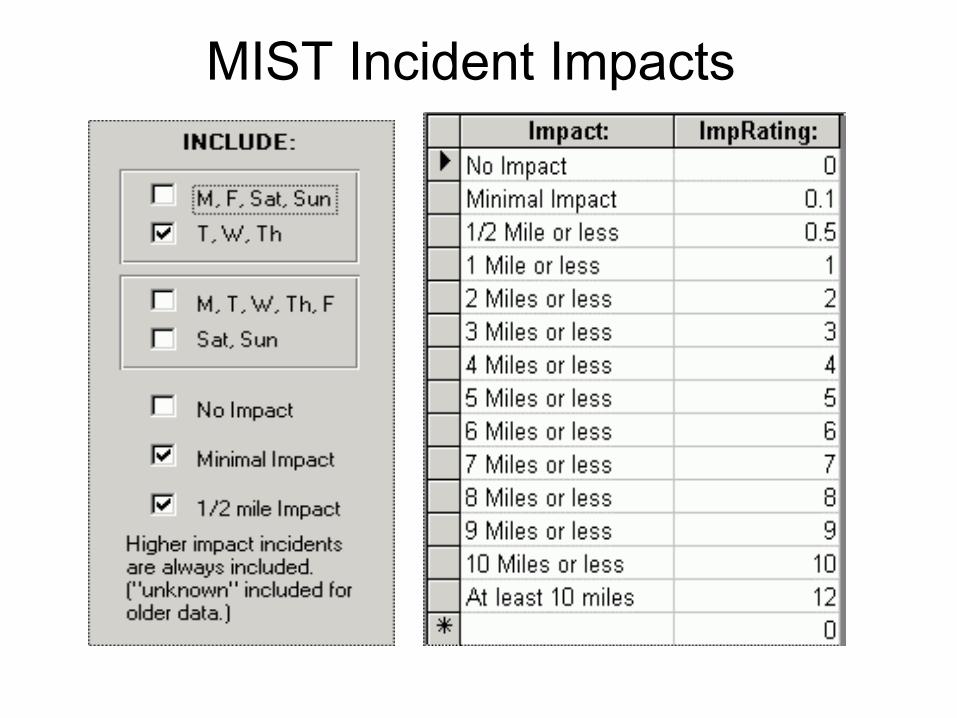
MIST Incident Impacts
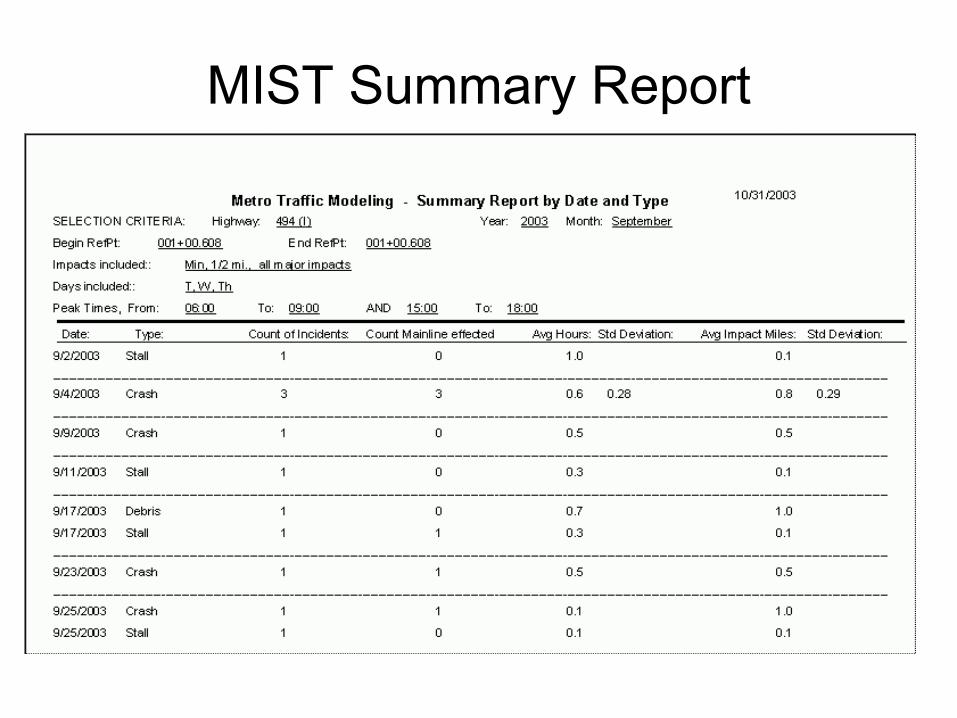
MIST Summary Report
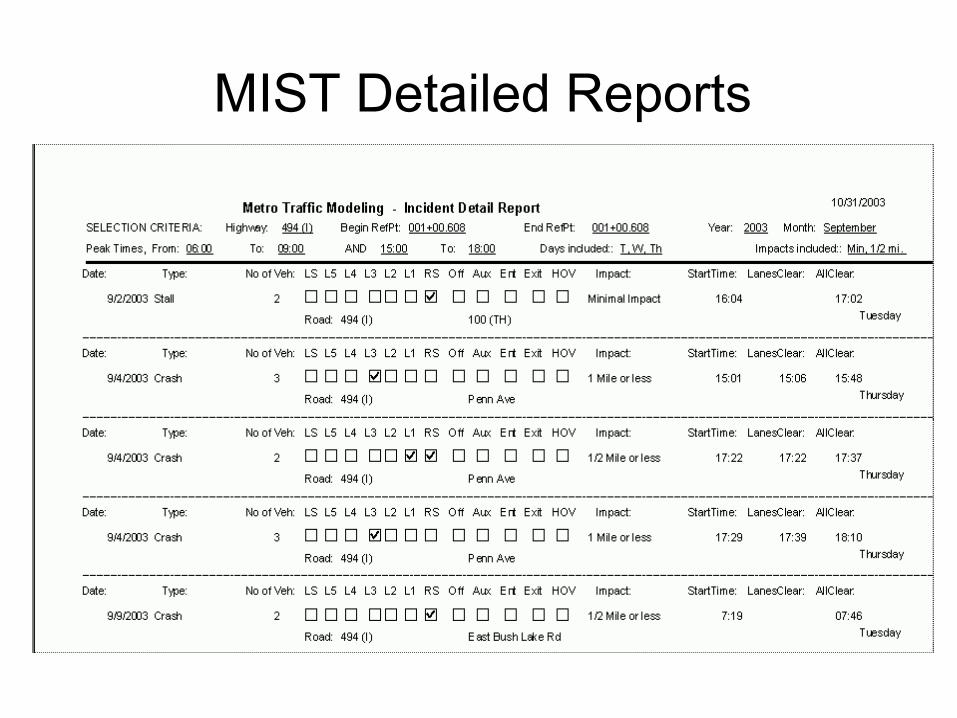
MIST Detailed Reports
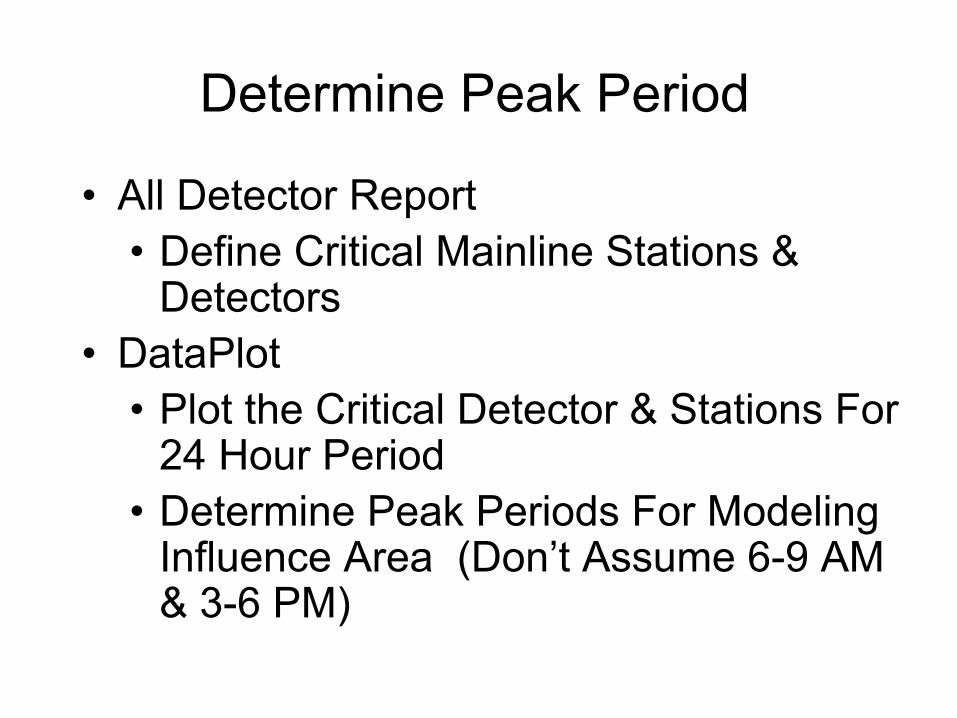
Determine Peak Period
• All Detector Report • Define Critical Mainline Stations &
Detectors• DataPlot
• Plot the Critical Detector & Stations For 24 Hour Period
• Determine Peak Periods For Modeling Influence Area (Don’t Assume 6-9 AM & 3-6 PM)
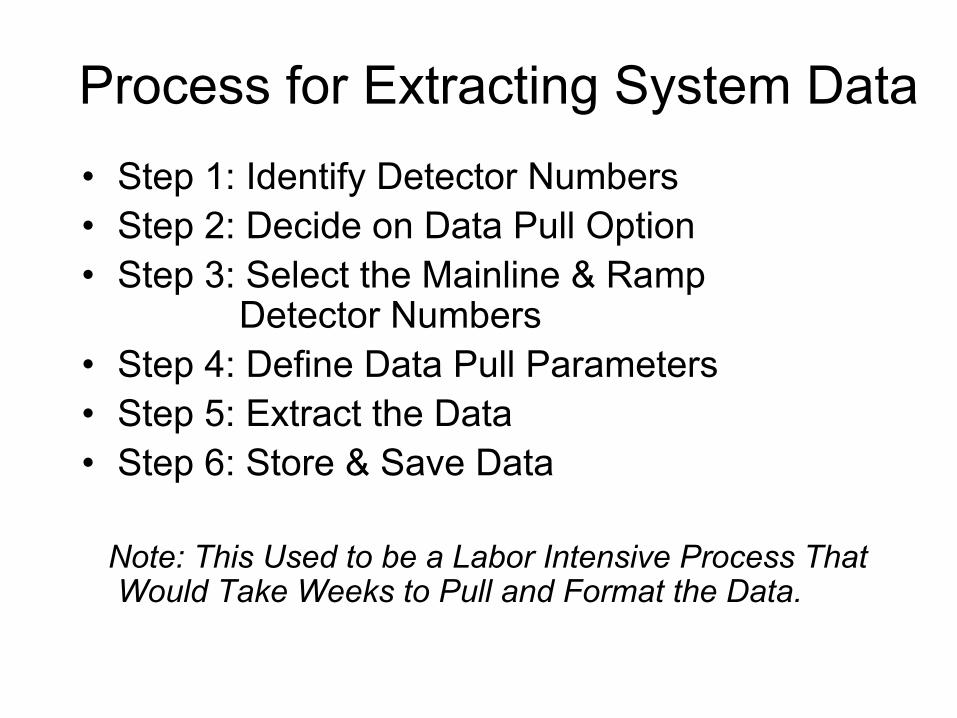
Process for Extracting System Data• Step 1: Identify Detector Numbers• Step 2: Decide on Data Pull Option• Step 3: Select the Mainline & Ramp
Detector Numbers• Step 4: Define Data Pull Parameters• Step 5: Extract the Data• Step 6: Store & Save Data
Note: This Used to be a Labor Intensive Process That Would Take Weeks to Pull and Format the Data.
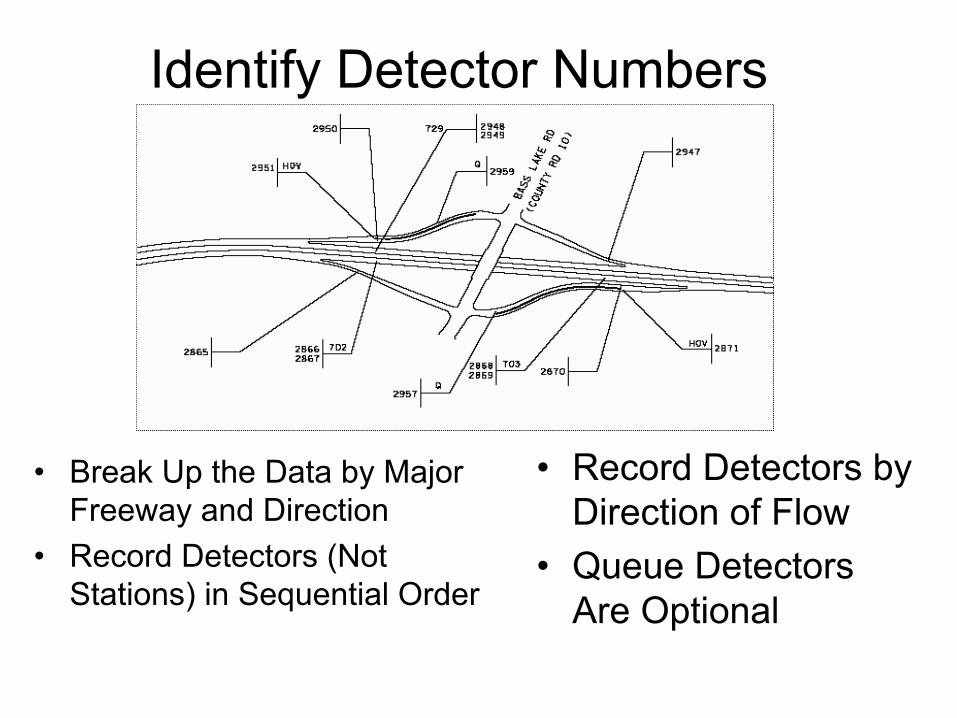
Identify Detector Numbers
• Break Up the Data by Major Freeway and Direction
• Record Detectors (Not Stations) in Sequential Order
• Record Detectors by Direction of Flow
• Queue Detectors Are Optional
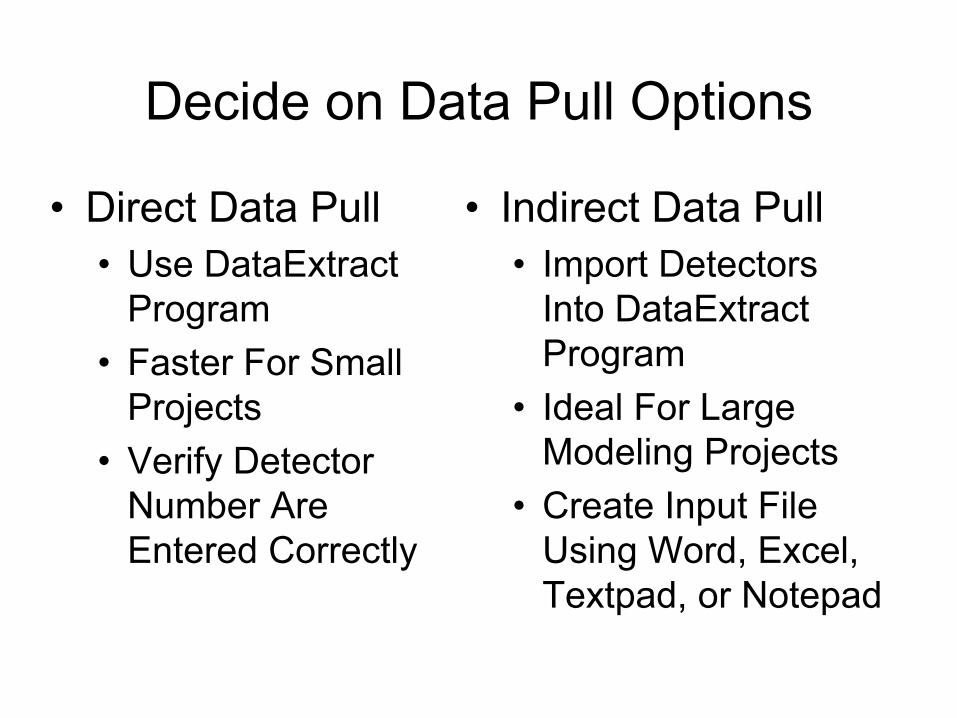
Decide on Data Pull Options
• Direct Data Pull• Use DataExtract
Program• Faster For Small
Projects• Verify Detector
Number Are Entered Correctly
• Indirect Data Pull• Import Detectors
Into DataExtract Program
• Ideal For Large Modeling Projects
• Create Input File Using Word, Excel, Textpad, or Notepad
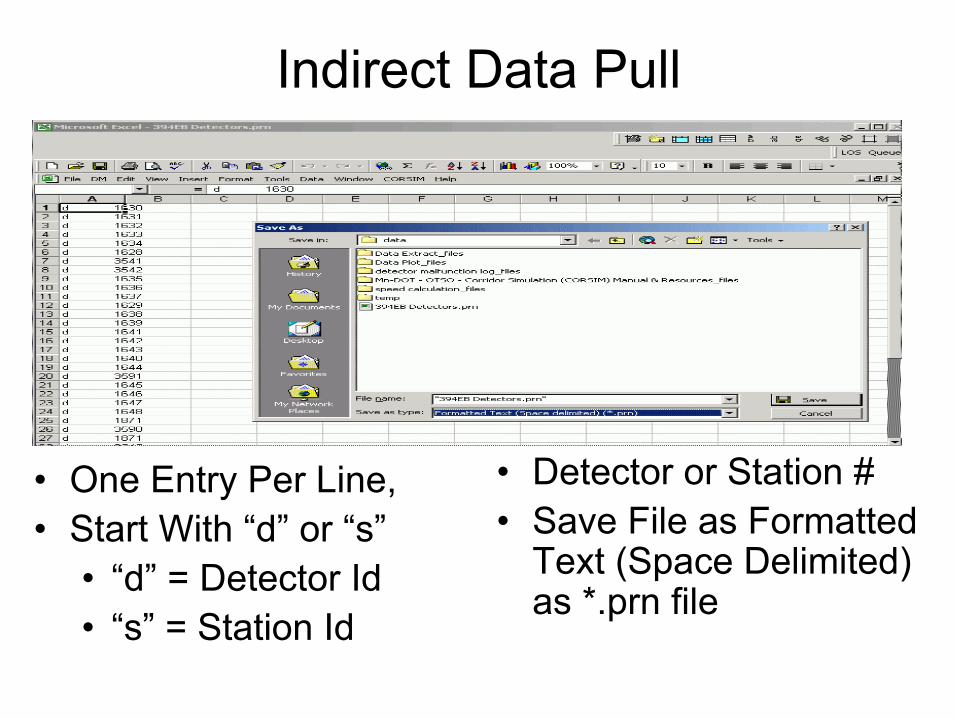
Indirect Data Pull
• One Entry Per Line,• Start With “d” or “s”
• “d” = Detector Id• “s” = Station Id
• Detector or Station #• Save File as Formatted
Text (Space Delimited) as *.prn file
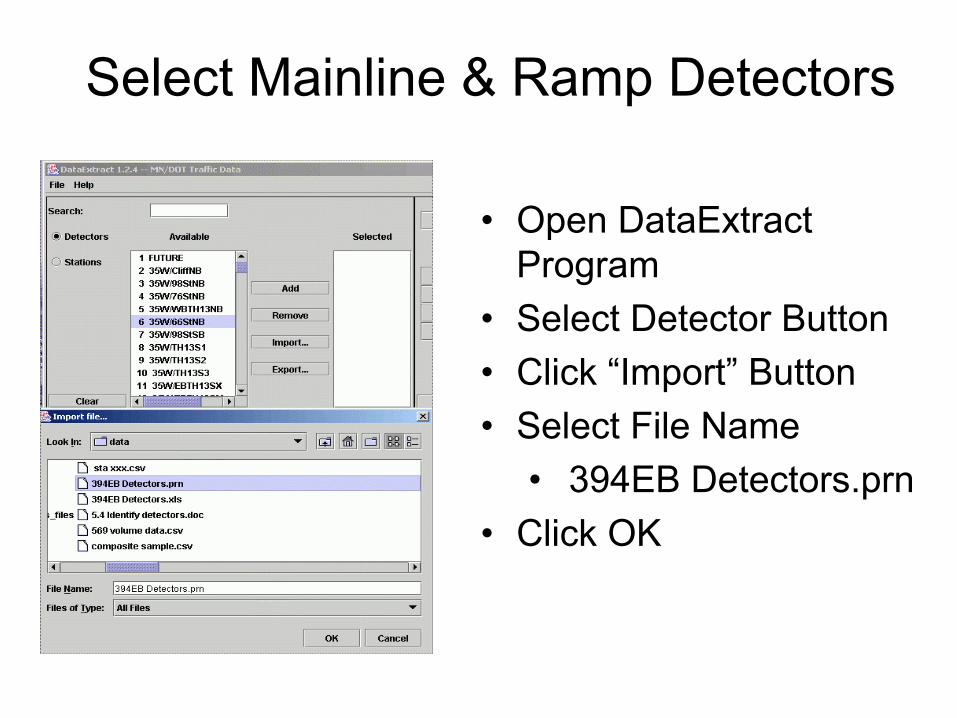
Select Mainline & Ramp Detectors
• Open DataExtract Program
• Select Detector Button• Click “Import” Button• Select File Name
• 394EB Detectors.prn• Click OK
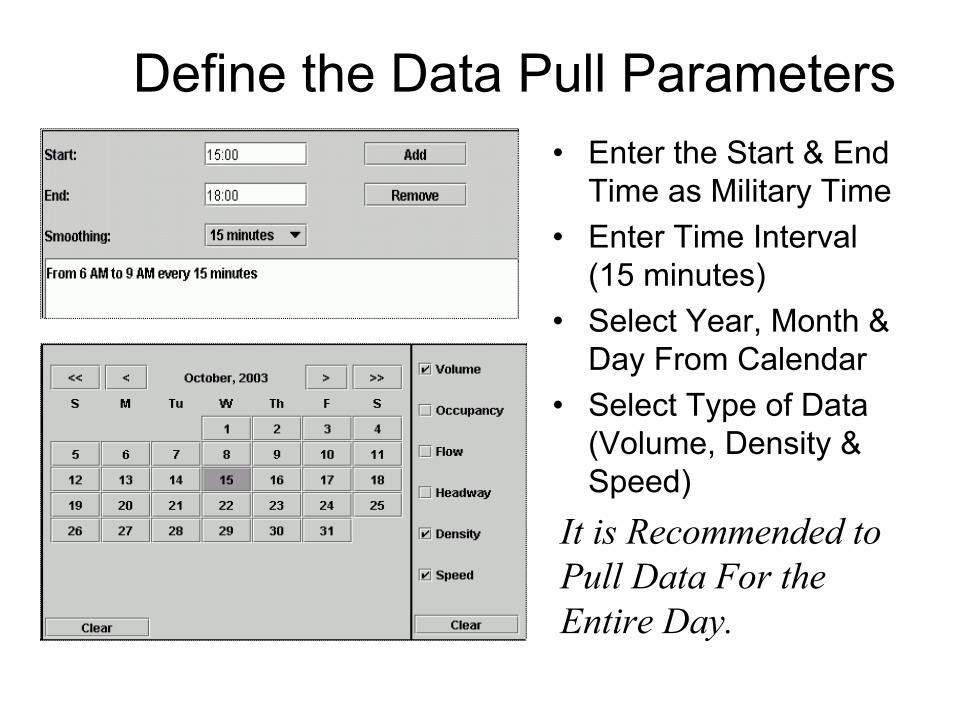
Define the Data Pull Parameters• Enter the Start & End
Time as Military Time• Enter Time Interval
(15 minutes)• Select Year, Month &
Day From Calendar• Select Type of Data
(Volume, Density & Speed)
It is Recommended to Pull Data For the Entire Day.
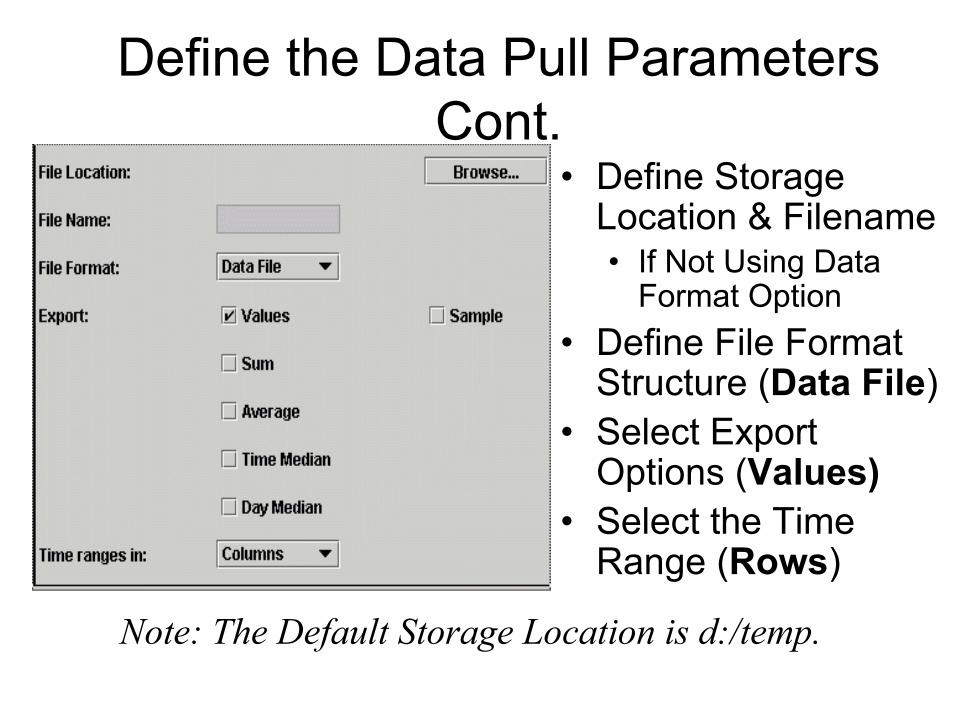
Define the Data Pull Parameters Cont.
• Define Storage Location & Filename • If Not Using Data
Format Option • Define File Format
Structure (Data File)• Select Export
Options (Values)• Select the Time
Range (Rows)
Note: The Default Storage Location is d:/temp.
Data Extraction• Verify the Data File Was Created • Make Sure the Data in the Correct Format• Rename the Default Files
• speed.csv to 394EB speed.csv• volume.csv to 394EB volume.csv• density.csv to 394EB density.csv
• Repeat Process Until All Data Has Been Collected
Reminder: The Default Files Are Over-Written With Each New Data Extraction Query
Saving Data• Remember to Rename & Save Files
After Each Data Query• Save Data to Diskette or CD • WinZip Software Program Available• Verify That All Files Have Been Copied
Operation Complete!
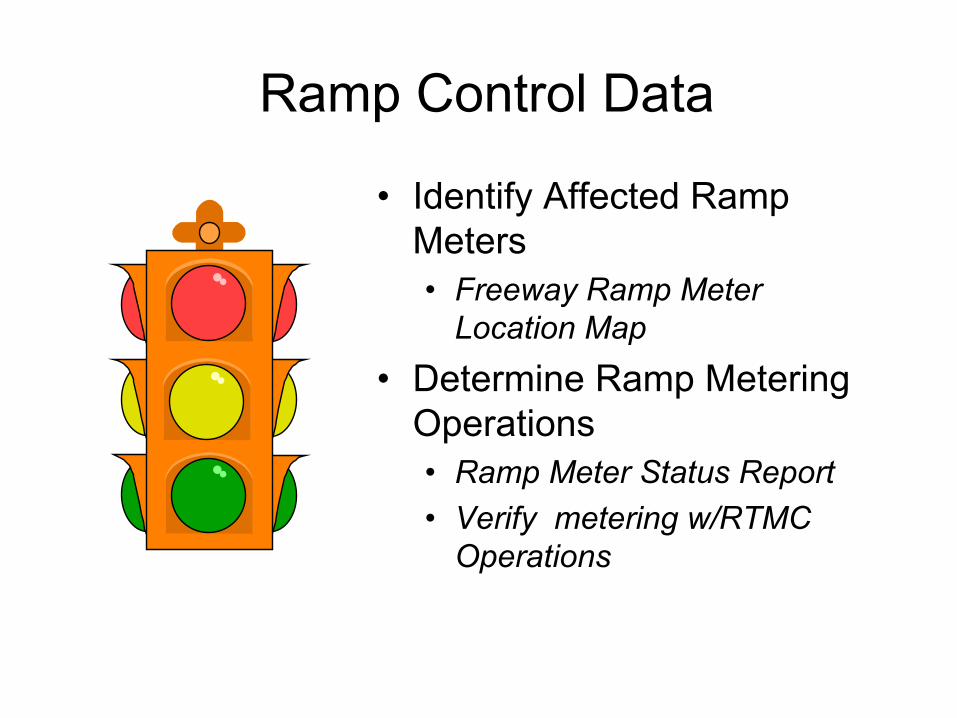
Ramp Control Data
• Identify Affected Ramp Meters • Freeway Ramp Meter
Location Map• Determine Ramp Metering
Operations • Ramp Meter Status Report• Verify metering w/RTMC
Operations
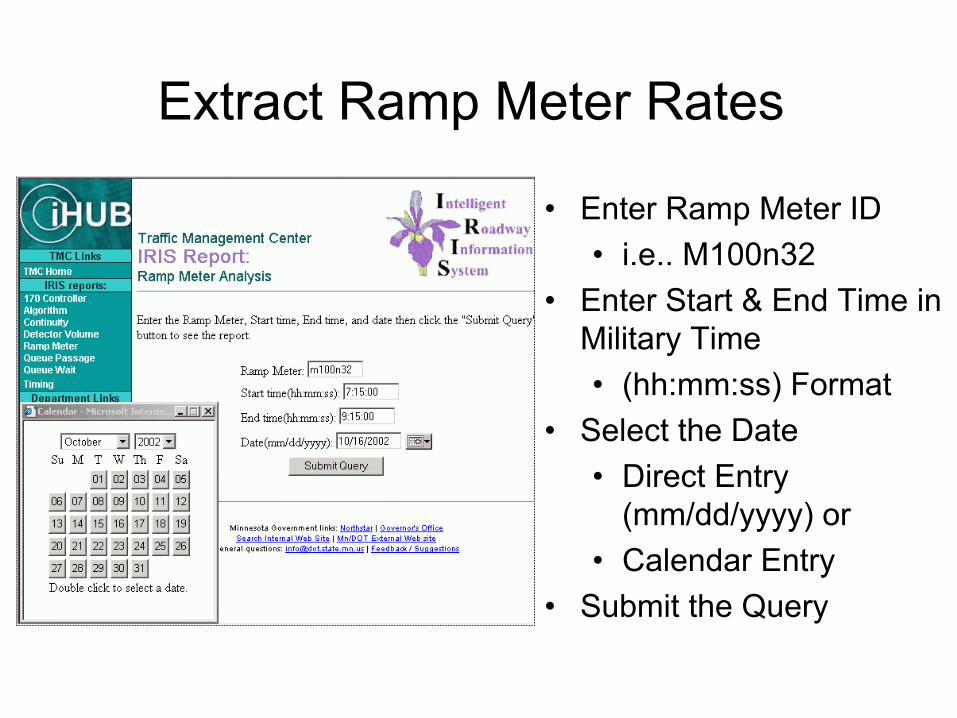
Extract Ramp Meter Rates
• Enter Ramp Meter ID• i.e.. M100n32
• Enter Start & End Time in Military Time • (hh:mm:ss) Format
• Select the Date • Direct Entry
(mm/dd/yyyy) or• Calendar Entry
• Submit the Query
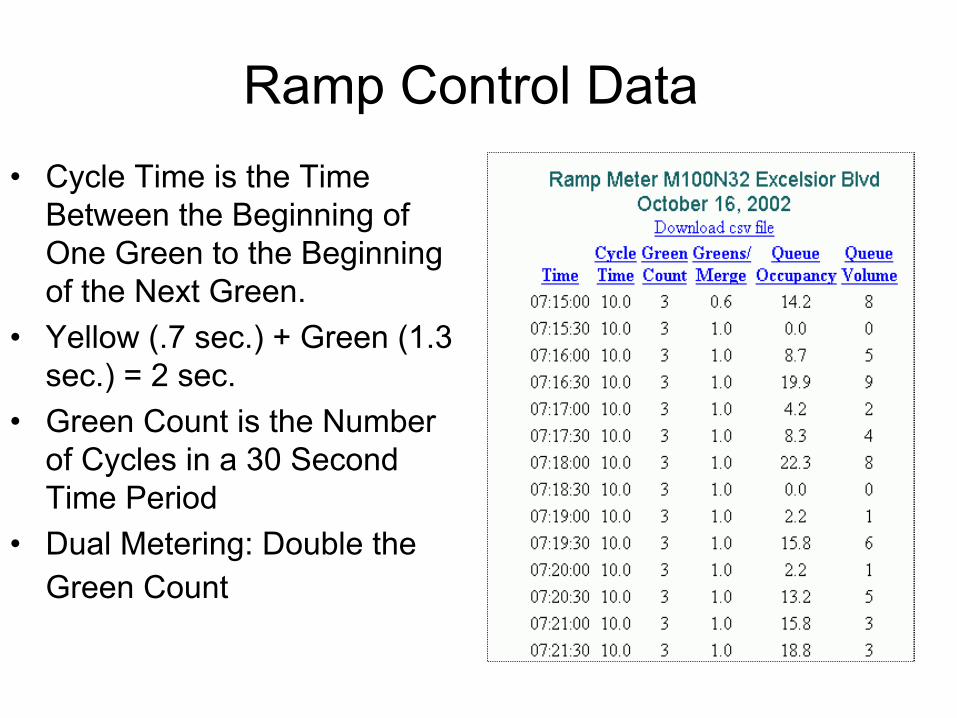
Ramp Control Data• Cycle Time is the Time
Between the Beginning of One Green to the Beginning of the Next Green.
• Yellow (.7 sec.) + Green (1.3 sec.) = 2 sec.
• Green Count is the Number of Cycles in a 30 Second Time Period
• Dual Metering: Double the Green Count
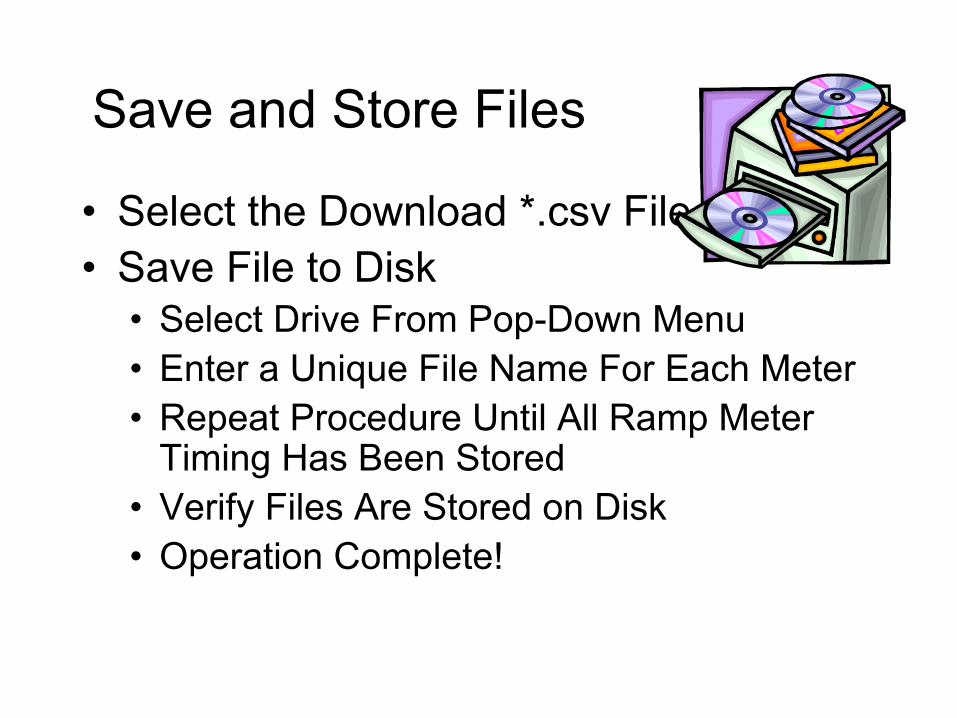
Save and Store Files
• Select the Download *.csv File • Save File to Disk
• Select Drive From Pop-Down Menu• Enter a Unique File Name For Each Meter• Repeat Procedure Until All Ramp Meter
Timing Has Been Stored• Verify Files Are Stored on Disk • Operation Complete!
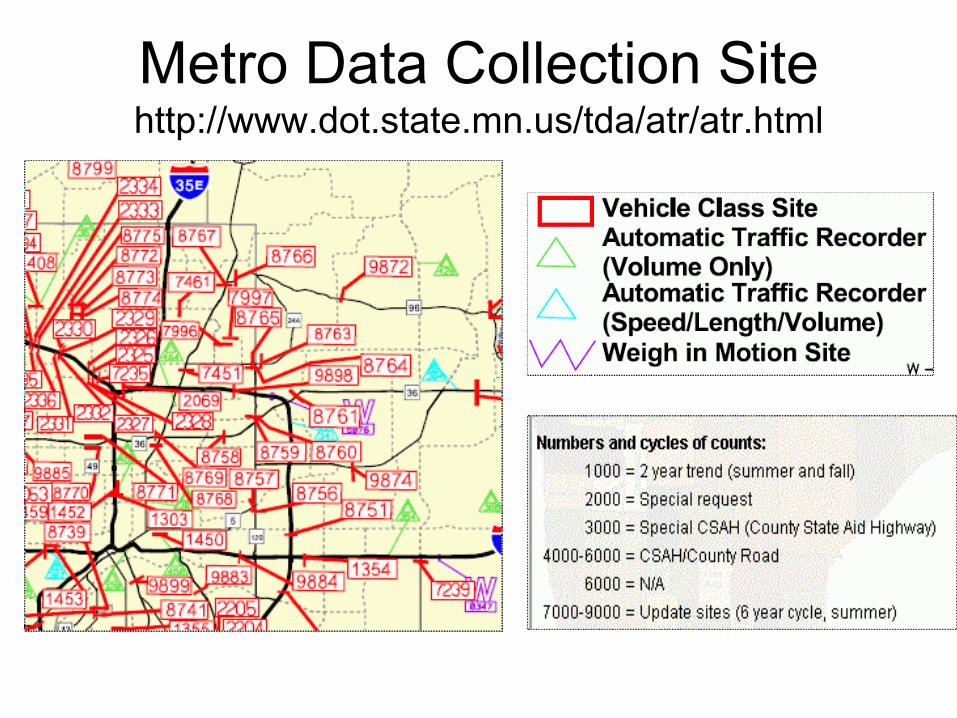
Metro Data Collection Site http://www.dot.state.mn.us/tda/atr/atr.html
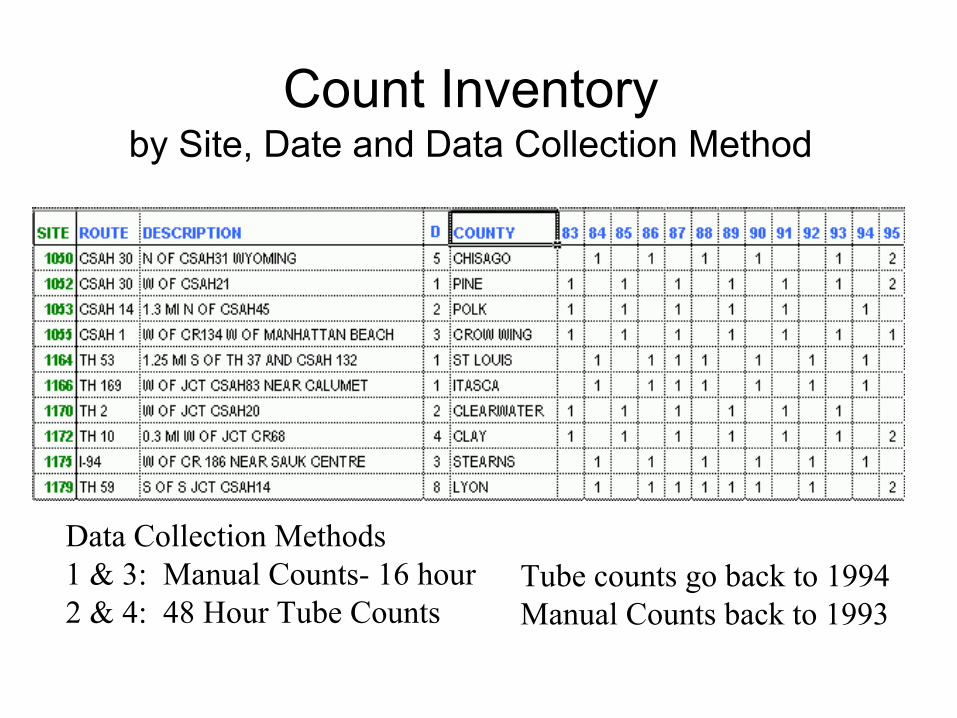
Count Inventoryby Site, Date and Data Collection Method
Data Collection Methods1 & 3: Manual Counts- 16 hour 2 & 4: 48 Hour Tube Counts
Tube counts go back to 1994Manual Counts back to 1993
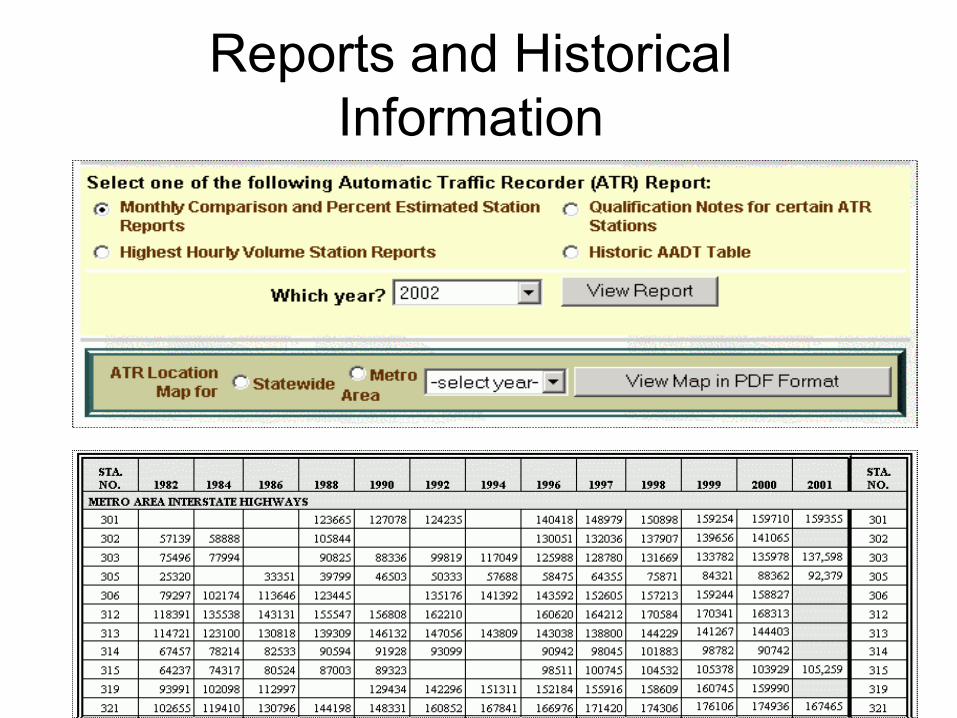
Reports and Historical Information


![ChartSense: Interactive Data Extraction from Chart … Interactive Data Extraction from Chart ... represent important numerical data in documents [19]. ... Chart data extraction results](https://img.pdfslide.net/doc/110x75/5aeed2ee7f8b9a572b8d420a/chartsense-interactive-data-extraction-from-chart-interactive-data-extraction.jpg)