Embed Size (px)
Citation preview
Vol.:(0123456789)1 3
European Journal of Epidemiology (2021) 36:165–178 https://doi.org/10.1007/s10654-020-00677-6
METHODS
Data extraction for epidemiological research (DExtER): a novel tool for automated clinical epidemiology studies
Krishna Margadhamane Gokhale1,2,4 · Joht Singh Chandan2 · Konstantinos Toulis2 · Georgios Gkoutos3,4 · Peter Tino1 · Krishnarajah Nirantharakumar2,4
Received: 12 June 2019 / Accepted: 12 August 2020 / Published online: 27 August 2020 © The Author(s) 2020
AbstractThe use of primary care electronic health records for research is abundant. The benefits gained from utilising such records lies in their size, longitudinal data collection and data quality. However, the use of such data to undertake high quality epi-demiological studies, can lead to significant challenges particularly in dealing with misclassification, variation in coding and the significant effort required to pre-process the data in a meaningful format for statistical analysis. In this paper, we describe a methodology to aid with the extraction and processing of such databases, delivered by a novel software programme; the “Data extraction for epidemiological research” (DExtER). The basis of DExtER relies on principles of extract, transform and load processes. The tool initially provides the ability for the healthcare dataset to be extracted, then transformed in a format whereby data is normalised, converted and reformatted. DExtER has a user interface designed to obtain data extracts specific to each research question and observational study design. There are facilities to input the requirements for; eligible study period, definition of exposed and unexposed groups, outcome measures and important baseline covariates. To date the tool has been utilised and validated in a multitude of settings. There have been over 35 peer-reviewed publications using the tool, and DExtER has been implemented as a validated public health surveillance tool for obtaining accurate statistics on epidemiology of key morbidities. Future direction of this work will be the application of the framework to linked as well as international datasets and the development of standardised methods for conducting electronic pre-processing and extraction from datasets for research purposes.
Keywords Epidemiology · Computer science · Extract · Transform · Load · Observational study · Research methods
Background
Advancements in technology and healthcare systems has enabled large-scale collection of longitudinal electronic health records [1]. In the UK, there are many primary care databases (THIN, CPRD, QResearch and ResearchOne) of anonymised patient records [2, 3]. These datasets include information on demographics, practice registration related information, prescriptions, morbidity, lifestyle factors (height, weight, blood pressure, smoking and alcohol status) immunisation and laboratory test results [4]. The volume of data held in such datasets will continue to increase [5, 6].
Generally, the data within primary care databases are derived from healthcare software system used to manage patient’s clinical data [7, 8]. These systems are designed for the end-user experience of helping healthcare professionals to access and manage clinical data rather than for research purposes. As such, these datasets present several challenges
Electronic supplementary material The online version of this article (https ://doi.org/10.1007/s1065 4-020-00677 -6) contains supplementary material, which is available to authorized users.
* Krishna Margadhamane Gokhale [email protected]
* Krishnarajah Nirantharakumar [email protected]
1 School of Computer Science, College of Engineering and Physical Sciences, University of Birmingham, Birmingham B152TT, UK
2 Institute of Applied Health Research, College of Medical and Dental Sciences, University of Birmingham, Birmingham B152TT, UK
3 Chair of Clinical Bioinformatics, Institute of Cancer and Genomic Sciences, College of Medical and Dental Sciences, University of Birmingham, Birmingham B152TT, UK
4 Health Data Research UK, Birmingham, UK
166 K. M. Gokhale et al.
1 3
related to missing data, variation in definitions for diagnoses and incomplete and inadequate capturing of secondary care information [9–11]. However, the strength of these databases lies in their size, breadth, representativeness of the popula-tion, long-term follow-up and sufficient data quality. Primary care databases offer great research potential related to drug safety and effectiveness research, identification of disease risk factors, generation of algorithms for identification of high risk patients, evaluation of public health policies and surveillance of diseases [4, 12–16]. In recent years, there is an increase in trend of using such routinely available data in healthcare research [3, 17].
In research which utilises primary care databases, data pre-processing and extraction are important steps of trans-forming the available raw data into a format suitable for statistical analysis. The process of extraction of primary care data for research is expensive due to time, effort and exper-tise required [11]. Factors such as; database size, database structure, range of available data, level of detail, complex-ity of study designs and study variables (such as exposure, outcome, inclusion or exclusion criterion and potential confounders) makes data extraction a complex process. It requires experts with considerable clinical, scientific and technical expertise to interrogate primary care databases [18]. A sound communication and documentation process is also important between researchers and data extraction experts to reduce human induced errors, and to minimize any biases that may occur in extracted data set because of miscommunication or difference in understanding. Data sup-pliers may offer extraction services for a fee, or research-ers may collaborate with in-house specialists available to carry out extraction. There are no standard methodologies one can follow to extract data from primary care databases. An initial extraction may be based on patient restrictions, inclusion and exclusion criteria and multiple other extrac-tions are performed to obtain additional variables. Experts use various software to manually compile an analysable data set for each study. This non-standard and non-automatic way of data extraction is labour-intensive; adds constraints on accuracy and reproducibility of results; and has limited methods to verify the validity and integrity of the datasets generated. Some corporate as well as University bodies have made considerable progress in trying to deliver solutions to manipulating electronic health record data. The rEHR R package, and The European Health Data & Evidence Network’s (EHDEN) Observational Health Data Sciences and Informatics (OHDSI) platform ATLAS are examples of software available to support researchers in extracting data taken from primary care [19, 20]. However, these packages and tools requires substantial user manipulation, statistical background and programming expertise which clinicians may lack and/or lacks certain features such as data extrac-tion based on particular study designs and the ability to
match cohorts. Aetion is an example of an alternate corpo-rate provider of readily analysable datasets using longitu-dinal healthcare data, however, the mechanism and schema of their approach has not yet been published, therefore the validity and reproducibility of their approach is currently unclear [21].
In spite of best efforts, data extraction from primary care databases poses a number of issues; technical, human dependent, non-automatic, time consuming, need for data cleaning, handling very large data sets and complex logic with no room for verification and validation of the generated data. With advances in technology, there is clear scope in improving current methods of designing studies and extract-ing data. In particular, considering the importance of data in medical research, it is crucial to create automated methods to extract verifiable and valid datasets to expedite research and to avoid human induced errors.
In this paper, we introduce DExtER, an extract transform load (ETL) based software framework that enables auto-mated clinical epidemiological studies (ACES), in a repro-ducible and verifiable way. This system potentially allows the stakeholders to extract high quality, patient-based data from primary care databases and hence enables a large range of research possible with electronic primary care data that could be translated to other healthcare databases.
Methodology
Extract, transform and load (ETL)
ETL [22] processes are backbones of data warehousing. Application of ETL is not new in medical research [23–26]. ETL performs three distinct steps; extraction of data from source system, transformation of data and loading of data into target system.
‘Extraction’ is a simple process, in which depending on what stage the data is needed and what data is needed, tailored subset of data that is necessary for the subsequent transformation stage is extracted from specific parts of the data source. Extraction can be from multiple sources (multi-ple primary care databases or a combination of primary and secondary care databases) and from any form of technologi-cal infrastructure (or a combination of them) in which the data is being stored (e.g., RDBMS, NoSQL, spreadsheets and flat files).
During ‘Transformation’ a number of operations can take place e.g., conversion, filtering, reformatting, appli-cation of a number of special-purpose business rules and aggregation. It is important to identify and note some of the schema level and instance level challenges that may occur during transformation [27]. For example, as the system allows multiple data sources, conflicts in naming can occur
167Data extraction for epidemiological research (DExtER): a novel tool for automated clinical…
1 3
where same name might identify different things in the data sources. Different primary care databases may use differ-ent clinical coding systems (Read codes vs ICPC: Interna-tional Classification of Primary Care). Value level problems may exist such as different date formats or HbA1c being expressed in % as opposed to mmol/mol. Converting data structure and semantics of various databases into one com-mon format, for example OMOP CMD [28], helps to solve some of these issues. The benefits of such unified data model has already been well researched [28–30].
Alternatively, several operations such as conversion, normalization and reformatting are accommodated in the transformation steps. Finally, in the ‘Load’ step, the result-ing transformed data gets pushed into the target systems or file formats.
Flow of control and application to observational study design
Our system is based on observational (cohort, case–control, and cross-sectional) study designs. Although, the core prin-ciples of each observational studies are somewhat similar (observational in nature without introducing an interven-tion), they do have certain steps that do differ in terms of exposure definition, the need for controls and how they manage time. Hence the first step towards automating data
extraction was to map out steps performed in these study designs. For example, a cohort study requires an exposed and unexposed group which are both followed up until a point of outcome or study end date.
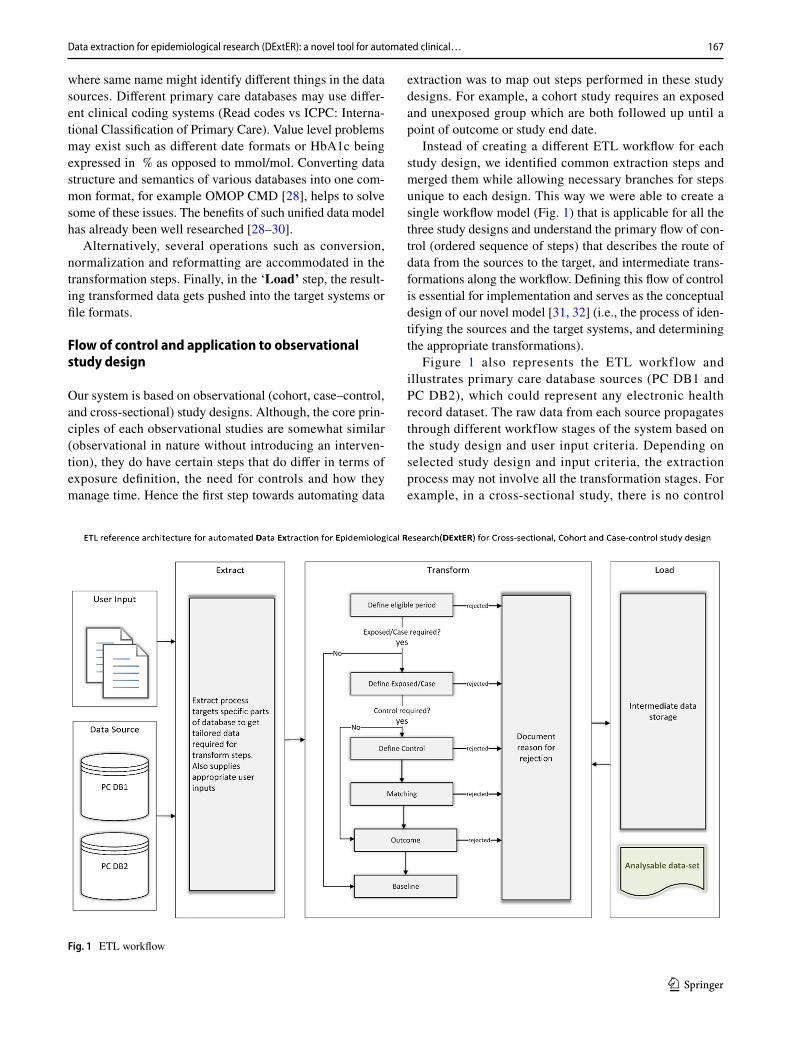
Instead of creating a different ETL workflow for each study design, we identified common extraction steps and merged them while allowing necessary branches for steps unique to each design. This way we were able to create a single workflow model (Fig. 1) that is applicable for all the three study designs and understand the primary flow of con-trol (ordered sequence of steps) that describes the route of data from the sources to the target, and intermediate trans-formations along the workflow. Defining this flow of control is essential for implementation and serves as the conceptual design of our novel model [31, 32] (i.e., the process of iden-tifying the sources and the target systems, and determining the appropriate transformations).
Figure 1 also represents the ETL workf low and illustrates primary care database sources (PC DB1 and PC DB2), which could represent any electronic health record dataset. The raw data from each source propagates through different workflow stages of the system based on the study design and user input criteria. Depending on selected study design and input criteria, the extraction process may not involve all the transformation stages. For example, in a cross-sectional study, there is no control
Fig. 1 ETL workflow
168 K. M. Gokhale et al.
1 3
selection, outcome definition or matching required, and hence the extraction process would skip these stages. Before each transformation stage begins, an extract step will fetch tailored data from specific parts of the raw data sources based on the input criteria. After each stage of the transformation process, there are intermediate data stores that holds the transformed data until it propagates to the next stage. The intermediate data stores can be in-memory data structures (such as RAM) or can be stored in physical memory; the latter option are helpful in the case of a failure, where the whole process need not be started from the beginning. Ultimately, raw data is trans-formed into analysable datasets and loaded into the target system. An important process at the end of each transfor-mation step is to document the reason why some patient records may be rejected and do not qualify for further processing. This documentation process is crucial and of immense importance, to ensure that data produced by the system is verifiable and valid, often a step which is not as easily achieved through other means. This process informs stakeholders of why patients were filtered out at various stages of data extraction and the reason for rejection. Another important feature of our model is its modular nature. Modularity of the system allows flexibil-ity in terms of error handling, logic implementation, and provides ease to add new workflow stages (for example, a new workflow stage to clean the data set). A specific transformation stage of importance is added to encrypt the datasets using Advanced Encryption Standard (AES) 256-bit cipher as a data privacy step.
Stages of study design input using DExtER
A pre-requisite for using the system to extract data is to come up with a well-defined set of inputs, ranging from; study period, study population, study variables (exposure, outcome and covariates), requirement of controls with matching criteria and the baseline characteristics with the outcome(s) of interest. In our implementation of the system, we have built a web-based HTML UI for users to provide these inputs, and we save the input in database and supply it to the system for data extraction based on a FCFS (First Come, First Serve) queue and hence provide multiuser facilities. The primary care database we used was ‘The health improvement network’ (THIN) database [33]. We have been able to test and validate the system on the Clinical Practice Research Datalink (CPRD) GOLD [34] and CPRD Aurum [35]. Our system is applicable to any observational healthcare database which is similar in structure and semantics to CPRD, THIN or observational medical outcomes partnership (OMOP) common data model (CDM).
Stage 1: Defining study eligible period
The first stage of the system is the process of defining eli-gible period for the study (Table 1). This eligibility period is composed of the patient start and end date, and it is in between this time duration in which all the events of interest (exposure, outcome) take place. In this step, we define the age and sex requirements of the group (e.g. in a study about pregnant woman we usually require only females of the age group 13–50 years) and apply data quality filters (e.g. adding days to keys dates of adequate computer usage) to improve the integrity of the raw data [36, 37].
Stage 2: Defining the exposed group in cohort design or cases in case–control design
The next stage is to define the exposed/case group as the system assigns each patient an index date based on single or multiple exposure (Table 2). In this step we employ a recur-sive descent parser (a mathematical tool used to determine if a sequence of symbols such as sentence is syntactically correct) [38], and a regular grammar (set of rules used to define the syntax for a particular language) [39] to success-fully identify any number of exposures. If the study has more than one exposure, then we propose two modes of parsing namely strict parsing and loose parsing. The former is used when the order of occurrence of each exposure is relevant to the study (for example, in one of our study the expo-sure was diabetic patients who were prescribed a particular medication [40]), if otherwise, the latter is selected. If the study requires unexposed group/controls, patients who do not belong to the exposed group are labelled as potential unexposed group/controls. In supplementary 1 we discuss the proposed regular grammar.
During implementation of the system we have trialled some advanced study designs such as whether the exposure considered is only incident patients compared to occasions where we have explored incidence and prevalent cases par-ticularly where the exposure is rare [40–44]. Current work involves implementing pharmaco-epidemiolocal study designs such as new [45] and prevalent new-user designs [46].
During this stage it is also important to understand how to manage the outcome variables. If the study requires patients to be removed if an event of the outcome has occurred before the index date, then the workflow stage for determining outcome(s) is executed right after each time an index date is assigned to the patient and then patients are removed if the outcome has occurred before index date. If the study does not have any restriction on the patient based on the outcome the workflow stage for determining outcome(s) is executed before the last stage.

169Data extraction for epidemiological research (DExtER): a novel tool for automated clinical…
1 3
Stage 3 and 4: Defining the control group and matching
The control selection stage (stage 3) executes only if the con-trols are required for the study (Table 3). We note that unex-posed/control group can still have exposure(s). Although the index date for controls depends on the clinical question and study design, in most studies the corresponding exposed patient’s index date is assigned to the control patient to miti-gate immortality time bias [47].
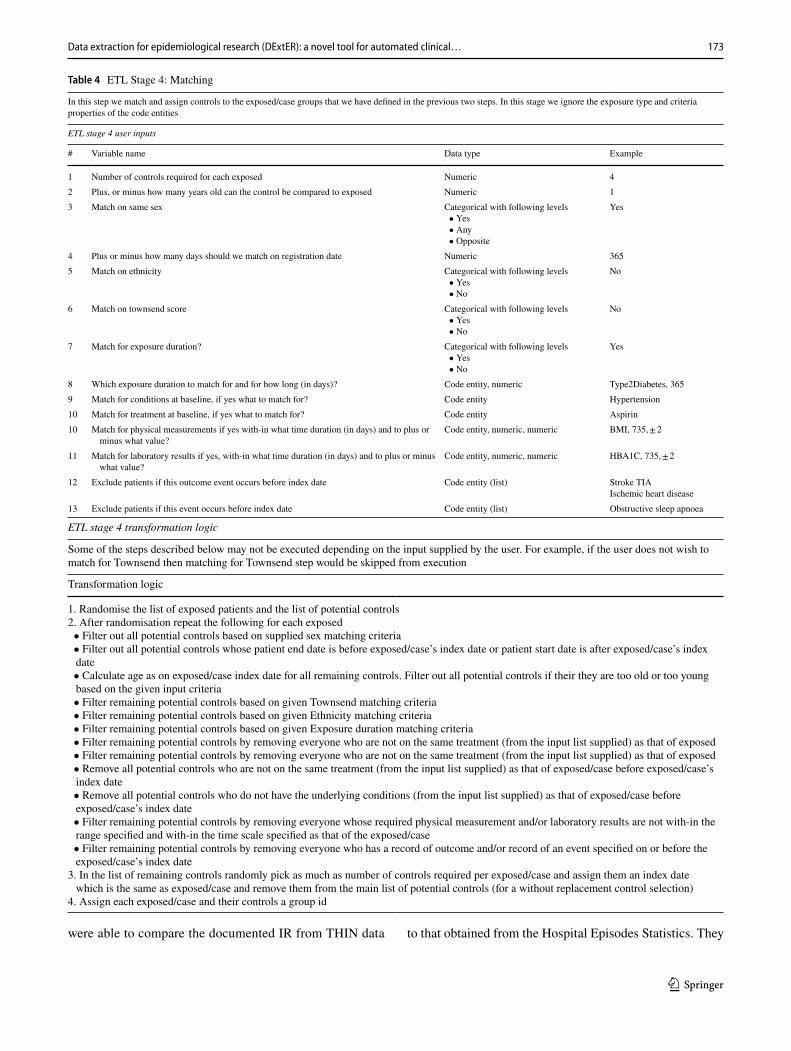
The matching stage (stage 4) of the ETL workflow is employed where controls are required for the study and they need to be matched on specific parameters (Table 4). The matching criteria in each epidemiological study var-ies dependent on the study design. Parameters such as age, sex, and practice-based matching are common, some criteria such as matching disease duration (example diabetes dura-tion), matching variable values (e.g. HbA1c or BMI) are also required at times. In our implementation of the system we have provided a range of matching criteria such as the number of unexposed/controls needed per exposed/case; should unexposed/control come from the same practice or
from randomly selected practices; and what parameters they need to be matched on (e.g. age, gender and other variables described above).
We have developed the UI so that users can enter appro-priate inputs for each of them. The matching stage of the workflow works in two steps. In the initial step, for each exposed/case in the study we identify and mark a list of unexposed/controls who pass the matching criteria. In the next step, we randomly (to avoid any biases) select the required number of controls for the exposed/case from the initial list and mark them as group by assigning them a unique number. Remaining unexposed/controls are unmarked and are available as potential controls for the other exposed/cases.
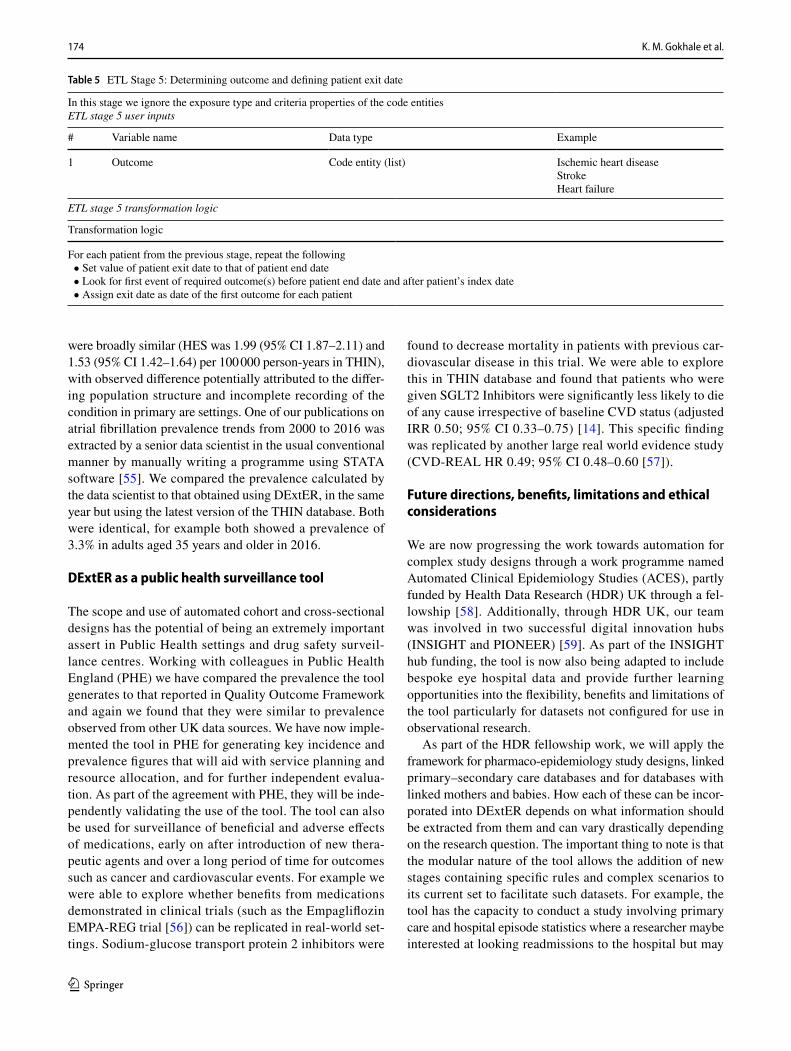
Stage 5: Determining outcome and defining patient exit date
This process introduces a new variable called the patient exit date (Table 5), which is by default the patient end date unless the study has an outcome in which case the patient exit date
Table 1 ETL stage 1: defining study eligible period
ETL stage 1 user inputs
# Variable name Data type Example
1 Study start date Calendar date 15/01/19982 Study end date Calendar date 15/12/20193 The number of days that should be added to key dates (Computerization/Acceptable Mortality Rate/
Healthcare System) of the practice (optional)Numeric 365
4 The number of days the patient should be registered in the practice before inclusion in the study (optional) Numeric 3655 Age at cohort entry Numeric 25–846 Maximum allowed age at cohort exit Numeric 1157 Sex of the population Categorical with
following levels • Male • Female • Any
Any
ETL stage 1 transformation logic
Transformation logic
1. For each practice present in the database repeat the following • Add the number of days to key dates (input #3) • Practice start date = latest date of (key dates, Study Start Date) • Practice end date = earliest of (Study End date, Collection date)2. For each patient record present in the eligible practice, repeat the following • Add the number of days to Registration date of the patient if input is supplied (input #4) • Patient start date = latest date of [Registration date, Practice Start Date, date the patient attains minimum age at cohort entry (input #5)] • Patient end date = earliest date of [Practice End date, Deregistration date, Death date, date the patient attains maximum age allowed at
cohort exit (input #6)] • If patient is at least minimum age years old at patient start date, but not older than maximum age years old go to next step • If patient’s sex is same as what is supplied in input 7, go to next step • If patient start date is before practice end date and patient end date is after practice start date, store the patient record for the next stage else
reject3. Document reason for rejection
170 K. M. Gokhale et al.
1 3
is set to the date on which the outcome occurred. This stage is also responsible to extract any outcome required for the study for all eligible patients.
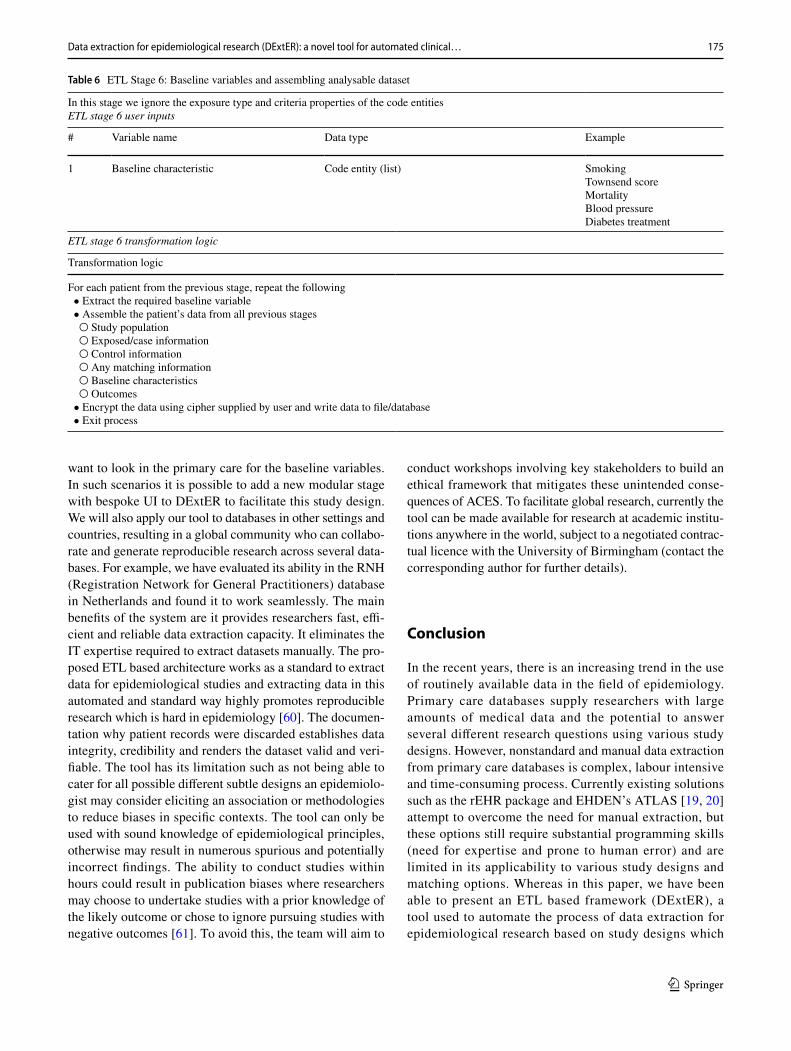
Stage 6: Baseline variables and assembling an analysable dataset
The last stage of the workflow is extracting baseline vari-ables that are required for the study (Table 6). This is a sim-ple extract step where for each patient the required variables (e.g. BMI, glucose levels) are extracted from the raw data
sources based on the input criteria (example if the latest value is required or if the earliest value is required). This stage also hosts a final Load step, which assembles all the study variables from corresponding intermediate data stores (previously extracted and transformed at different stages of the workflow) as the analysable dataset. We also propose encrypting the generated datasets to standards set by NHS to enforce data protection.
At the end of the process, we provide the reason for rejec-tion of the discarded patients. This process is executed each time a patient is discarded. Here we employ a map data
Table 2 ETL stage 2: Defining the exposed group in cohort design or cases in case–control design
Defining code entities
In electronic health records all diagnoses, symptoms, treatment, physical and laboratory measurements are coded into the system using some sort of clinical coding system, for example in Vision and EMIS systems, Read codes are used to record all diagnoses and symptoms. In HES records OCPC and ICD10 codes are used for the same purpose
In this section we introduce a code entity which encapsulates clinical code that represents diagnoses, symptoms, treatment, physical or labora-tory measurements etc. and some properties that describe it’s use and characteristic. The properties of Code Entities will change slightly depending on which ETL stage it is being used
Code entity for exposure
# Variable Data type Example
1 Name Text Type2Diabetes2 Criteria Categorical with following levels
• Inclusion criteria • Exclusion criteria
Inclusion criteria
3 Exposure type Categorical with following levelsFor inclusion criteria • Incident only • Incident or prevalent • First record after cohort entryFor exclusion criteria • Exclude if ever recorded • Exclude if recoded before index date
For inclusion • Incident onlyFor exclusion • Exclude if ever recorded
4 Definition Delimited text Read code for Type 2 diabetes:C10F.11, C10F.00ICD10 for Type 2 diabetes:E110
ETL stage 2 user inputs:
# Variable name Data type Example
1 Code entity Code entity of exposure Name: Type2 DiabetesCriteria: Inclusion criteriaExposure type: Incident onlyDefinition: {C10F.11, C10F.00}Name: MetforminCriteria: Inclusion criteriaExposure type: Incident onlyDefinition: {6.1.2.2}
2 Combination logic of the exposure Text: formatted as regular grammar suggested Type2Diabetes and Metformin3 Parsing mode Categorical with following levels
• Strict • Loose
Strict
4 Exclude patients if these outcomes occur before index
Code entity (list) Ischemic heart diseaseStroke
171Data extraction for epidemiological research (DExtER): a novel tool for automated clinical…
1 3
structure that maps reason for rejection to number of patients discarded for that reason. When the system encounters a patient, who is to be discarded, first it looks in the map to see whether it already contains the (key) reason for rejection which triggered the process. If present, then the value against this reason is incremented by one and patient is discarded. If the reason is not already present, then it is newly entered in the map, and the corresponding value is set to 1. This way we will be able to record all the patients who are rejected and the exact reason behind why they were rejected. Optionally, we can also log details of the patient to manually verify the rejection.
Implementation on site
We have implemented DExtER as a 3-tier web-based soft-ware system. We have built a website as the front end where stakeholders of the system can login and use the UI to sub-mit their study design and data extraction requests which are stored in a database. The middleware of our system is the data extraction software written in Java. The middleware processes the data extraction requests on a first come, first serve basis and notifies users when the data extraction is complete. The backend of the system is Postgres RDBMS to store THIN database available to our institution.
Data protection and privacy
Data protection and privacy policies are important pre-req-uisites for any successful tool. Therefore, the web interface
we developed for this tool are line with the University of Birmingham data regulation guidance and works within the principles set out by the Information Commissioners Office [48]. Prior to any data extraction, the study design must have gone through ethical approval. Following which, in accord-ance with the protocol sent for ethics, a minimum dataset is extracted. A data extraction log (audit) is created each time an extraction is attempted. Following extraction, the dataset is encrypted to AES 256 using a password supplied to the user.
Discussion
To date we have conducted a wide variety of epidemiological studies to both validate our tool and shed light on complex clinical questions. This research has been conducted as part of funded investigator led research, doctoral research and postgraduate taught course dissertations. The results of such studies have culminated in over 35 peer-reviewed publications in high impact factor general medical and specialist journals in the last 2 years, with more than 25 studies currently ongo-ing simultaneously. We highlight some of the studies, present comparable research elsewhere as a source of validity and discuss their clinical and public health importance below.
Utility and validity of DExtER
A summary of validation of the tool can be seen in sup-plementary 2. In our first study utilising the DExtER tool
Table 2 (continued)
ETL stage 2 transformation logic
Transformation logic
Repeat the following for each eligible patient record present from previous stage • For each code entity with inclusion criteria if the exposure type is ○ Incident only: find the earliest event of the code entity before patient end date and save details if found, if the event is before patient start
date exclude patient and document reason for exclusion ○ Incident or prevalent: find the earliest event of the code entity before patient end date and save details if found ○ First record after cohort entry: find the earliest event of the code entity after the patient start date and before patient end date and save
details if found • The parser in the system based on the combination logic supplied does the following each time it encounters a code entity of the patient ○ If all inclusion code entities are found in the patient go to next step, else if controls are required mark patient as ‘potential control’ else
discard the patient and document reason ○ If the parsing mode is loose, latest event date among the code entities is set as patient’s index date ○ Else if the parsing mode is strict, If and only if the code entities have occurred in the same order as defined in the combination logic, set
patient’s index date as date of latest entities’ event date else discard the patient and document reason for rejection • For each code entity with exclusion criteria if the exposure type is ○ Exclude if ever recorded: find the event described by the code entity, if the entity is found exclude patient and record documentation for
rejection ○ Exclude if recorded before index date: find the event described by the code entity before patient’s index date, if the entity is found exclude
patient and record documentation for rejection • Exclude patients if these outcomes occur before index ○ For each code entity in the list check if it occurs before index date, if the entity is found exclude patient and record documentation for
rejection
172 K. M. Gokhale et al.
1 3
we explored the association between Type 1 Diabetes and subsequent risk of developing epilepsy using a cohort study design [49]. Previous literature were mainly case studies or case control in nature [49–52]. One study explored the association in a cohort design but the study was from a low-middle income country, where there are other confounding factors that may have resulted in the observed association. [53] In our study we identified exposed patients in THIN database with a diagnosis of Type 1 Diabetes and matched them to four unexposed patients by age, gender and gen-eral practice location. After following both sets of patients for, on average, just over 5 years, we were able to identify how many patients in each group developed epilepsy. The incidence rate (IR) of the development of epilepsy in the unexposed group was 44 per 100,000 person years. This rate is similar to published literature, as a recent systematic review described the IR to be 50/100,000 person years in developed countries globally [54] This was compared to an IR in our exposed group of 132/100,000 person years, result-ing in an overall adjusted Hazard ratio (HR) of 3.01 (95% CI 1.93–4.68). This threefold increased risk was similar to cohort study from Taiwan (HR 2.84; 95% CI 1.95–4.69) [53].
We have conducted similar retrospective cohort study designs to report on outcomes including for rare diseases such as Achalasia [15] and IgA vasculitis [41]. For IgA vas-culitis we identified patients with the child onset and adult onset IgA vasculitis and identified following adjustment that these patients had an increased risk of developing hyperten-sion (Child onset: HR 1.52; 95% CI 1.22–1.89; Adult onset: HR 1.42; 95% CI 1.19–1.70) and chronic kidney disease (Child: HR 1.89; 95% CI 1.16–3.07; Adult: HR 1.54; 95% CI 1.23–1.93) [41]. With a similar study design, we identified that the diagnosis of the oesophageal condition achalasia was strongly associated with the development of oesopha-geal cancer and lower respiratory tract infections [15]. The findings in both of these studies are useful to clinicians as we can shed light on novel associations which are important to consider in clinical management and long-term surveillance.
These two manuscripts also highlight another application of the DExtER tool, which we have since utilised. We were also able to study yearly incidence and prevalence of these conditions using yearly cohort and cross-sectional study designs respectively. We noted that the incidence of IgA vas-culitis was stable but the documented prevalence in the gen-eral population was increasing. In our Achalasia study, we
Table 3 ETL Stage 3: Defining the control group
This stage is very similar to the previous stage in many ways. The he definition of the code entity remains the same as in the previous stage
ETL stage 3 user inputs
# Variable name Data type Example
1 Code entity Code Entity of exposure Name: Type2DiabetesCriteria: Inclusion criteriaExposure type: Incident onlyDefinition: {C10F.11, C10F.00}
2 Combination logic of the exposure Text: formatted as regular grammar suggested Type2Diabetes3 Parsing mode Categorical with following levels
• Strict • Loose
Loose
ETL stage 3 transformation logic
Transformation logic
Repeat the following for each eligible patient record marked as ‘potential control’ from previous stage • For each code entity with inclusion criteria if the exposure type is ○ Incident only: find the earliest event of the code entity before patient end date and save details if found, if the event is before patient start
date exclude patient and document reason for exclusion ○ Incident or prevalent: find the earliest event of the code entity before patient end date and save details if found ○ First record after cohort entry: find the earliest event of the code entity after the patient start date and before patient end date and save
details if found • The parser in the system based on the combination logic supplied does the following each time it encounters a code entity of the patient ○ If all inclusion code entities are found in the patient go to next step, else discard the patient and document reason ○ If the parsing mode is loose, latest event date among the code entities is set as patient’s index date ○ Else if the parsing mode is strict, If and only if the code entities have occurred in the same order as defined in the combination logic, set
patient’s index date as date of latest entities’ event date else discard the patient and document reason for rejection • For each code entity with exclusion criteria if the exposure type is ○ Exclude if ever recorded: find the event described by the code entity, if the entity is found exclude patient and record documentation for
rejection
173Data extraction for epidemiological research (DExtER): a novel tool for automated clinical…
1 3
were able to compare the documented IR from THIN data to that obtained from the Hospital Episodes Statistics. They
Table 4 ETL Stage 4: Matching
In this step we match and assign controls to the exposed/case groups that we have defined in the previous two steps. In this stage we ignore the exposure type and criteria properties of the code entities
ETL stage 4 user inputs
# Variable name Data type Example
1 Number of controls required for each exposed Numeric 42 Plus, or minus how many years old can the control be compared to exposed Numeric 13 Match on same sex Categorical with following levels
• Yes • Any • Opposite
Yes
4 Plus or minus how many days should we match on registration date Numeric 3655 Match on ethnicity Categorical with following levels
• Yes • No
No
6 Match on townsend score Categorical with following levels • Yes • No
No
7 Match for exposure duration? Categorical with following levels • Yes • No
Yes
8 Which exposure duration to match for and for how long (in days)? Code entity, numeric Type2Diabetes, 3659 Match for conditions at baseline, if yes what to match for? Code entity Hypertension10 Match for treatment at baseline, if yes what to match for? Code entity Aspirin10 Match for physical measurements if yes with-in what time duration (in days) and to plus or
minus what value?Code entity, numeric, numeric BMI, 735, ± 2
11 Match for laboratory results if yes, with-in what time duration (in days) and to plus or minus what value?
Code entity, numeric, numeric HBA1C, 735, ± 2
12 Exclude patients if this outcome event occurs before index date Code entity (list) Stroke TIAIschemic heart disease
13 Exclude patients if this event occurs before index date Code entity (list) Obstructive sleep apnoea
ETL stage 4 transformation logic
Some of the steps described below may not be executed depending on the input supplied by the user. For example, if the user does not wish to match for Townsend then matching for Townsend step would be skipped from execution
Transformation logic
1. Randomise the list of exposed patients and the list of potential controls2. After randomisation repeat the following for each exposed • Filter out all potential controls based on supplied sex matching criteria • Filter out all potential controls whose patient end date is before exposed/case’s index date or patient start date is after exposed/case’s index
date • Calculate age as on exposed/case index date for all remaining controls. Filter out all potential controls if their they are too old or too young
based on the given input criteria • Filter remaining potential controls based on given Townsend matching criteria • Filter remaining potential controls based on given Ethnicity matching criteria • Filter remaining potential controls based on given Exposure duration matching criteria • Filter remaining potential controls by removing everyone who are not on the same treatment (from the input list supplied) as that of exposed • Filter remaining potential controls by removing everyone who are not on the same treatment (from the input list supplied) as that of exposed • Remove all potential controls who are not on the same treatment (from the input list supplied) as that of exposed/case before exposed/case’s
index date • Remove all potential controls who do not have the underlying conditions (from the input list supplied) as that of exposed/case before
exposed/case’s index date • Filter remaining potential controls by removing everyone whose required physical measurement and/or laboratory results are not with-in the
range specified and with-in the time scale specified as that of the exposed/case • Filter remaining potential controls by removing everyone who has a record of outcome and/or record of an event specified on or before the
exposed/case’s index date3. In the list of remaining controls randomly pick as much as number of controls required per exposed/case and assign them an index date
which is the same as exposed/case and remove them from the main list of potential controls (for a without replacement control selection)4. Assign each exposed/case and their controls a group id
174 K. M. Gokhale et al.
1 3
were broadly similar (HES was 1.99 (95% CI 1.87–2.11) and 1.53 (95% CI 1.42–1.64) per 100 000 person-years in THIN), with observed difference potentially attributed to the differ-ing population structure and incomplete recording of the condition in primary are settings. One of our publications on atrial fibrillation prevalence trends from 2000 to 2016 was extracted by a senior data scientist in the usual conventional manner by manually writing a programme using STATA software [55]. We compared the prevalence calculated by the data scientist to that obtained using DExtER, in the same year but using the latest version of the THIN database. Both were identical, for example both showed a prevalence of 3.3% in adults aged 35 years and older in 2016.
DExtER as a public health surveillance tool
The scope and use of automated cohort and cross-sectional designs has the potential of being an extremely important assert in Public Health settings and drug safety surveil-lance centres. Working with colleagues in Public Health England (PHE) we have compared the prevalence the tool generates to that reported in Quality Outcome Framework and again we found that they were similar to prevalence observed from other UK data sources. We have now imple-mented the tool in PHE for generating key incidence and prevalence figures that will aid with service planning and resource allocation, and for further independent evalua-tion. As part of the agreement with PHE, they will be inde-pendently validating the use of the tool. The tool can also be used for surveillance of beneficial and adverse effects of medications, early on after introduction of new thera-peutic agents and over a long period of time for outcomes such as cancer and cardiovascular events. For example we were able to explore whether benefits from medications demonstrated in clinical trials (such as the Empagliflozin EMPA-REG trial [56]) can be replicated in real-world set-tings. Sodium-glucose transport protein 2 inhibitors were
found to decrease mortality in patients with previous car-diovascular disease in this trial. We were able to explore this in THIN database and found that patients who were given SGLT2 Inhibitors were significantly less likely to die of any cause irrespective of baseline CVD status (adjusted IRR 0.50; 95% CI 0.33–0.75) [14]. This specific finding was replicated by another large real world evidence study (CVD-REAL HR 0.49; 95% CI 0.48–0.60 [57]).
Future directions, benefits, limitations and ethical considerations
We are now progressing the work towards automation for complex study designs through a work programme named Automated Clinical Epidemiology Studies (ACES), partly funded by Health Data Research (HDR) UK through a fel-lowship [58]. Additionally, through HDR UK, our team was involved in two successful digital innovation hubs (INSIGHT and PIONEER) [59]. As part of the INSIGHT hub funding, the tool is now also being adapted to include bespoke eye hospital data and provide further learning opportunities into the flexibility, benefits and limitations of the tool particularly for datasets not configured for use in observational research.
As part of the HDR fellowship work, we will apply the framework for pharmaco-epidemiology study designs, linked primary–secondary care databases and for databases with linked mothers and babies. How each of these can be incor-porated into DExtER depends on what information should be extracted from them and can vary drastically depending on the research question. The important thing to note is that the modular nature of the tool allows the addition of new stages containing specific rules and complex scenarios to its current set to facilitate such datasets. For example, the tool has the capacity to conduct a study involving primary care and hospital episode statistics where a researcher maybe interested at looking readmissions to the hospital but may
Table 5 ETL Stage 5: Determining outcome and defining patient exit date
In this stage we ignore the exposure type and criteria properties of the code entitiesETL stage 5 user inputs
# Variable name Data type Example
1 Outcome Code entity (list) Ischemic heart diseaseStrokeHeart failure
ETL stage 5 transformation logic
Transformation logic
For each patient from the previous stage, repeat the following • Set value of patient exit date to that of patient end date • Look for first event of required outcome(s) before patient end date and after patient’s index date • Assign exit date as date of the first outcome for each patient
175Data extraction for epidemiological research (DExtER): a novel tool for automated clinical…
1 3
want to look in the primary care for the baseline variables. In such scenarios it is possible to add a new modular stage with bespoke UI to DExtER to facilitate this study design. We will also apply our tool to databases in other settings and countries, resulting in a global community who can collabo-rate and generate reproducible research across several data-bases. For example, we have evaluated its ability in the RNH (Registration Network for General Practitioners) database in Netherlands and found it to work seamlessly. The main benefits of the system are it provides researchers fast, effi-cient and reliable data extraction capacity. It eliminates the IT expertise required to extract datasets manually. The pro-posed ETL based architecture works as a standard to extract data for epidemiological studies and extracting data in this automated and standard way highly promotes reproducible research which is hard in epidemiology [60]. The documen-tation why patient records were discarded establishes data integrity, credibility and renders the dataset valid and veri-fiable. The tool has its limitation such as not being able to cater for all possible different subtle designs an epidemiolo-gist may consider eliciting an association or methodologies to reduce biases in specific contexts. The tool can only be used with sound knowledge of epidemiological principles, otherwise may result in numerous spurious and potentially incorrect findings. The ability to conduct studies within hours could result in publication biases where researchers may choose to undertake studies with a prior knowledge of the likely outcome or chose to ignore pursuing studies with negative outcomes [61]. To avoid this, the team will aim to
conduct workshops involving key stakeholders to build an ethical framework that mitigates these unintended conse-quences of ACES. To facilitate global research, currently the tool can be made available for research at academic institu-tions anywhere in the world, subject to a negotiated contrac-tual licence with the University of Birmingham (contact the corresponding author for further details).
Conclusion
In the recent years, there is an increasing trend in the use of routinely available data in the field of epidemiology. Primary care databases supply researchers with large amounts of medical data and the potential to answer several different research questions using various study designs. However, nonstandard and manual data extraction from primary care databases is complex, labour intensive and time-consuming process. Currently existing solutions such as the rEHR package and EHDEN’s ATLAS [19, 20] attempt to overcome the need for manual extraction, but these options still require substantial programming skills (need for expertise and prone to human error) and are limited in its applicability to various study designs and matching options. Whereas in this paper, we have been able to present an ETL based framework (DExtER), a tool used to automate the process of data extraction for epidemiological research based on study designs which
Table 6 ETL Stage 6: Baseline variables and assembling analysable dataset
In this stage we ignore the exposure type and criteria properties of the code entitiesETL stage 6 user inputs
# Variable name Data type Example
1 Baseline characteristic Code entity (list) SmokingTownsend scoreMortalityBlood pressureDiabetes treatment
ETL stage 6 transformation logic
Transformation logic
For each patient from the previous stage, repeat the following • Extract the required baseline variable • Assemble the patient’s data from all previous stages ○ Study population ○ Exposed/case information ○ Control information ○ Any matching information ○ Baseline characteristics ○ Outcomes • Encrypt the data using cipher supplied by user and write data to file/database • Exit process
176 K. M. Gokhale et al.
1 3
can utilise any longitudinal primary care electronic record source. Corporate solutions which can provide a similar service to DExtER, [21] are yet to publish the developed algorithms/programs, and hence they are limited in the validity of their techniques and reliability in the datasets generated for research. Whereas, DExtER provides a non-invasive solution to generate quality datasets in an ana-lysable format through a process that can be verified and reproducible.
We anticipate this new architecture will expedite and reduce the costs of epidemiological and health services research by reducing the gap between medical research-ers and electronic patient records. As a part of the future work, we want to develop concrete standards for each step in the data extraction process and work towards developing automated analytics with the vision to create an automated research pipeline for epidemiological studies.
Acknowledgements The authors would like to acknowledge and give their sincere thanks to the kind efforts and supervision provided by Dr Behzad Bordbar, previously a senior lecturer and Dr Ronan Ryan, previously a research fellow at University of Birmingham, during the initial phase of the development of DExtER.
Author contributions This piece of work forms part of the doctoral thesis for KG and builds on his MSc dissertation. KG led all parts of the development of DExtER including; conception, software devel-opment, methods development, production, implementation, testing, validation and writing of the final manuscript. KN conceived the idea to automate epidemiology study designs, contributed to all phases of the development of DExtER and supervised KG throughout the project with PT. JSC, KT and GG contributed to the implementation, testing and validation phase of the tool. All authors participated in revising the manuscript and have approved the final version.
Funding KN is supported by a fellowship grant from Health data research UK.
Compliance with ethical standards
Conflict of interest There are no conflict of interests to declare in this study.
Open Access This article is licensed under a Creative Commons Attri-bution 4.0 International License, which permits use, sharing, adapta-tion, distribution and reproduction in any medium or format, as long as you give appropriate credit to the original author(s) and the source, provide a link to the Creative Commons licence, and indicate if changes were made. The images or other third party material in this article are included in the article’s Creative Commons licence, unless indicated otherwise in a credit line to the material. If material is not included in the article’s Creative Commons licence and your intended use is not permitted by statutory regulation or exceeds the permitted use, you will need to obtain permission directly from the copyright holder. To view a copy of this licence, visit http://creat iveco mmons .org/licen ses/by/4.0/.
References
1. Protti D. Comparison of information technology in general prac-tice in 10 countries. Healthc Q. 2006;10:107–16.
2. Curcin V, Soljak M, Majeed A. Managing and exploiting rou-tinely collected NHS data for research. J Innov Health Inform. 2013;20:225–31.
3. Vezyridis P, Timmons S. Evolution of primary care databases in UK: a scientometric analysis of research output. BMJ Open. 2016. https ://doi.org/10.1136/bmjop en-2016-01278 5.
4. Cook JA, Collins GS. The rise of big clinical databases. Br J Surg. 2015. https ://doi.org/10.1002/bjs.9723.
5. John O, Donoghue HJ. Data management within mHealth environ-ments: patient sensors, mobile devices, and databases. J Data Inf Qual. 2012;4:1–20.
6. Murdoch TB, Detsky AS. The inevitable application of big data to health care. JAMA. 2013;309:1351–2.
7. Hippisley-Cox J, Stables D, Pringle M. QRESEARCH: a new general practice database for research. J Innov Health Inform. 2004;12:49–50.
8. Herrett E, Gallagher AM, Bhaskaran K, Forbes H, Mathur R, van Staa T, Smeeth L. Data resource profile: clinical practice research datalink (CPRD). Int J Epidemiol. 2015;44:827–36.
9. Cohen B, Vawdrey DK, Liu J, Caplan D, Furuya EY, Mis FW, Larson E. Challenges associated with using large data sets for quality assessment and research in clinical settings. Policy Polit Nurs Pract. 2015. https ://doi.org/10.1177/15271 54415 60335 8.
10. Lin J-H, Haug PJ. Data preparation framework for preprocessing clinical data in data mining. In: AMIA annual symposium pro-ceedings; 2006.
11. Wasserman RC. Electronic medical records (EMRs), epidemiol-ogy, and epistemology: reflections on EMRs and future pediatric clinical research. Acad Pediatr. 2011;11:280–7.
12. de Lusignan S, van Weel C. The use of routinely collected com-puter data for research in primary care: opportunities and chal-lenges. Fam Pract. 2006;23:253–63.
13. Williams T, Van Staa T, Puri S, Eaton S. Recent advances in the utility and use of the General Practice Research Database as an example of a UK Primary Care Data resource. Ther Adv Drug Saf. 2012;3:89–99.
14. Toulis KA, Willis BH, Marshall T, et al. All-cause mortality in patients with diabetes under treatment with dapagliflozin: a population-based, open-cohort study in the health improvement network database. J Clin Endocrinol Metab. 2017;102:1719–25.
15. Harvey PR, Thomas T, Chandan JS, Mytton J, Coupland B, Bhala N, Evison F, Patel P, Nirantharakumar K, Trudgill NJ. Incidence, morbidity and mortality of patients with achalasia in England: findings from a study of nationwide hospital and primary care data. Gut. 2018;68:790–5.
16. Adderley NJ, Nirantharakumar K, Marshall T. Risk of stroke and transient ischaemic attack in patients with a diagnosis of resolved atrial fibrillation: retrospective cohort studies. BMJ. 2018;361:k1717.
17. Yao Q, Chen K, Yao L, Lyu P, Yang T, Luo F, Chen S, He L, Liu Z. Scientometric trends and knowledge maps of global health systems research. Health Res Policy Syst. 2014;12:26.
18. Hall GC, Sauer B, Bourke A, Brown JS, Reynolds MW, Lo CR. Guidelines for good database selection and use in phar-macoepidemiology research. Pharmacoepidemiol Drug Saf. 2012;21:1–10.
19. Springate DA, Parisi R, Olier I, Reeves D, Kontopantelis E. rEHR: an R package for manipulating and analysing electronic health record data. PLoS ONE. 2017;12:e0171784.
177Data extraction for epidemiological research (DExtER): a novel tool for automated clinical…
1 3
20. The European Health Data & Evidence Network’s (EHDEN) (2015) The European Health Data & Evidence Network’s (EHDEN) OHDSI ATLAS.
21. Aetion. Aetion; 2020. https ://www.aetio n.com/. Accessed 8 Mar 2020.
22. Vassiliadis P, Simitsis A. Extraction, transformation, and loading. In: Encyclopedia of database systems. Berlin: Springer; 2009, pp 1095–1101.
23. Murphy S. Data warehousing for clinical research. In: Encyclo-pedia of database systems. Berlin: Springer; 2009, pp 679–84.
24. Pecoraro F, Luzi D, Ricci FL. Designing ETL tools to feed a data warehouse based on electronic healthcare record infrastructure. Studies Health Technol Inform. 2015;210:929–33.
25. Horvath MM, Winfield S, Evans S, Slopek S, Shang H, Ferranti J. The DEDUCE Guided Query tool: providing simplified access to clinical data for research and quality improvement. J Biomed Inform. 2011;44:266–76.
26. Lazarus R, Klompas M, Campion FX, McNabb SJN, Hou X, Dan-iel J, Haney G, DeMaria A, Lenert L, Platt R. Electronic support for public health: validated case finding and reporting for notifi-able diseases using electronic medical data. J Am Med Inform Assoc. 2009. https ://doi.org/10.1197/jamia .M2848 .
27. Lenzerini M. Data integration: a theoretical perspective. In: Pro-ceedings of the twenty-first ACM SIGACT-SIGMOD-SIGART symposium on principles of database systems. ACM; 2002, pp 233–246.
28. Reisinger SJ, Ryan PB, O’Hara DJ, Powel GE, Painter JL, Pat-tishall EN, Morris JA. Development and evaluation of a common data model enabling active drug safety surveillance using dispa-rate healthcare databases. J Am Med Inform Assoc. 2010. https ://doi.org/10.1136/jamia .2009.00247 7.
29. Zhou X, Murugesan S, Bhullar H, Liu Q, Cai B, Wentworth C, Bate A. An evaluation of the THIN database in the OMOP com-mon data model for active drug safety surveillance. Drug Saf. 2013. https ://doi.org/10.1007/s4026 4-012-0009-3.
30. Makadia R, Ryan PB (2014) Transforming the premier perspec-tive hospital database into the observational medical outcomes partnership (OMOP) common data model. EGEMS (Washington, DC). https ://doi.org/10.13063 /2327-9214.1110.
31. Vassiliadis P, Simitsis A, Skiadopoulos S. Conceptual modeling for ETL processes. In: Proceedings of the 8th ACM international workshop on Data warehousing and OLAP. ACM; 2002, pp 14–21.
32. Trujillo J, Luján-Mora S (2003) A UML based approach for mod-eling ETL processes in data warehouses. In: International confer-ence on conceptual modeling. Berlin: Springer, pp 307–20.
33. IQVIA. THIN-HES data linkage. 2016. https ://www.iqvia .com/locat ions/uk-and-irela nd/thin-hes-data. Accessed 28 Sep 2018.
34. Herrett E, Gallagher AM, Bhaskaran K, Forbes H, Mathur R, van Staa T, Smeeth L. Data resource profile: clinical practice research datalink (CPRD). Int J Epidemiol. 2015;44:827–36.
35. Wolf A, Dedman D, Campbell J, Booth H, Lunn D, Chapman J, Myles P. Data resource profile: clinical Practice Research Datalink (CPRD) Aurum. Int J Epidemiol. 2019;48:1740–1740g.
36. Horsfall L, Walters K, Petersen I. Identifying periods of accept-able computer usage in primary care research databases. Pharma-coepidemiol Drug Saf. 2013;22:64–9.
37. Maguire A, Blak BT, Thompson M. The importance of defin-ing periods of complete mortality reporting for research using automated data from primary care. Pharmacoepidemiol Drug Saf. 2009;18:76–83.
38. Okhotin A. Recursive descent parsing for Boolean grammars. Acta Inform. 2007;44:167–89.
39. Hopcroft JE, Motwani R, Ullman JD. Introduction to automata theory, languages, and computation, 2nd edition. ACM SIGACT News; 2001. https ://doi.org/10.1145/56843 8.56845 5.
40. Toulis KA, Willis BH, Marshall T, Kumarendran B, Gokhale K, Ghosh S, Thomas GN, Cheng KK, Narendran P, Hanif W. All-cause mortality in patients with diabetes under treatment with dapagliflozin: a population-based, open-cohort study in THIN database. J Clin Endocrinol Metab. 2017;102(5):1719–25.
41. Tracy A, Subramanian A, Adderley NJ, Cockwell P, Ferro C, Ball S, Harper L, Nirantharakumar K. Cardiovascular, thromboem-bolic and renal outcomes in IgA vasculitis (Henoch–Schönlein purpura): a retrospective cohort study using routinely collected primary care data. Ann Rheum Dis. 2019;78:261–9.
42. Chandan JS, Thomas T, Lee S, Marshall T, Willis B, Niranthara-kumar K, Gill P. The association between idiopathic thrombocy-topenic purpura and cardiovascular disease: a retrospective cohort study. J Thromb Haemost. 2018. https ://doi.org/10.1111/jth.13940 .
43. Chandan JS, Thomas T, Bradbury-Jones C, Russell R, Bandyo-padhyay S, Nirantharakumar K, Taylor J. Female survivors of intimate partner violence and risk of depression, anxiety and seri-ous mental illness. Br J Psychiatry 1–6. 2019.
44. Chandan JS, Thomas T, Gokhale KM, Bandyopadhyay S, Taylor J, Nirantharakumar K. The burden of mental ill health associ-ated with childhood maltreatment in the UK, using The Health Improvement Network database: a population-based retrospective cohort study. Lancet Psychiatry. 2019;6:926–34.
45. Lund JL, Richardson DB, Stürmer T. The active comparator, new user study design in pharmacoepidemiology: historical foundations and contemporary application. Curr Epidemiol Rep. 2015;2:221–8.
46. Suissa S, Moodie EEM, Dell’Aniello S. Prevalent new-user cohort designs for comparative drug effect studies by time-conditional propensity scores. Pharmacoepidemiol Drug Saf. 2017;26:459–68.
47. Lévesque LE, Hanley JA, Kezouh A, Suissa S. Problem of immor-tal time bias in cohort studies: example using statins for prevent-ing progression of diabetes. BMJ. 2010;340:b5087.
48. Information Commissioners Office. The Principles | ICO. In: ICO. 2018. https ://ico.org.uk/for-organ isati ons/guide -to-data-prote ction /guide -to-the-gener al-data-prote ction -regul ation -gdpr/princ iples /. Accessed 8 Mar 2020.
49. Dafoulas GE, Toulis KA, Mccorry D, Kumarendran B, Thomas GN, Willis BH, Gokhale K, Gkoutos G, Narendran P, Niran-tharakumar K. Type 1 diabetes mellitus and risk of incident epilepsy: a population-based, open-cohort study. Diabetologia. 2017;60:258–61.
50. McCorry D, Nicolson A, Smith D, Marson A, Feltbower RG, Chadwick DW. An association between type 1 diabetes and idi-opathic generalized epilepsy. Ann Neurol. 2006;59:204–6.
51. O’Connell MA, Harvey AS, Mackay MT, Cameron FJ. Does epi-lepsy occur more frequently in children with Type 1 diabetes? J Paediatr Child Health. 2008;44:586–9.
52. Mancardi MM, Striano P, Giannattasio A, et al. Type 1 dia-betes and epilepsy: more than a casual association? Epilepsia. 2010;51:320–1.
53. Chou I-C, Wang C-H, Lin W-D, Tsai F-J, Lin C-C, Kao C-H. Risk of epilepsy in type 1 diabetes mellitus: a population-based cohort study. Diabetologia. 2016;59:1196–203.
54. Neligan A, Sander JW. The incidence and prevalence of epilepsy. London: UCL Institute of Neurology; 2009.
55. Adderley NJ, Ryan R, Nirantharakumar K, Marshall T. Prevalence and treatment of atrial fibrillation in UK general practice from 2000 to 2016. Heart. 2019;105:27–33.
56. Zinman B, Wanner C, Lachin JM, et al. Empagliflozin, cardiovas-cular outcomes, and mortality in type 2 diabetes. N Engl J Med. 2015;373:2117–28.
57. Kosiborod M, Cavender MA, Fu AZ, et al. Lower risk of heart failure and death in patients initiated on sodium-glucose

178 K. M. Gokhale et al.
1 3
cotransporter-2 inhibitors versus other glucose-lowering drugs. Circulation. 2017;136:249–59.
58. Health Data Research UK | HDR UK. https ://www.hdruk .ac.uk/. Accessed 22 May 2019.
59. Health Data Research UK. The Hubs | HDR UK. 2019. https ://www.hdruk .ac.uk/infra struc ture/the-hubs/. Accessed 8 Mar 2020.
60. Peng RD, Dominici F, Zeger SL. Reproducible epidemiologic research. Am J Epidemiol. 2006;163:783–9.
61. Easterbrook PJ, Berlin JA, Gopalan R, Matthews DR. Publication bias in clinical research. Lancet (Lond Engl). 1991;337:867–72.
Publisher’s Note Springer Nature remains neutral with regard to jurisdictional claims in published maps and institutional affiliations.