Embed Size (px)
Citation preview
Philip ThigoLead, Data & Innovation
Executive Office of the Deputy President
@pthigo
REPUBLIC OF KENYA
Data for the
Global Goals
&
National Priorities

Two big global challenges for the current state of
data:
1. Invisibility (gaps in what we know from
data, and when we find out)
2. Inequality (gaps between those who with
and without information, and what they
need to know make their own decisions)
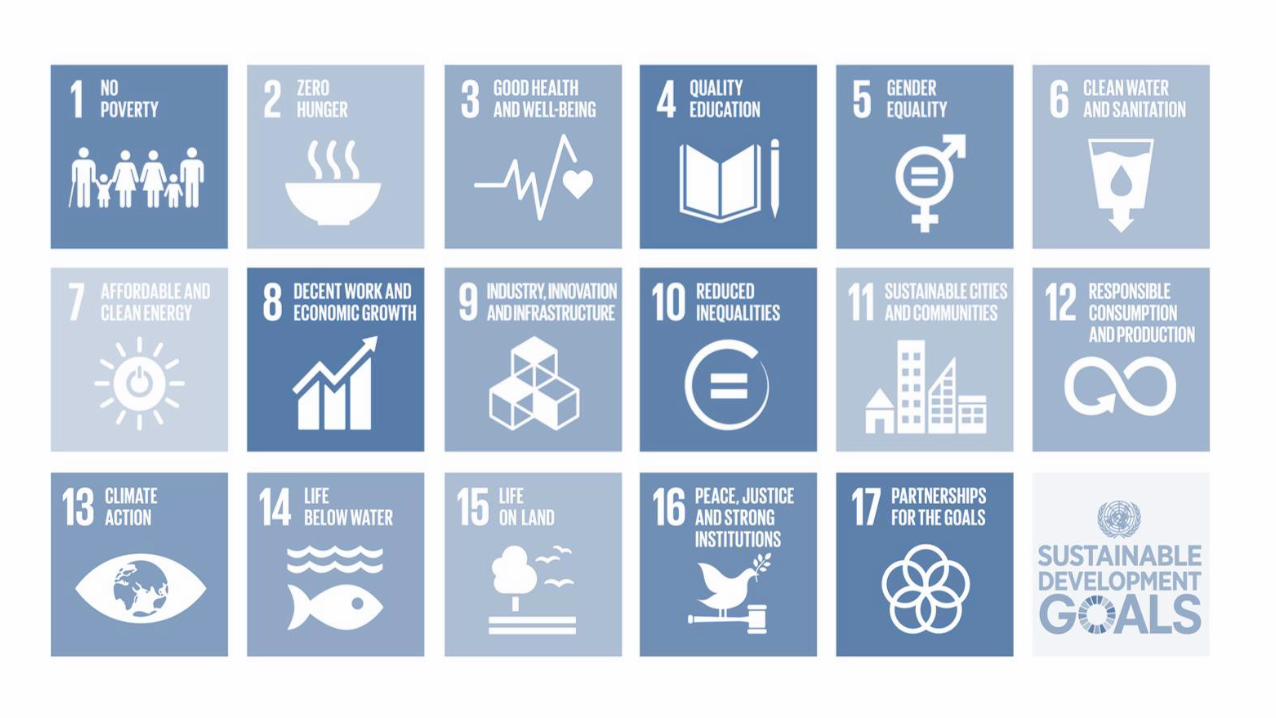
3. Complexity: 17 Goals, 169
Targets, 230 Indicators
Data Challenges
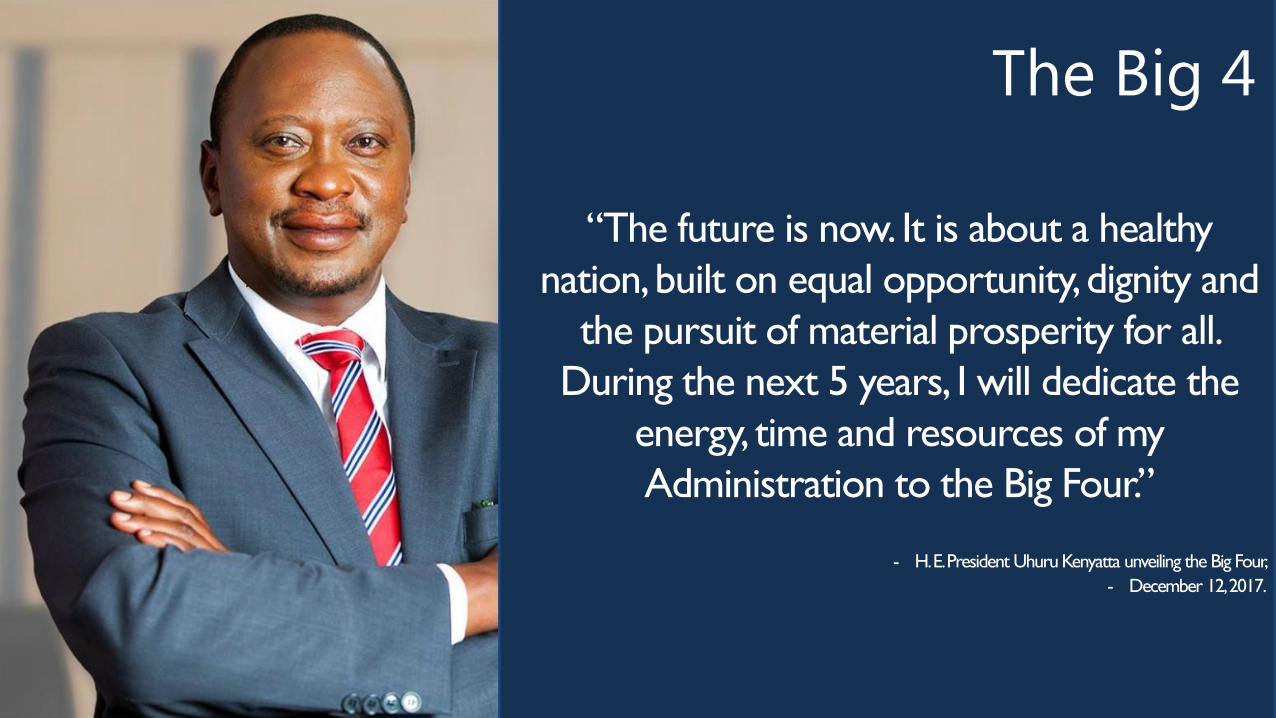
“The future is now. It is about a healthy
nation, built on equal opportunity, dignity and
the pursuit of material prosperity for all.
During the next 5 years, I will dedicate the
energy, time and resources of my
Administration to the Big Four.”
- H. E. President Uhuru Kenyatta unveiling the Big Four,
- December 12, 2017.
The Big 4
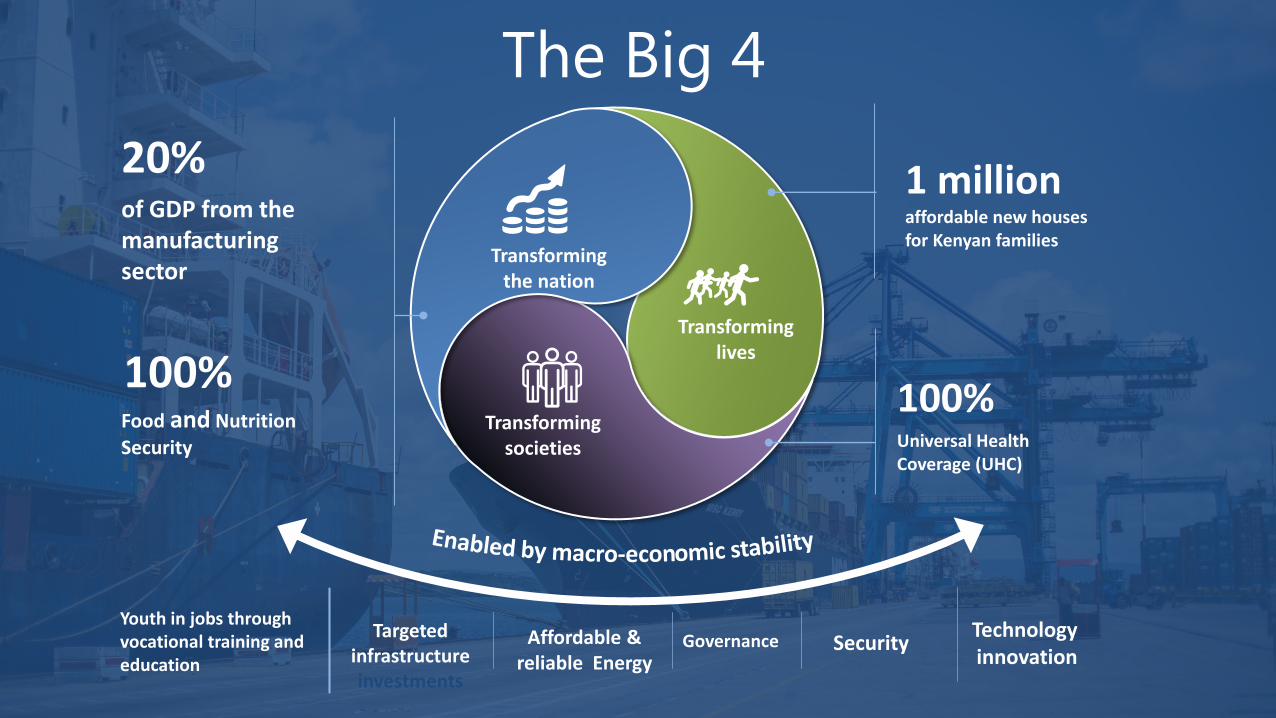
20%of GDP from the manufacturing sector
1 million affordable new houses for Kenyan families
Transforming societies
Transforming the nation
Transforming lives
100% Universal Health Coverage (UHC)
Affordable & reliable Energy
SecurityTechnology innovation
Targeted infrastructure investments
GovernanceYouth in jobs through vocational training and education
Food and Nutrition
Security
100%
The Big 4
“You never change things by fighting the existing reality. To change something,
build a new model that makes the existing model obsolete.”
- Buckminster Fuller
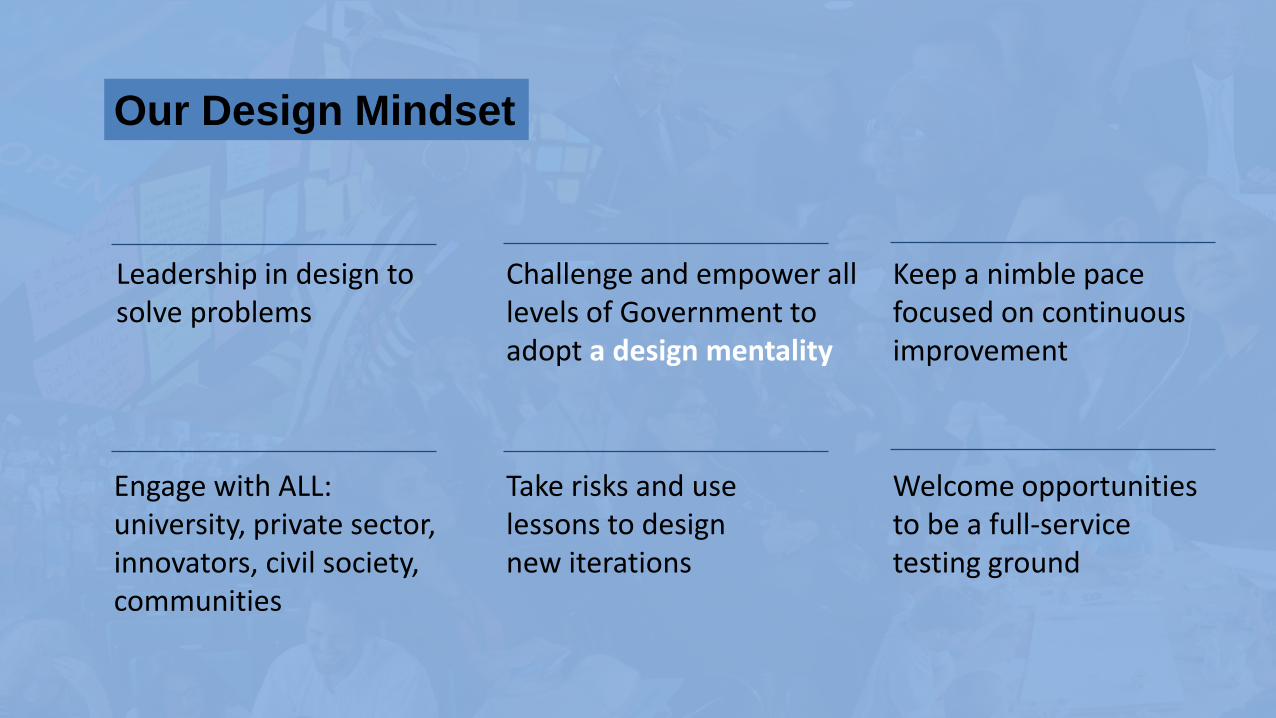
Our Design Mindset
Leadership in design to solve problems
Challenge and empower all levels of Government to adopt a design mentality
Take risks and use lessons to designnew iterations
Keep a nimble pace focused on continuous improvement
Engage with ALL: university, private sector, innovators, civil society, communities
Welcome opportunities to be a full-service testing ground
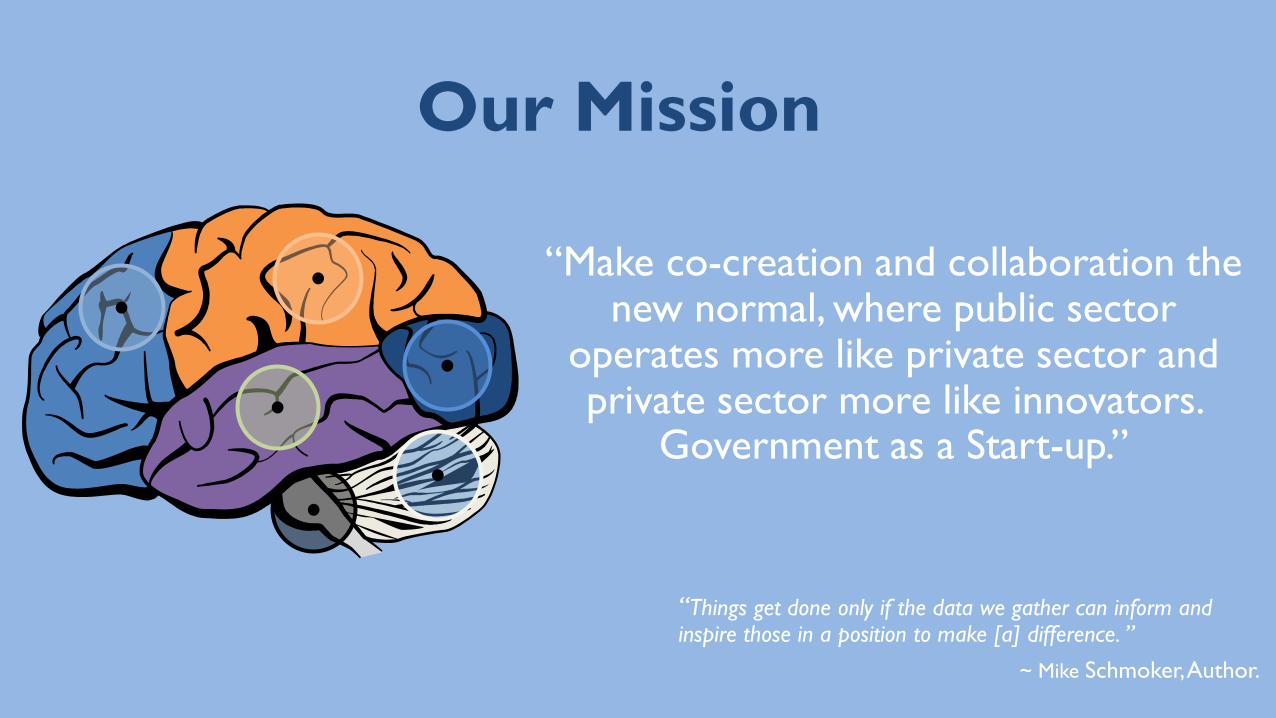
“Make co-creation and collaboration the new normal, where public sector
operates more like private sector and private sector more like innovators.
Government as a Start-up.”
“Things get done only if the data we gather can inform and inspire those in a position to make [a] difference. ”
~ Mike Schmoker, Author.
Our Mission
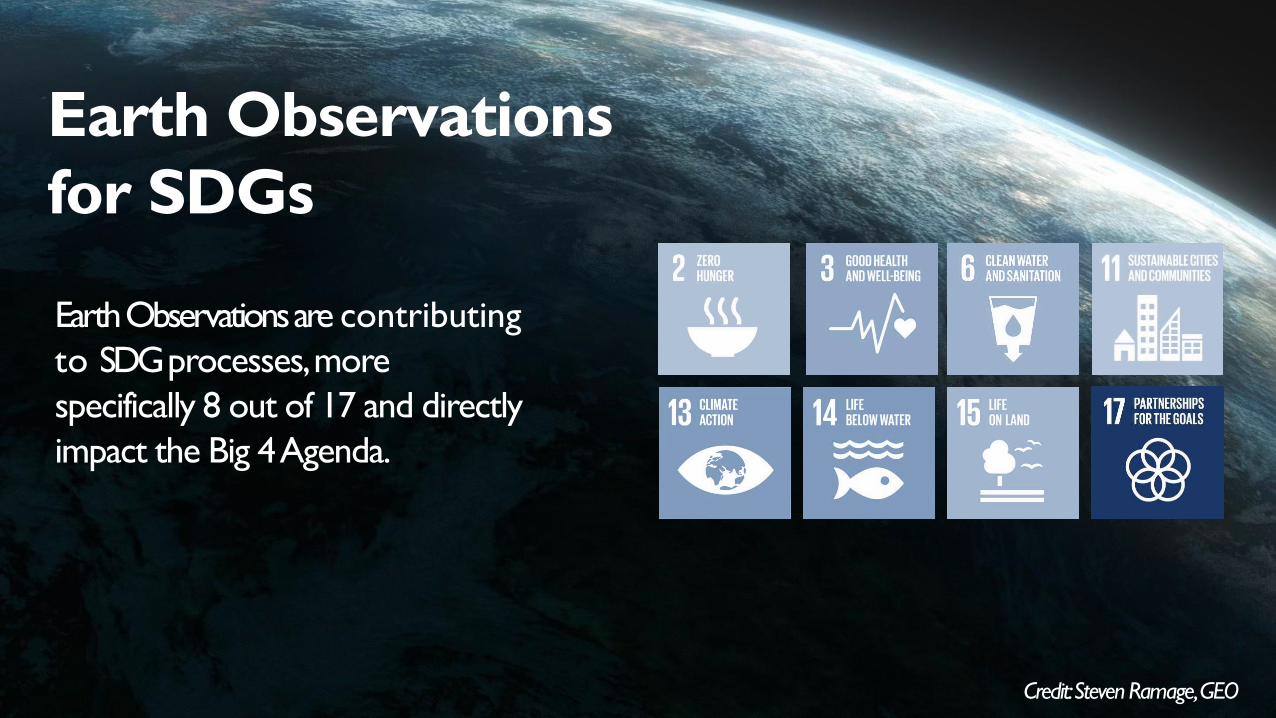
Earth Observations
for SDGs
Earth Observations are contributing
to SDG processes, more
specifically 8 out of 17 and directly
impact the Big 4 Agenda.
Credit: Steven Ramage, GEO
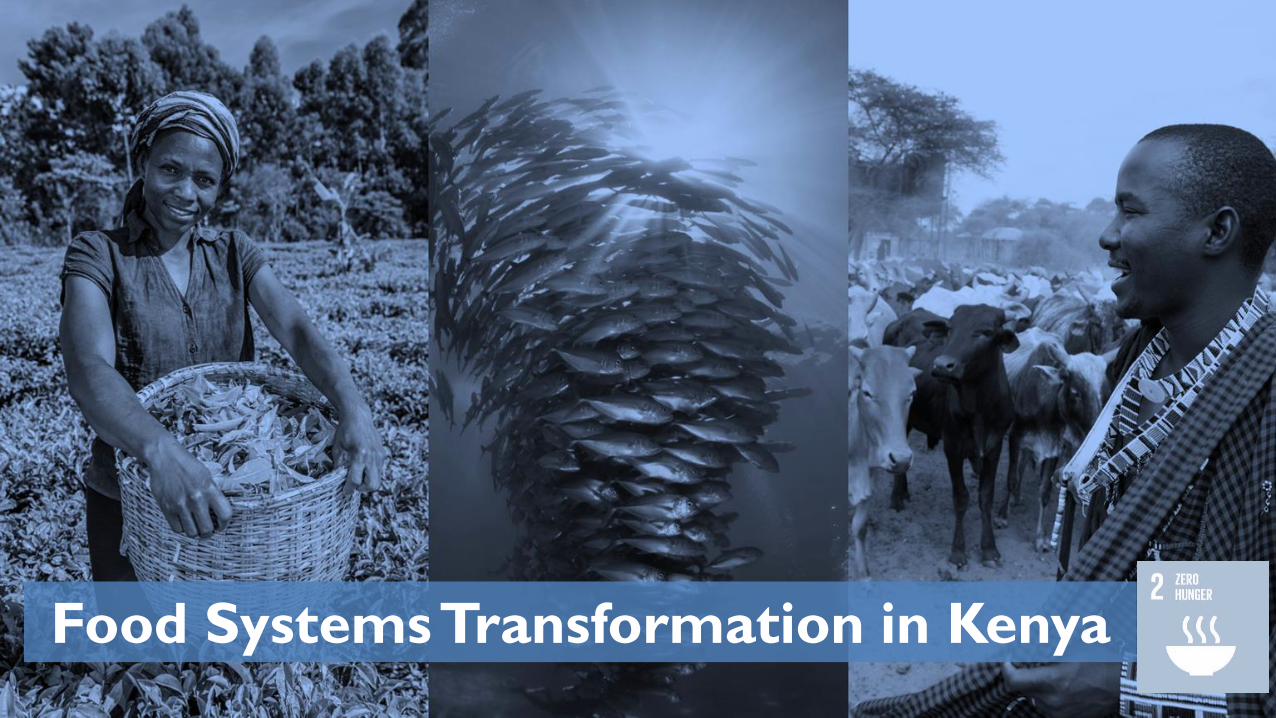
Food Systems Transformation in Kenya
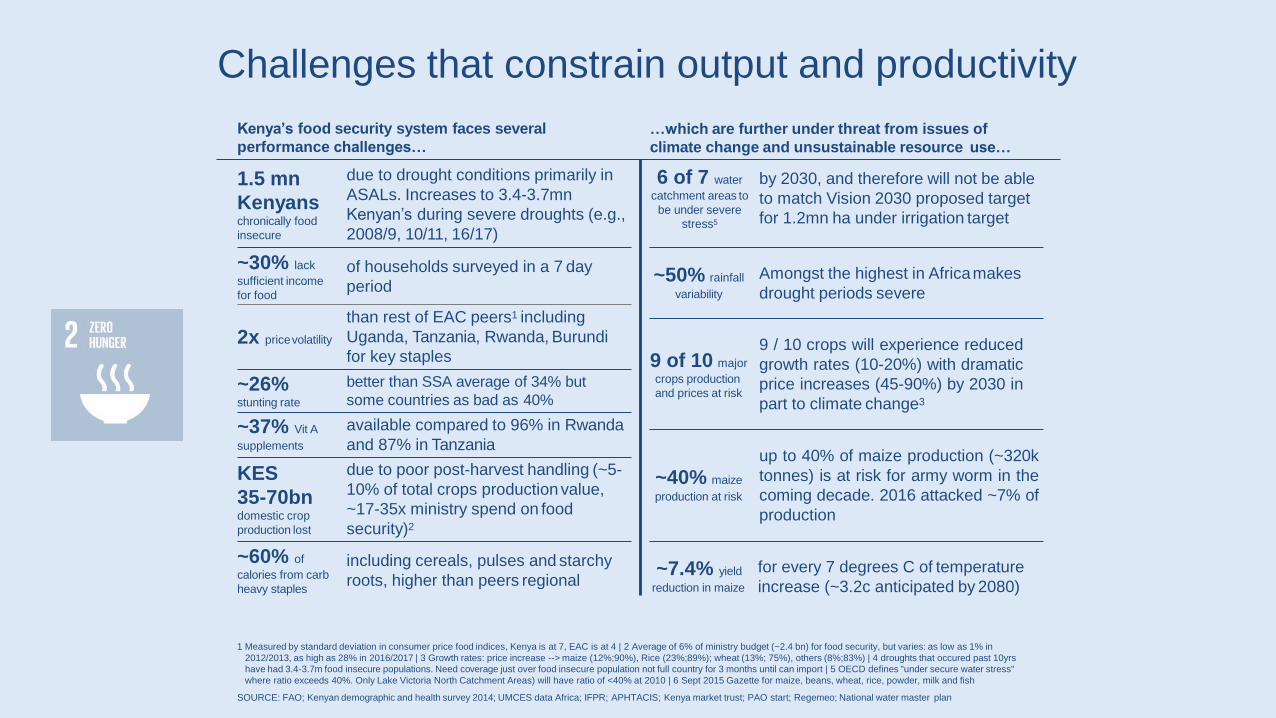
Challenges that constrain output and productivity
SOURCE: FAO; Kenyan demographic and health survey 2014; UMCES data Africa; IFPR; APHTACIS; Kenya market trust; PAO start; Regemeo; National water master plan
1 Measured by standard deviation in consumer price food indices, Kenya is at 7, EAC is at 4 | 2 Average of 6% of ministry budget (~2.4 bn) for food security, but varies: as low as 1% in
2012/2013, as high as 28% in 2016/2017 | 3 Growth rates: price increase --> maize (12%;90%), Rice (23%;89%); wheat (13%; 75%), others (8%;83%) | 4 droughts that occured past 10yrs
have had 3.4-3.7m food insecure populations. Need coverage just over food insecure population not full country for 3 months until can import | 5 OECD defines "under secure water stress"
where ratio exceeds 40%. Only Lake Victoria North Catchment Areas) will have ratio of <40% at 2010 | 6 Sept 2015 Gazette for maize, beans, wheat, rice, powder, milk and fish
Kenya’s food security system faces several
performance challenges…
…which are further under threat from issues of
climate change and unsustainable resource use…
by 2030, and therefore will not be able
to match Vision 2030 proposed target
for 1.2mn ha under irrigation target
6 of 7 water
catchment areas to
be under severe
stress5
Amongst the highest in Africamakes
drought periods severe~50% rainfall
variability
9 / 10 crops will experience reduced
growth rates (10-20%) with dramatic
price increases (45-90%) by 2030 in
part to climate change3
9 of 10 major
crops production
and prices at risk
up to 40% of maize production (~320k
tonnes) is at risk for army worm in the
coming decade. 2016 attacked ~7% of
production
~40% maize
production at risk
for every 7 degrees C of temperature
increase (~3.2c anticipated by 2080)~7.4% yield
reduction in maize
due to drought conditions primarily in
ASALs. Increases to 3.4-3.7mn
Kenyan’s during severe droughts (e.g.,
2008/9, 10/11, 16/17)
1.5 mn
Kenyanschronically food
insecure
of households surveyed in a 7 day
period
~30% lack
sufficient income
for food
than rest of EAC peers1 including
Uganda, Tanzania, Rwanda, Burundi
for key staples2x pricevolatility
better than SSA average of 34% but
some countries as bad as 40%~26%stunting rate
available compared to 96% in Rwanda
and 87% in Tanzania~37% Vit A
supplements
due to poor post-harvest handling (~5-
10% of total crops production value,
~17-35x ministry spend on food
security)2
KES
35-70bndomestic crop
production lost
including cereals, pulses and starchy
roots, higher than peers regional
~60% of
calories from carb
heavy staples
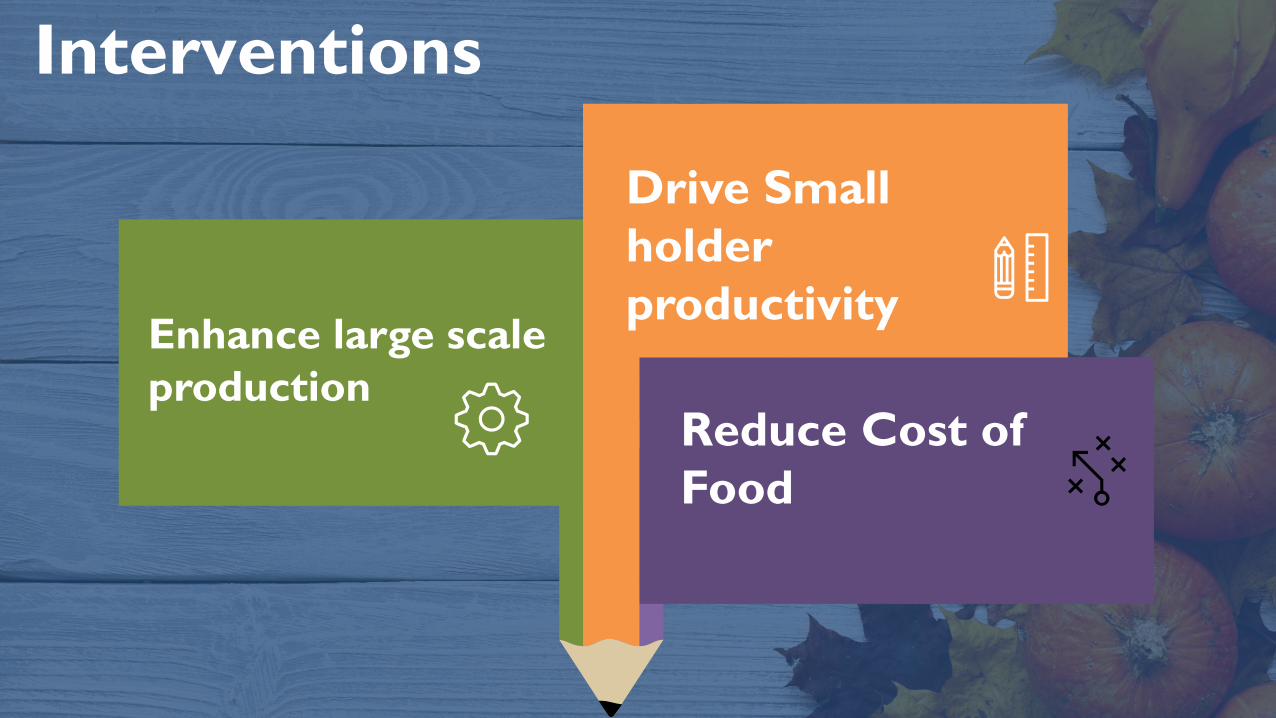
Drive Small
holder
productivity
Reduce Cost of
Food
Enhance large scale
production
Interventions
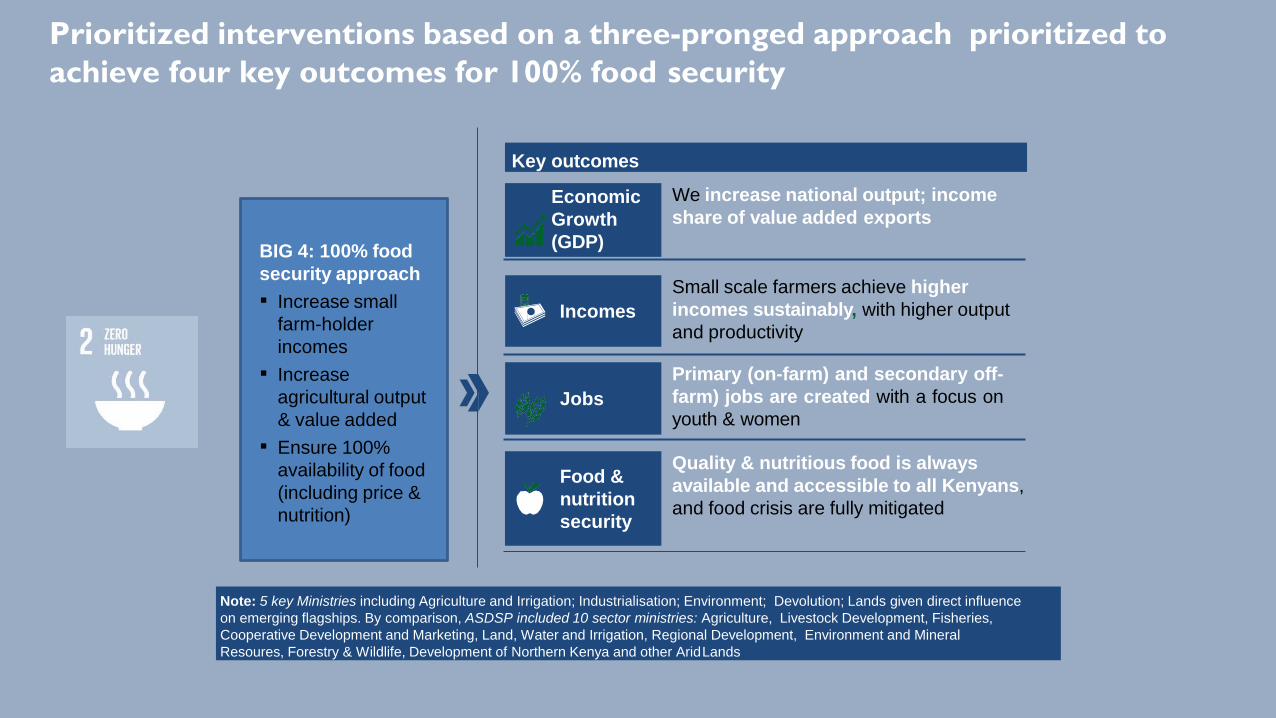
Prioritized interventions based on a three-pronged approach prioritized to
achieve four key outcomes for 100% food security
Key outcomes
Small scale farmers achieve higher
incomes sustainably, with higher output
and productivity
Primary (on-farm) and secondary off-
farm) jobs are created with a focus on
youth & women
We increase national output; income
share of value added exports
Quality & nutritious food is always
available and accessible to all Kenyans,
and food crisis are fully mitigated
Jobs
Economic
Growth
(GDP)
Incomes
Food &
nutrition
security
Note: 5 key Ministries including Agriculture and Irrigation; Industrialisation; Environment; Devolution; Lands given direct influence
on emerging flagships. By comparison, ASDSP included 10 sector ministries: Agriculture, Livestock Development, Fisheries,
Cooperative Development and Marketing, Land, Water and Irrigation, Regional Development, Environment and Mineral
Resoures, Forestry & Wildlife, Development of Northern Kenya and other AridLands
BIG 4: 100% food
security approach
▪ Increase small
farm-holder
incomes
▪ Increase
agricultural output
& value added
▪ Ensure 100%
availability of food
(including price &
nutrition)
10
0%
Fo
od
an
d N
utr
itio
n S
ecu
rity
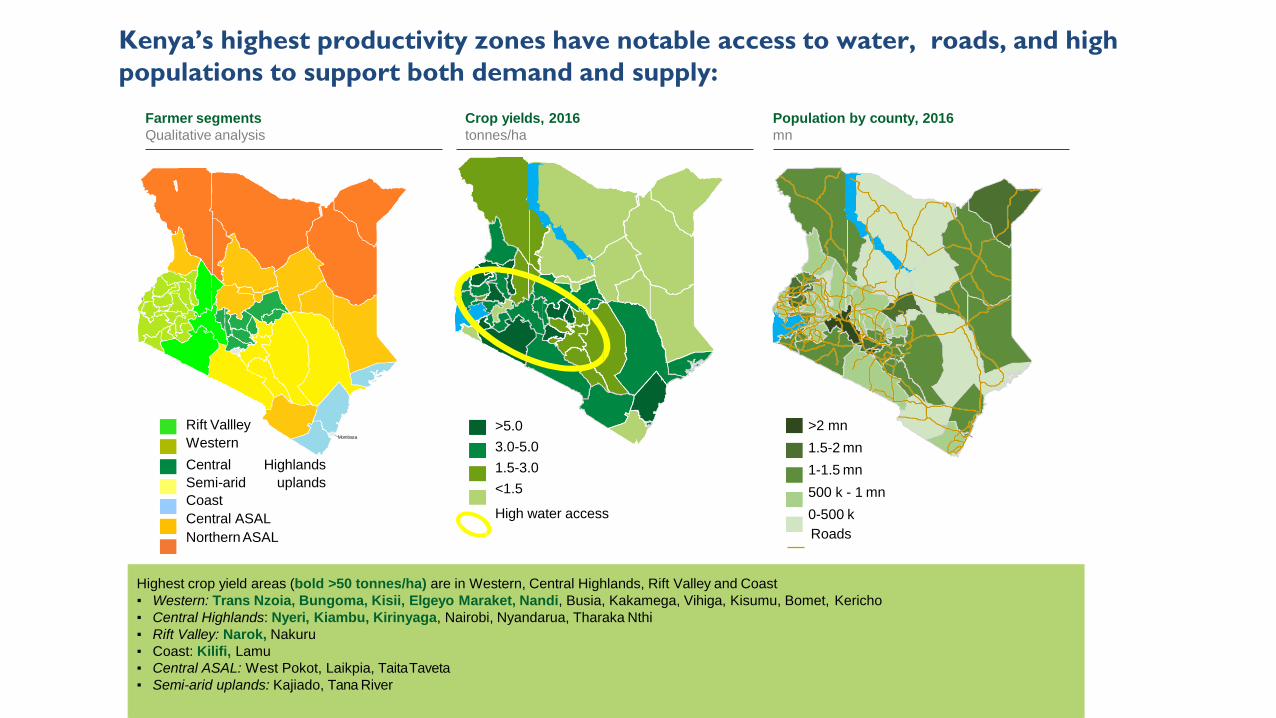
Kenya’s highest productivity zones have notable access to water, roads, and high
populations to support both demand and supply:
Population by county, 2016
mn
Crop yields, 2016
tonnes/ha
Farmer segments
Qualitative analysis
Turkana
Marsabit
Mandera
W ajir
Garissa
Lamu
Tana River
Kilifi
KwaleMombasa
Taita-Taveta
Kitui
Makueni
Kajiado
Narok
Samburu
Meru
Isiolo
W est
Pokot
Bungoma
BusiaKakamega
MigoriKismiiiraBomet
KisumuSiaya VihigaNandi
Uasin
Gishu
Trans Elgeyo- Nzoia
Marakwet
Baringo
Laikipia
Nyan- Tharaka-Kericho Nakurudarua NyeriKirin- Nithi
Homa Bay Nya- Embuyaga
Machakos
Kiambu
Nairobi
Murang’a
Rift Vallley
Western
Central Highlands
Semi-arid uplands
Coast
Central ASAL
NorthernASAL
Highest crop yield areas (bold >50 tonnes/ha) are in Western, Central Highlands, Rift Valley and Coast
▪ Western: Trans Nzoia, Bungoma, Kisii, Elgeyo Maraket, Nandi, Busia, Kakamega, Vihiga, Kisumu, Bomet, Kericho
▪ Central Highlands: Nyeri, Kiambu, Kirinyaga, Nairobi, Nyandarua, Tharaka Nthi
▪ Rift Valley: Narok, Nakuru
▪ Coast: Kilifi, Lamu
▪ Central ASAL: West Pokot, Laikpia, TaitaTaveta
▪ Semi-arid uplands: Kajiado, Tana River
>5.0
3.0-5.0
1.5-3.0
<1.5
High water access
>2 mn
1.5-2 mn
1-1.5 mn
500 k - 1 mn
0-500 k
Roads
18
6
8
10
23
3
18
7
2024
1216
13
1719
27
26
14
15
34
5
911
21
4
2825
33
30
32
31
40
39
37
36
1
2
29
38
35
22
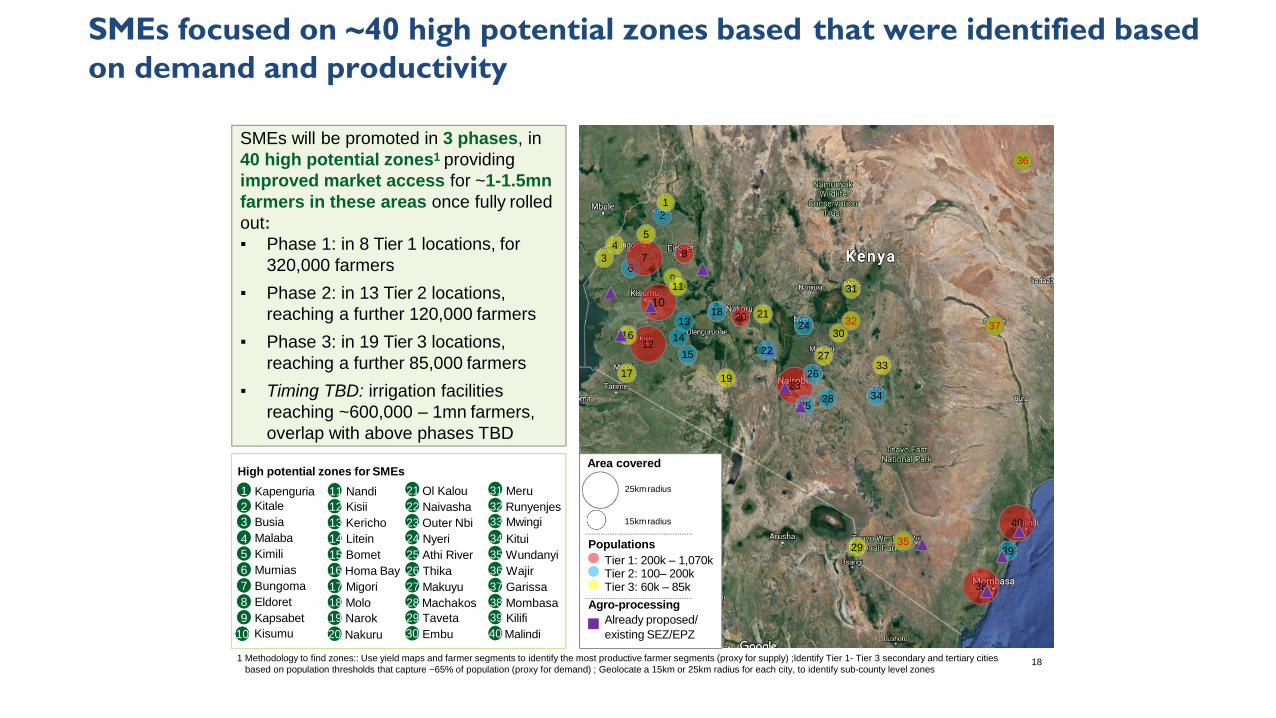
SMEs focused on ~40 high potential zones based that were identified based
on demand and productivity
1 Kapenguria 11 Nandi 21 Ol Kalou 31 Meru
2 Kitale 12 Kisii 22 Naivasha 32 Runyenjes
3 Busia 13 Kericho 23 Outer Nbi 33 Mwingi
4 Malaba 14 Litein 24 Nyeri 34 Kitui
5 Kimili 15 Bomet 25 Athi River 35 Wundanyi
6 Mumias 16 Homa Bay 26 Thika 36 Wajir
7 Bungoma 17 Migori 27 Makuyu 37 Garissa
8 Eldoret 18 Molo 28 Machakos 38 Mombasa
9 Kapsabet 19 Narok 29 Taveta 39 Kilifi
10 Kisumu 20 Nakuru 30 Embu 40 Malindi
Area covered
25kmradius
15kmradius
Populations
Tier 1: 200k – 1,070k Tier 2: 100– 200kTier 3: 60k – 85k
Agro-processing
Already proposed/
existing SEZ/EPZ
High potential zones for SMEs
SMEs will be promoted in 3 phases, in
40 high potential zones1 providing
improved market access for ~1-1.5mn
farmers in these areas once fully rolled
out:
▪ Phase 1: in 8 Tier 1 locations, for
320,000 farmers
▪ Phase 2: in 13 Tier 2 locations,
reaching a further 120,000 farmers
▪ Phase 3: in 19 Tier 3 locations,
reaching a further 85,000 farmers
▪ Timing TBD: irrigation facilities
reaching ~600,000 – 1mn farmers,
overlap with above phases TBD
1 Methodology to find zones:: Use yield maps and farmer segments to identify the most productive farmer segments (proxy for supply) ;Identify Tier 1- Tier 3 secondary and tertiary cities
based on population thresholds that capture ~65% of population (proxy for demand) ; Geolocate a 15km or 25km radius for each city, to identify sub-county level zones
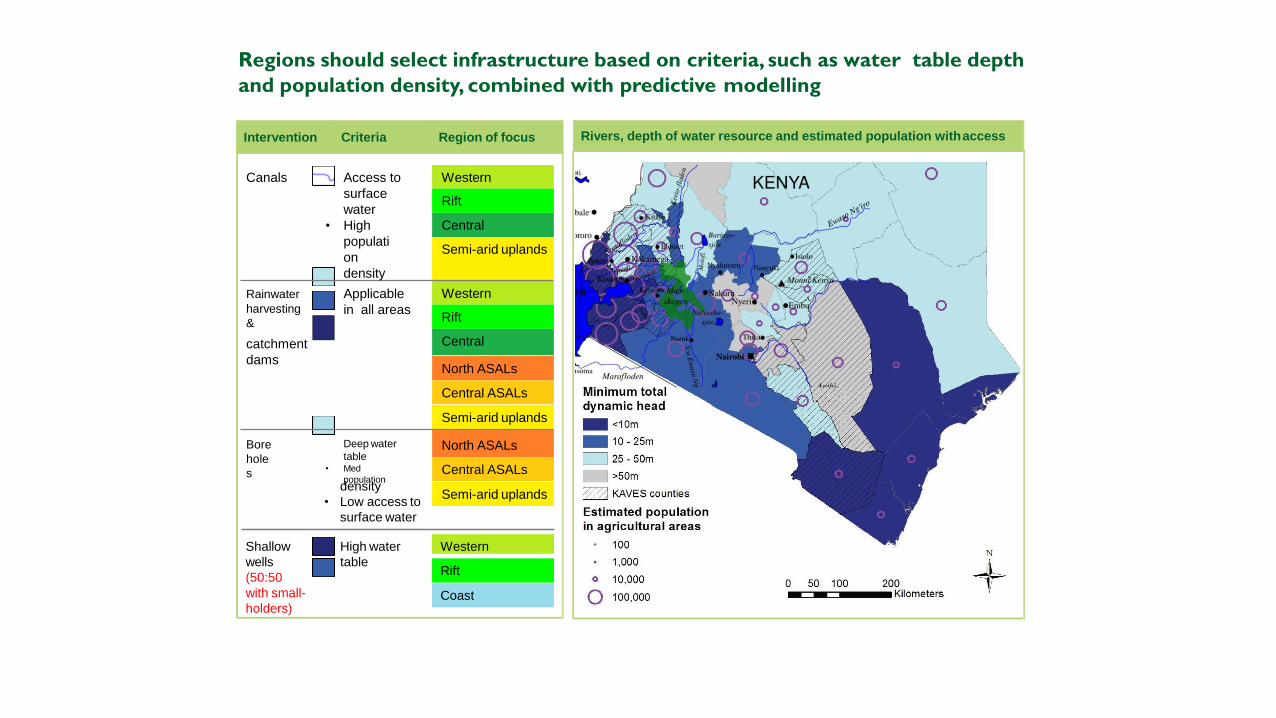
Regions should select infrastructure based on criteria, such as water table depth
and population density, combined with predictive modelling
Rivers, depth of water resource and estimated population withaccessIntervention Criteria Region of focus
•
•
•
density
• Low access to
surface water
Shallow
wells
(50:50
with small-
holders)
• High water
table
Western
Rift
Coast
Canals Access to
surface
water
• High
populati
on
density
Western
Rift
Central
Semi-arid uplands
Rainwater
harvesting
&
Applicable
in all areas
Western
Rift
Centralcatchment
damsNorth ASALs
Central ASALs
Semi-arid uplands
Bore
hole
s
Deep water
table• Med
population
North ASALs
Central ASALs
Semi-arid uplands
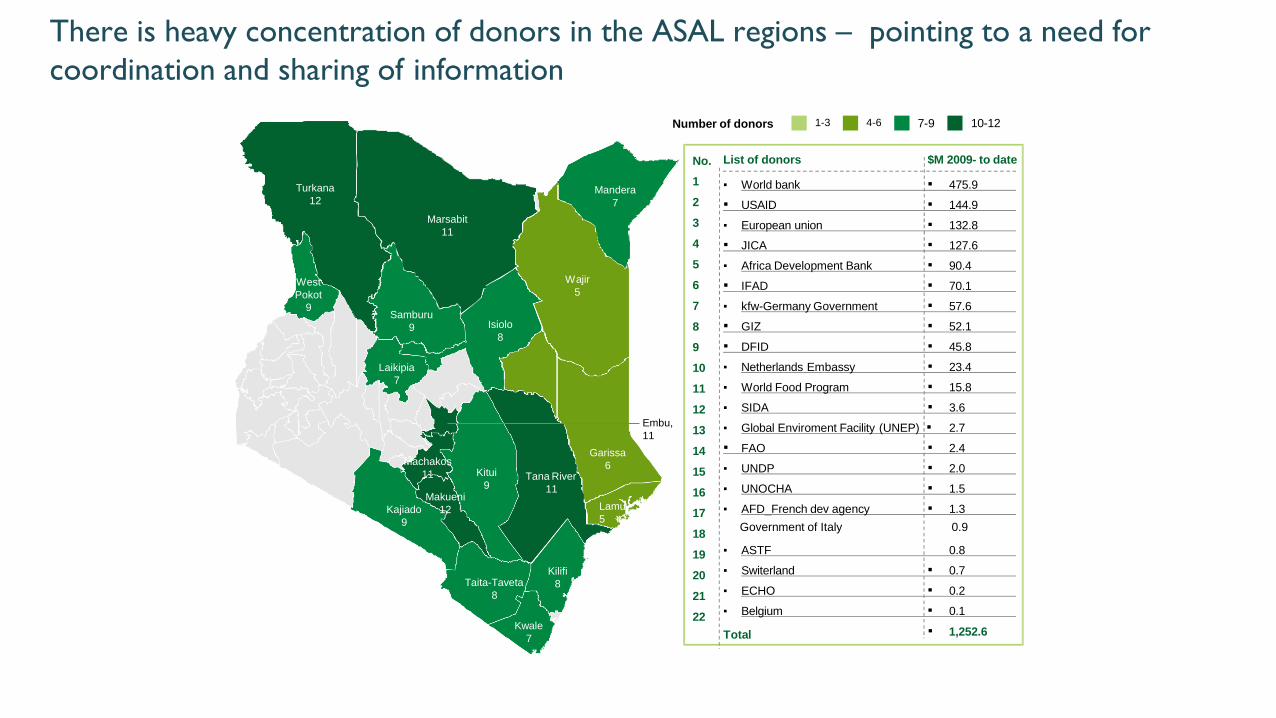
There is heavy concentration of donors in the ASAL regions – pointing to a need for
coordination and sharing of information
Turkana
12
Marsabit
11
Mandera
7
Wajir
5
Garissa
6
Lamu
5
Tana River
11
Kilifi
8Taita-Taveta
8
Kitui
9Makueni
12Kajiado
9
Samburu
9 Isiolo
8
West
Pokot
9
Laikipia
7
Embu,
11
Kwale
7
1-3 4-6 10-12Number of donors 7-9
Machakos
11
No.
1
2
3
4
5
6
7
8
9
10
11
12
13
14
15
16
17
18
19
20
21
22
List of donors $M 2009- to date
▪ World bank ▪ 475.9
▪ USAID ▪ 144.9
▪ European union ▪ 132.8
▪ JICA ▪ 127.6
▪ Africa Development Bank ▪ 90.4
▪ IFAD ▪ 70.1
▪ kfw-Germany Government ▪ 57.6
▪ GIZ ▪ 52.1
▪ DFID ▪ 45.8
▪ Netherlands Embassy ▪ 23.4
▪ World Food Program ▪ 15.8
▪ SIDA ▪ 3.6
▪ Global Enviroment Facility (UNEP) ▪ 2.7
▪ FAO ▪ 2.4
▪ UNDP ▪ 2.0
▪ UNOCHA ▪ 1.5
▪ AFD_French dev agency ▪ 1.3
Government of Italy 0.9
▪ ASTF 0.8
▪ Switerland ▪ 0.7
▪ ECHO ▪ 0.2
▪ Belgium ▪ 0.1
▪ 1,252.6Total
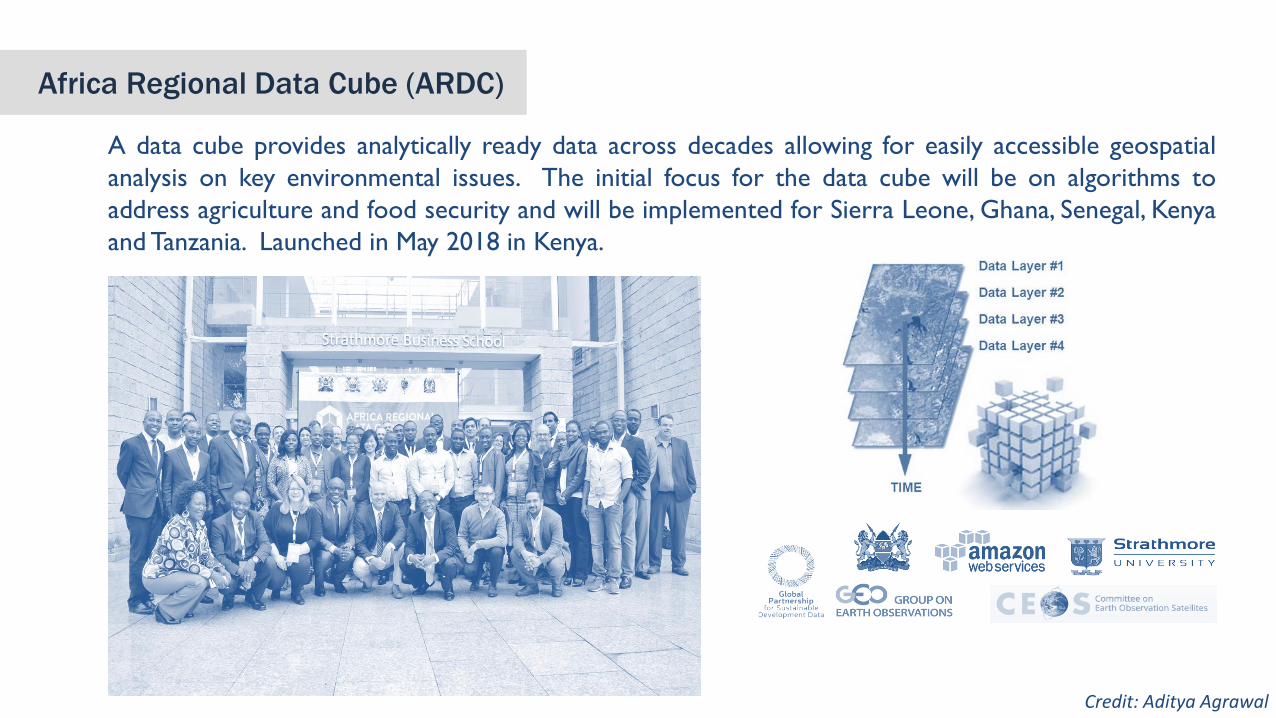
A data cube provides analytically ready data across decades allowing for easily accessible geospatial
analysis on key environmental issues. The initial focus for the data cube will be on algorithms to
address agriculture and food security and will be implemented for Sierra Leone, Ghana, Senegal, Kenya
and Tanzania. Launched in May 2018 in Kenya.
Africa Regional Data Cube (ARDC)
Credit: Aditya Agrawal

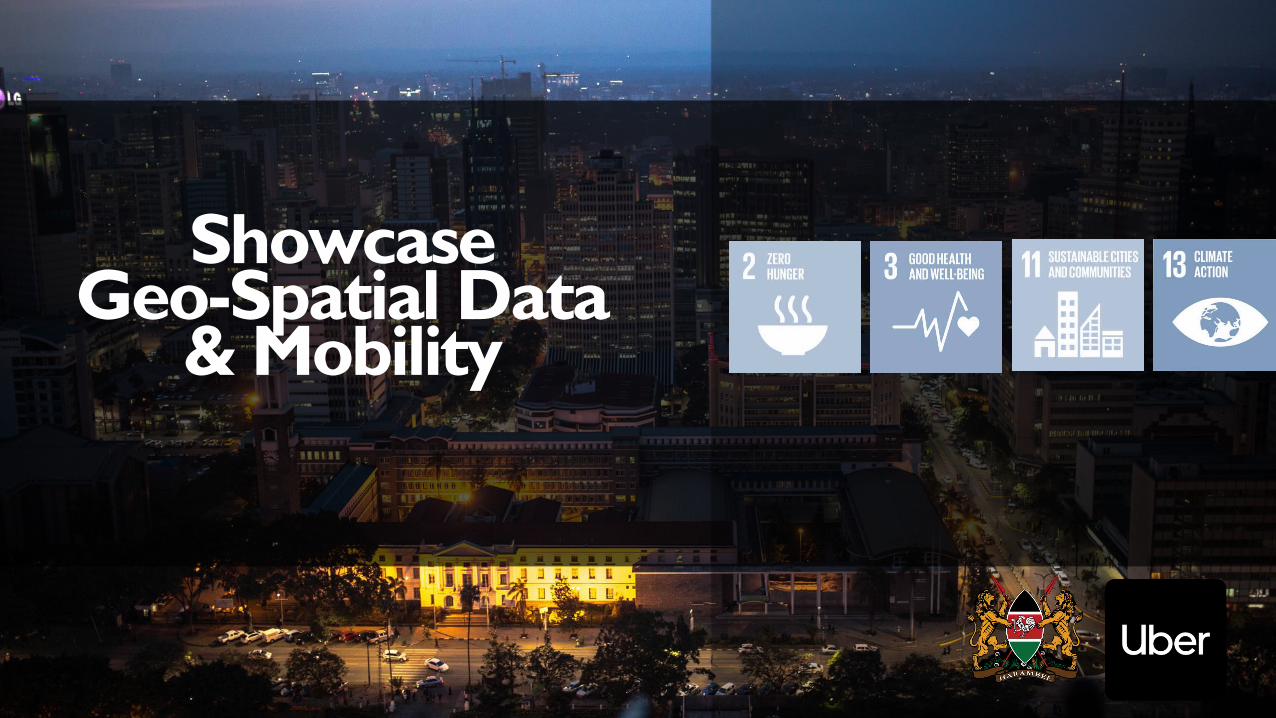
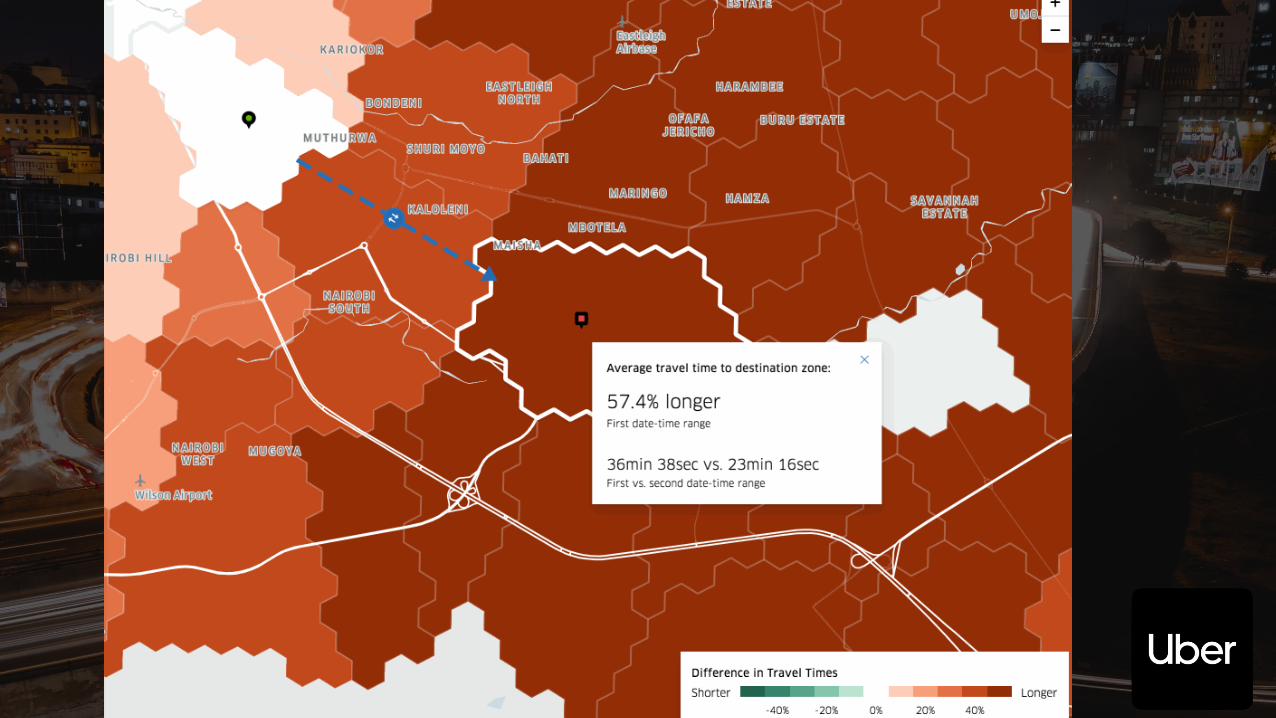
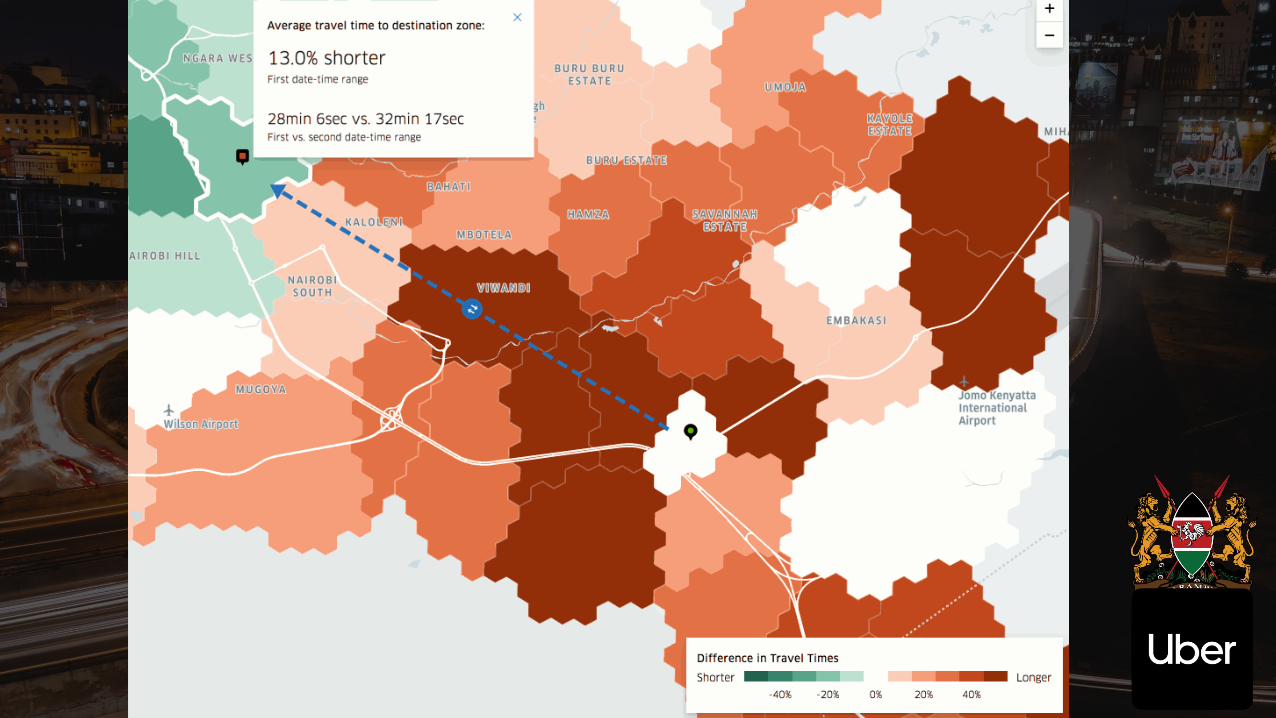
ShowcaseGeo-Spatial Data
& Mobility
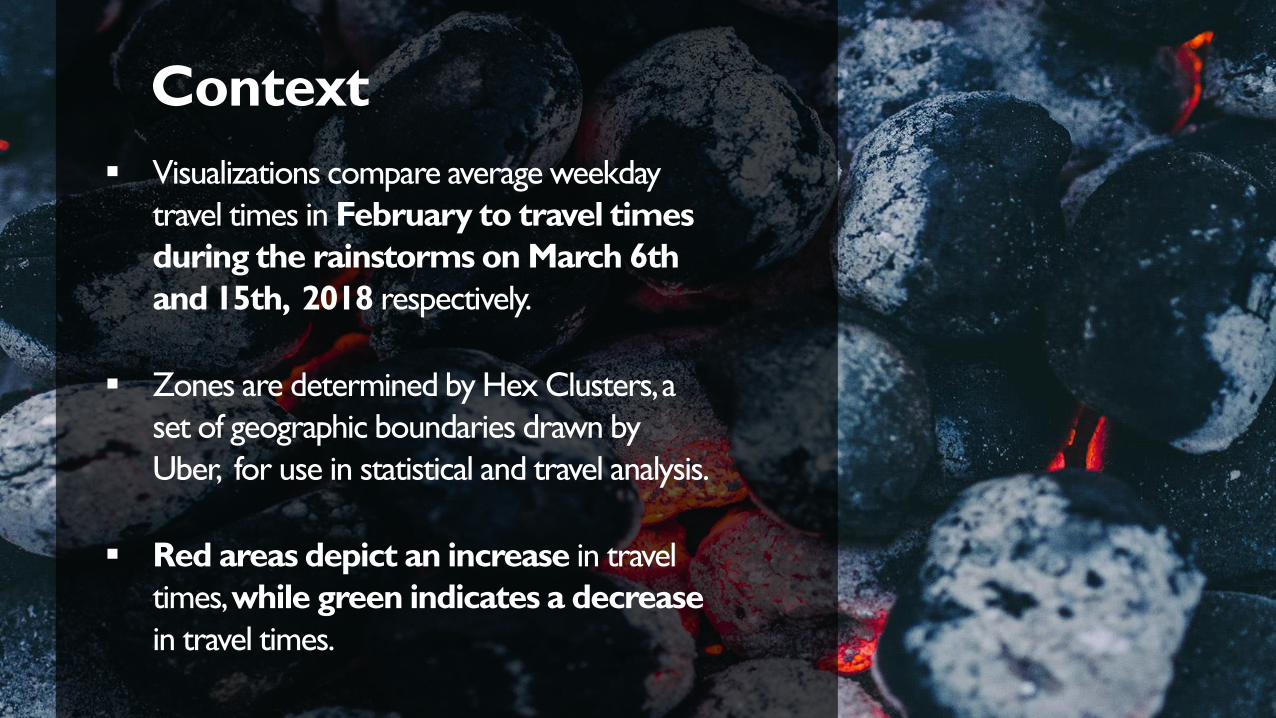
▪ Visualizations compare average weekday
travel times in February to travel times
during the rainstorms on March 6th
and 15th, 2018 respectively.
▪ Zones are determined by Hex Clusters, a
set of geographic boundaries drawn by
Uber, for use in statistical and travel analysis.
▪ Red areas depict an increase in travel
times, while green indicates a decrease
in travel times.
Context
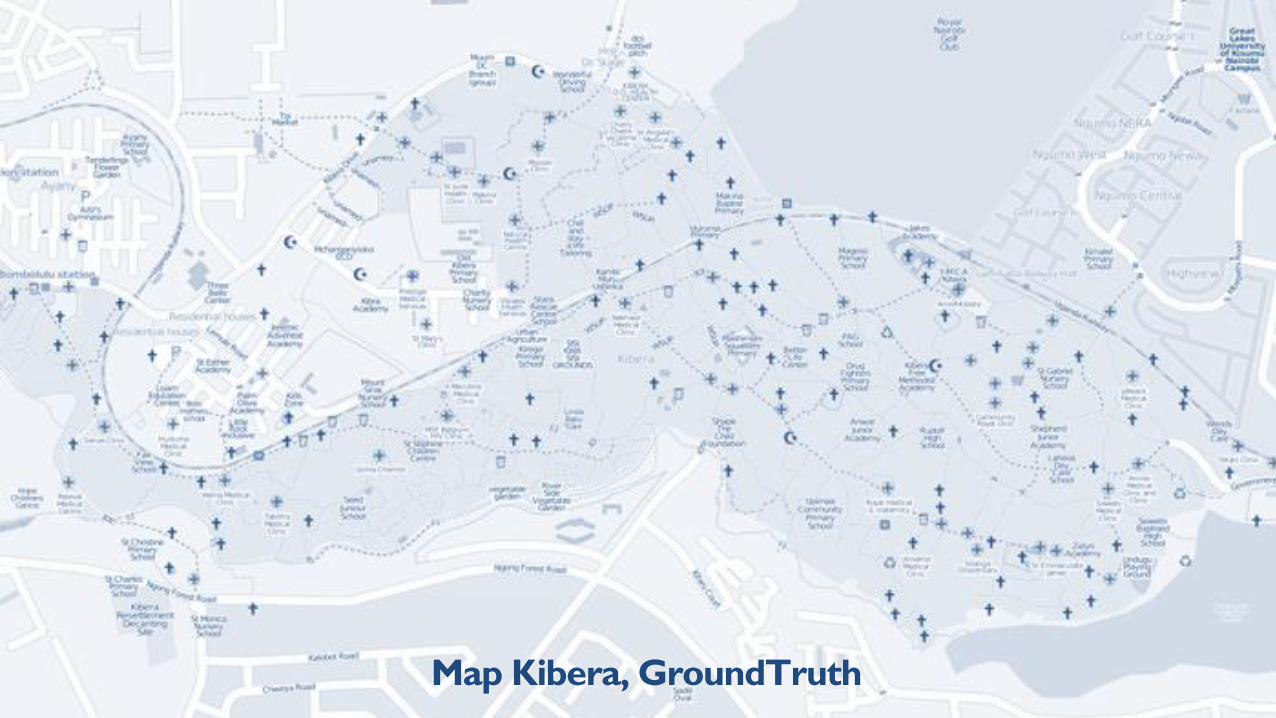
Map Kibera, GroundTruth
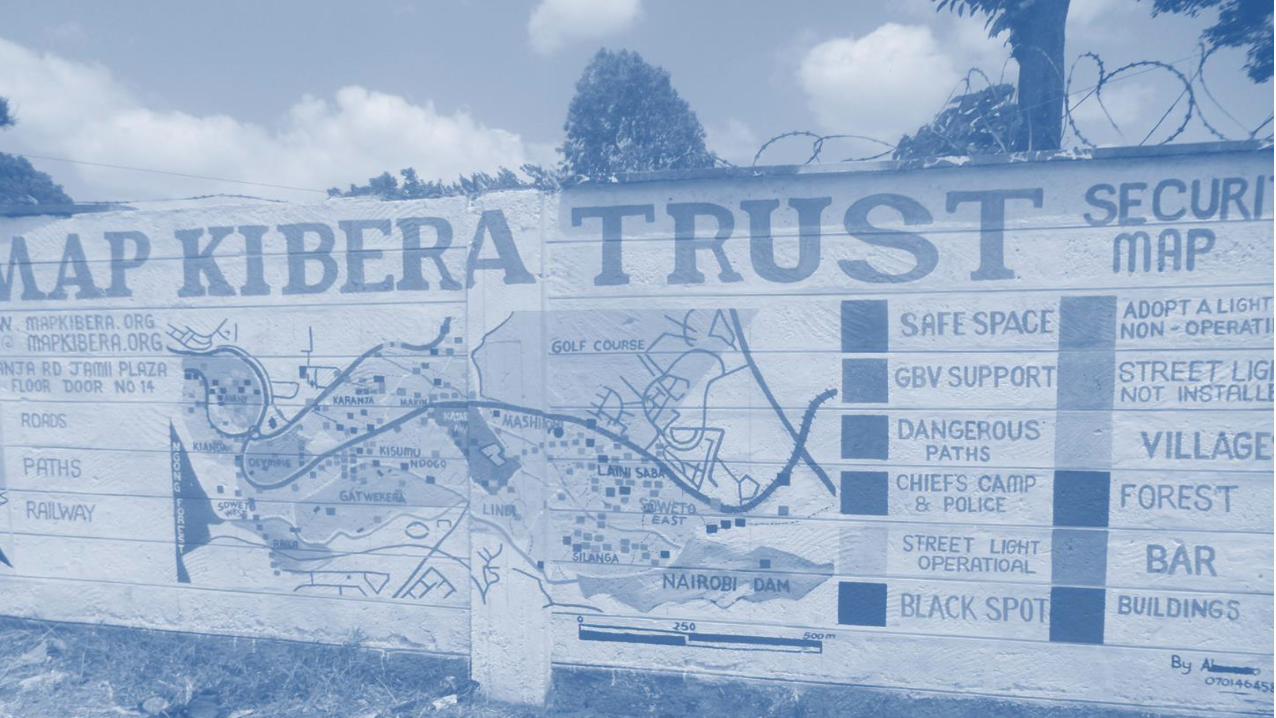
Map Kibera – Open Street Maps
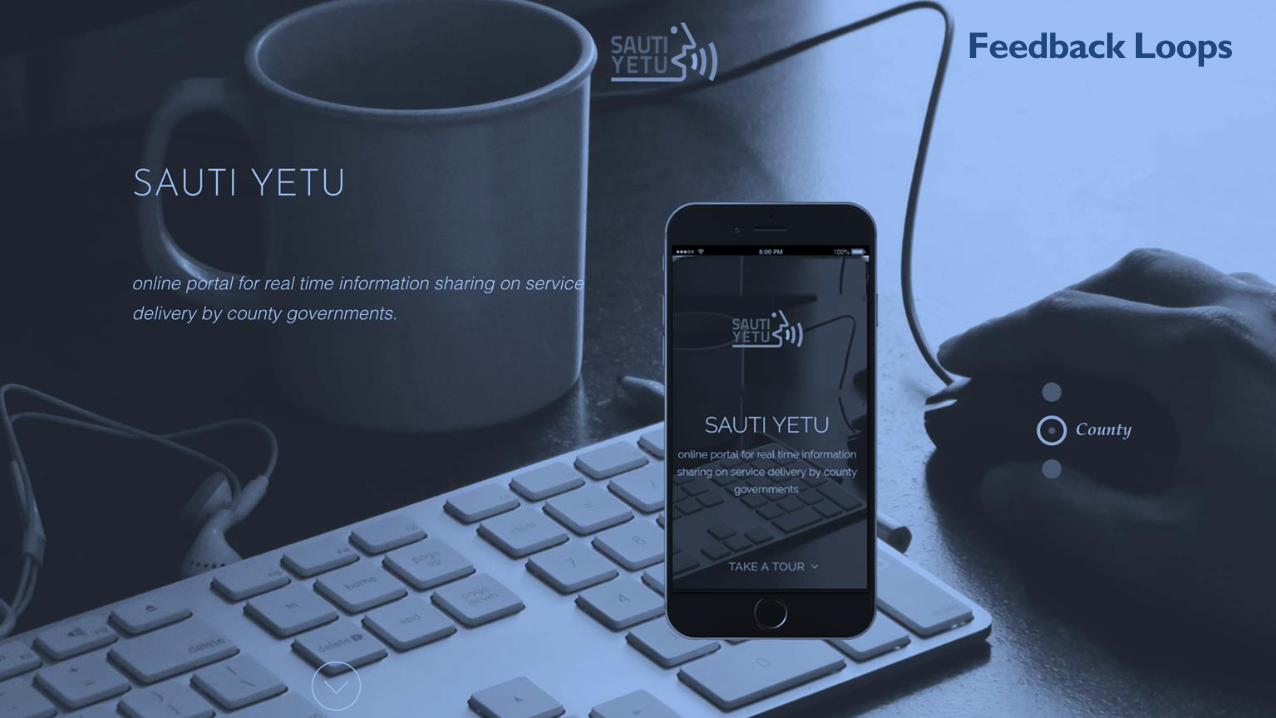
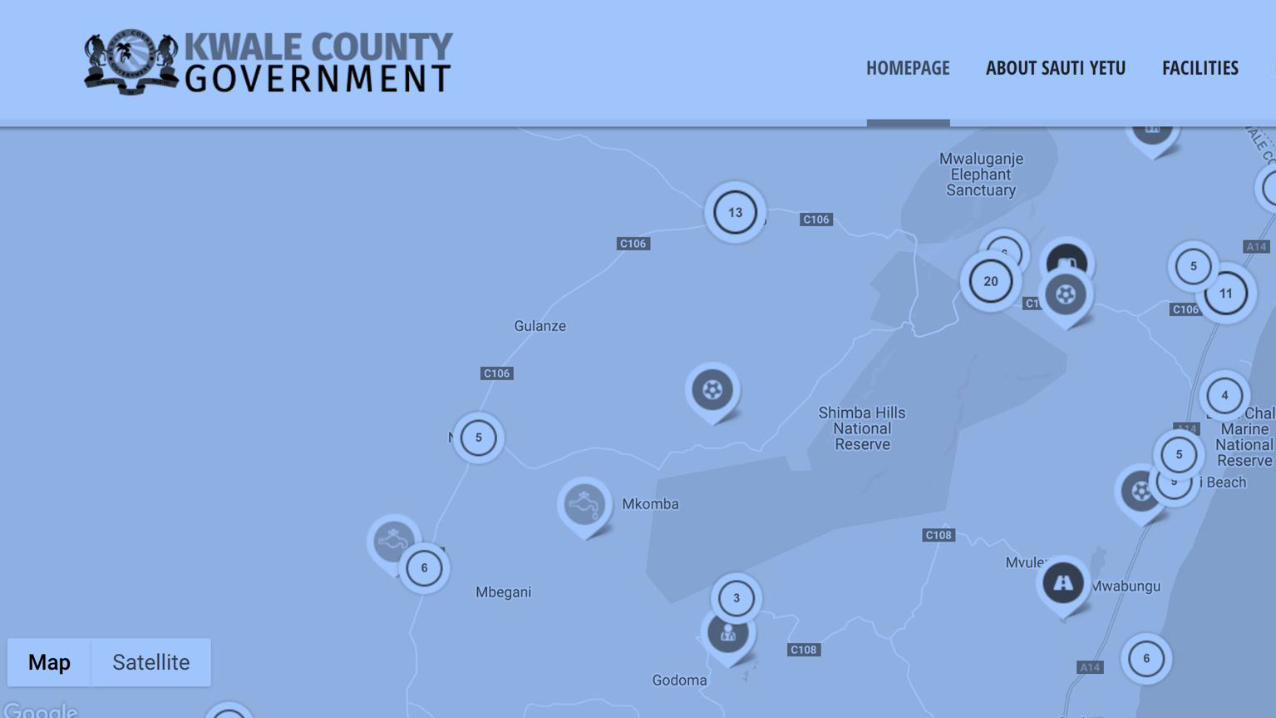
Feedback Loops

0
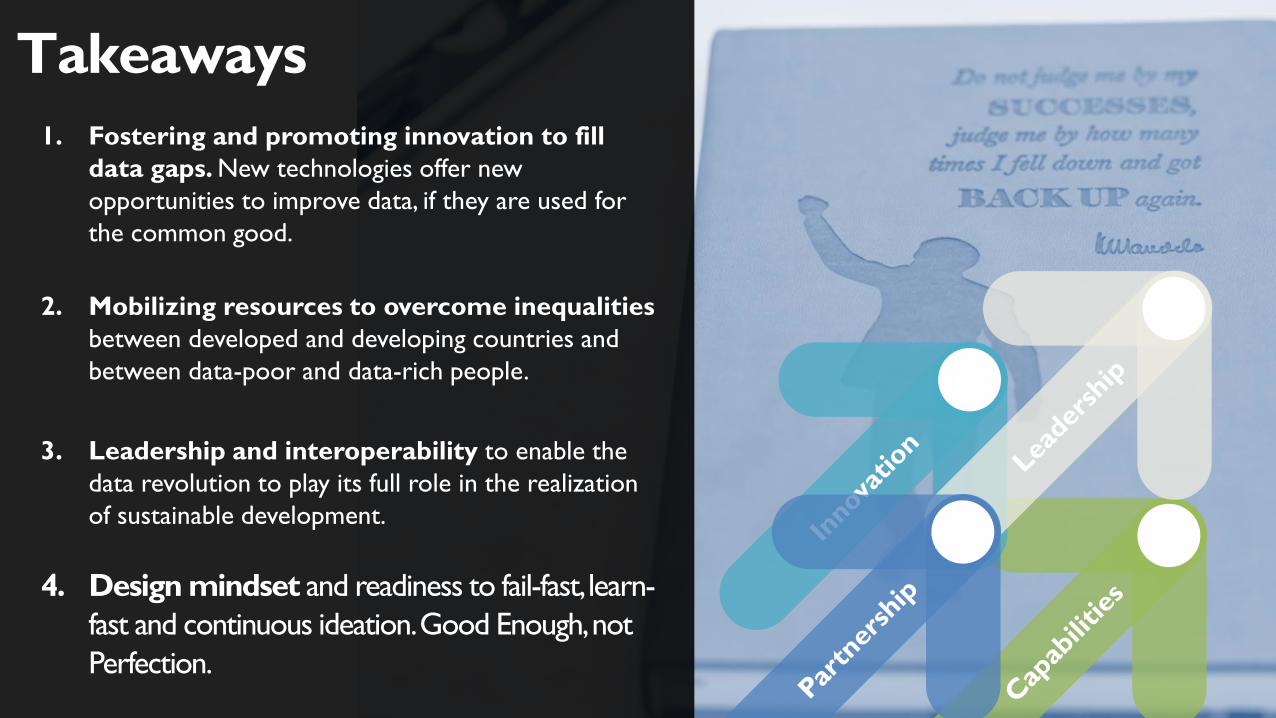
1. Fostering and promoting innovation to fill
data gaps. New technologies offer new
opportunities to improve data, if they are used for
the common good.
2. Mobilizing resources to overcome inequalities
between developed and developing countries and
between data-poor and data-rich people.
3. Leadership and interoperability to enable the
data revolution to play its full role in the realization
of sustainable development.
4. Design mindset and readiness to fail-fast, learn-
fast and continuous ideation. Good Enough, not
Perfection.
Takeaways


![WELCOME [ggim.un.org]ggim.un.org/meetings/GGIM-committee/9th-Session... · unggim.academicnetwork.org Building Technical Capacities for Resilience and Sustainability - Challenges](https://img.pdfslide.net/doc/110x75/5f722ed7fc8eb66790307bb1/welcome-ggimunorgggimunorgmeetingsggim-committee9th-session-building.jpg)