Embed Size (px)
Citation preview
Level 5: Invention Design Your Own Investigation
ObjectiveStudents will design an investigation into ocean acidification using real
data on conditions in the Caribbean study area. Students will use this real
data to try to answer a research question of their choosing. In reporting
the outcome of their research, students must state what they have learned
from the investigation, and use their findings to evaluate, explain, and
prove (or disprove) their hypothesis.
BackgroundCoral reefs are the foundation for complex food webs. Abundant algae,
sponges, coral, and other invertebrates form the base of the web. Small
fish feed along the reef and are, in turn, eaten by larger predatory fish.
The coral reefs also protect and support nearby ecosystems, such as
mangrove and sea grass ecosystems.
Ocean acidification is one of many threats to coral reefs and their
associated, fragile ecosystems. There are other threats to coral reefs
associated with global climate change. Rising sea surface temperatures
negatively affect coral reefs, as well as lead to rising sea levels. Warmer
ocean water also means more storms as well as storms with increased
intensity. These storms cause physical damage to the coral reefs.
Increased water temperature can cause coral bleaching and stress-related
disease, which also decrease the coral’s viability. These threats are in
addition to other human-caused threats to coral reef ecosystems, such as
pollution, overfishing, and runoff from cities and agriculture.
Understanding Ocean Acidification 56
SummaryGrade Level: 10 - 12
Teaching Time: Three 40
minute periods
Activity:
Design an investigation
using real data to examine
a hypothesis.
In this activity, students should be encouraged to develop their own
research questions and hypotheses. Here is one example:
Research question:
Does bicarbonate ion form at the same rate as carbonate ion
concentration and aragonite saturation in sea water?
Possible hypothesis:
Bicarbonate ion concentration increases as carbonate ion concentration
and aragonite saturation levels decrease over time.
ProcedureThis activity challenges students to think like scientists by designing a
scientific investigation in which data collection and analysis are
important parts of the process. Students are asked to use the scientific
method, using real data to solve a problem.
1. Students may work individually or in teams of two. Give each
student or team a copy of the Student Master, Design Your Own
Investigation and the Student Master, Data Log Sheet.
2. Guide student selection of a research question (or have them
make up their own) that is appropriate to their academic
experience. Review your students’ research question choices.
You may find it useful to have multiple students/teams exploring
the same research question using different or even the same
hypotheses.
3. Next, have students develop a plan for designing a research
project that will answer their research question. The plan should
include: 1) the research question; 2) a testable hypothesis that
addresses the research question; 3) a list of additional
information needed; and 4) a list of the data that will be
collected.
Understanding Ocean Acidification 57
Materials Copies of Student Master,
Design Your Own
Investigation
Copies of Student Master,
Data Log Sheet
Student access to
computers with Internet
connection
Spreadsheet software
(optional)
Graph paper
Ruler
4. Check each research project plan before students begin to make
sure that the project aligns with the research question and that
the hypothesis is testable using the data resources available. Will
your students be able to support or disprove their hypothesis
using the data available to them?
5. Students will need to access the Internet to generate and save
data maps and graphs. Depending on the setting, this can be done
in a computer lab or assigned as homework, assuming your
students have access to the Internet at home, at a library, or in a
computer center.
6. If students are using spreadsheet software, they may need
guidance on setting up their spreadsheet and graphs. Show
students that they can get raw data online to use in their
spreadsheet by choosing “Data file for spreadsheet” under
“Select an output format.”
7. After students complete their research, provide time for them to
present their findings to the class.
8. Use student presentations as an opportunity to relate their
investigations about ocean acidification to current news and
debate about global climate change. Ask: From your own
experience looking at real data, how do you view the question
ocean acidification? Is ocean acidification a real problem? Are
global climate change and ocean acidification related? Can
ocean acidification be addressed without addressing global
climate change? This discussion can form the basis of an
extension activity in which students explore the political and
social implications of ocean acidification.
Understanding Ocean Acidification 58
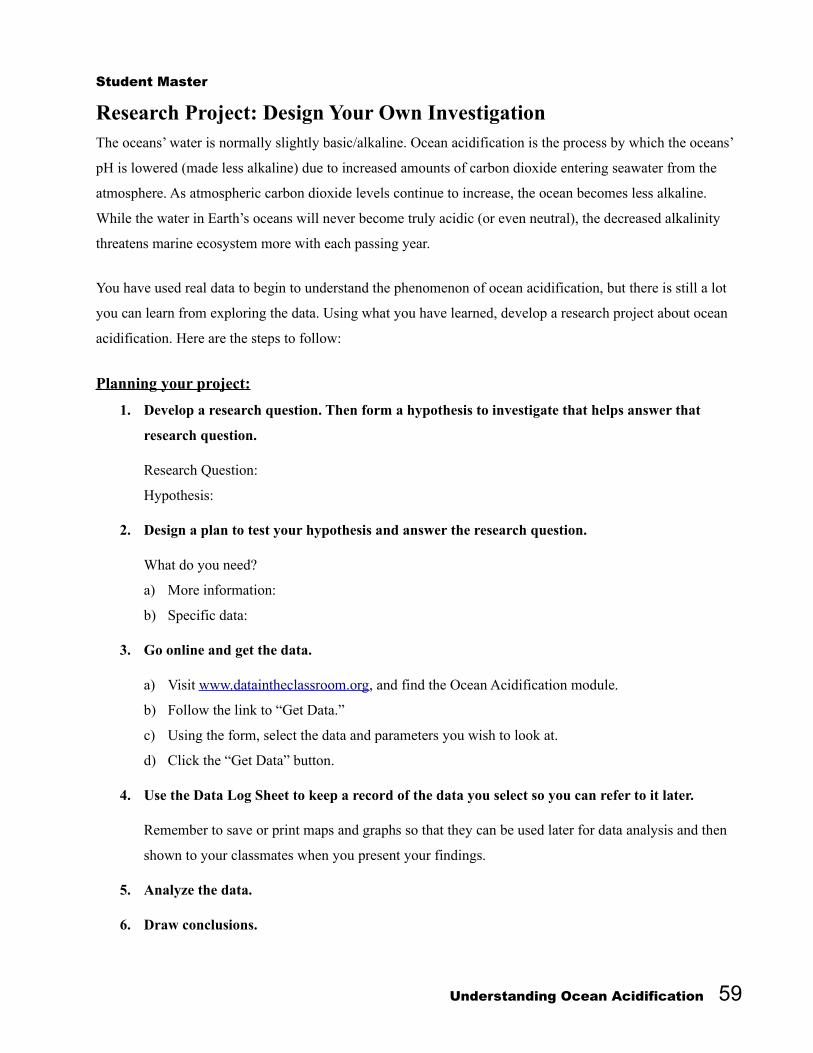
Student Master
Research Project: Design Your Own InvestigationThe oceans’ water is normally slightly basic/alkaline. Ocean acidification is the process by which the oceans’
pH is lowered (made less alkaline) due to increased amounts of carbon dioxide entering seawater from the
atmosphere. As atmospheric carbon dioxide levels continue to increase, the ocean becomes less alkaline.
While the water in Earth’s oceans will never become truly acidic (or even neutral), the decreased alkalinity
threatens marine ecosystem more with each passing year.
You have used real data to begin to understand the phenomenon of ocean acidification, but there is still a lot
you can learn from exploring the data. Using what you have learned, develop a research project about ocean
acidification. Here are the steps to follow:
Planning your project:
1. Develop a research question. Then form a hypothesis to investigate that helps answer that
research question.
Research Question:
Hypothesis:
2. Design a plan to test your hypothesis and answer the research question.
What do you need?
a) More information:
b) Specific data:
3. Go online and get the data.
a) Visit www.dataintheclassroom.org, and find the Ocean Acidification module.
b) Follow the link to “Get Data.”
c) Using the form, select the data and parameters you wish to look at.
d) Click the “Get Data” button.
4. Use the Data Log Sheet to keep a record of the data you select so you can refer to it later.
Remember to save or print maps and graphs so that they can be used later for data analysis and then
shown to your classmates when you present your findings.
5. Analyze the data.
6. Draw conclusions.
Understanding Ocean Acidification 59
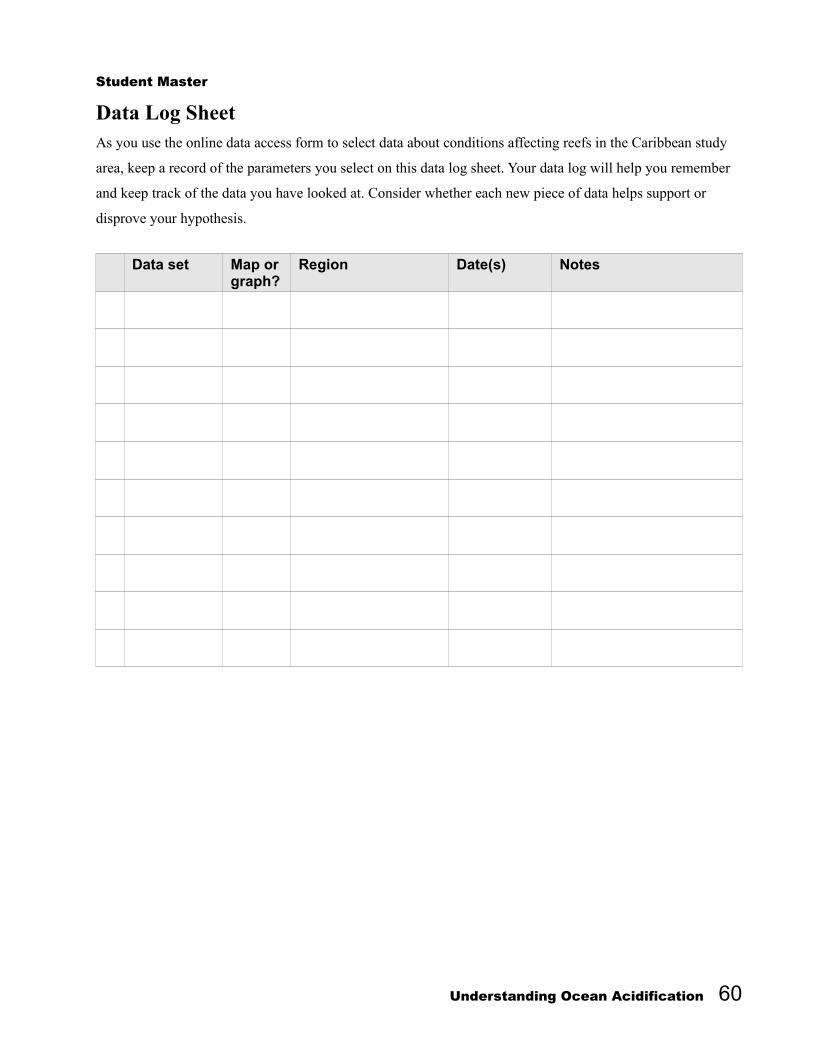
Student Master
Data Log SheetAs you use the online data access form to select data about conditions affecting reefs in the Caribbean study
area, keep a record of the parameters you select on this data log sheet. Your data log will help you remember
and keep track of the data you have looked at. Consider whether each new piece of data helps support or
disprove your hypothesis.
Data set Map or graph?
Region Date(s) Notes
Understanding Ocean Acidification 60