Embed Size (px)
Citation preview

NISTIR 7899
Data Logger Thermometers for Vaccine Temperature Monitoring
Michal Chojnacky Wyatt Miller
Gregory Strouse
http://dx.doi.org/10.6028/NIST.IR.7899

NISTIR 7899
Data Logger Thermometers for Vaccine Temperature Monitoring
Michal Chojnacky
Wyatt Miller Gregory Strouse
Sensor Science Division Physical Measurement Laboratory
http://dx.doi.org/10.6028/NIST.IR.7899
November 2012
U.S. Department of Commerce
Rebecca Blank, Acting Secretary
National Institute of Standards and Technology Patrick D. Gallagher, Under Secretary of Commerce for Standards and Technology and Director
1
ABSTRACT Complete and accurate records of vaccine temperature history are vital to preserving drug potency and patient safety, yet many vaccine providers do not use continuous temperature monitoring systems in their vaccine refrigerators. We evaluated the performance of seven digital data logger models for candidates as refrigerated vaccine temperature monitors, based on the following criteria: out-of-box performance and compliance with manufacturer accuracy specifications over the range of 0 °C to 10 °C; measurement stability over 6 to 18 months of continuous use; proper use in a vaccine storage refrigerator so that measurements reflect liquid vaccine temperatures; and practical methods for end-user validation and establishing metrological traceability. Data loggers were tested using ice melting point checks and by comparison to calibrated thermocouples to characterize performance over 0 °C to 10 °C. We also monitored logger performance in a study designed to replicate the range of vaccine storage and environmental conditions encountered at provider offices. For effective temperature monitoring, data logger setup must mimic the conditions and physical properties of stored vaccines. A data logger with an external probe kept in glycol-filled bottle effectively accomplishes this with minimal effort or expense. All loggers tested using this setup consistently performed within manufacturer accuracy specifications at both the ice point and in refrigerator trials. End-users may successfully validate performance of these logger types in the field using a simple ice point check. By contrast, loggers featuring sensors designed to record air temperature proved unacceptable for use as vaccine temperature monitors.
1. MEASUREMENT OBJECTIVES
We proposed to evaluate the performance multiple digital data-logger thermometers for temperature monitoring of refrigerated vaccines, based on the following test criteria:
1. Evaluate of out-of-box performance and manufacturer-specified accuracy over the temperature range of 0 °C to 10 °C, where accuracy is defined as the difference between the measured value and the true value.
2. Track stability over a six month time period to assess possible measurement drift 3. Determine proper use so that measurements reflect stored vaccine temperatures
2. EXPERIMENTAL METHOD AND RESULTS
We utilized two different thermometer validation methods in order to quantify the performance of seven digital data-logger models over the entire specified temperature range.
2.1 Ice melting point check (validation at 0 °C)
To capture logger performance at 0 °C, we designed an ice melting point check setup large enough to measure all of the loggers and thermocouple check standards simultaneously. An ice melting point check is a frequently-used method for validating thermometers by fixed-point. Water has the fundamental property of coexisting in both liquid and solid states at exactly 0.00 °C, which is a condition we refer to as the “ice melting point.” By immersing a thermometer in a properly-constructed ice melting point (a mixture of liquid water and solid ice) and allowing it to equilibrate, we can easily determine the device’s accuracy at 0 °C with an uncertainty of

2
± 0.002 °C1. For this study, a large Styrofoam box was lined in plastic and packed with a mixture of distilled water and shaved distilled water ice. The loggers and thermocouples were buried in this ice melting point mixture and set to collect data overnight, as shown in Figure 1 below.
Fig. 1. Ice melting point setup.
We repeated this experiment three times during our vaccine storage study in order to track logger stability over time and identify any possible measurement drift. The ice melting point temperature measurements recorded by the data loggers and thermocouples for each of the three trials are contained in Table 1 below. Each value represents the average temperature taken over a 2 h period following equilibration in the ice melting point. The manufacturer-specified accuracy of each device is also shown. Missing data points, shown as dashes, simply reflect the fact that several new data loggers were acquired for study after the first ice point trial (12/8/09).
Table 1. Ice melting point temperature readings of digital data loggers and reference thermocouples (°C).
Sensor Mfg. Spec T rial 1 T rial 2 T rial 3 In T olerance? Name Accuracy 12/8/09 3/15/2011 7/6/2011 (Y/N) TC1 0.1 0.0 0.0 0.0 Y TC2 0.1 - 0.0 0.0 Y TC20 0.1 - 0.0 0.0 Y LA 0.5 -0.1 -0.1 -0.1 Y LB 0.5 - 0.0 0.0 Y LC 0.3 0.5 0.5 0.5 N
LD internal 0.5 - -0.2 -0.2 Y LD probe 0.5 -0.2 -0.2 -0.2 Y LE1 probe 0.5 -0.1 -0.1 -0.1 Y LE2 probe 0.5 -0.1 -0.1 -0.1 Y LF probe 0.3 - 0.0 0.0 Y
LG internal 0.4 - -0.1 - Y LG probe 0.4 - 0.4 - Y

3
Because the ice melting point occurs at exactly 0.00 °C, we would expect each data logger placed in the ice and water mixture to record a temperature within the range of 0 °C ± the manufacturer-stated accuracy. If the logger temperature readings fall outside this range, this is an indication that the logger should be removed from service and calibrated or replaced. Examining the data in Table 1 above, we can see that all of the tested digital data loggers and thermocouples performed within manufacturer specifications at the ice point, with the exception of logger LC. The manufacturer stated accuracy for logger LC is ± 0.3 °C, but in all three ice point trials, this logger recorded an average temperature of 0.5 °C. These results show that logger LC is unsuitable for vaccine temperature monitoring in its present condition, and should be returned to the manufacturer for recalibration/adjustment or replaced with a new device.
• Before putting a newly calibrated or replacement logger into service, the user should
perform another ice point check on the device to verify that it is within specifications. 2.2 Data-logger thermometer drift/stability
Regular ice point checks can also be used to capture device stability and measurement drift over time. In this study, we simultaneously measured each available test data logger and reference thermocouple in the same ice point setup on three different occasions, spaced out over a period of 19 months. In Table 1, we can see that the ice point temperature data produced by each device is consistent between separate trials. Of the five digital data loggers that were available for the 12/08/09 trial, all five successfully reproduced the same temperature data a full 19 months later. Over the course our study, we detected no measurement drift in any of the data loggers, despite subjecting them to nearly constant use for a period of 1 to 2 years. Furthermore, we found that changing data-logger batteries had no impact on device performance. Based on our results, these types of digital data loggers are sufficiently stable for long-term use in vaccine temperature monitoring. Even so, users should never assume that any temperature monitoring device remains stable for long periods of time.
• A regular validation schedule, such as annual ice point checks, is required to maintain
traceability as well as confidence in measurement accuracy. Provided that a structured validation protocol is followed, digital data loggers can be used to stably monitor temperature for many months or years.
2.3 Comparison to calibrated reference thermocouple over the 2 °C to 10 °C range
All seven digital data-logger models were tested over the above temperature range by comparison to calibrated reference thermocouples. The loggers tested included stand-alone units with self-contained air temperature sensors (LA, LB, LC) as well units with external temperature probes (LE1 and LE2, LF). Two of the units featured both a self-contained temperature sensor (LD ext, LG ext) and an additional external probe (LD probe, LG probe). All of the stand-alone logger units were placed in one plastic tray, and each of the logger probes were inserted into a single large bottle containing 500 mL of ethylene glycol. Both the tray and the glycol-filled bottle were positioned next to each other on a center shelf of a pharmaceutical-grade refrigerator. The pharmaceutical refrigerator was chosen for its ability to stably maintain temperature within a narrow band of the easily-adjusted set point. Three NIST-calibrated, type T thermocouples were

4
included in the setup to serve as reference thermometers. TC1 was kept inside the glycol-filled bottle along with the data logger probes, TC2 was positioned inside the plastic tray, and TC20 was attached to the outside of a vaccine vial placed in the same plastic tray. The data logger and thermocouple setup is shown in Figure 2 below.
Fig. 2. Thermocouple and data logger setup during comparison testing over 2 °C to 10 °C.
To capture the loggers’ performance over the full temperature range, we recorded measurements at each of the following refrigerator temperature set points: 2 °C, 4 °C, 6 °C, 8 °C, 10 °C. For each new trial, we adjusted the refrigerator set point to the appropriate temperature value and allowed the refrigerator to fully equilibrate over a period of at least 6 hours. Following equilibration, we set the data loggers and thermocouples to record temperature data overnight. All logger sample intervals were set to 1 reading / min, with the exception of LG, which was factory set to 1 reading / 5 min. The thermocouple measurement system recorded temperatures every 10 s.
A sample of the data collected for a refrigerator set point trial is shown in Figure 3 below. Thermocouple measurements are shown as line graphs, and data logger readings as point measurements.

5
Fig. 3. Selection of temperature data from a thermocouple comparison test with refrigerator set to 4 °C.
The temperature waveform recorded by TC 2 (pink) is characteristic of the pharmaceutical refrigerator’s air temperature control, with oscillations centered about 4.5 °C. This is a +0.5 °C offset from the specified set point for this trial (4 °C). While the unit most likely uses a similar air temperature probe to maintain the user-specified set point, it’s important to note that the temperature offset for items stored in the refrigerator is even larger. The thermal properties of liquid vaccines stored in glass vials are closely replicated by glycol inside of a bottle. As a result, the temperatures recorded by TC 1 (blue) are most similar to the conditions inside of a vaccine vial. TC 20 was attached to the outside glass of a vaccine vial, and therefore is less indicative of the internal liquid temperature. Because of this, we have chosen TC 1 as the reference thermometer for this study. We can quantify data logger performance and suitability for temperature monitoring of refrigerated vaccines by comparing the temperature data recorded by each logger to the values recorded by TC 1.
For each temperature set-point trial, we collected data for 12 h or more to ensure full equilibration and to capture steady-state temperature readings at each of the 2 °C, 4 °C, 6 °C, 8 °C, and 10 °C settings. We then calculated the average thermocouple and logger temperature readings over a 2 h sample of data extracted from each trial. Using the thermocouple (TC 1, in glycol) average as the reference temperature, we determined each logger’s deviation from the expected value. This comparison is summarized in Fig. 4a and Fig. 4b below. In these graphs, the blue line at 0 °C represents the reference temperature. The data points correspond to the average deviation from the reference temperature as recorded by each logger (ΔT). Each temperature set-point trial is denoted by a different colored symbol, as indicated in the graph legends. For example, during the 2 °C set-point trial, logger LC recorded temperatures on average 0.4 °C higher than those recorded by the reference thermocouple. During the 10 °C set- point trial, this same logger showed an average offset of about -0.1 °C from the reference
6
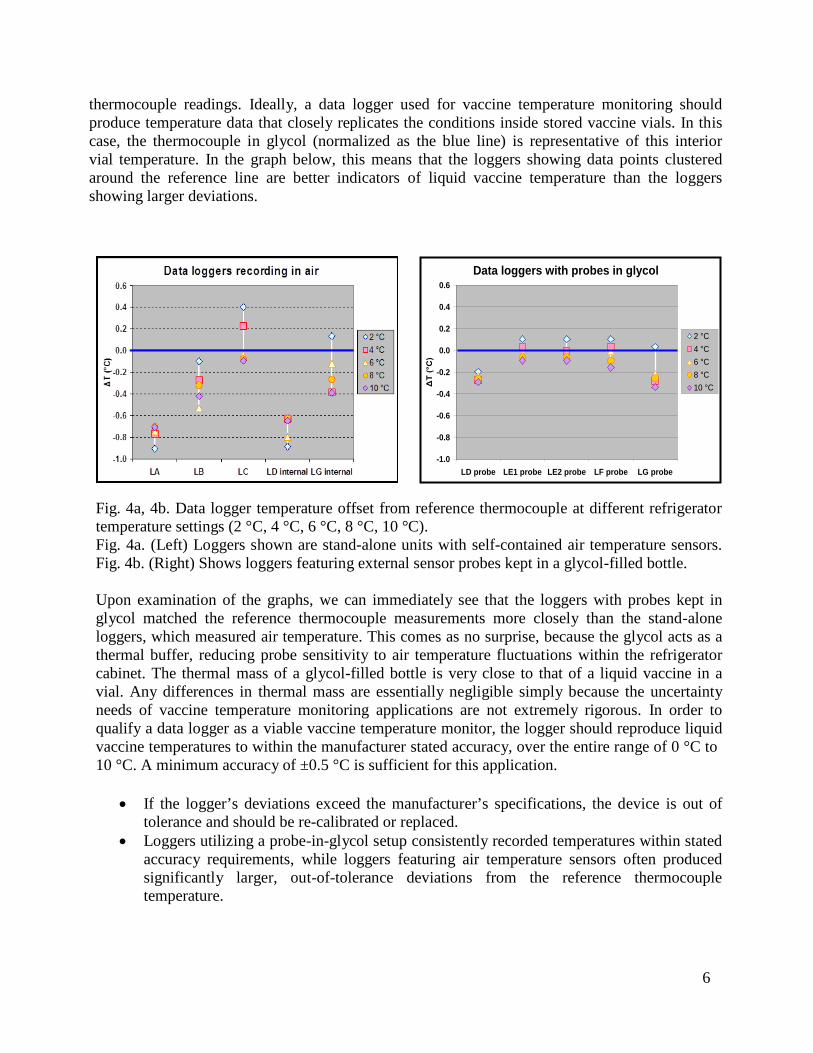
thermocouple readings. Ideally, a data logger used for vaccine temperature monitoring should produce temperature data that closely replicates the conditions inside stored vaccine vials. In this case, the thermocouple in glycol (normalized as the blue line) is representative of this interior vial temperature. In the graph below, this means that the loggers showing data points clustered around the reference line are better indicators of liquid vaccine temperature than the loggers showing larger deviations.
Fig. 4a, 4b. Data logger temperature offset from reference thermocouple at different refrigerator temperature settings (2 °C, 4 °C, 6 °C, 8 °C, 10 °C). Fig. 4a. (Left) Loggers shown are stand-alone units with self-contained air temperature sensors. Fig. 4b. (Right) Shows loggers featuring external sensor probes kept in a glycol-filled bottle.
Upon examination of the graphs, we can immediately see that the loggers with probes kept in glycol matched the reference thermocouple measurements more closely than the stand-alone loggers, which measured air temperature. This comes as no surprise, because the glycol acts as a thermal buffer, reducing probe sensitivity to air temperature fluctuations within the refrigerator cabinet. The thermal mass of a glycol-filled bottle is very close to that of a liquid vaccine in a vial. Any differences in thermal mass are essentially negligible simply because the uncertainty needs of vaccine temperature monitoring applications are not extremely rigorous. In order to qualify a data logger as a viable vaccine temperature monitor, the logger should reproduce liquid vaccine temperatures to within the manufacturer stated accuracy, over the entire range of 0 °C to 10 °C. A minimum accuracy of ±0.5 °C is sufficient for this application.
• If the logger’s deviations exceed the manufacturer’s specifications, the device is out of
tolerance and should be re-calibrated or replaced. • Loggers utilizing a probe-in-glycol setup consistently recorded temperatures within stated
accuracy requirements, while loggers featuring air temperature sensors often produced significantly larger, out-of-tolerance deviations from the reference thermocouple temperature.
Data loggers with probes in glycol
-1.0
-0.8
-0.6
-0.4
-0.2
0.0
0.2
0.4
0.6
LD probe LE1 probe LE2 probe LF probe LG probe
ΔT
(°C
)
2 °C4 °C6 °C8 °C10 °C

7
Loggers with Air Temperature Sensors (± °C) Sensor Name
Mfg. Specifed Accuracy
Ice Point (T = 0 °C)
Ref. T C Comparison (2 °C to 10 °C)
In Tolerance? (Y/N)
LA 0.5 0.1 0.9 N LB 0.5 0.0 0.5 Y LC 0.3 0.5 0.5 N
LD internal 0.5 0.2 0.9 N LG internal 0.4 0.1 0.4 Y
3. EVALUATION 3.1 Manufacturer-specified accuracy
In this section, we will evaluate the results from both the ice melting point check and reference thermocouple comparison tests with respect to manufacturer accuracy specifications. These results and specifications are summarized below in tables 2a and 2b. The ice point data reflects the absolute deviation of each logger from the expected temperature, 0.0 °C. The values in the column labeled “Ref. TC Comparison” correspond to each logger’s maximum absolute deviation from the reference temperature over all of the 2 °C to 10 °C trials.
Table 2a. Comparison of manufacturer accuracy specifications and logger test results. Loggers featuring an external probe in glycol are shown.
Loggers with External Probes in Glycol (± °C) Sensor Name
Mfg. Specifed Accuracy
Ice Point (T = 0 °C)
Ref. T C Comparison (2 °C to 10 °C)
In Tolerance? (Y/N)
LD probe 0.5 0.2 0.3 Y LE1 probe 0.5 0.1 0.1 Y LE2 probe 0.5 0.1 0.1 Y LF probe 0.3 0.0 0.2 Y LG probe 0.4 0.4 0.4 Y
Table 2b. Comparison of manufacturer accuracy specifications and logger test results. Loggers featuring an air temperature probe are shown.
For a data logger in a chosen setup to be a viable vaccine temperature monitor, both deviation values should fall within the manufacturer-specified accuracy. In the tables above, the loggers that meet this requirement are shown in blue font, while loggers that recorded temperature deviations in excess of manufacturer specifications are shown in red. In our testing, all five data loggers utilizing the external probe in glycol setup performed to within or better than manufacturer accuracy specifications over the full 0 °C to 10 °C range. By contrast, three out of the five tested stand-alone units (which rely on air temperature sensors) failed to meet manufacturer specifications during one or more trials.
• Stand-alone data loggers may be perfectly acceptable for applications requiring
continuous room temperature measurements, but our results clearly show that a logger
8
setup featuring an external probe in a glycol-filled bottle is vastly superior to that of air-temperature sensors for the purpose of refrigerated vaccine temperature monitoring.
The purpose of vaccine temperature monitoring is to ensure that liquid vaccines are stored at the temperatures required to preserve their efficacy. All vaccine storage refrigerators withstand thermal gradients and fluctuations in response to a variety of mechanical and use factors. As long as the liquid vaccines are maintained within the proper temperature range, the minutia of refrigerator air temperature variations is irrelevant. The thermal mass added by vaccine vials and packaging slows heat transfer between refrigerator air and the contained vaccine. As a result, the vaccines experience smaller and less frequent temperature fluctuations than in the surrounding air. Gradual changes and trends are coupled with a time lag effect. The disparity between the temperature behavior of air and stored vaccines makes it difficult, if not impossible, to effectively predict vaccine temperatures using only air temperature data.
• In this case, a data logger with an air-temperature sensor is simply measuring the wrong
parameter (e.g., air temperature instead of the vaccine kinetic temperature). To accurately determine stored vaccine temperature, it is imperative to choose a thermometer setup that mimics the conditions and physical properties of the stored vaccines. We found the data logger probe in glycol setup to be an extremely simple, inexpensive and effective way to accomplish this. All of the loggers we tested using this setup consistently performed within manufacturer accuracy specifications at both the ice point and in refrigerator trials. Furthermore, our results indicate that a simple ice point check may be used to validate the performance of these logger types for use in temperature monitoring of refrigerated vaccines. The physical properties of sensor materials used in data logging thermometer probes are such that measurement error propagates linearly over small temperature ranges. This means that measurement error associated with temperatures in the vaccine storage range will be the same as the error measured at 0 °C.
• In other words, a logger that meets manufacturer accuracy specifications at the ice point
will also meet these specifications for temperatures in the 0 °C to 10 °C range, provided that it is used correctly (e.g., with an external probe in glycol).
4. METHODS FOR EFFECTIVE VACCINE TEMPERATURE MONITORING USING DIGITAL DATA LOGGERS
In these sections, we will discuss user selection and proper use of digital data loggers so that recorded measurements reflect stored vaccine temperatures.
4.1 Minimum design features and specifications
Based on our studies using digital data loggers, devices that fulfill the following list of minimum design features and specification requirements can be used to successfully monitor refrigerated vaccine temperature when combined with the proper setup and measurement techniques.

9
o External, detachable temperature probe (to be kept in ethylene glycol or propylene glycol-filled bottle) Cable length > 1 m preferred
o Continuous temperature monitoring – at least one reading/15 min o Memory:
Capacity 4000 readings (≈ 39 days recording at one reading/15 minutes) Device stops recording when memory is full, reset after data download
o Temperature range: –20 °C to 40 °C (for refrigerated vaccine monitoring) o Uncertainty: ± 0.5 °C in the range of –1 °C to 15 °C
Often listed as device “accuracy” by manufacturers o Resolution: ± 0.1 °C o Battery life: 6 months minimum o Integrated Liquid Crystal Display (LCD) with minimum:
Last measured temperature displayed in °C or °F Hi/Lo alarm status indicator
o Alarm capabilities Factory set, end-user adjustable Alarm activation at 2 °C (low) and 8 °C (high)
o Download/ archival software Download data via standard computer ports (e.g., USB) Graphical presentation of date/time/temperature data Display alarm configuration details and total time outside high/low thresholds Data export capability (e.g., csv, Excel, txt)
4.2 Digital data logger setup
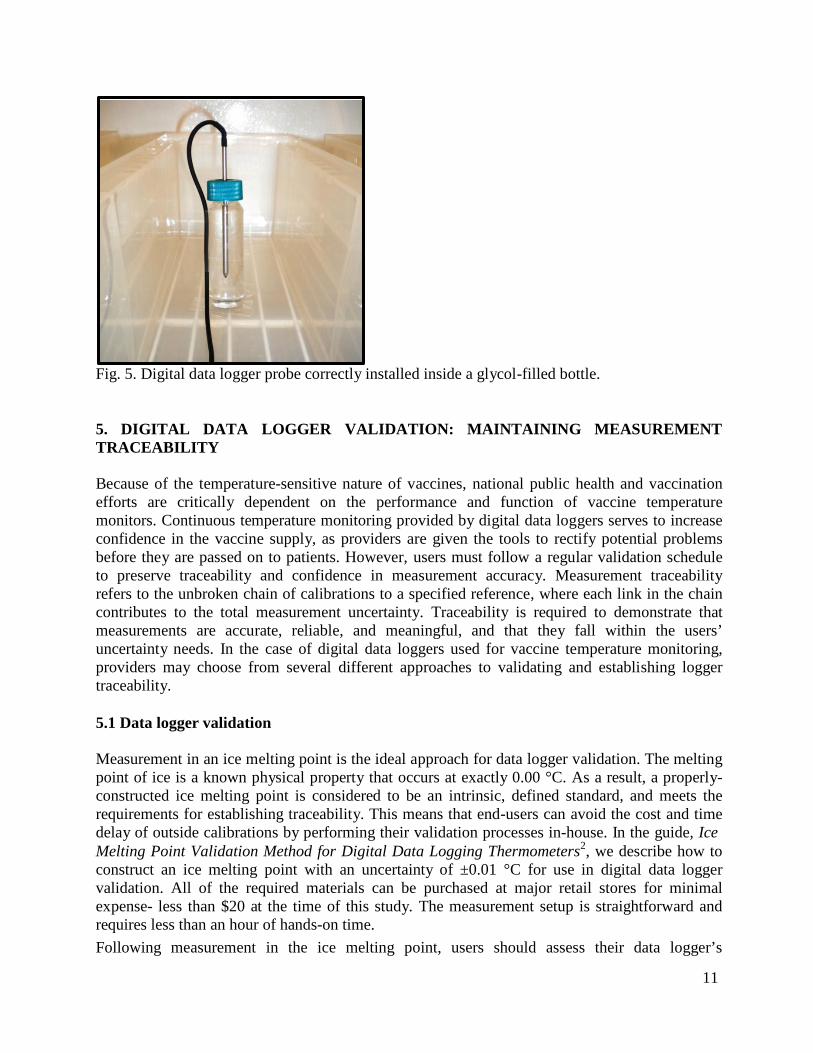
The most critical consideration for users determining digital data logger setup and placement is whether or not the resulting device measurements will be indicative of stored vaccine temperatures. In order to achieve this, the data logger probe must be installed so that it is subject to the same thermal conditions as nearby stored vaccines. This feature is absolutely essential to obtain meaningful temperature data, and subsequently, to determine whether stored vaccines are effective and safe for patient administration. We have repeatedly demonstrated the often dramatic temperature differences that occur between liquid vaccines and the surrounding refrigerator air at the same point in time. Assuming that the two are interchangeable is simply wrong, and is almost guaranteed to result in product wastage and accidental administration of spoiled vaccine.
• Any data logger that is set up to measure only air temperature is NOT a viable vaccine
temperature monitor. On the other hand, we have found that a data logger probe installed in liquid-filled bottle (e.g., ethylene glycol) is an extremely simple, effective, and inexpensive way to replicate the thermal conditions inside stored vaccine vials.

10
Setup and installation of data logger probe in glycol-filled bottle 1. Choose a bottle/vial
a. If a detachable probe data logger comes with a manufacturer-supplied, liquid- filled vial, use this.
b. Otherwise, select a transparent glass or plastic vial that satisfies the following: i. Minimum bottle diameter = 4 x probe sheath diameter
ii. Minimum bottle height is chosen so that probe tip is immersed below the top of the container to a depth at least 10 x probe sheath diameter, without touching the bottom of the bottle
iii. Sealable lid is preferred to avoid leaks and spills, with entry hole for logger probe. A pierceable, rubber septum type cap works well.
2. Completely fill the vial with glycol (alternative liquids may be acceptable) 3. Insert data logger probe through the center of the cap to a minimum depth of 10 x the
sheath diameter. Make sure there is plenty of space between the probe tip and the bottom of the bottle or vial.
4. Adjust the probe so that the entire immersed length is centered within the bottle. The probe tip must not be touching the walls of the bottle.
a. To prevent the probe from shifting every time the cable is touched, we fixed the cable to the outside of the bottle with tape.
5. Place the bottle in a plastic tray in the center of the refrigerator. a. The tray is needed because wire refrigerator shelves don’t provide a stable
base and the bottles fall over, while placement directly on glass refrigerator shelves can cause unwanted heat transfer to and from the bottle, skewing measurement results.
6. Make sure the bottle is not positioned directly under cooling vents, close to walls, or on either the top-most or bottom-most refrigerator shelves. The logger should be in the center of the refrigerator.
7. If the probe cable length allows, position logger readout unit outside of the refrigerator in an easy to read location, such as hanging on the refrigerator door.
8. Allow for logger and glycol bottle equilibration before saving measurements. a. Ambient start (glycol-filled bottle and probe at room temp) – 3 h for
equilibration inside refrigerator b. Cold start (ambient probe inserted into ethylene glycol-filled bottle kept in
refrigerator) – 2 h for equilibration inside refrigerator 9. At scheduled download time, detach logger readout unit from probe, leaving the
probe in glycol bottle setup undisturbed inside the refrigerator. 10. Connect main unit to computer and download data. 11. Restart logger recording and reattach unit to probe as soon as possible.
11
Fig. 5. Digital data logger probe correctly installed inside a glycol-filled bottle.
5. DIGITAL DATA LOGGER VALIDATION: MAINTAINING MEASUREMENT TRACEABILITY
Because of the temperature-sensitive nature of vaccines, national public health and vaccination efforts are critically dependent on the performance and function of vaccine temperature monitors. Continuous temperature monitoring provided by digital data loggers serves to increase confidence in the vaccine supply, as providers are given the tools to rectify potential problems before they are passed on to patients. However, users must follow a regular validation schedule to preserve traceability and confidence in measurement accuracy. Measurement traceability refers to the unbroken chain of calibrations to a specified reference, where each link in the chain contributes to the total measurement uncertainty. Traceability is required to demonstrate that measurements are accurate, reliable, and meaningful, and that they fall within the users’ uncertainty needs. In the case of digital data loggers used for vaccine temperature monitoring, providers may choose from several different approaches to validating and establishing logger traceability.
5.1 Data logger validation
Measurement in an ice melting point is the ideal approach for data logger validation. The melting point of ice is a known physical property that occurs at exactly 0.00 °C. As a result, a properly- constructed ice melting point is considered to be an intrinsic, defined standard, and meets the requirements for establishing traceability. This means that end-users can avoid the cost and time delay of outside calibrations by performing their validation processes in-house. In the guide, Ice Melting Point Validation Method for Digital Data Logging Thermometers2, we describe how to construct an ice melting point with an uncertainty of ±0.01 °C for use in digital data logger validation. All of the required materials can be purchased at major retail stores for minimal expense- less than $20 at the time of this study. The measurement setup is straightforward and requires less than an hour of hands-on time. Following measurement in the ice melting point, users should assess their data logger’s

12
performance by comparing the measured error to both manufacturer accuracy specifications and to Vaccines for Children (VFC) requirements. If the measurement error exceeds either of these values, the device is not suitable for vaccine temperature monitoring in its present condition and should be recalibrated, repaired, or replaced. Fig. 6 below shows an example of data collected during an ice melting point validation. Data logger measurements are shown in black. The mean logger temperature recorded during the trial is –0.2 °C. Because we expect to measure 0.0 °C at the ice melting point, our specified reference, in this case our measured error is –0.2 °C. If the logger’s manufacturer-specified accuracy is ±0.5 °C, as shown in the graph, we can clearly see that the measured error is well within these bounds, or “in tolerance.” In this way, we have used an ice melting point check to successfully validate the logger. If the measured error happened to be greater than ±0.5 °C, then the device would be considered “out of tolerance,” and unacceptable for vaccine temperature monitoring in its current condition.
Fig. 6. Example results and interpretation of ice melting point data logger validation.
• At a minimum, data loggers used in vaccine temperature monitoring should be measured
at the ice melting point on an annual basis. • All new or recalibrated loggers must undergo ice melting point validation testing to
determine if they are operating within required specifications before they are placed into service.
13
• Any logger that produces questionable data or shows signs of measurement drift should also be measured at the ice melting point, regardless of whether it is due for annual validation.
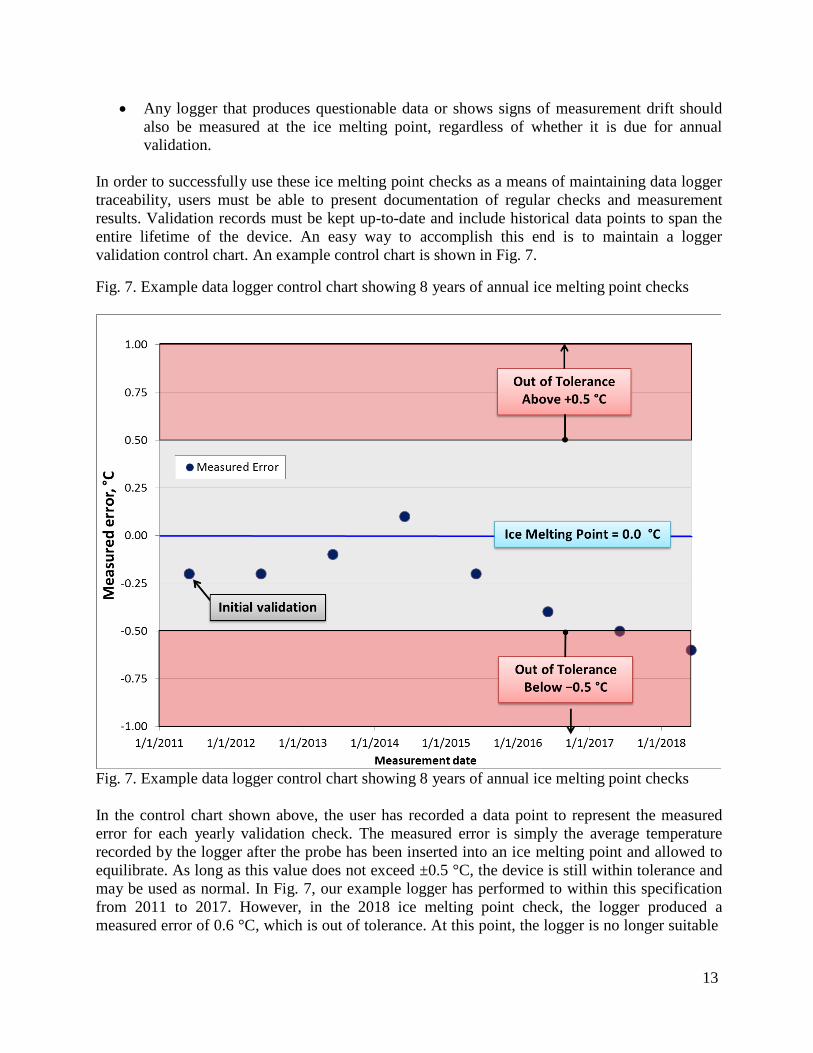
In order to successfully use these ice melting point checks as a means of maintaining data logger traceability, users must be able to present documentation of regular checks and measurement results. Validation records must be kept up-to-date and include historical data points to span the entire lifetime of the device. An easy way to accomplish this end is to maintain a logger validation control chart. An example control chart is shown in Fig. 7.
Fig. 7. Example data logger control chart showing 8 years of annual ice melting point checks
Fig. 7. Example data logger control chart showing 8 years of annual ice melting point checks In the control chart shown above, the user has recorded a data point to represent the measured error for each yearly validation check. The measured error is simply the average temperature recorded by the logger after the probe has been inserted into an ice melting point and allowed to equilibrate. As long as this value does not exceed ±0.5 °C, the device is still within tolerance and may be used as normal. In Fig. 7, our example logger has performed to within this specification from 2011 to 2017. However, in the 2018 ice melting point check, the logger produced a measured error of 0.6 °C, which is out of tolerance. At this point, the logger is no longer suitable

14
for vaccine temperature monitoring and should be replaced or returned to the manufacturer for re-calibration or repair. As soon as the user receives the repaired, recalibrated or replacement device, they should subject it to an ice melting point check to verify that it performs to within the required accuracy specifications (e.g., ±0.5 °C). This initial ice melting point check must occur before the device is placed into service, and the resulting measurement point should be entered into a control chart.
5.2 Calibration by manufacturer or accredited calibration laboratory
Some users may prefer to send their data loggers to outside laboratories for calibration. Manufacturers may also offer re-calibration of their devices. When considering these options, it is important to verify that measurement traceability is maintained. In the case of an ice melting point validation performed by the end-user, data loggers are directly evaluated against a defined standard. However, when the device manufacturer or an outside laboratory provides the calibration, the chain of traceability becomes longer and more complex.
Users should look for certain criteria to evaluate whether measurement traceability has been established by the calibrating laboratory. As a minimum, calibration reports must include measurement results along with documented uncertainty, and the laboratory must demonstrate that its methods are traceable to a specified reference. In addition, the laboratory must have an internal measurement assurance program in place to establish the status of both the specified reference and the measurement systems used at the time of the calibration.
It is often difficult for the average user to discern whether a particular calibration laboratory meets all of these requirements, and many companies compound the issue by using misleading or meaningless terminology such as “NIST-traceable.” To combat this problem, users can choose to have their calibrations performed by a laboratory with accreditation from an internationally- recognized, ILAC3 signatory accreditation body, such as NVLAP or A2LA. To receive this type of accreditation, laboratories undergo rigorous, 3rd-party testing of their quality management system, the reliability and accuracy of their measurement and calibration procedures, and an in- depth evaluation of uncertainty claims.
While calibration by accredited laboratories is a legitimate option, attempting to validate every data logger used for vaccine temperature monitoring in this way is likely to be expensive and time-consuming.
5.3 Alternative data logger validation method
An alternate approach to using an ice melting point validation check would be to have a designated “reference thermometer” which is regularly calibrated by an accredited laboratory, or validated by the user with an ice melting point check. Individual data loggers could then be validated by comparison to the reference thermometer. Our method for evaluating data loggers by comparison to a calibrated reference thermocouple, described in section 2.2, is an example of this approach.

15
To perform a comparison test, the test data logger and the reference thermometer are contained together in a stable thermal environment and set to record data simultaneously. The chosen environmental temperature should be within the range in which the test logger will be used (e.g. 2 °C to 8 °C). Following an equilibration period, the data logger and the reference thermometer should read close to the same temperature. Any discrepancy between the two is the measured error. For validation purposes, the measured error value is combined with total measurement uncertainty (in a root-sum-square) to calculate the data logger uncertainty. Data logger uncertainty must be within manufacturer specifications for the device to pass the validation.
Although the method is straightforward, there are some significant caveats to comparison test validation. For the test to be a viable validation method, total measurement uncertainty must be significantly smaller than the test logger’s specified accuracy. This is because the total measurement uncertainty is included in the final data logger uncertainty determination. The American National Standards Institute (ANSI) specifies a 4:1 ratio between test device specifications and total comparison measurement uncertainty in ANSI Z540.3: Requirements for the Calibration of Measuring and Test Equipment. This ratio is a commonly-used, industry accepted standard. To put this into perspective, if a data logger’s manufacturer-specified accuracy is ±0.5 °C, in order to validate the logger by comparison to a reference thermometer, the total uncertainty of the measurement procedure must be ±0.125 °C or smaller.
Three major factors contribute to the total uncertainty of a comparison measurement. The first component is the uncertainty associated with the calibrated reference thermometer. This includes the values determined during thermometer calibration as well as any additional uncertainties incurred by the measurement system used in the comparison test. Selecting a reference thermometer with a high level of precision and accuracy will reduce the associated uncertainty component. However, the greater expense of high-performance thermometers should also be considered.
The other components in the total measurement uncertainty of a thermometer comparison test result from environmental conditions, and can be more difficult to control. In a thermometer comparison test, the reference and test thermometers are contained together in a stable thermal environment. However, maintaining a stable thermal environment without spatial temperature gradients is a non-trivial task. Most VFC providers do not have access to tightly controlled temperature baths. For most purposes, a glycol-filled bottle kept inside a closed refrigerator is a relatively stable thermal environment. However, in our household refrigerator studies, thermocouples in glycol-filled bottles recorded steady state temperature oscillations on the order of 0.25 °C to 0.5°C.4 Based on the ANSI Z540.3 requirement, to validate a data logger with a stated accuracy of ±0.5 °C, our total measurement uncertainty must not exceed ±0.125 °C. Clearly, a glycol-filled bottle kept inside a household refrigerator is not a sufficiently stable environment for thermometer comparison validation. On the other hand, the same setup placed inside a pharmaceutical-grade refrigerator may be adequate, provided that the other uncertainty contributions do not cause the total measurement uncertainty to exceed the allowed limit. In our data logger / reference thermocouple comparison tests, the temperature control inside of the glycol bottle environment was stable to within ≈ 0.01 °C.5

16
The last major uncertainty contribution in thermometer comparison measurements comes from spatial temperature variations in the chosen test environment. This parameter can be difficult to characterize and control.
While the measurement process for a thermometer comparison validation initially seems straightforward, the complexity of traceability and uncertainty considerations can make this approach problematic for the average user. In addition, the costs of purchasing a high-precision reference thermometer, maintaining its calibration status, and obtaining a tightly-regulated thermal environment (e.g., a pharmaceutical-grade refrigerator) are likely to be prohibitive for many VFC providers.
• For most users, annual ice melting point checks represent the simplest and most
economical method for maintaining data logger validation and traceability. 6. CONCLUSION
Data loggers featuring an external probe kept in a glycol-filled bottle provide effective, continuous temperature monitoring of stored vaccines. This setup mimics the conditions and properties of stored vaccines. Provided that a structured validation protocol is followed, digital data loggers of this type can be used to stably monitor vaccine temperature for many months or years. By contrast, loggers featuring sensors designed to record air temperature proved unacceptable for use as vaccine temperature monitors.
A regular validation schedule, such as annual ice point checks, is required to maintain traceability as well as confidence in measurement accuracy. For most users, annual ice melting point checks represent the simplest and most economical method for maintaining data logger validation and traceability.
1 Mangum, B.W., “Reproducibility of the Temperature of the Ice Point in Routine Measurements,” NIST Tech. Note 1411, 1995 2 Chojnacky, M.J.; Ice Melting Point Validation Method for Digital Data Logging Thermometers, http://www.nist.gov/pml/div685/grp01/upload/Ice-Melting-Point-Validation- Method-for-Data-Loggers.pdf 3 International Laboratory Accreditation Cooperation, http://www.ilac.org/ 4 Chojnacky, M. J.; Miller, W. W.; Ripple, D. C.; and Strouse, G. F., “Thermal Analysis of Refrigeration Systems Used for Vaccine Storage,” NISTIR 7656, 2009. 5 Chojnacky, M. J.; Miller, W. W.; and Strouse, G. F., “Thermal Analysis of Refrigeration Systems Used for Vaccine Storage,” NISTIR 7753, 2010.