Embed Size (px)
Citation preview
October 10, 2017
Data Management fromWater Utility Perspective
Jim Pescatore, Vice President, CDM Smith Charlie Jewell, Director of Planning, Boston Water & Sewer Commission
2017 Water Asset Management ConferenceBoston
Summary
Water Distribution
Commission System
Prior Studies
Work Accomplished
Water Distribution Study
Analysis
Recommendations
2
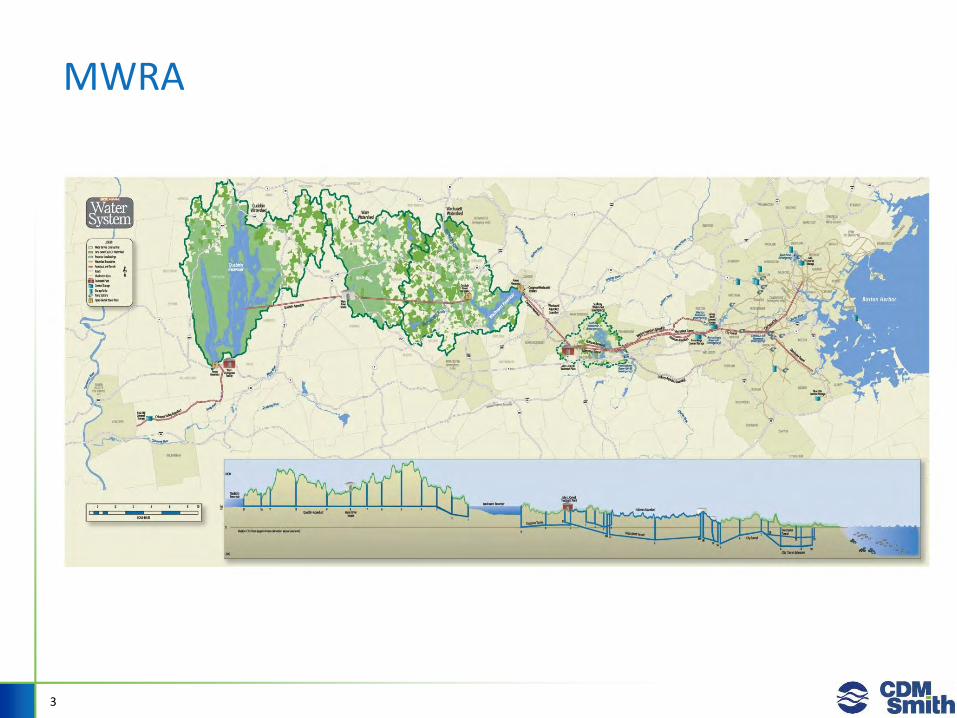
MWRA
3
MWRA
4
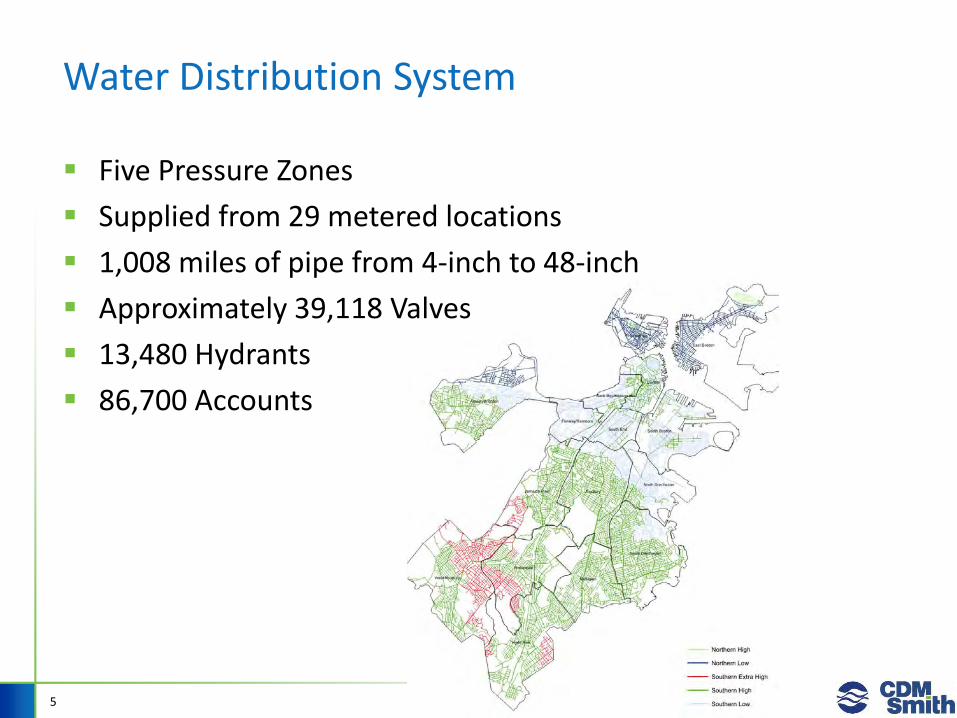
Water Distribution System
Five Pressure Zones
Supplied from 29 metered locations
1,008 miles of pipe from 4-inch to 48-inch
Approximately 39,118 Valves
13,480 Hydrants
86,700 Accounts
5
Prior Studies
6
1967 Distribution Study Increased Fire Flows
Redundant Transmission Mains
Cleaning and Cement Lining of Large Mains
1987 Study 17 miles of pipe per year
Valve Upgrades
Hydrant Replacement
Hydraulic Model
Work Accomplished
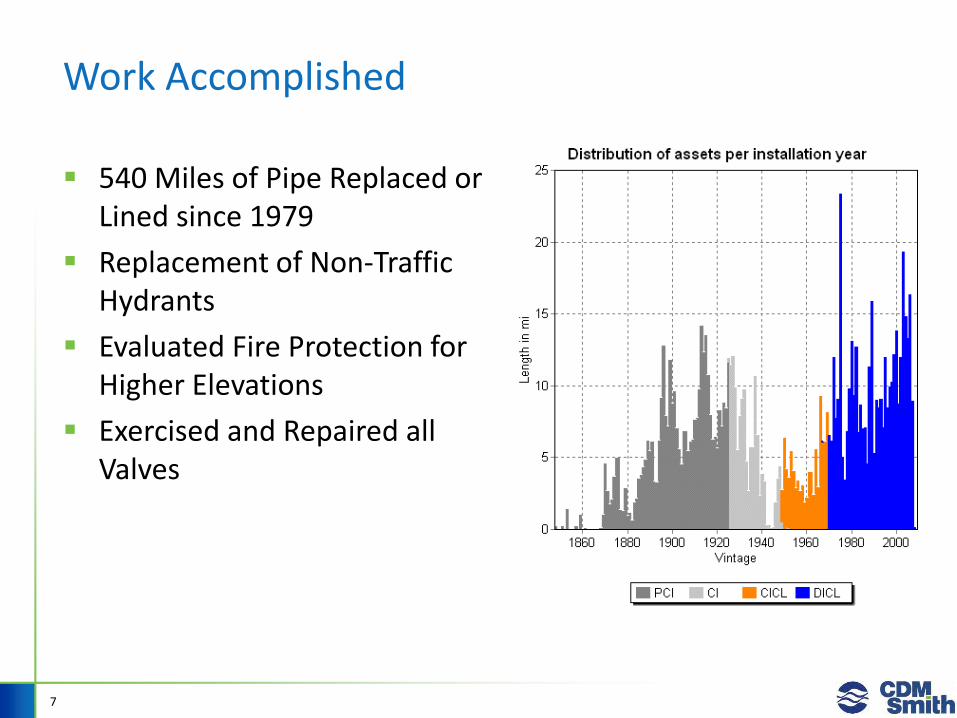
540 Miles of Pipe Replaced or Lined since 1979
Replacement of Non-Traffic Hydrants
Evaluated Fire Protection for Higher Elevations
Exercised and Repaired all Valves
7
2011 Water Distribution Study - Tasks
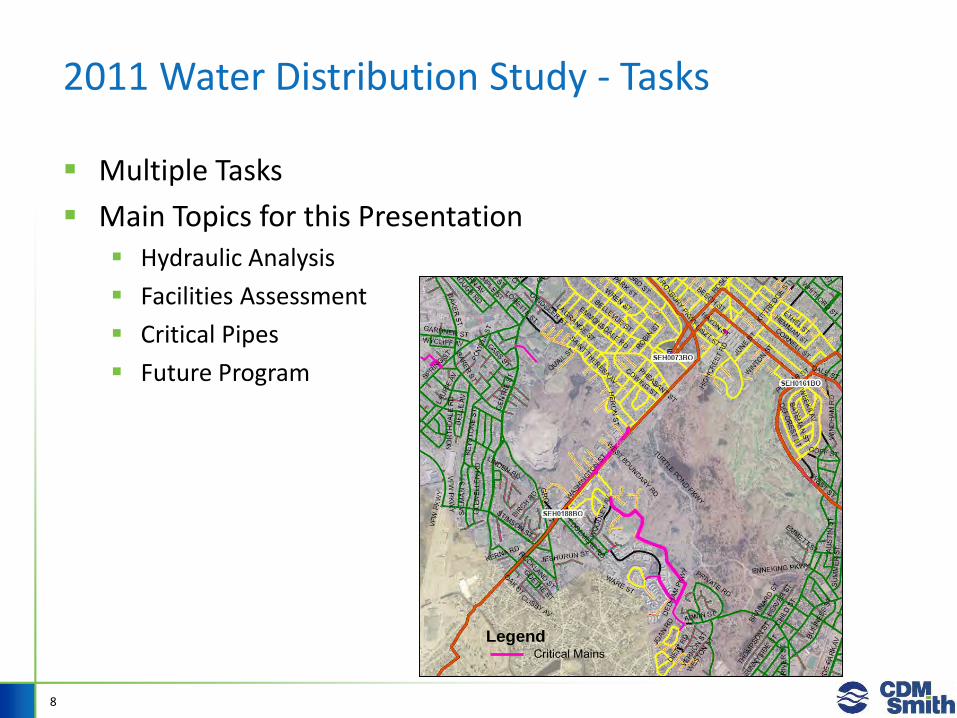
Multiple Tasks
Main Topics for this Presentation Hydraulic Analysis
Facilities Assessment
Critical Pipes
Future Program
8
LegendCritical Mains

Analysis
Upgrade of Hydraulic Model – Infowater
Peak Hour to Determine Possible Deficiencies Low Pressures
Low Fire Flows
Critical Mains / Probability and Consequence of Failure
Pipe Sample Analysis
Soil Testing
9
Results
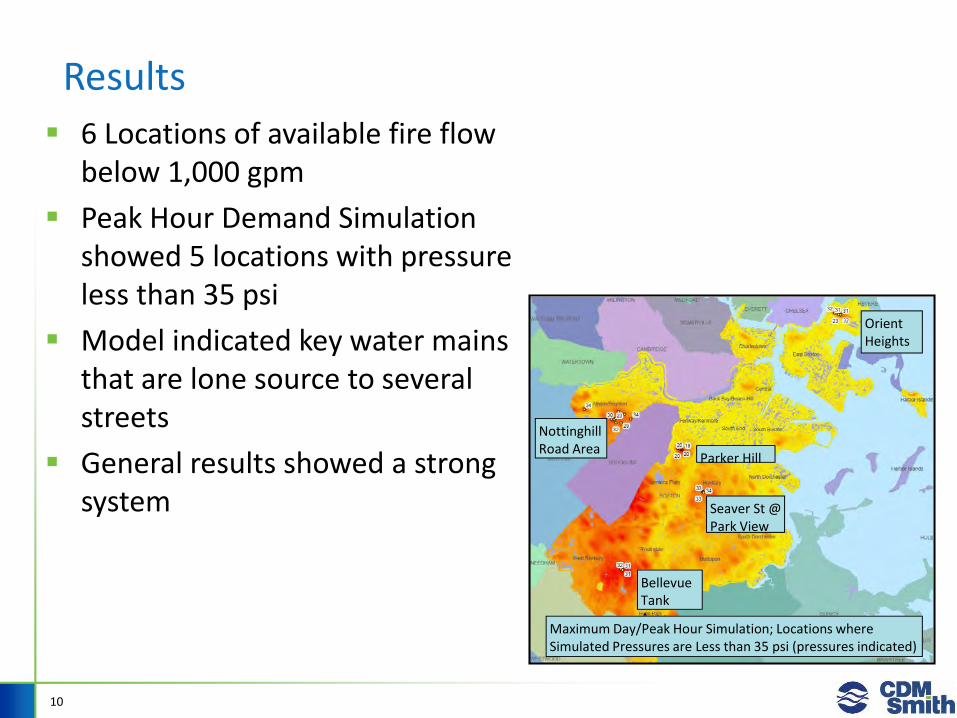
6 Locations of available fire flow below 1,000 gpm
Peak Hour Demand Simulation showed 5 locations with pressure less than 35 psi
Model indicated key water mains that are lone source to several streets
General results showed a strong system
10
Orient Heights
NottinghillRoad Area
Parker Hill
Seaver St @ Park View
Bellevue Tank Area
Maximum Day/Peak Hour Simulation; Locations where Simulated Pressures are Less than 35 psi (pressures indicated)
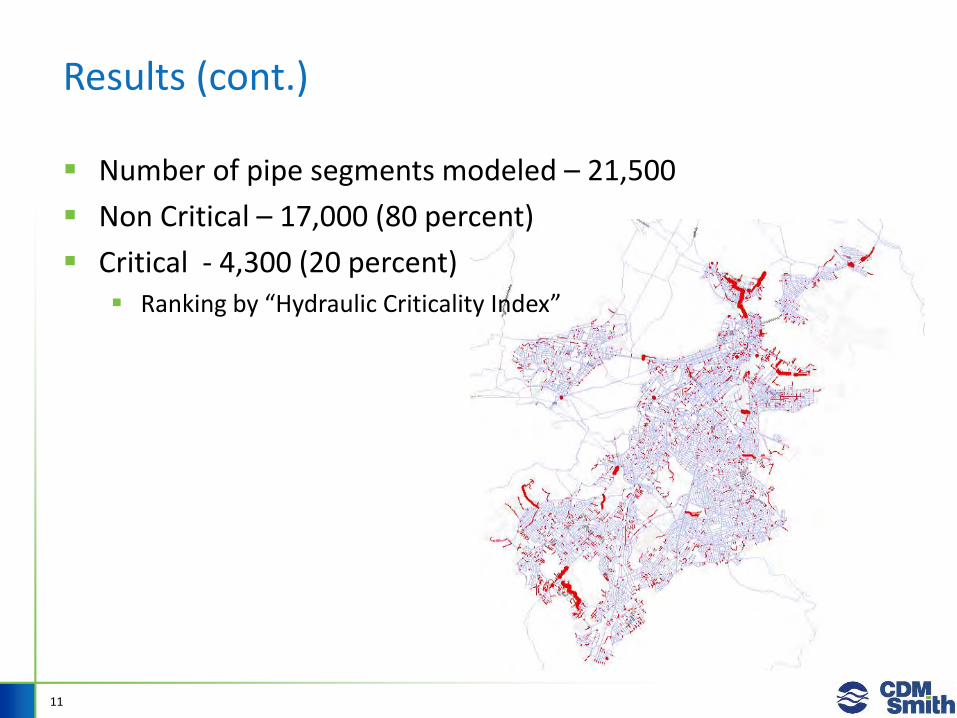
Results (cont.)
Number of pipe segments modeled – 21,500
Non Critical – 17,000 (80 percent)
Critical - 4,300 (20 percent) Ranking by “Hydraulic Criticality Index”
11
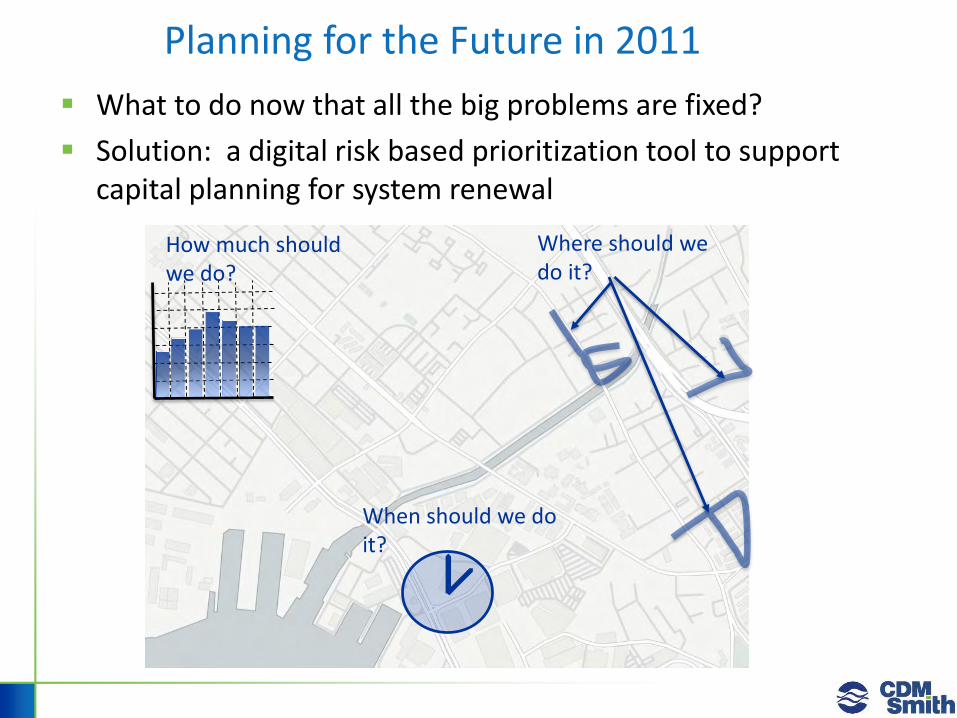
Planning for the Future in 2011
What to do now that all the big problems are fixed?
Solution: a digital risk based prioritization tool to support capital planning for system renewal
How much should we do?
Where should we do it?
When should we do it?
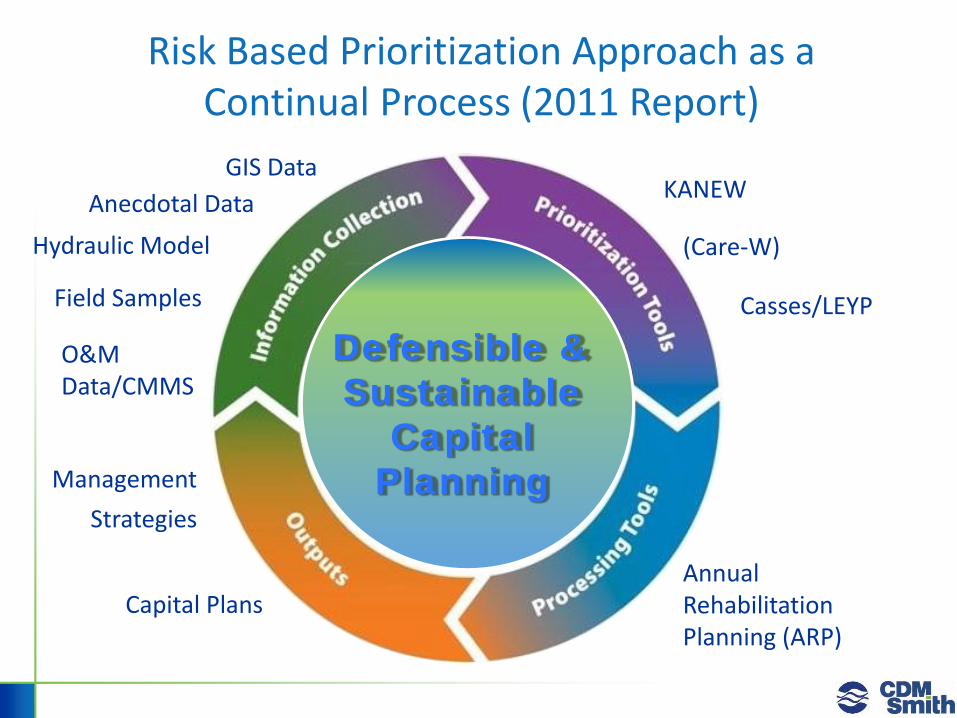
Risk Based Prioritization Approach as a Continual Process (2011 Report)
Capital Plans
GIS Data
Hydraulic Model
O&M Data/CMMS
Field Samples
Anecdotal Data
Defensible &
Sustainable
Capital
PlanningManagement
Strategies
KANEW
(Care-W)
Casses/LEYP
Annual Rehabilitation Planning (ARP)

14
Main Breaks Likelihood of Failure
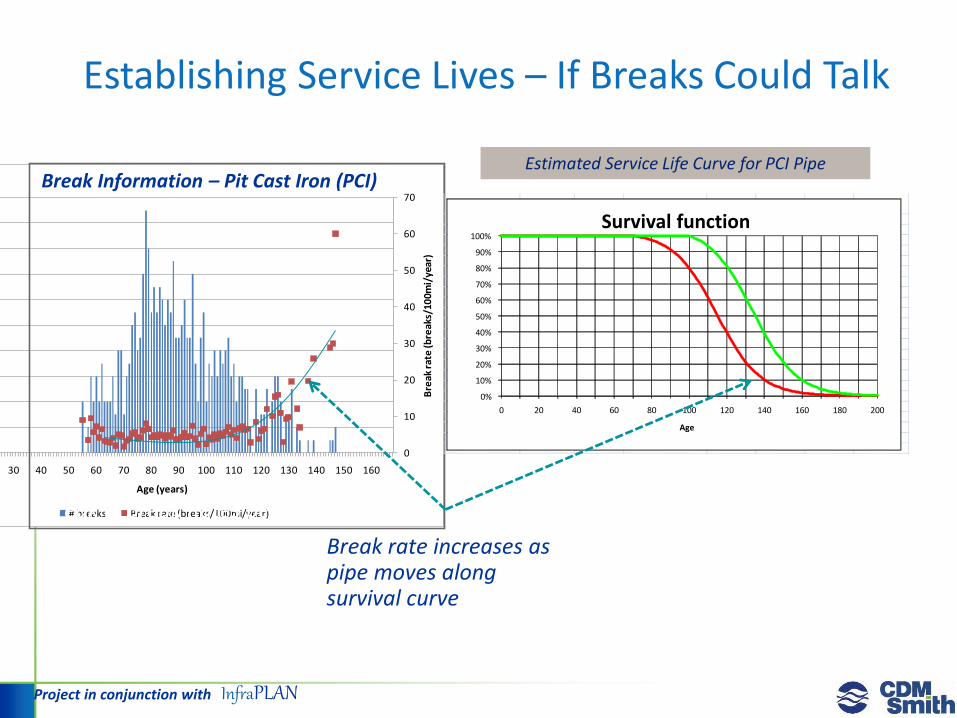
Establishing Service Lives – If Breaks Could Talk
0
10
20
30
40
50
60
70
0
2
4
6
8
10
12
14
16
18
20
0 10 20 30 40 50 60 70 80 90 100 110 120 130 140 150 160
Bre
ak r
ate
(bre
aks/
100m
i/ye
ar)
# b
reak
s
Age (years)
PCI - Breaks and break rate per age
# breaks Break rate (breaks/100mi/year)
Break Information – Pit Cast Iron (PCI)
0%
10%
20%
30%
40%
50%
60%
70%
80%
90%
100%
0 20 40 60 80 100 120 140 160 180 200
Age
Survival function
Break & Break Rates per Pipe Age (PCI)
Estimated Service Life Curve for PCI Pipe
Break rate increases as pipe moves along survival curve
Project in conjunction with InfraPLAN
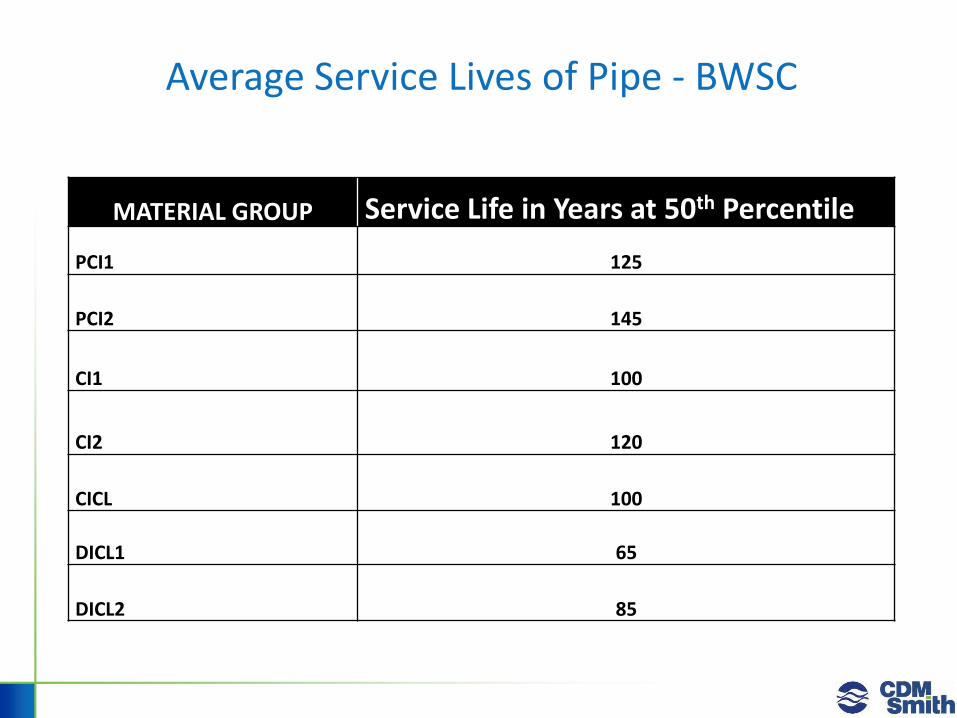
Average Service Lives of Pipe - BWSC
MATERIAL GROUP Service Life in Years at 50th Percentile
PCI1 125
PCI2 145
CI1 100
CI2 120
CICL 100
DICL1 65
DICL2 85
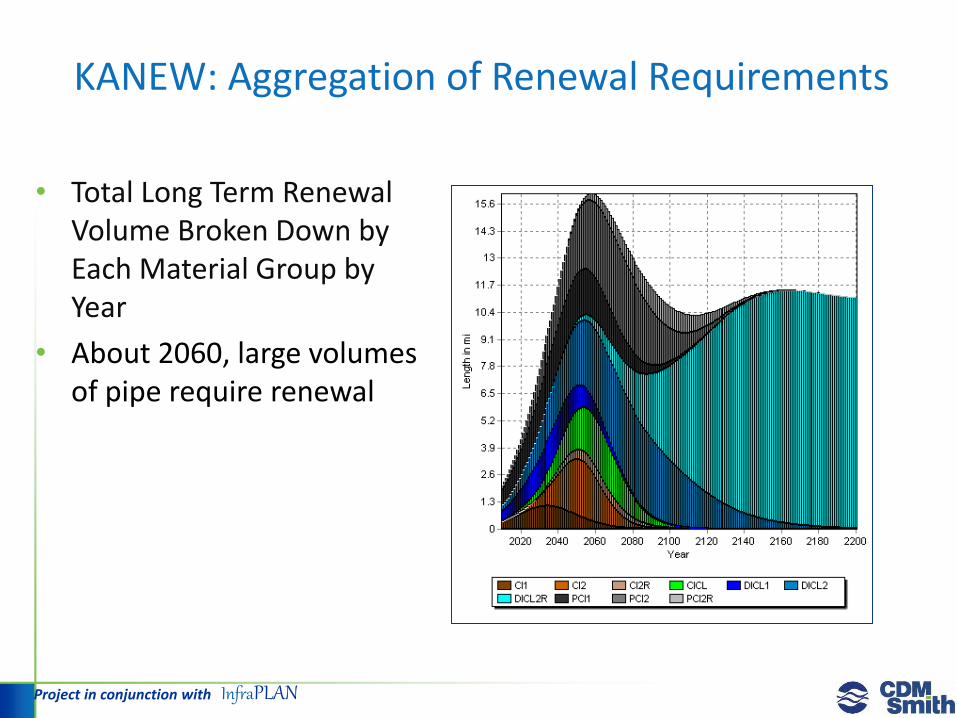
KANEW: Aggregation of Renewal Requirements
• Total Long Term Renewal Volume Broken Down by Each Material Group by Year
• About 2060, large volumes of pipe require renewal
Project in conjunction with InfraPLAN

• “What if Scenarios” to Level Out Renewal Volume
• Sustainable Volume Over the Long Term
Final Projected Renewal by Material
KANEW – Determining Long Term Needs
Project in conjunction with InfraPLAN

What is LEYP?
Linear Extension of the Yule Process model computes the possible number of failures on a water main with known characteristics within any time interval.
Predicted Number of Breaks
Soil Types
Past Breaks
Pipe Data
Value of LEYP
Use the data to spot correlations and trends
Is there a correlation and how strong is it? Is age related to failure likelihood? How much?
Do soils impact pipe failures? How much?
Leverage and test anecdotal information “Pipes in this area with bad soils fail more”
Replacement for “point” based systems
Advanced statistics can provide quantitative data about the pipes by leveraging historic break data
20
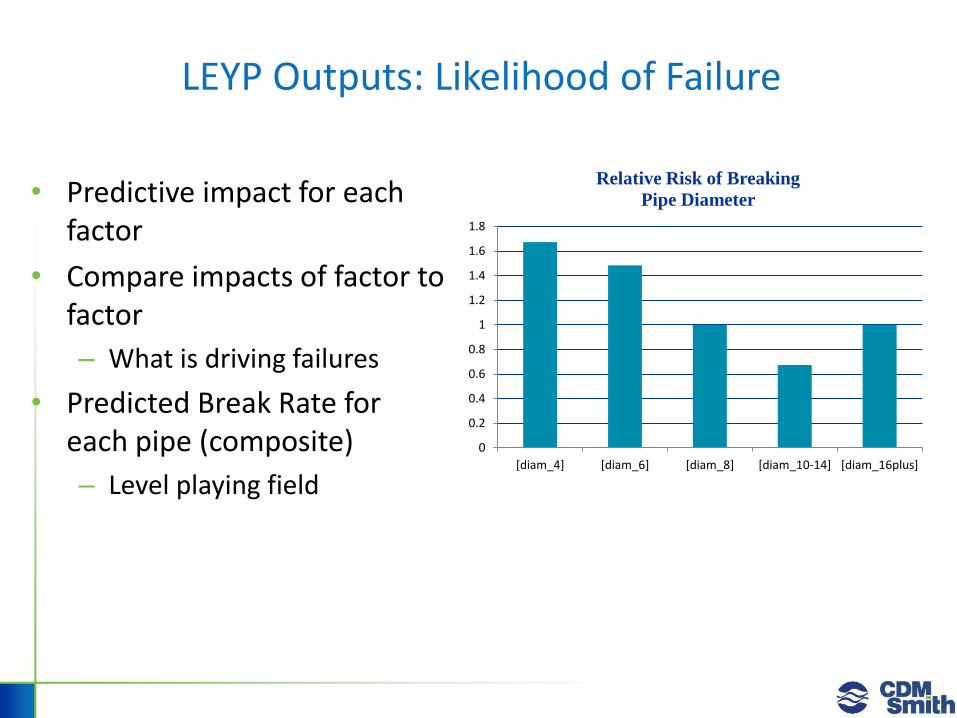
LEYP Outputs: Likelihood of Failure
• Predictive impact for each factor
• Compare impacts of factor to factor
– What is driving failures
• Predicted Break Rate for each pipe (composite)
– Level playing field
0
0.2
0.4
0.6
0.8
1
1.2
1.4
1.6
1.8
[diam_4] [diam_6] [diam_8] [diam_10-14] [diam_16plus]
Relative Risk of Breaking
Pipe Diameter
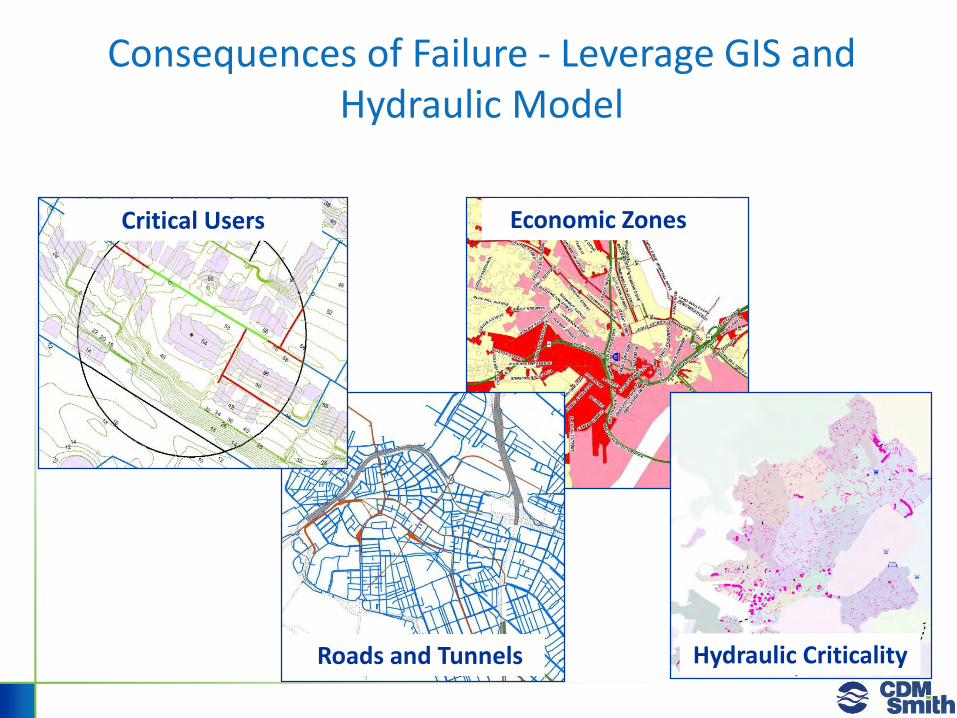
Consequences of Failure - Leverage GIS and Hydraulic Model
Economic ZonesCritical Users
Roads and Tunnels Hydraulic Criticality
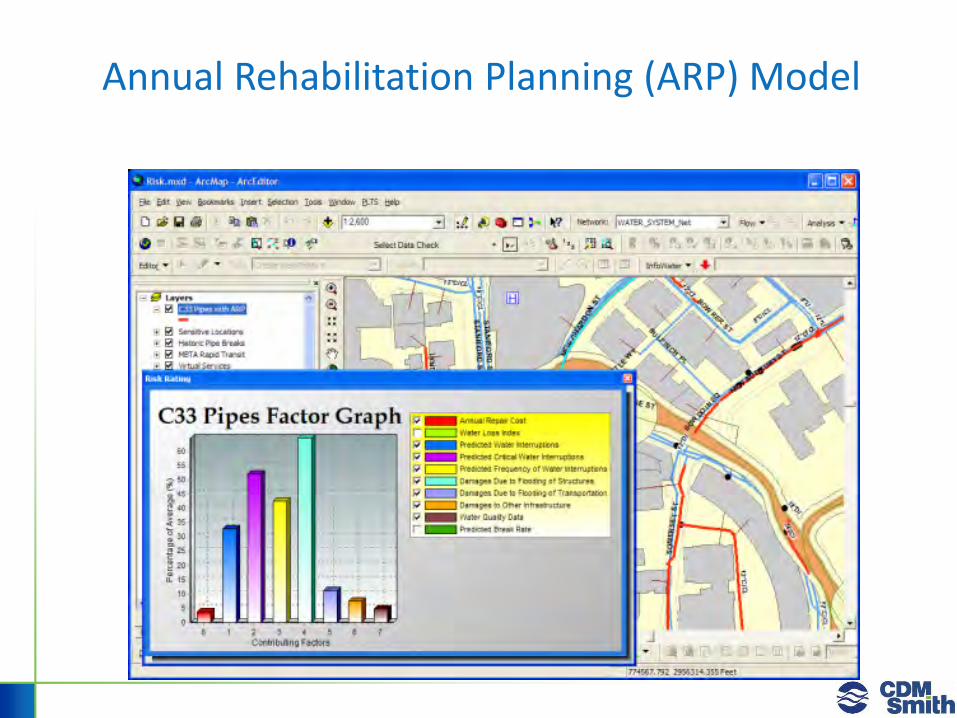
Annual Rehabilitation Planning (ARP) Model
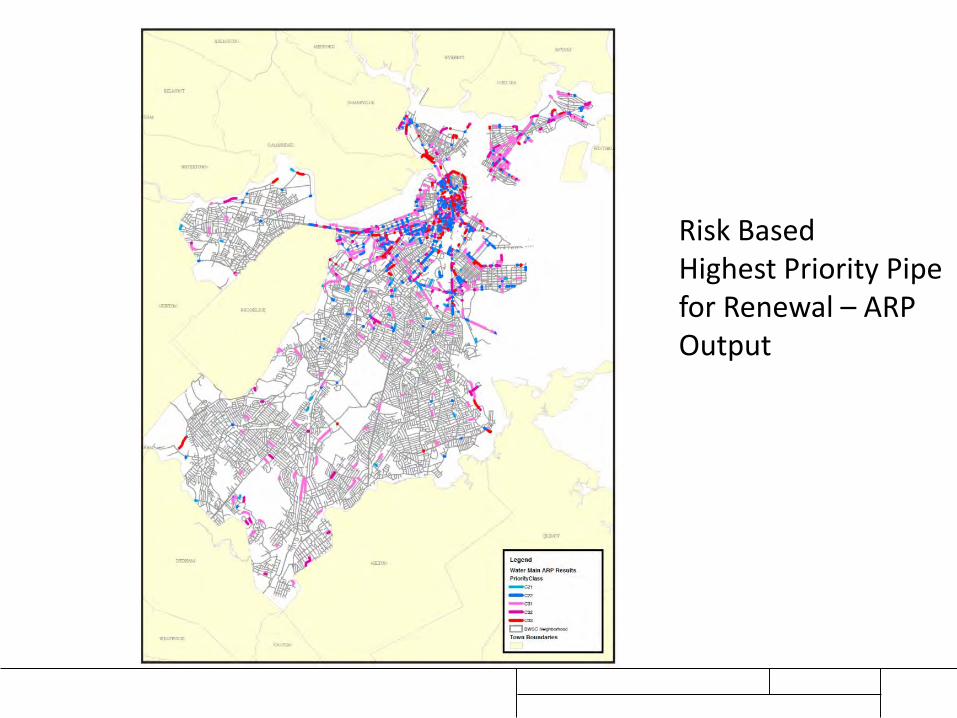
Risk BasedHighest Priority Pipe for Renewal – ARP Output
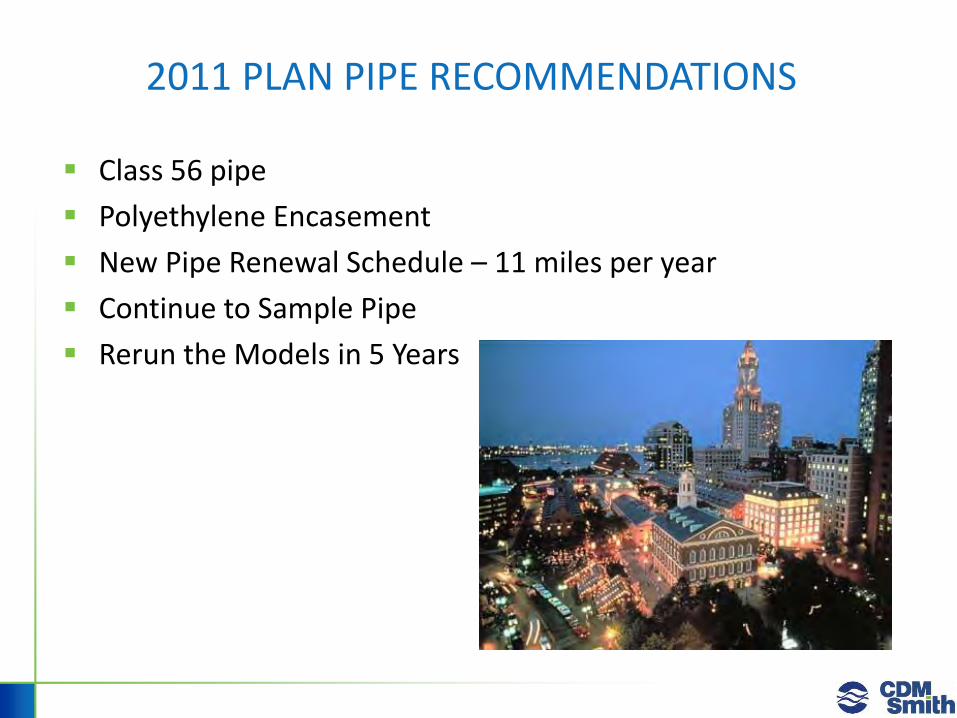
2011 PLAN PIPE RECOMMENDATIONS
Class 56 pipe
Polyethylene Encasement
New Pipe Renewal Schedule – 11 miles per year
Continue to Sample Pipe
Rerun the Models in 5 Years

Capital Plans
GIS Data
Hydraulic Model
O&M Data
CMMS
Field Samples
Anecdotal Data
CapPlan®/InfoMaster
Defensible &
Sustainable
Capital
PlanningManagement
Strategies
KANEW
Casses/LEYP
2016 BWSC Water Distribution Pipe Ranking Update Project
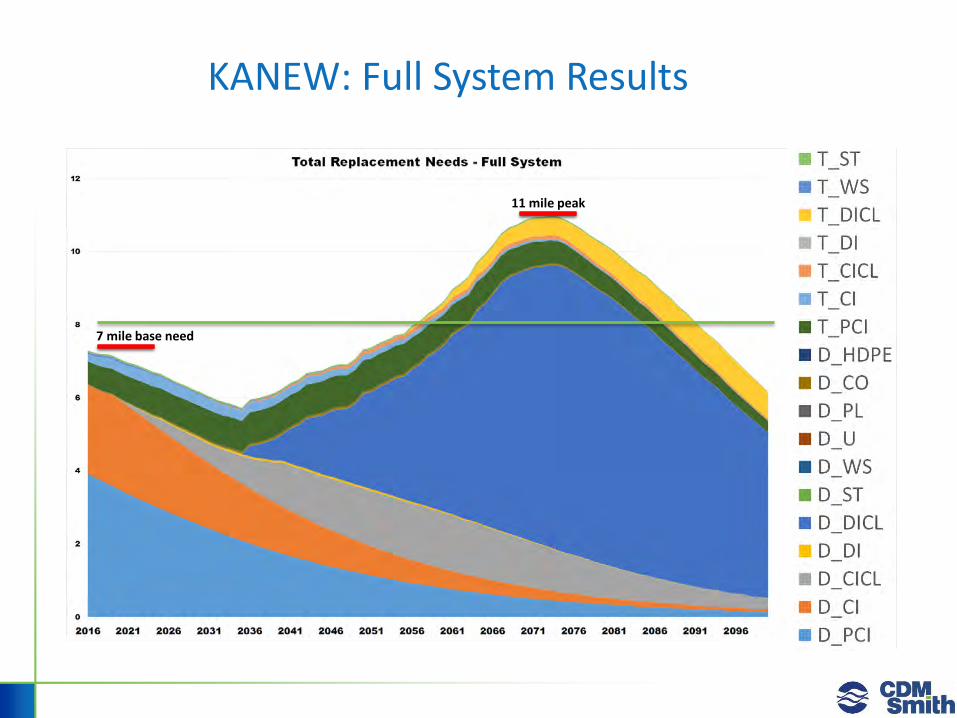
KANEW: Full System Results
7 mile base need
11 mile peak

Factors Tested in LEYP Statistical Model Update
Diameter
Material
Date of installation
Soil type
Pressure
Breaks
0.0
2.0
4.0
6.0
8.0
10.0
12.0
14.0
16.0
18.0
0.00
5.00
10.00
15.00
20.00
25.00
30.00
18
48
18
60
18
68
18
73
18
78
18
83
18
88
18
93
18
98
19
03
19
08
19
13
19
18
19
23
19
28
19
33
19
38
19
43
19
48
19
53
19
58
19
63
19
68
19
73
19
78
19
83
19
88
19
93
19
98
20
03
20
08
20
13
Bre
aks
per
Mile
Mile
s o
f P
ipe
Breaks Rate by Year Installed
Miles of Pipe Break Rate Linear (Break Rate)
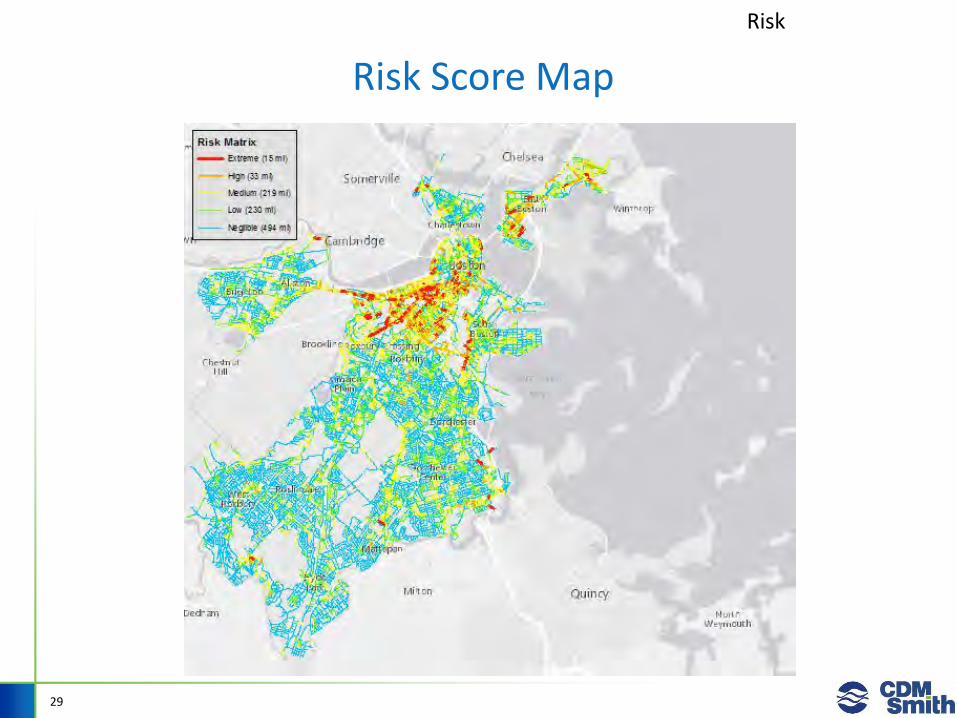
Risk Score Map
29
Risk

2016 PLAN PIPE RECOMMENDATIONS
60 miles of pipe in extreme and high risk categories
New Pipe Renewal Schedule – 8 miles per year
Continue to Sample Pipe
Rerun the Models in 5 Years
Questions?Charlie Jewell
Ph: (617) 989-7431
James J. Pescatore, P.E.
Ph: (617) 452-6567