Embed Size (px)
Citation preview

DATA M
ANAGEMENT &
PROBABILI
TY F
INAL
JEOPA
RDY
GR
AD
E 7
MA
TH

Graphs Mean, median,
Mode
Interpreting Data
Probability Outliers
100 100 100 100 100
200 200 200 200 200
300 300 300 300 300
400 400 400 400 400
500 500 500 500 500

GRAPHS 100
Name four types of graphs
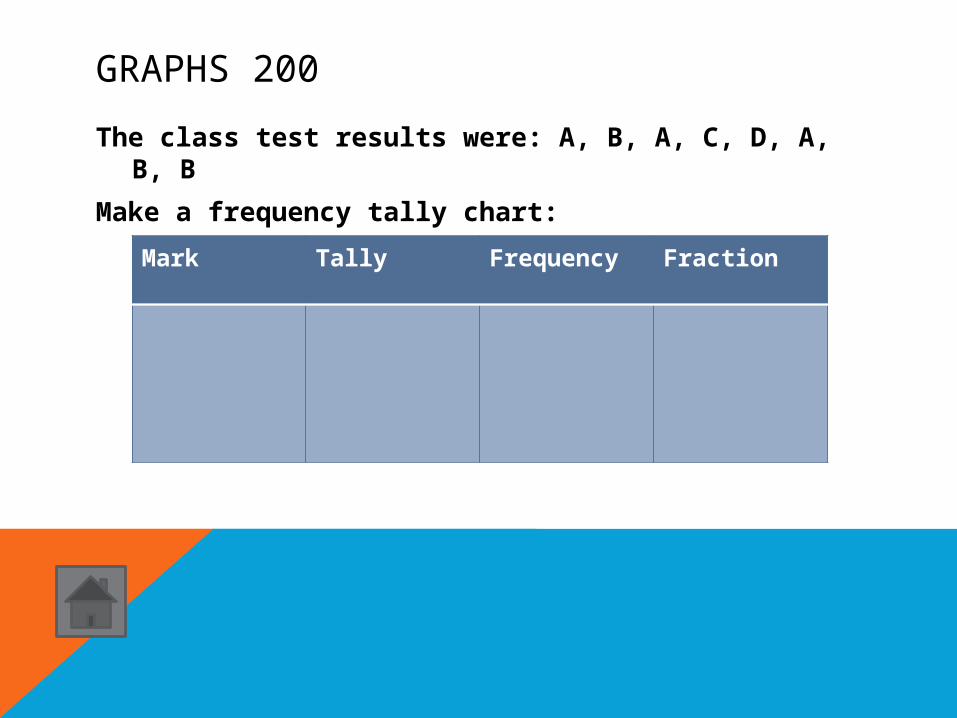
GRAPHS 200
The class test results were: A, B, A, C, D, A, B, B
Make a frequency tally chart:
Mark Tally Frequency Fraction

GRAPHS 300

GRAPHS 400
Name all the parts of a graph

GRAPHS 500
Provide an example of the information each type of graph represents:
Pie graph:
Line graph:
Bar graph:
Area graph:

MEAN, MEDIAN, MODE 100
What is the mean
5, 7, 10, 44, 60
Answer: 25.2

MEAN, MEDIAN, MODE 200

MEAN, MEDIAN, MODE 300
Find the mean, median and mode
2, 4, 4, 7, 8
Mean:
Median:
Mode:
Answer: 544

MEAN, MEDIAN, MODE 400

MEAN, MEDIAN, MODE 500

INTERPRETING DATA 100
What colour are you most likely to spin on this spinner?
Answer: red

INTERPRETING DATA 200

INTERPRETING DATA 300

INTERPRETING DATA 400

INTERPRETING DATA 500
A school’s theatre has 16 seats in the first row, 20 seats in the second row, 24 seats in the third row and so on.
Make a table of values to show the number of seats in the first 6 rows.
Draw a graph showing the data from the table of values.
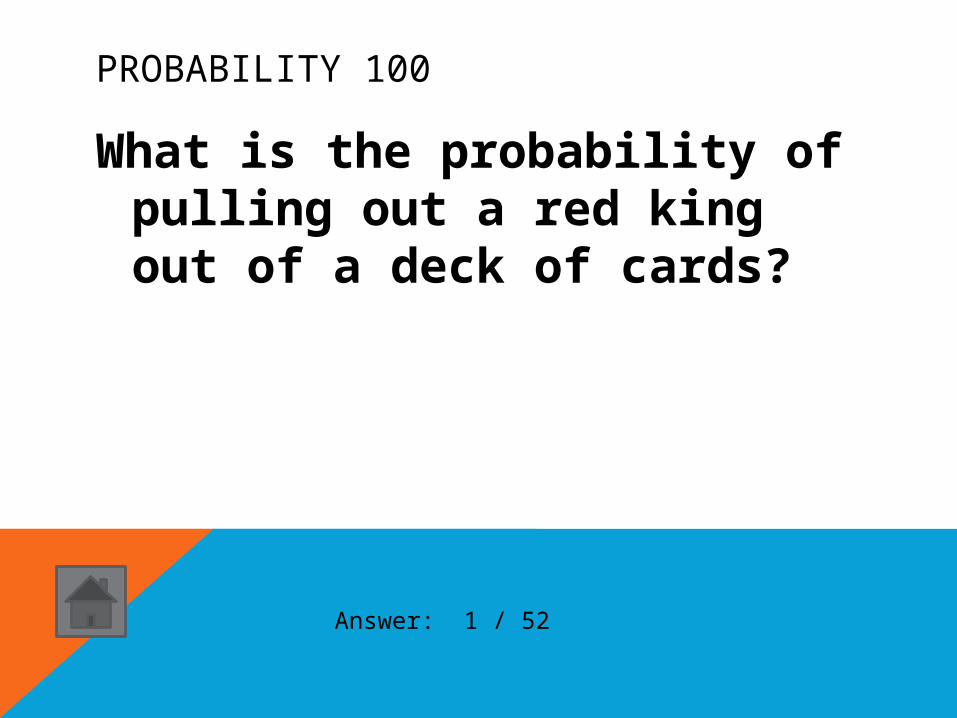
PROBABILITY 100
What is the probability of pulling out a red king out of a deck of cards?
Answer: 1 / 52

PROBABILITY 200
What are the chances of pulling a red marble?
Answer: 1/5

PROBABILITY 300
Give an example of an event that is certain and impossible
Answer: it is certain that we will have track and field MondayIt is impossible that I will drive a flying car today

PROBABILITY 400
Colour the squares to match the probability 4/8
Answer: 4 / 8 = 12/ 24 = (1/2)

PROBABILITY 500
What is the probability of spinning a
blue on all the spinners?
Answer: 6 / 24

OUTLIERS 100
What is the outlier
28, 24, 35, 38, 21, 32, 46
Answer: 46

OUTLIERS 200
List 10 places you could find outcomes of an event
Answer: casino, sports, gorse racing, a fair, litter of animals, tests, lottery, ….

OUTLIERS 300

OUTLIERS 400
Which is the outlier?
Answer: ABC because it is a core subject not extracurricular

OUTLIERS 500
Make up an independent event using spinners, marbles or dice