Embed Size (px)
Citation preview
Data Mining ConceptsData Mining ConceptsWipro TechnologiesWipro Technologies
AgendaAgenda
►The Data mining TechnologyThe Data mining Technology►Data mining Process Data mining Process
Data Preparation Data Preparation Data Mining ModelsData Mining Models
►Data Mining TechniquesData Mining Techniques►Data Mining Applications & ToolsData Mining Applications & Tools►Data Mining MethodologiesData Mining Methodologies
The Data mining The Data mining TechnologyTechnology
A Problem...A Problem...
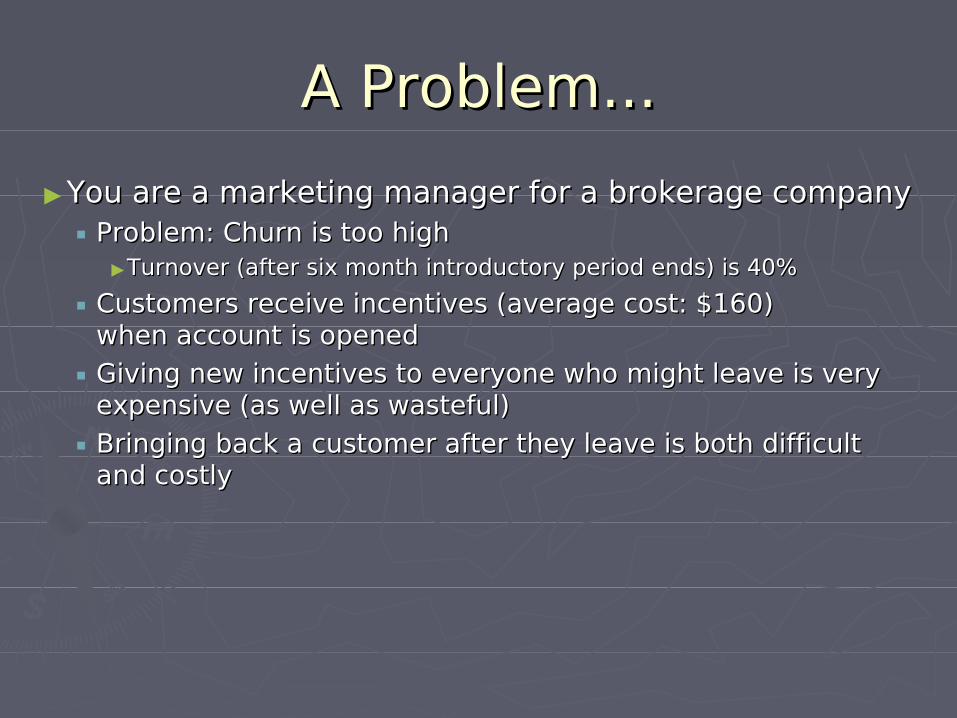
►You are a marketing manager for a brokerage company You are a marketing manager for a brokerage company Problem: Churn is too high Problem: Churn is too high
►Turnover (after six month introductory period ends) is 40% Turnover (after six month introductory period ends) is 40%
Customers receive incentives (average cost: $160) Customers receive incentives (average cost: $160) when account is opened when account is opened
Giving new incentives to everyone who might leave is very Giving new incentives to everyone who might leave is very expensive (as well as wasteful) expensive (as well as wasteful)
Bringing back a customer after they leave is both difficult Bringing back a customer after they leave is both difficult and costlyand costly
… … A SolutionA Solution
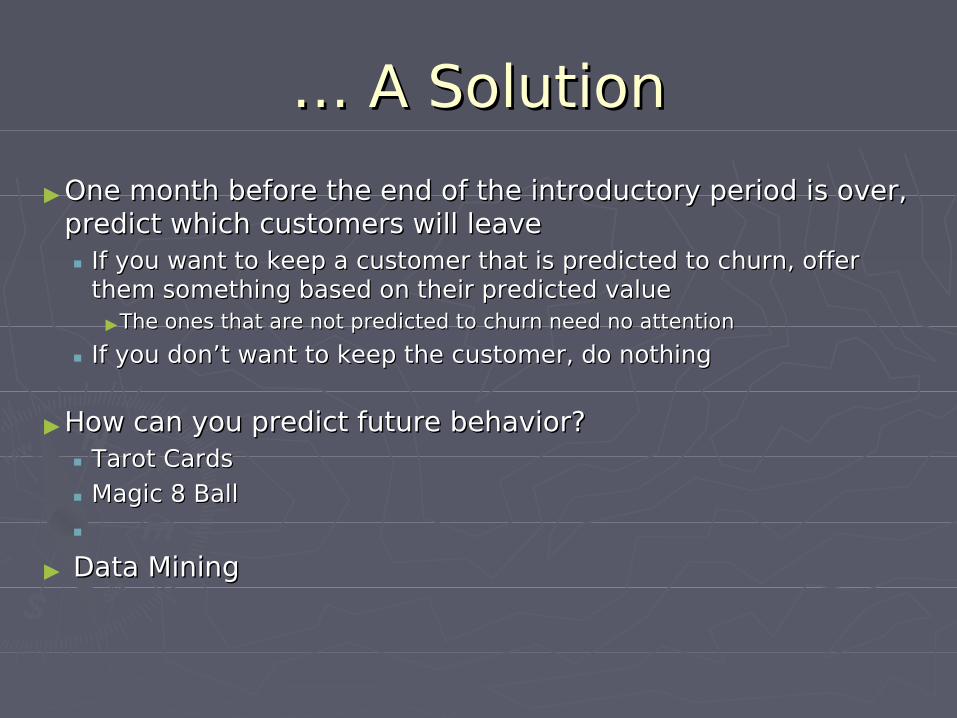
►One month before the end of the introductory period is over, One month before the end of the introductory period is over, predict which customers will leave predict which customers will leave If you want to keep a customer that is predicted to churn, offer If you want to keep a customer that is predicted to churn, offer
them something based on their predicted value them something based on their predicted value ►The ones that are not predicted to churn need no attention The ones that are not predicted to churn need no attention
If you don’t want to keep the customer, do nothingIf you don’t want to keep the customer, do nothing
►How can you predict future behavior? How can you predict future behavior? Tarot Cards Tarot Cards
Magic 8 Ball Magic 8 Ball
► Data MiningData Mining
Data Mining : Why now ?Data Mining : Why now ?
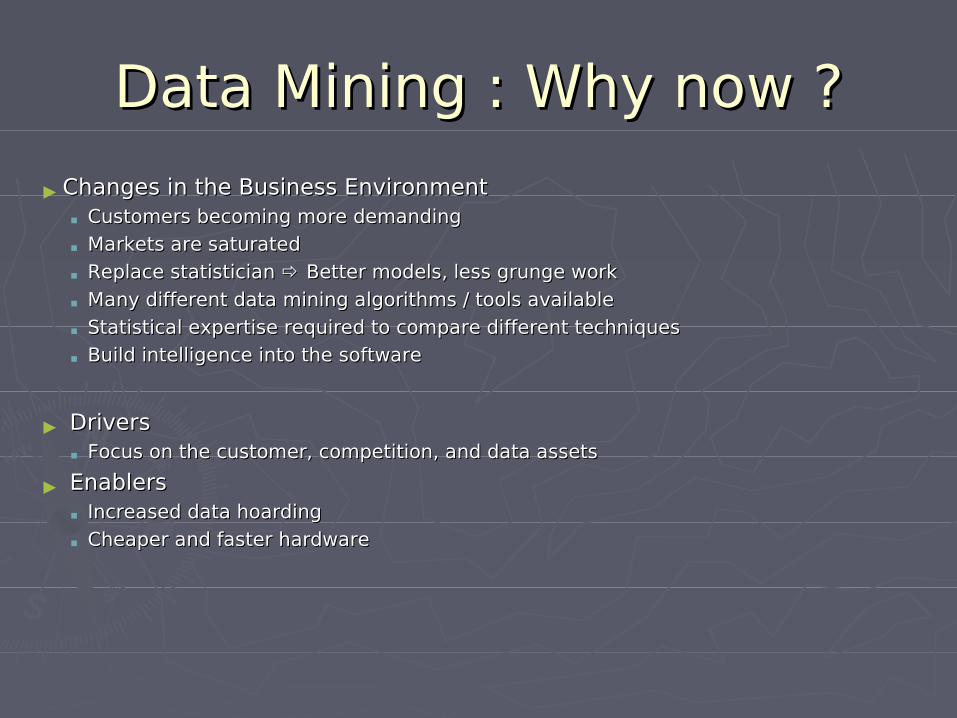
► Changes in the Business EnvironmentChanges in the Business Environment
Customers becoming more demandingCustomers becoming more demanding
Markets are saturatedMarkets are saturated
Replace statistician Replace statistician Better models, less grunge work Better models, less grunge work
Many different data mining algorithms / tools available Many different data mining algorithms / tools available
Statistical expertise required to compare different techniques Statistical expertise required to compare different techniques
Build intelligence into the softwareBuild intelligence into the software
► DriversDrivers
Focus on the customer, competition, and data assetsFocus on the customer, competition, and data assets
► EnablersEnablers
Increased data hoardingIncreased data hoarding
Cheaper and faster hardwareCheaper and faster hardware
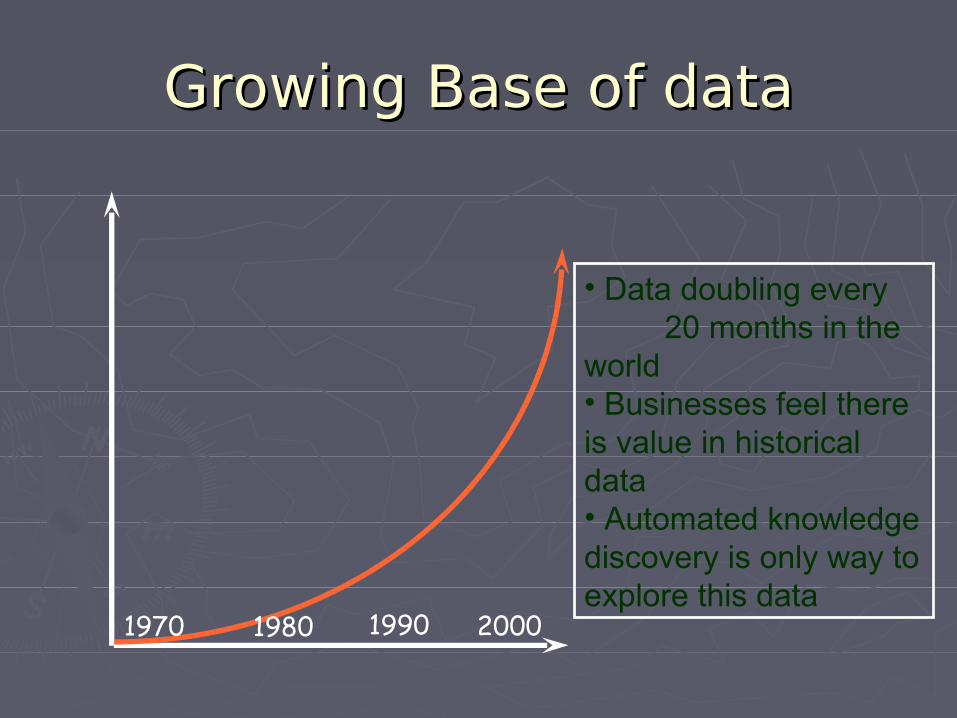
1970 20001980 1990
• Data doubling every 20 months in the world• Businesses feel there is value in historical data• Automated knowledge discovery is only way to explore this data
Growing Base of dataGrowing Base of data
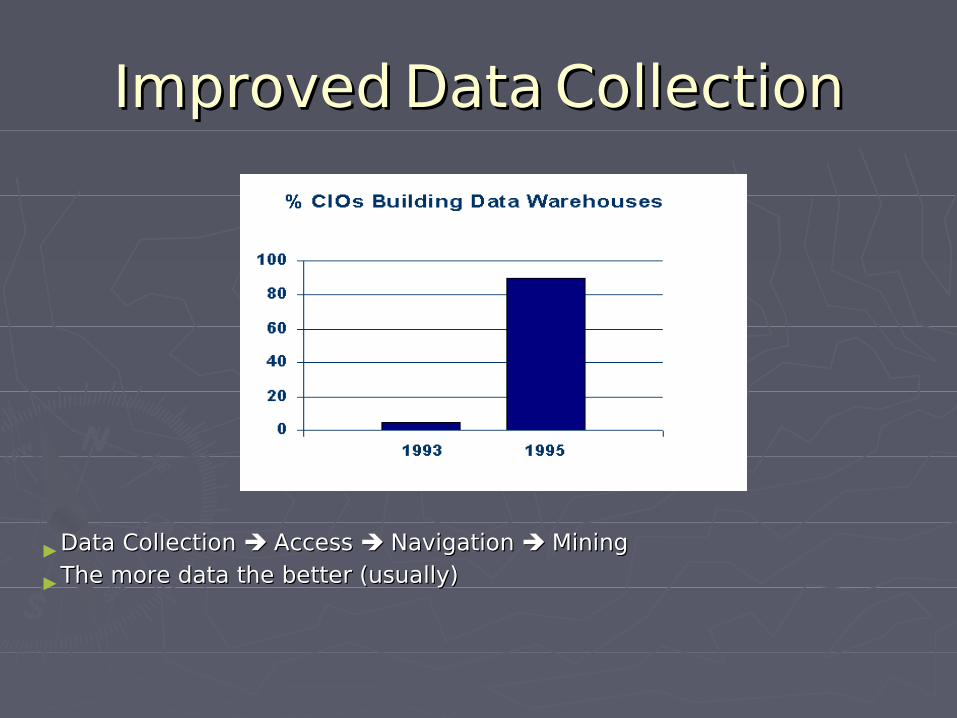
ImprovedImproved DataData CollectionCollection
►Data Collection Data Collection Access Access Navigation Navigation Mining Mining
►The more data the better (usually)The more data the better (usually)
Improved AlgorithmsImproved Algorithms
►Techniques have often been waiting for computing Techniques have often been waiting for computing technology to catch up technology to catch up
►Statisticians already doing “manual data mining” Statisticians already doing “manual data mining”
►Good machine learning is just the intelligent Good machine learning is just the intelligent application of statistical processes application of statistical processes
►A lot of data mining research focused on tweaking A lot of data mining research focused on tweaking existing techniques to get small percentage gainsexisting techniques to get small percentage gains
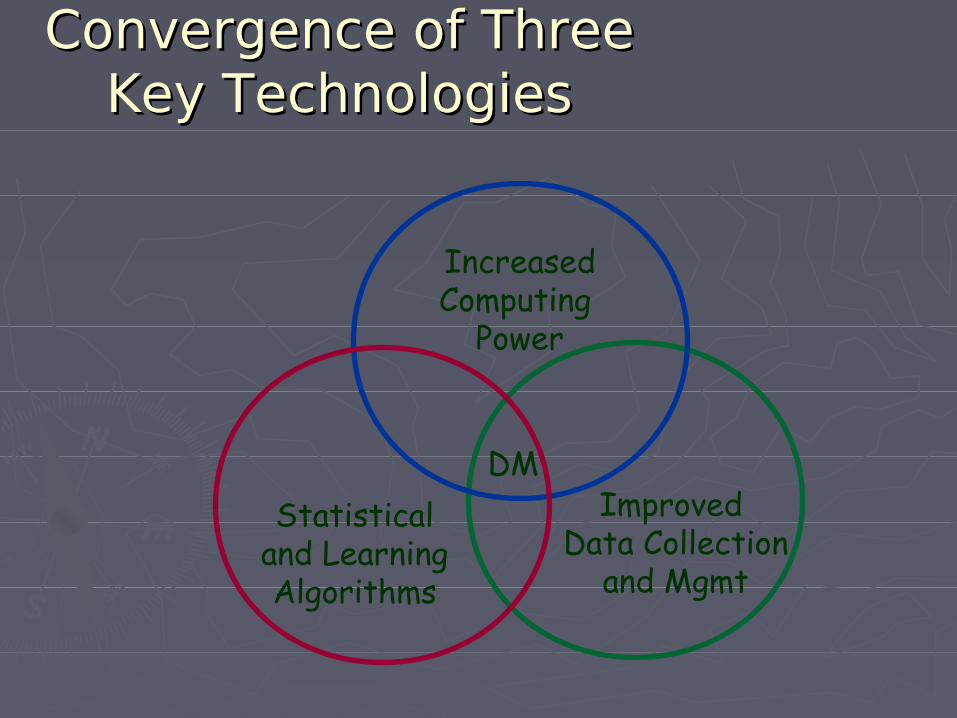
Convergence of Three Convergence of Three Key TechnologiesKey Technologies
IncreasedComputing
Power
Statisticaland LearningAlgorithms
Improved Data Collection
and Mgmt
DM
Motivation for doing Data Motivation for doing Data MiningMining
► Investment in Data Collection/Data WarehouseInvestment in Data Collection/Data Warehouse
►Add value to the data holdingAdd value to the data holding
►Competitive advantageCompetitive advantage
►More effective decision makingMore effective decision making
► OLTP =) Data Warehouse =) Decision SupportOLTP =) Data Warehouse =) Decision Support
►Work to add value to the data holdingWork to add value to the data holding
►Support high level and long term decision makingSupport high level and long term decision making
►Fundamental move in use of DatabasesFundamental move in use of Databases
Data Mining - DefinitionData Mining - Definition
►Data mining is the automated detection for new, valuable and Data mining is the automated detection for new, valuable and non trivial information in large volumes of data.non trivial information in large volumes of data.
► It predicts future trends and finds behavior that the experts It predicts future trends and finds behavior that the experts may miss because it lies outside their expectationsmay miss because it lies outside their expectations Data mining lets you be proactive Data mining lets you be proactive
Prospective rather than RetrospectiveProspective rather than Retrospective
►Data Mining Leads to simplification and automation of the Data Mining Leads to simplification and automation of the overall statistical process of deriving information from huge overall statistical process of deriving information from huge volume of data.volume of data.
Data Mining IntroductionData Mining Introduction
►DM - what it can doDM - what it can do Exploit patterns & relationships in data to produce Exploit patterns & relationships in data to produce
modelsmodels Two uses for models: Two uses for models:
►PredictivePredictive►DescriptiveDescriptive
►DM - what it can’t doDM - what it can’t do Automatically find relationships Automatically find relationships
►without user interventionwithout user intervention►when no relationships existwhen no relationships exist
Data Mining IntroductionData Mining Introduction
►Data Mining and Data WarehousingData Mining and Data Warehousing Data preparation for DM may be part of the Data Data preparation for DM may be part of the Data
WarehousingWarehousing
Data Warehouse not a requirement for Data MiningData Warehouse not a requirement for Data Mining
►DM and OLAPDM and OLAP OLAP = Classic descriptive modelOLAP = Classic descriptive model
Requires significant user inputRequires significant user input Example : Beer and diaper salesExample : Beer and diaper sales
►An OLAP tools shows reports giving sales of different items An OLAP tools shows reports giving sales of different items ►A data mining tool analyses the data and predicts ‘how A data mining tool analyses the data and predicts ‘how
many times beer and diapers are sold togethermany times beer and diapers are sold together
Data Mining IntroductionData Mining Introduction
►DM and Classical StatisticsDM and Classical Statistics Classical statistics based on elegant theory Classical statistics based on elegant theory
and restrictive data assumptionsand restrictive data assumptions Fine if data sets small and assumptions metFine if data sets small and assumptions met Modeler plays active role - specifying model Modeler plays active role - specifying model
form, interactions, etcform, interactions, etc In newer tools, pattern finding is data-driven In newer tools, pattern finding is data-driven
rather than user-drivenrather than user-driven
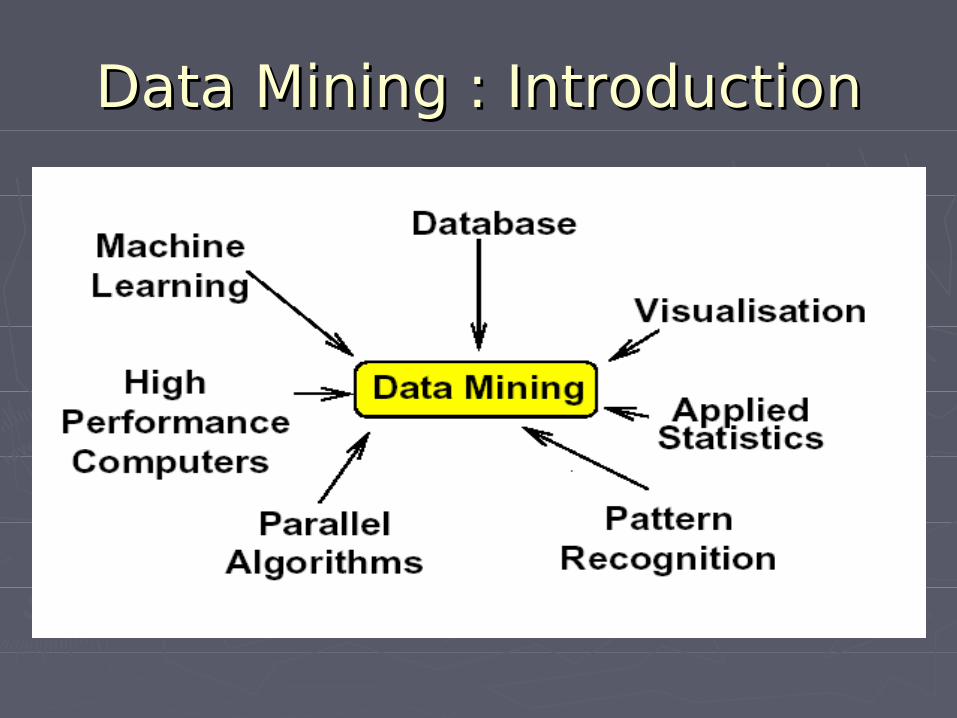
Data Mining : IntroductionData Mining : Introduction
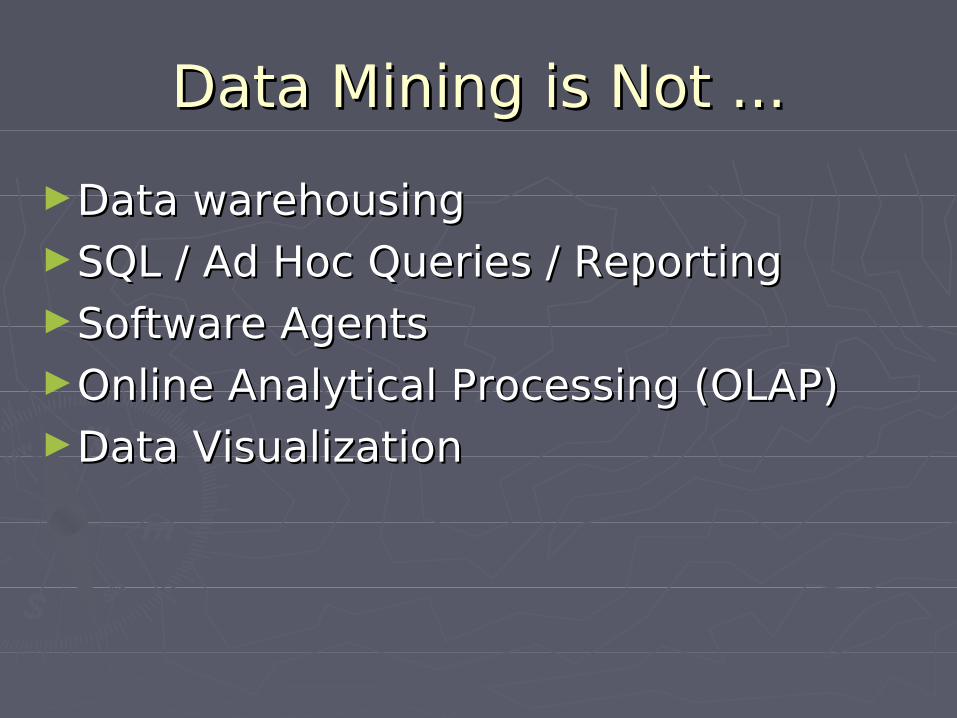
Data Mining is Not ...Data Mining is Not ...
►Data warehousing Data warehousing ►SQL / Ad Hoc Queries / Reporting SQL / Ad Hoc Queries / Reporting ►Software Agents Software Agents ►Online Analytical Processing (OLAP) Online Analytical Processing (OLAP) ►Data VisualizationData Visualization
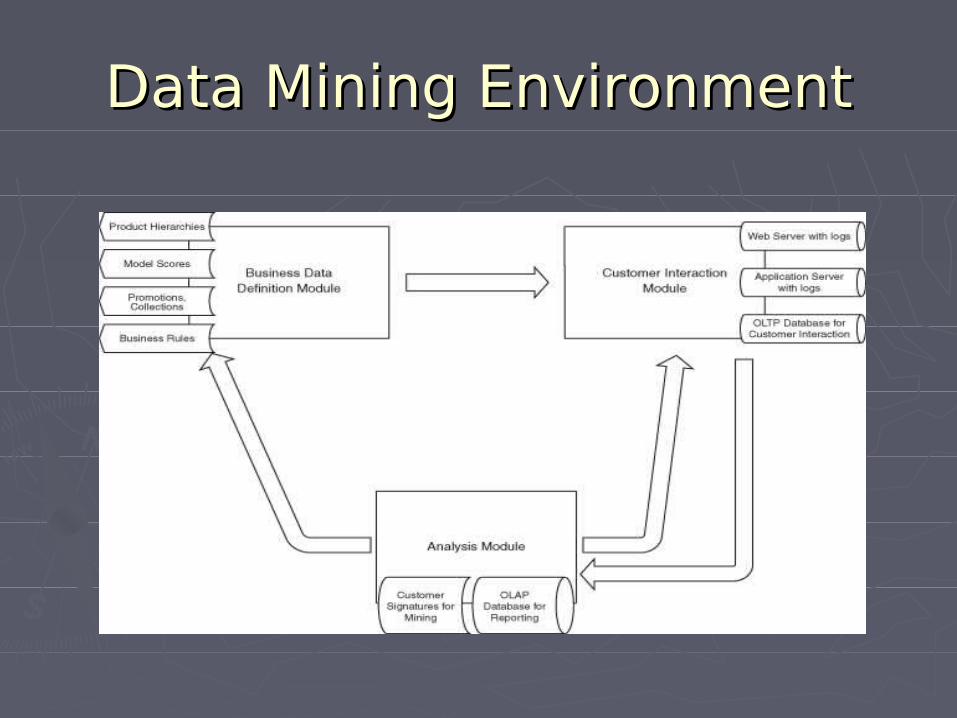
Data Mining EnvironmentData Mining Environment
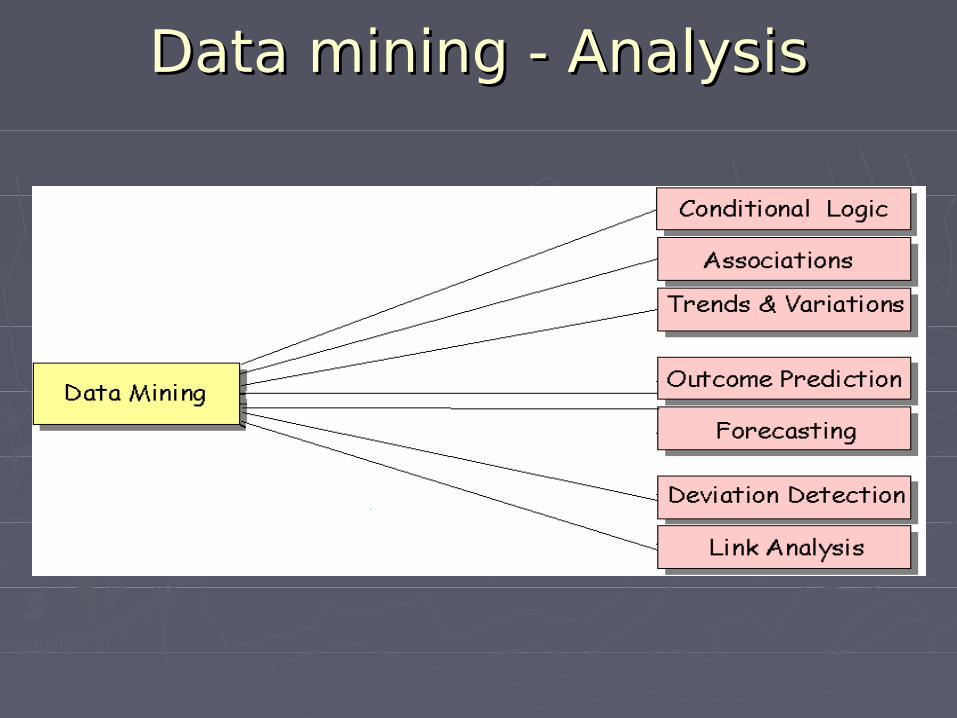
Data mining - AnalysisData mining - Analysis
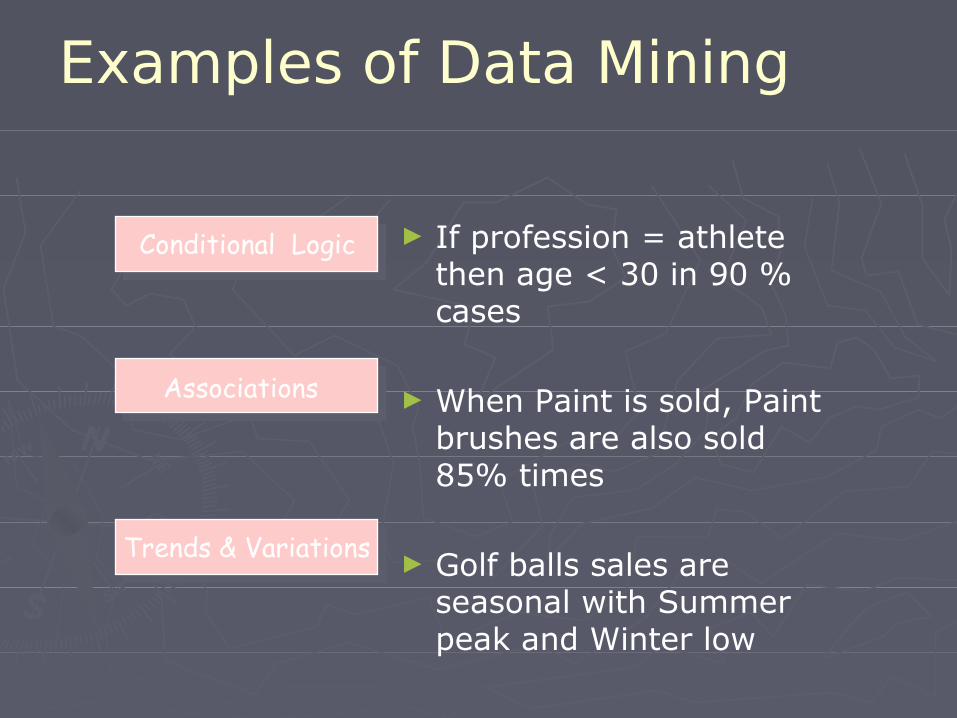
Examples of Data Mining
► If profession = athlete then age < 30 in 90 % cases
► When Paint is sold, Paint brushes are also sold 85% times
► Golf balls sales are seasonal with Summer peak and Winter low
Conditional Logic
Associations
Trends & Variations
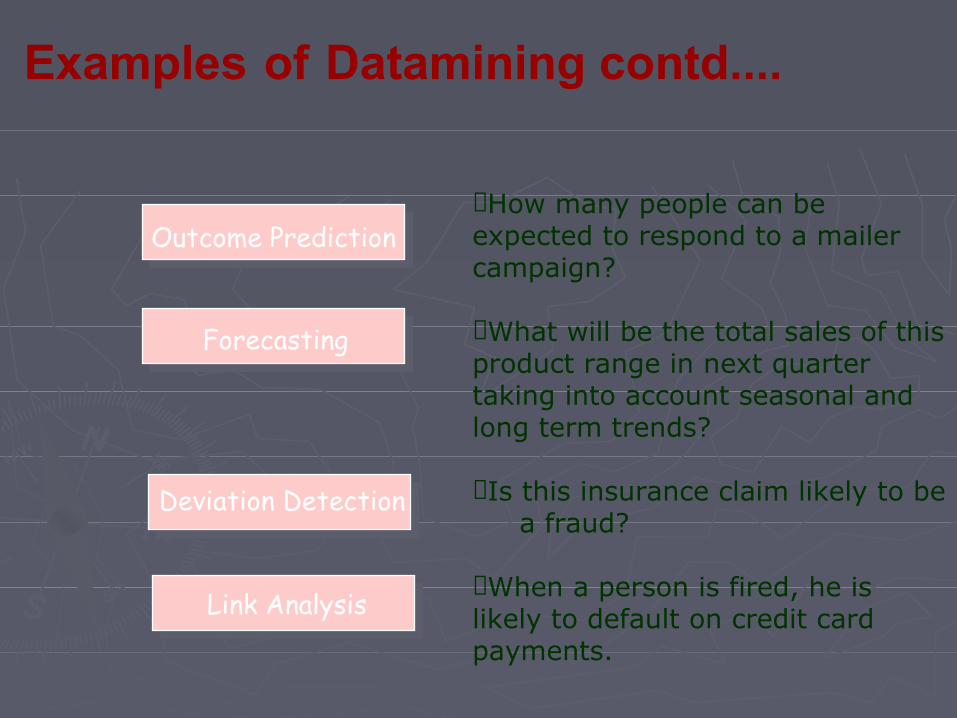
Outcome Prediction
Forecasting
Deviation Detection
Link Analysis
Examples of Datamining contd....
✠How many people can be expected to respond to a mailer campaign?
✠What will be the total sales of this product range in next quarter taking into account seasonal and long term trends?
✠Is this insurance claim likely to be a fraud?
✠When a person is fired, he is likely to default on credit card payments.
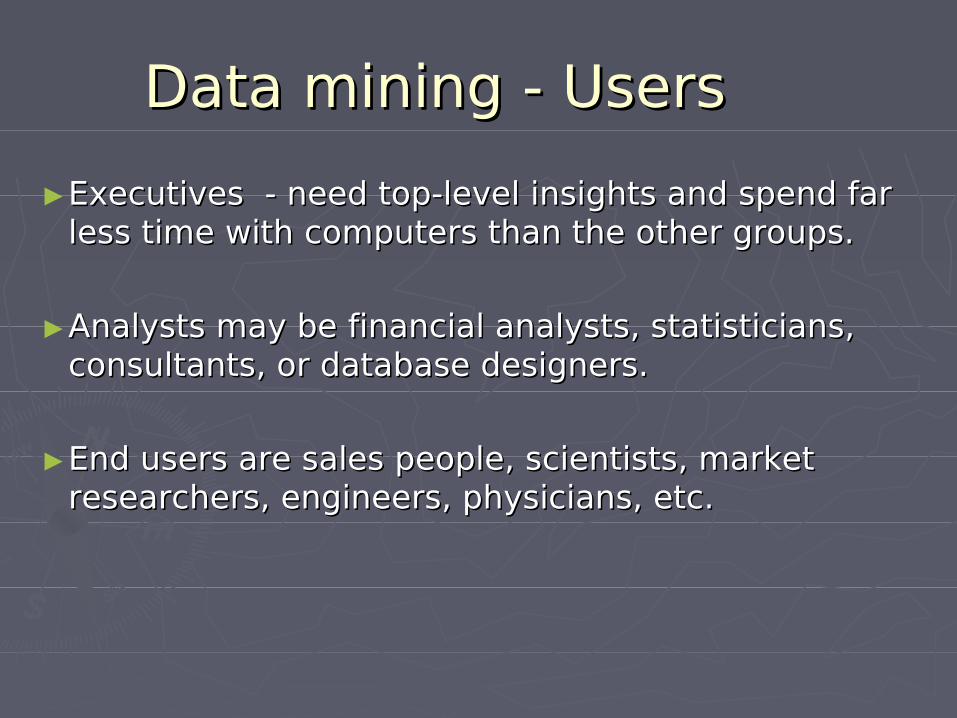
Data mining - UsersData mining - Users
►Executives - need top-level insights and spend far Executives - need top-level insights and spend far less time with computers than the other groups. less time with computers than the other groups.
►Analysts may be financial analysts, statisticians, Analysts may be financial analysts, statisticians, consultants, or database designers. consultants, or database designers.
►End users are sales people, scientists, market End users are sales people, scientists, market researchers, engineers, physicians, etc. researchers, engineers, physicians, etc.
The Data Mining The Data Mining ProcessProcess
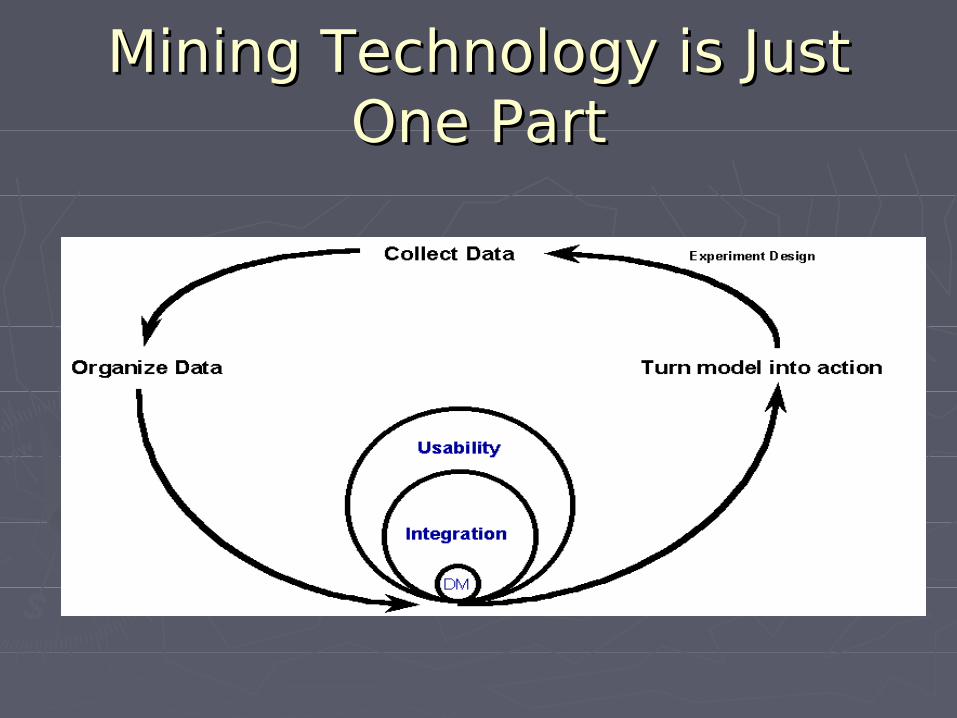
Mining Technology is Just Mining Technology is Just One PartOne Part
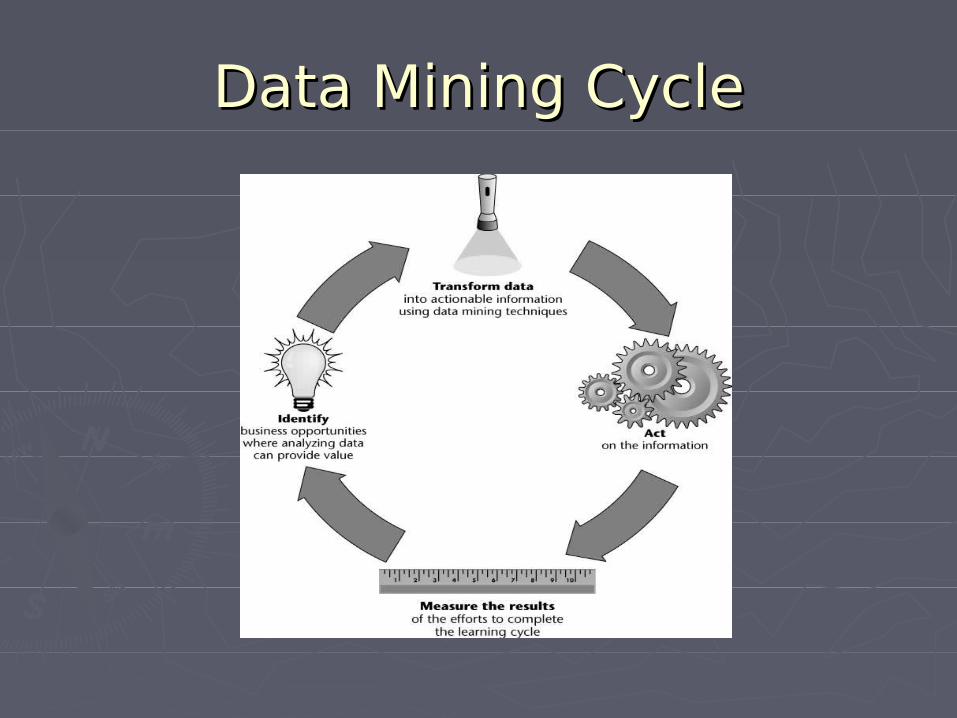
Data Mining CycleData Mining Cycle
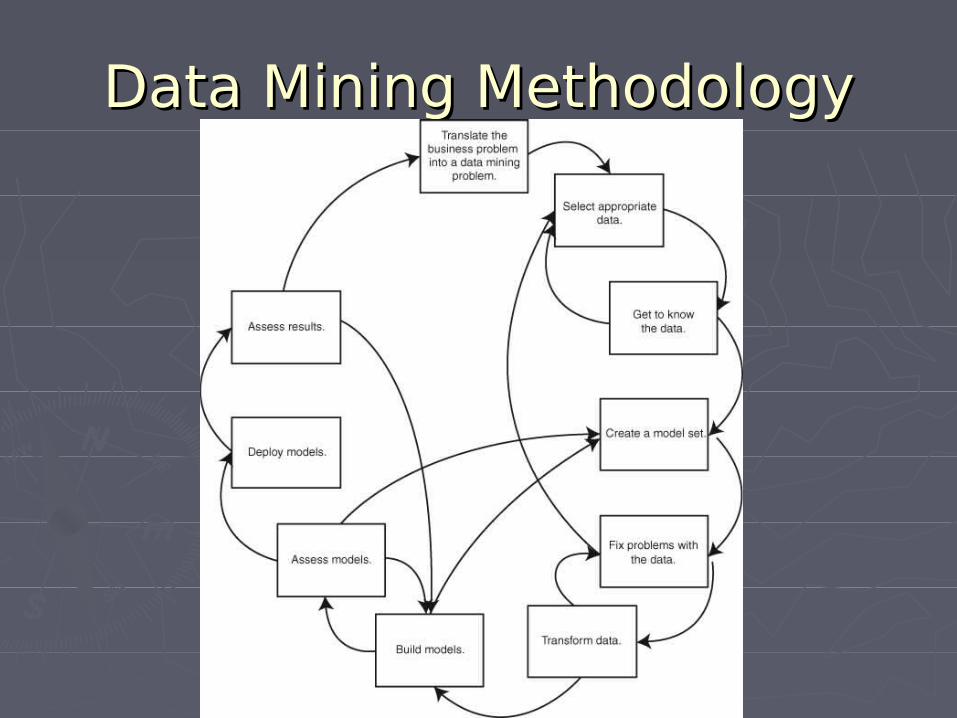
The DM ProcessThe DM Process
►Understand the Objective of the Data Understand the Objective of the Data Mining EffortMining Effort Determine the Business ProblemDetermine the Business Problem Translate Business Problem into a Data Translate Business Problem into a Data
Mining ObjectiveMining Objective
Data Mining ProcessData Mining Process
Data PreparationData Preparation
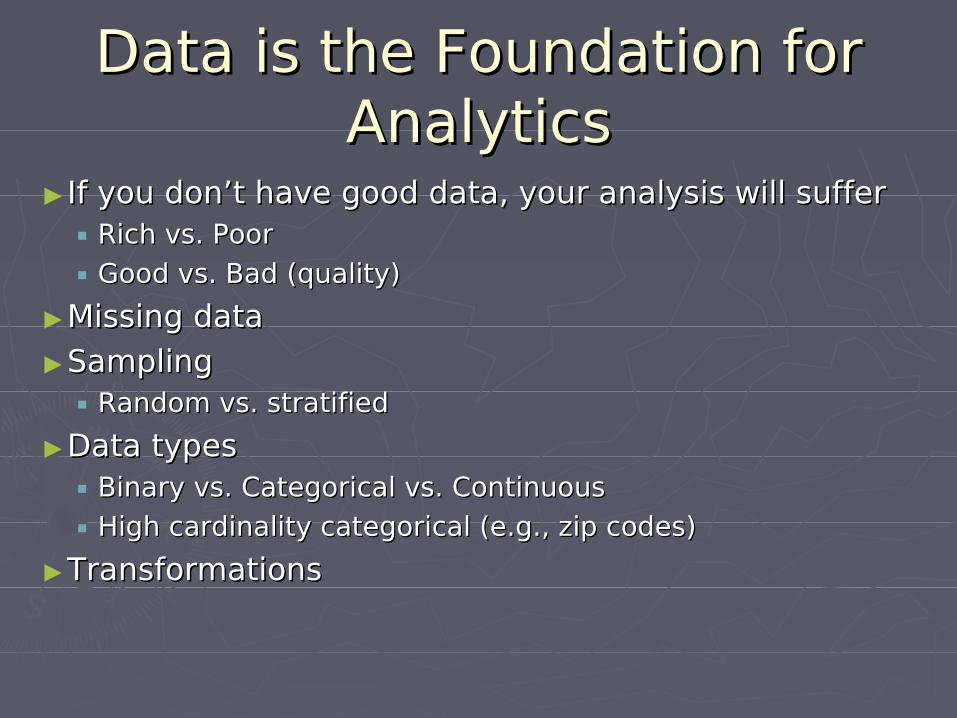
Data is the Foundation for Data is the Foundation for AnalyticsAnalytics
► If you don’t have good data, your analysis will suffer If you don’t have good data, your analysis will suffer Rich vs. Poor Rich vs. Poor
Good vs. Bad (quality) Good vs. Bad (quality)
►Missing data Missing data
►Sampling Sampling Random vs. stratified Random vs. stratified
►Data types Data types Binary vs. Categorical vs. Continuous Binary vs. Categorical vs. Continuous
High cardinality categorical (e.g., zip codes) High cardinality categorical (e.g., zip codes)
►TransformationsTransformations
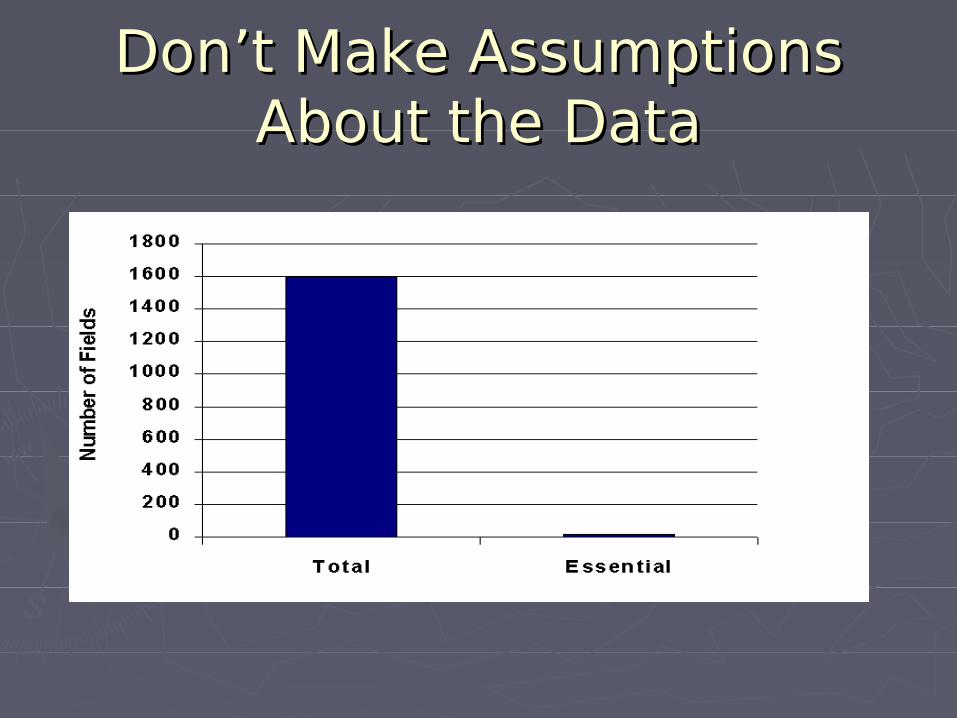
Don’t Make Assumptions Don’t Make Assumptions About the DataAbout the Data
Data PreparationData Preparation
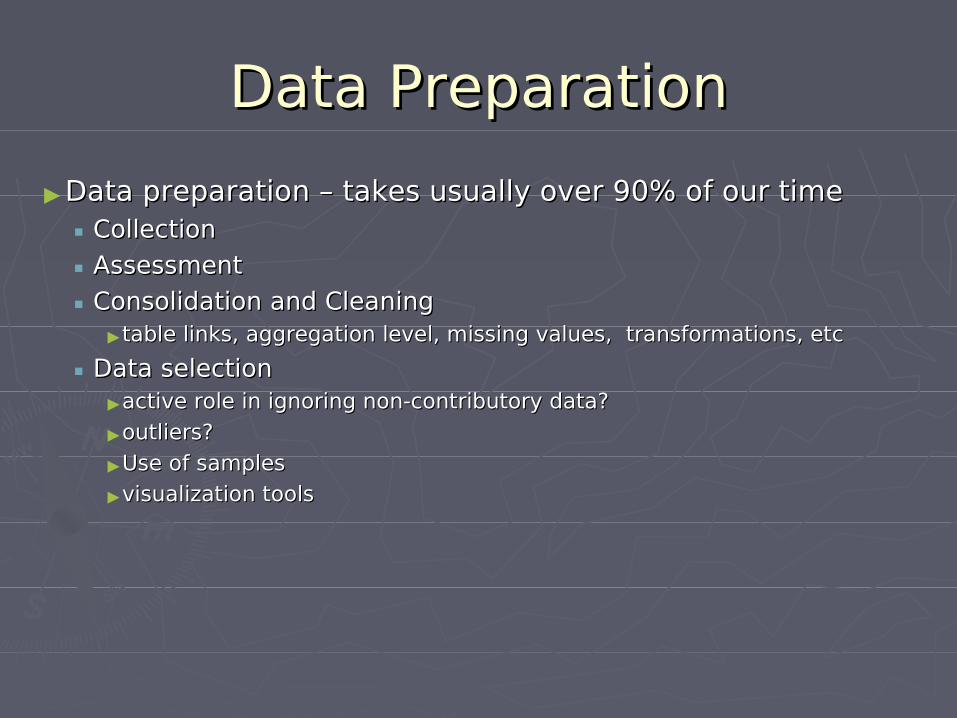
►Data preparation – takes usually over 90% of our timeData preparation – takes usually over 90% of our time CollectionCollection
AssessmentAssessment
Consolidation and CleaningConsolidation and Cleaning►table links, aggregation level, missing values, transformations, etctable links, aggregation level, missing values, transformations, etc
Data selectionData selection►active role in ignoring non-contributory data?active role in ignoring non-contributory data?
►outliers?outliers?
►Use of samplesUse of samples
►visualization toolsvisualization tools
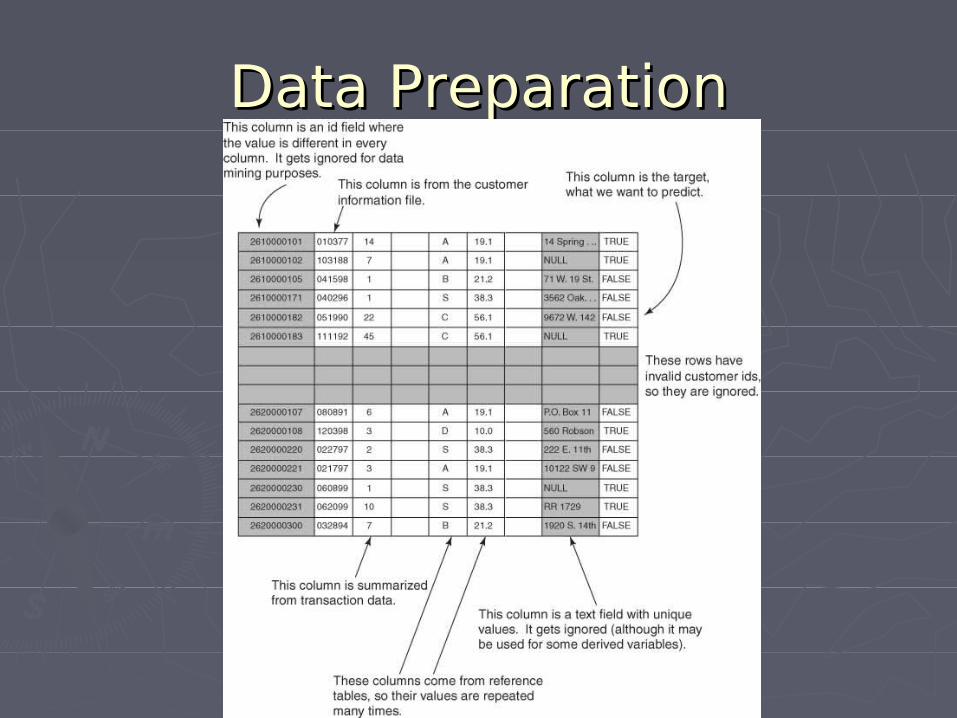
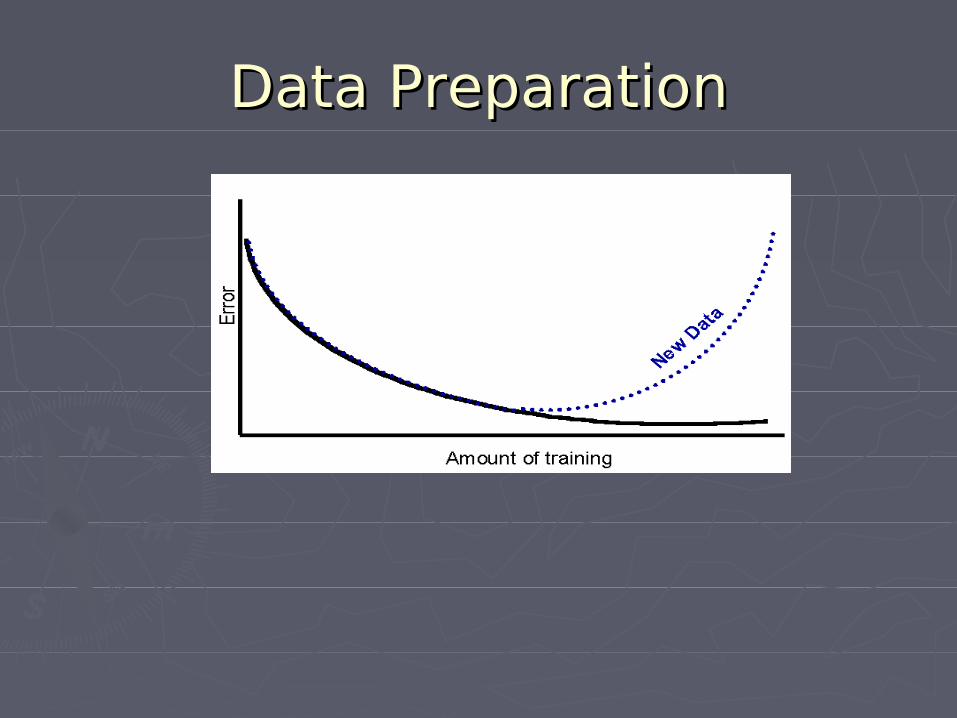
Data PreparationData Preparation
Data PreparationData Preparation
Data PreparationData Preparation
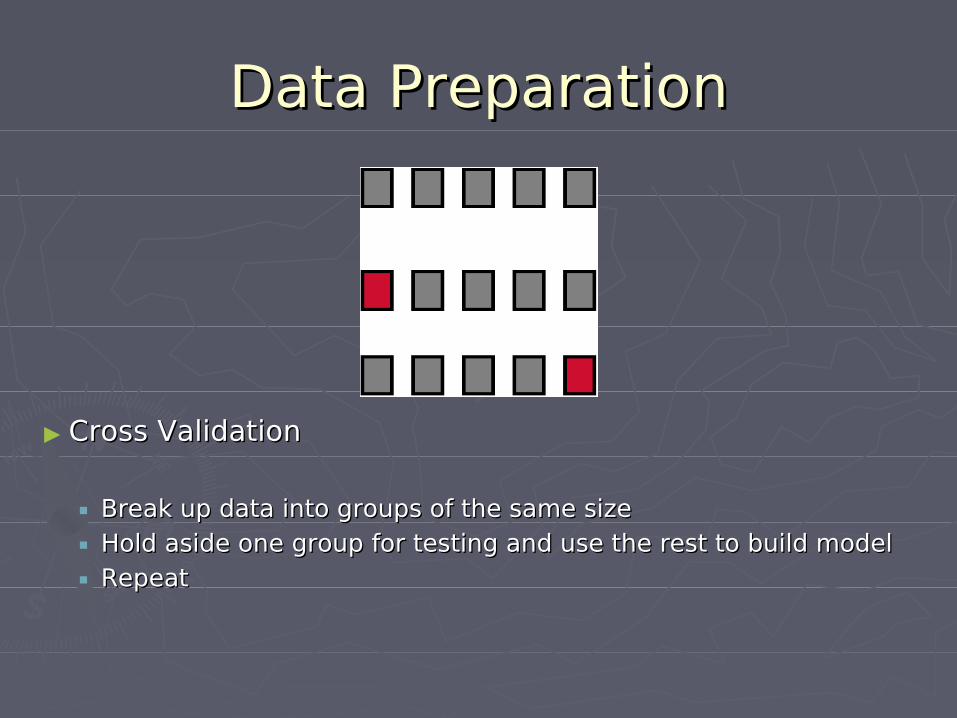
► Cross ValidationCross Validation
Break up data into groups of the same size Break up data into groups of the same size
Hold aside one group for testing and use the rest to build modelHold aside one group for testing and use the rest to build model
RepeatRepeat
Data Mining ProcessData Mining Process
Data Mining ModelsData Mining Models
The DM ProcessThe DM Process
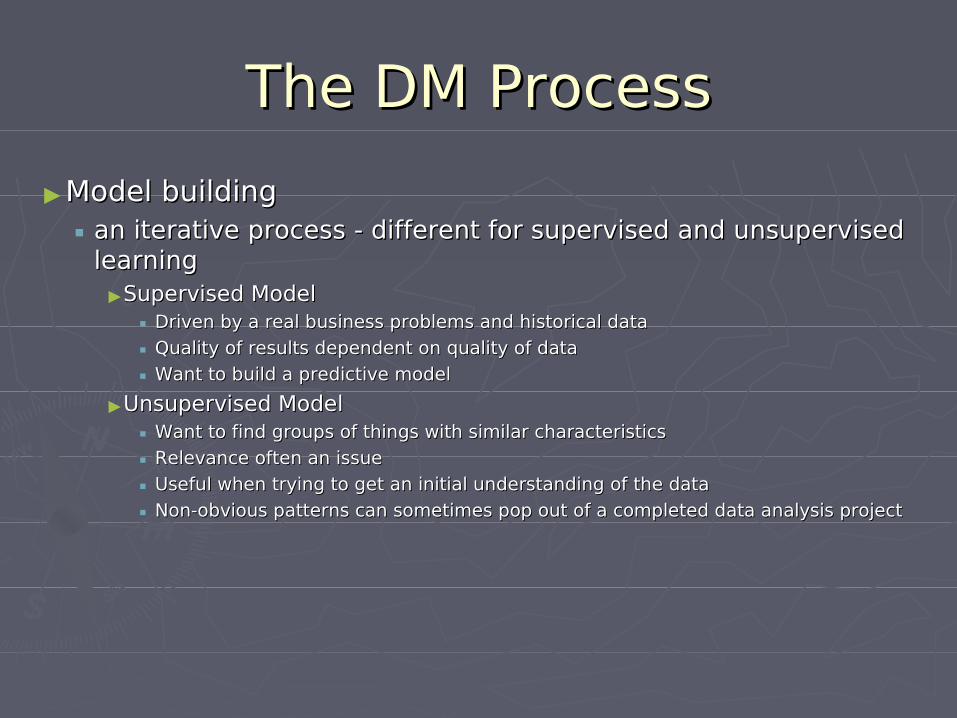
►Model buildingModel building an iterative process - different for supervised and unsupervised an iterative process - different for supervised and unsupervised
learninglearning►Supervised ModelSupervised Model
Driven by a real business problems and historical data Driven by a real business problems and historical data
Quality of results dependent on quality of dataQuality of results dependent on quality of data
Want to build a predictive modelWant to build a predictive model
►Unsupervised ModelUnsupervised Model Want to find groups of things with similar characteristicsWant to find groups of things with similar characteristics
Relevance often an issue Relevance often an issue
Useful when trying to get an initial understanding of the data Useful when trying to get an initial understanding of the data
Non-obvious patterns can sometimes pop out of a completed data analysis project Non-obvious patterns can sometimes pop out of a completed data analysis project
Types of ModelsTypes of Models
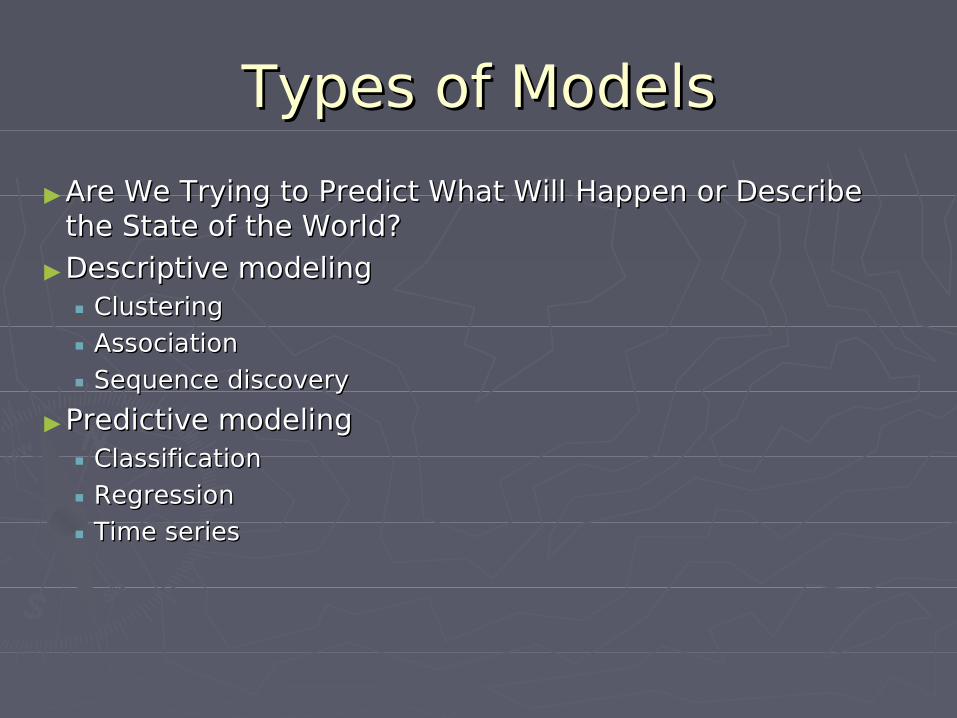
►Are We Trying to Predict What Will Happen or Describe Are We Trying to Predict What Will Happen or Describe the State of the World?the State of the World?
►Descriptive modelingDescriptive modeling ClusteringClustering
AssociationAssociation
Sequence discoverySequence discovery
►Predictive modelingPredictive modeling ClassificationClassification
RegressionRegression
Time seriesTime series
Types of ModelsTypes of Models
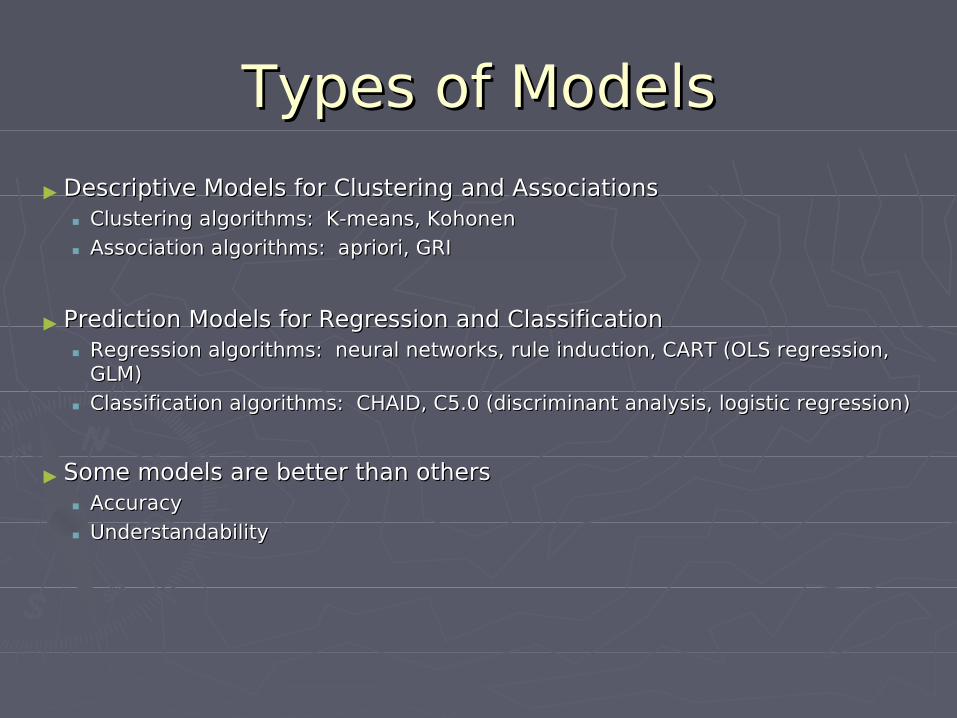
► Descriptive Models for Clustering and AssociationsDescriptive Models for Clustering and Associations Clustering algorithms: K-means, KohonenClustering algorithms: K-means, Kohonen
Association algorithms: apriori, GRIAssociation algorithms: apriori, GRI
► Prediction Models for Regression and ClassificationPrediction Models for Regression and Classification Regression algorithms: neural networks, rule induction, CART (OLS regression, Regression algorithms: neural networks, rule induction, CART (OLS regression,
GLM)GLM)
Classification algorithms: CHAID, C5.0 (discriminant analysis, logistic regression)Classification algorithms: CHAID, C5.0 (discriminant analysis, logistic regression)
► Some models are better than others Some models are better than others Accuracy Accuracy
Understandability Understandability
Determining the ModelDetermining the Model
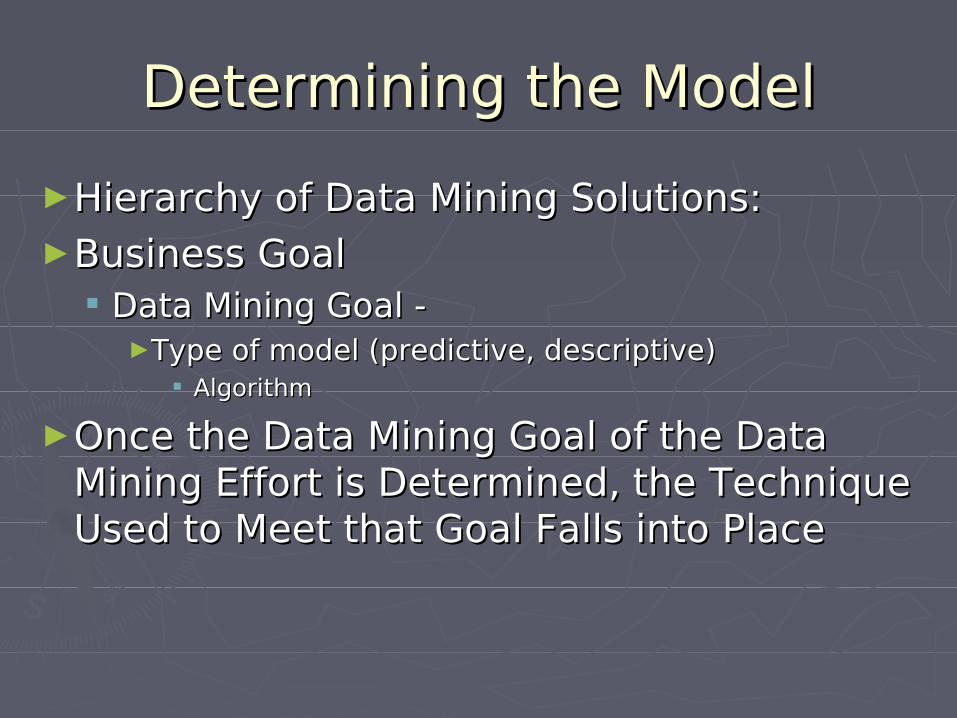
►Hierarchy of Data Mining Solutions:Hierarchy of Data Mining Solutions:►Business Goal Business Goal
Data Mining Goal - Data Mining Goal - ►Type of model (predictive, descriptive) Type of model (predictive, descriptive)
AlgorithmAlgorithm
►Once the Data Mining Goal of the Data Once the Data Mining Goal of the Data Mining Effort is Determined, the Technique Mining Effort is Determined, the Technique Used to Meet that Goal Falls into PlaceUsed to Meet that Goal Falls into Place
Determining the ModelDetermining the Model
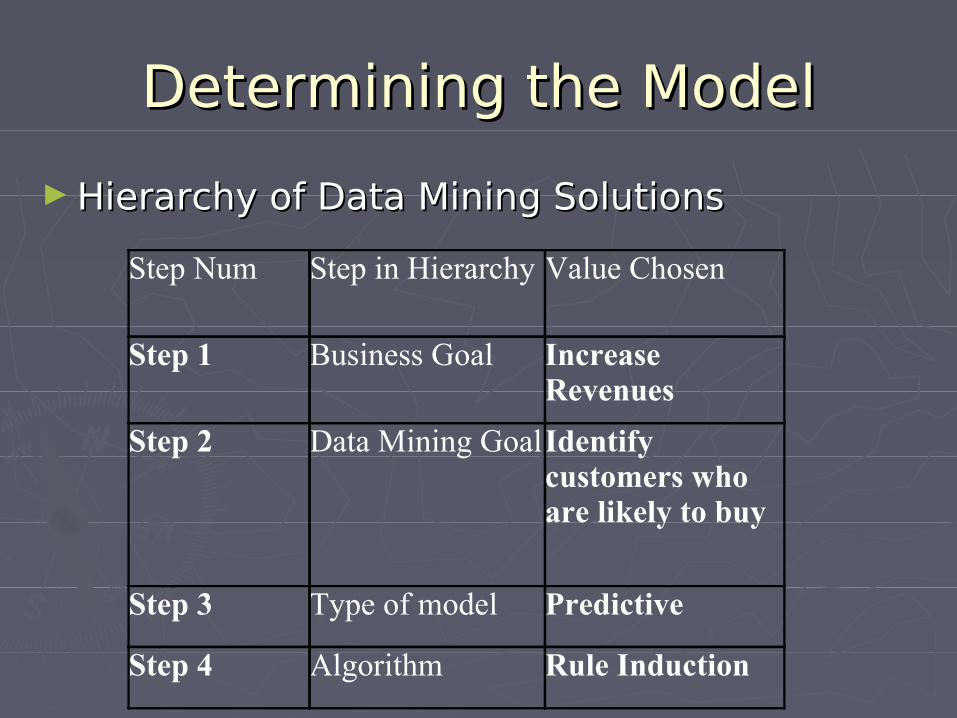
► Hierarchy of Data Mining SolutionsHierarchy of Data Mining Solutions
Step Num Step in Hierarchy Value Chosen
Step 1 Business Goal Increase Revenues
Step 2 Data Mining Goal Identify customers who are likely to buy
Step 3 Type of model Predictive
Step 4 Algorithm Rule Induction
Model BuildingModel Building
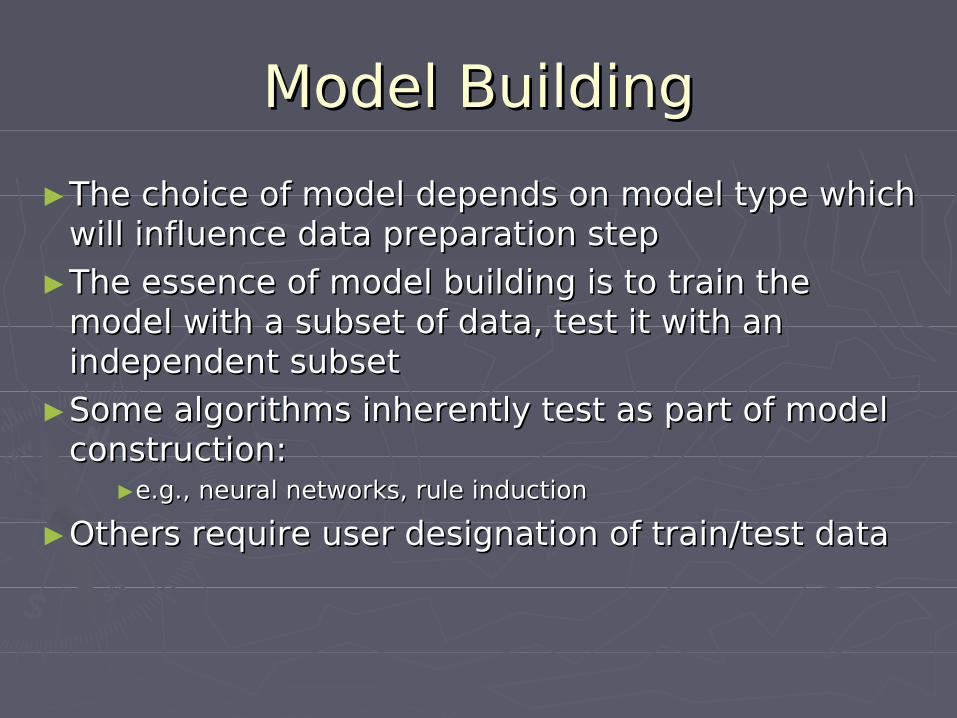
►The choice of model depends on model type which The choice of model depends on model type which will influence data preparation stepwill influence data preparation step
►The essence of model building is to train the The essence of model building is to train the model with a subset of data, test it with an model with a subset of data, test it with an independent subsetindependent subset
►Some algorithms inherently test as part of model Some algorithms inherently test as part of model construction:construction:
►e.g., neural networks, rule inductione.g., neural networks, rule induction
►Others require user designation of train/test dataOthers require user designation of train/test data
Model BuildingModel Building
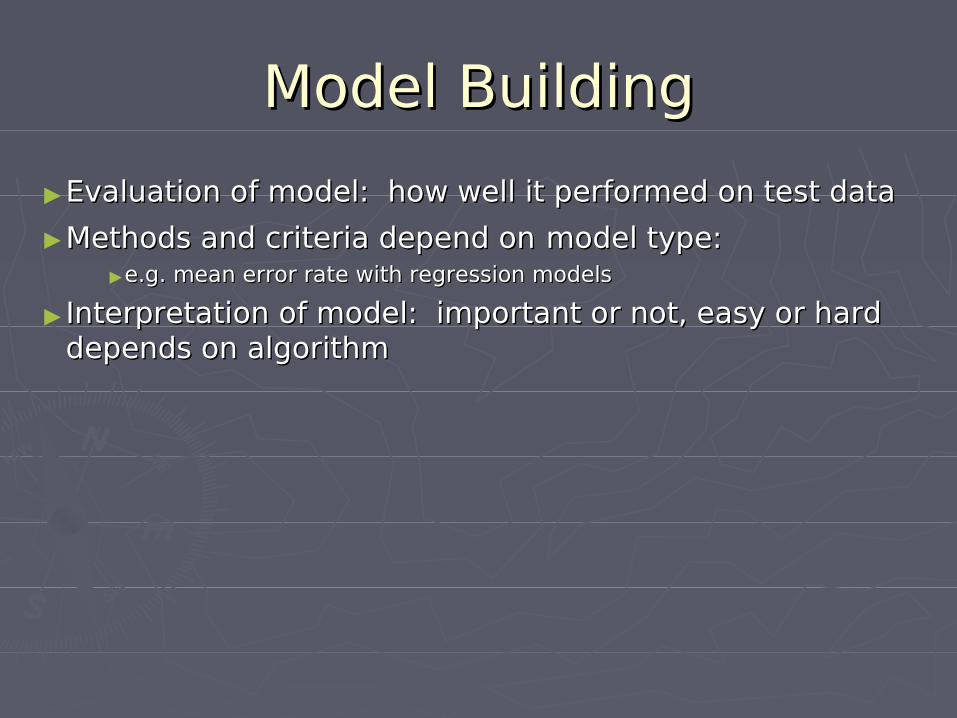
►Evaluation of model: how well it performed on test dataEvaluation of model: how well it performed on test data
►Methods and criteria depend onMethods and criteria depend on model type:model type:►e.g. mean error rate with regression modelse.g. mean error rate with regression models
► Interpretation of model: important or not, easy or hard Interpretation of model: important or not, easy or hard depends on algorithmdepends on algorithm
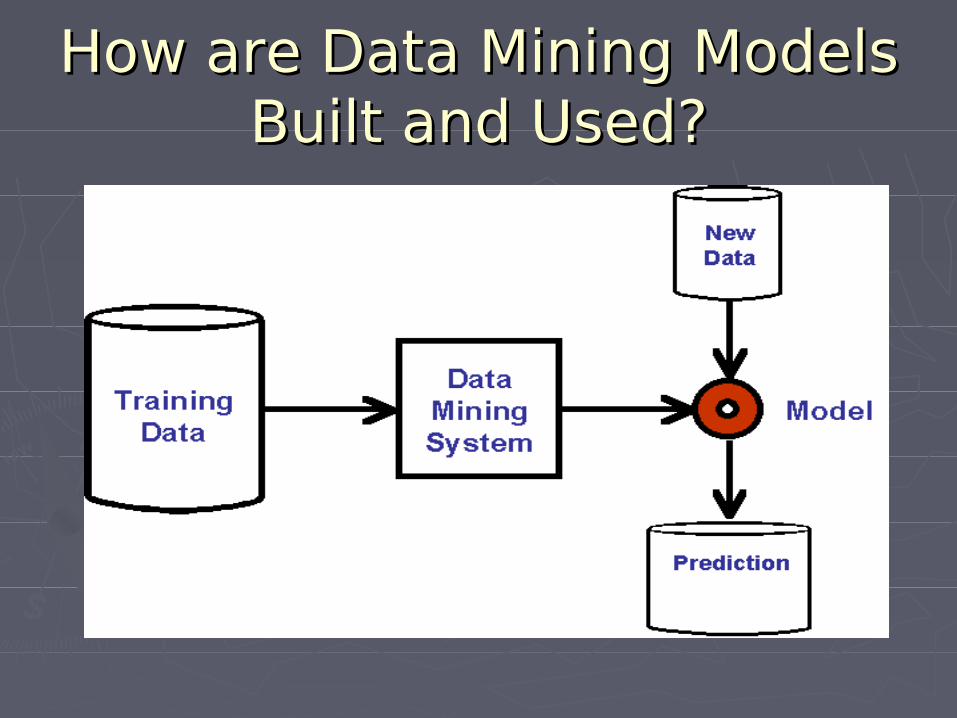
How are Data Mining Models How are Data Mining Models Built and Used?Built and Used?
The DM ProcessThe DM Process
►Use the model on applicationUse the model on application
deploy models on linedeploy models on line
on the webon the web
against the databaseagainst the database
►Model monitoringModel monitoring
Determine if the model still ‘works’Determine if the model still ‘works’
Data Mining ProcessData Mining Process
Data Mining ModelsData Mining Models
Types of ModelsTypes of Models
ClusteringClustering
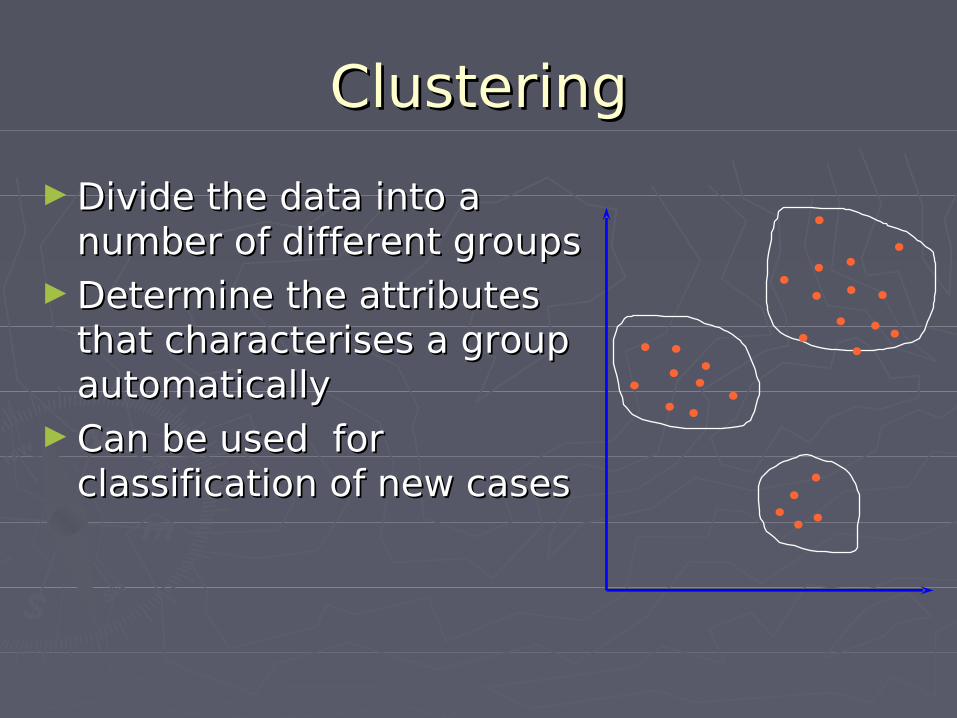
► Divide the data into a Divide the data into a number of different groupsnumber of different groups
► Determine the attributes Determine the attributes that characterises a group that characterises a group automaticallyautomatically
► Can be used for Can be used for classification of new casesclassification of new cases
K-Means ClusteringK-Means Clustering
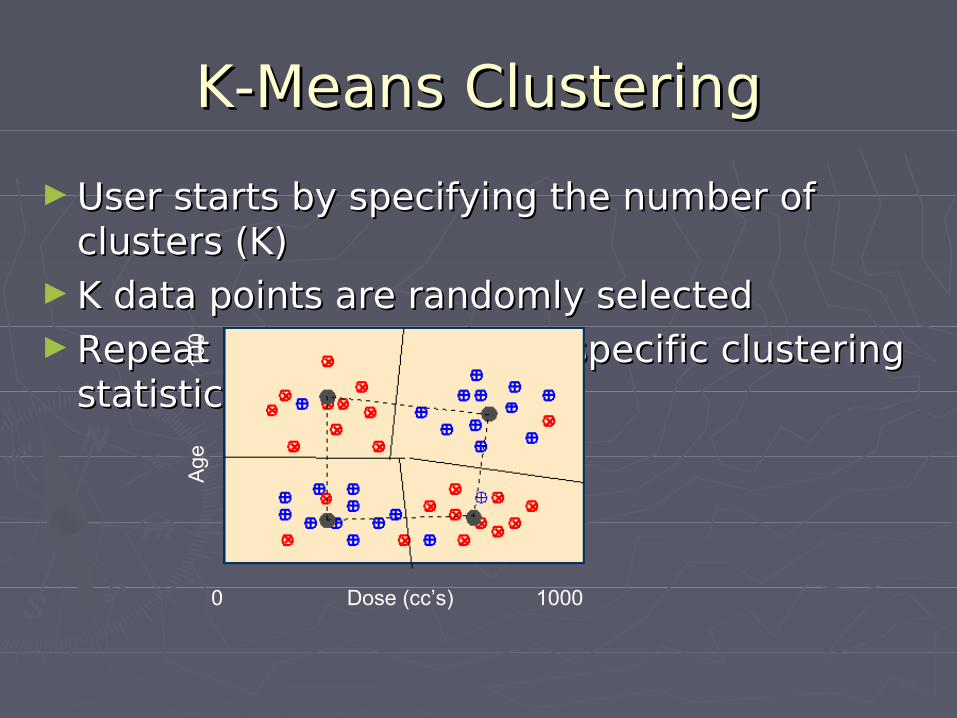
► User starts by specifying the number of User starts by specifying the number of clusters (K) clusters (K)
► K data points are randomly selected K data points are randomly selected ► Repeat until no change in specific clustering Repeat until no change in specific clustering
statistics statistics
46
Age
100
0 Dose (cc’s) 1000
AssociationAssociation
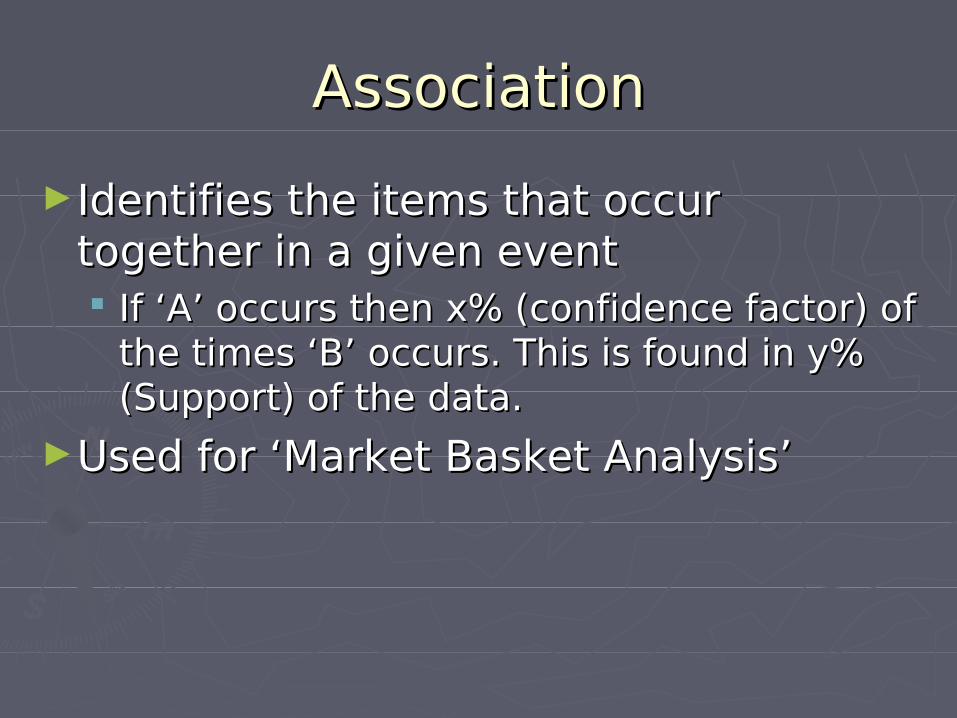
► Identifies the items that occur Identifies the items that occur together in a given eventtogether in a given event If ‘A’ occurs then x% (confidence factor) of If ‘A’ occurs then x% (confidence factor) of
the times ‘B’ occurs. This is found in y% the times ‘B’ occurs. This is found in y% (Support) of the data.(Support) of the data.
►Used for ‘Market Basket Analysis’Used for ‘Market Basket Analysis’
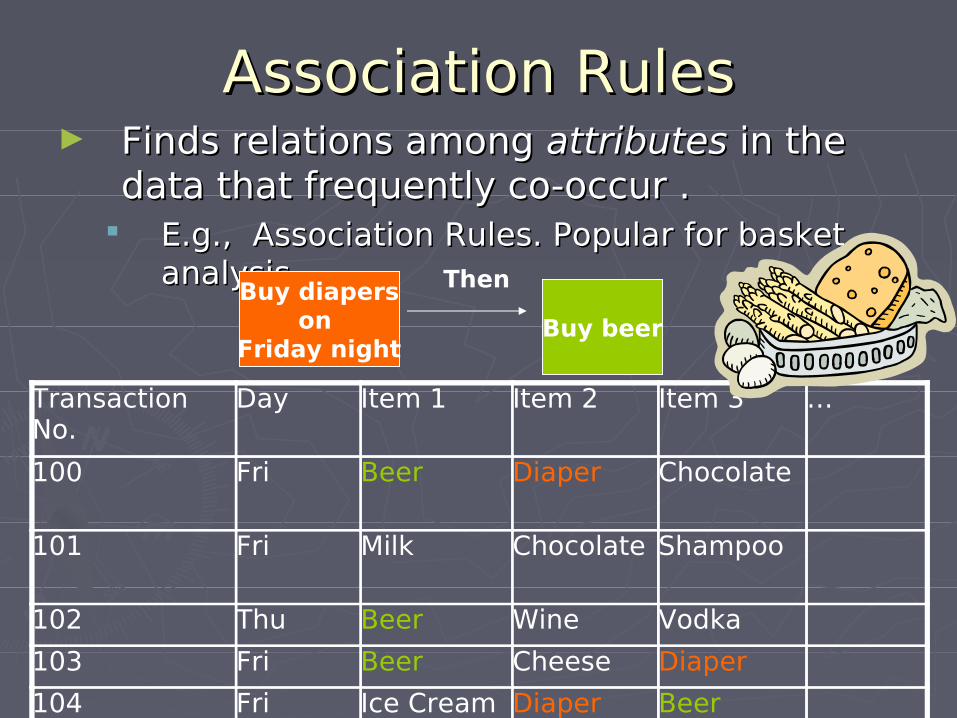
Association RulesAssociation Rules► Finds relations among Finds relations among attributesattributes in the in the
data that frequently co-occur . data that frequently co-occur . E.g., Association Rules. Popular for basket E.g., Association Rules. Popular for basket
analysisanalysisBuy diapers
on Friday night
Buy beer
Then
Transaction No.
Day Item 1 Item 2 Item 3 …
100 Fri Beer Diaper Chocolate
101 Fri Milk Chocolate Shampoo
102 Thu Beer Wine Vodka
103 Fri Beer Cheese Diaper
104 Fri Ice Cream Diaper Beer
…
Sequence discoverySequence discovery
►Finds association among the itemsFinds association among the items►The related items are spread over the The related items are spread over the
timetime If surgical procedure ‘A’ is followed, then If surgical procedure ‘A’ is followed, then
the infection ‘B’ occurs at a later timethe infection ‘B’ occurs at a later time If stock ‘A’ rises by 12% then stock ‘B’ also If stock ‘A’ rises by 12% then stock ‘B’ also
rises by 8% within 2 daysrises by 8% within 2 days
►Requires information on transactions Requires information on transactions and transactorsand transactors
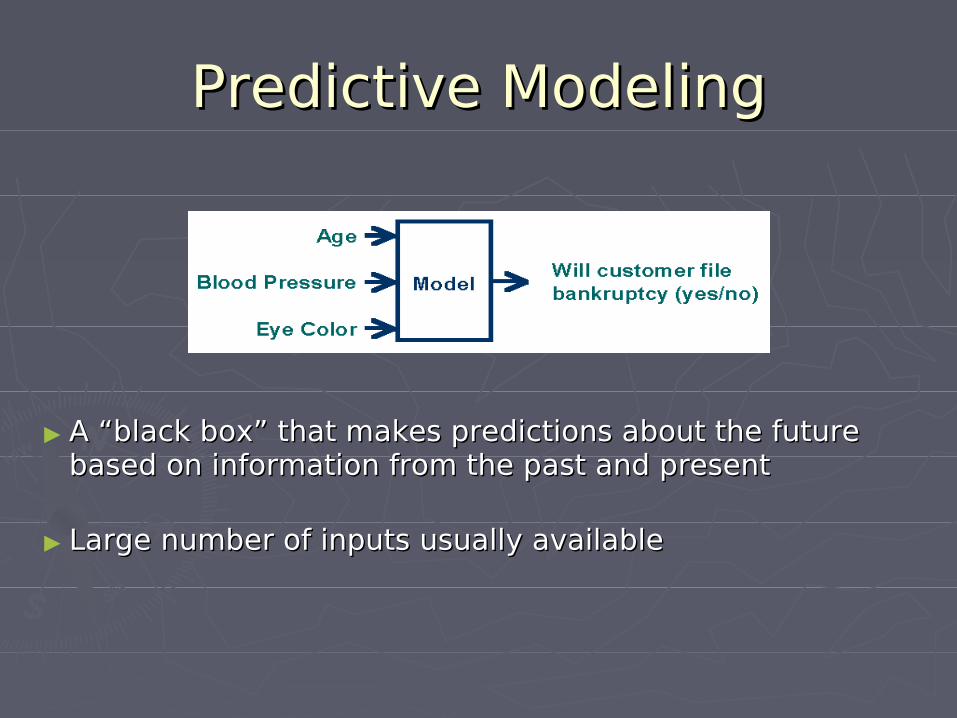
Predictive ModelingPredictive Modeling
► A “black box” that makes predictions about the future A “black box” that makes predictions about the future based on information from the past and presentbased on information from the past and present
► Large number of inputs usually availableLarge number of inputs usually available
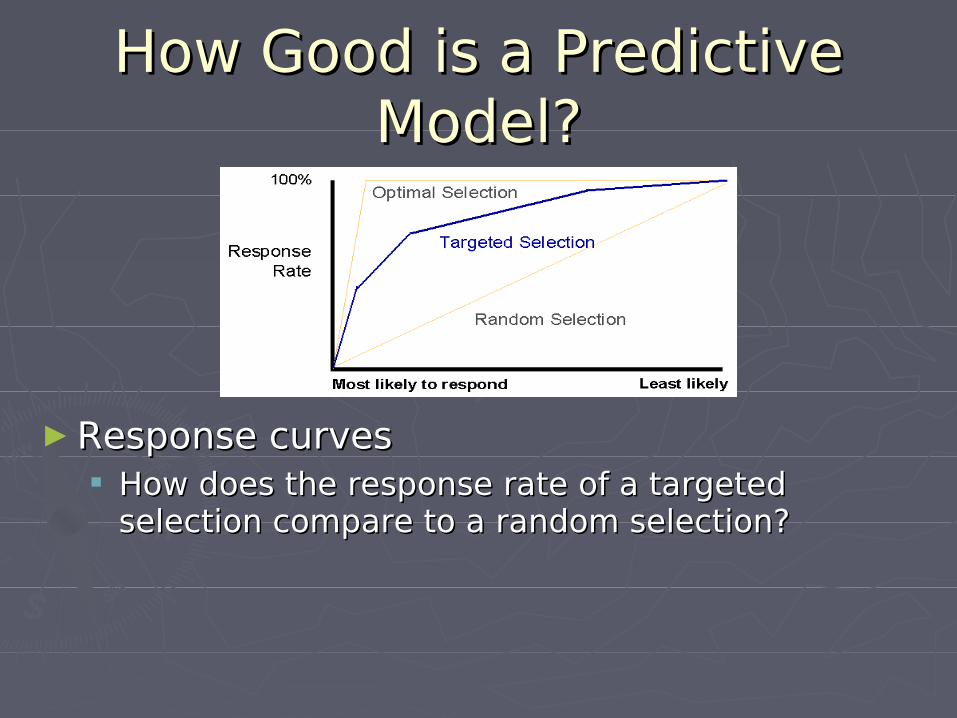
How Good is a Predictive How Good is a Predictive Model?Model?
► Response curves Response curves How does the response rate of a targeted How does the response rate of a targeted
selection compare to a random selection? selection compare to a random selection?
ClassificationClassification
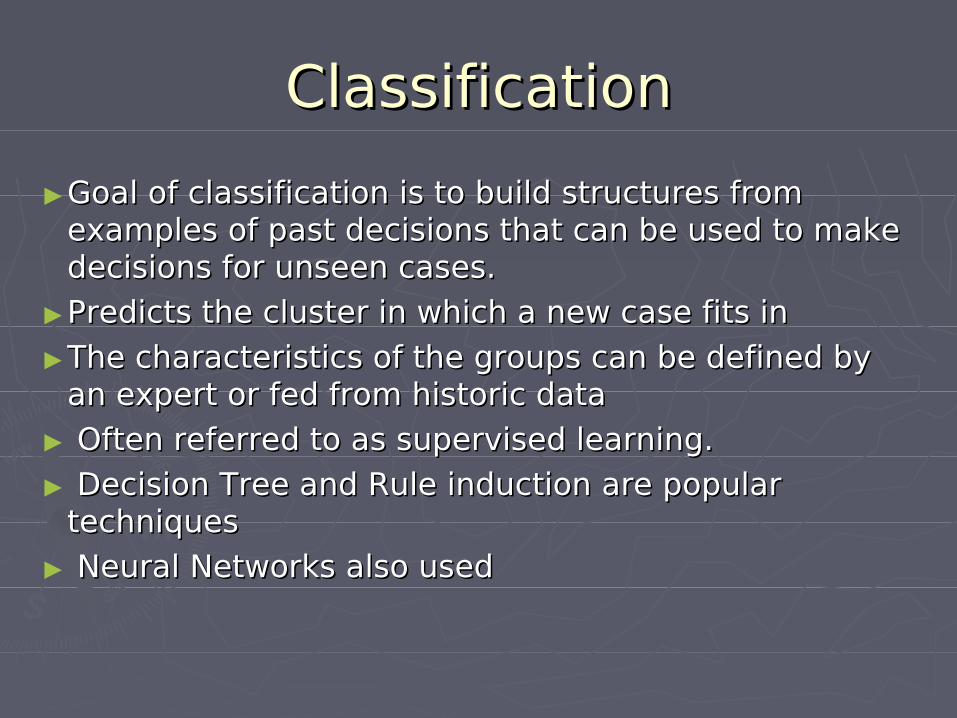
►Goal of classification is to build structures from Goal of classification is to build structures from examples of past decisions that can be used to make examples of past decisions that can be used to make decisions for unseen cases.decisions for unseen cases.
►Predicts the cluster in which a new case fits inPredicts the cluster in which a new case fits in
►The characteristics of the groups can be defined by The characteristics of the groups can be defined by an expert or fed from historic dataan expert or fed from historic data
► Often referred to as supervised learning.Often referred to as supervised learning.
► Decision Tree and Rule induction are popular Decision Tree and Rule induction are popular techniquestechniques
► Neural Networks also usedNeural Networks also used
RegressionRegression
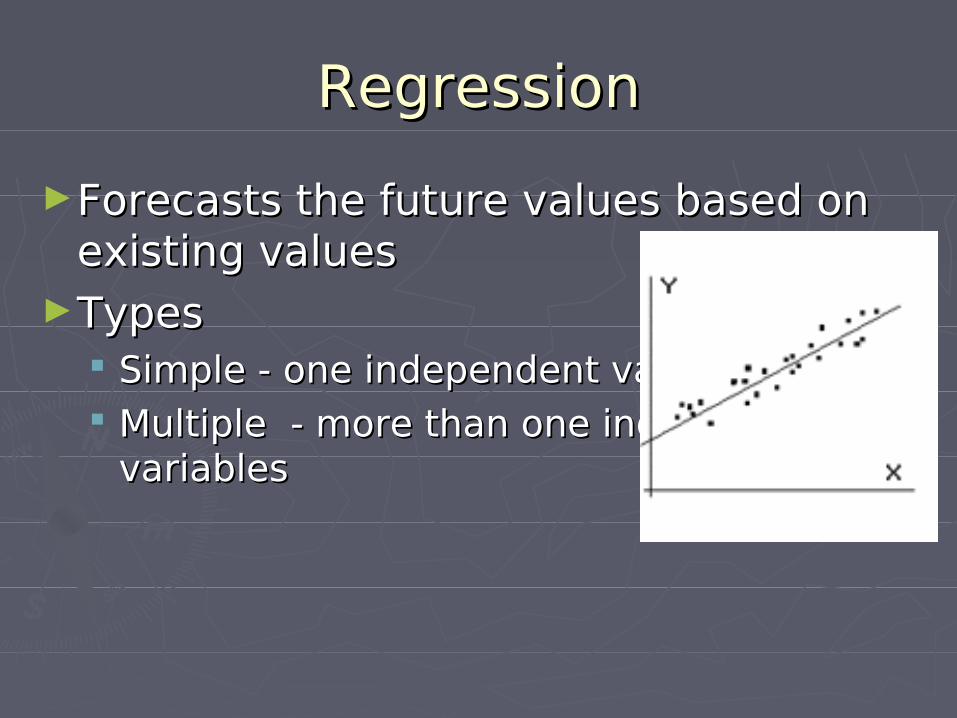
►Forecasts the future values based on Forecasts the future values based on existing valuesexisting values
►TypesTypes Simple - one independent variableSimple - one independent variable Multiple - more than one independent Multiple - more than one independent
variablesvariables
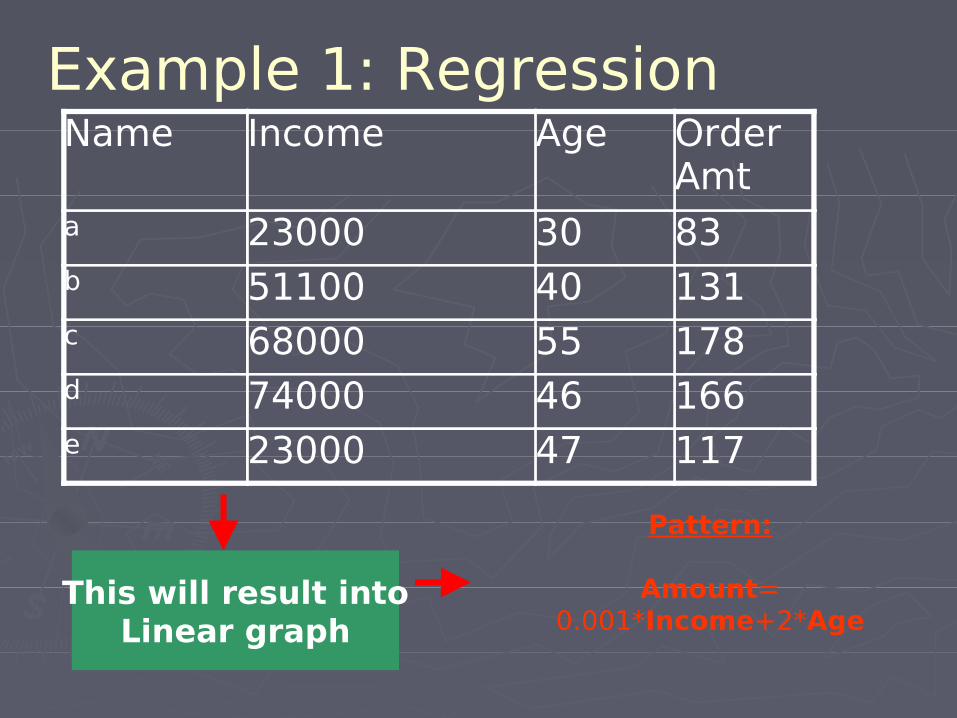
Example 1: Regression
Pattern:
Amount= 0.001*Income+2*Age
This will result intoLinear graph
Name Income Age Order Amt
a 23000 30 83b 51100 40 131c 68000 55 178d 74000 46 166e 23000 47 117
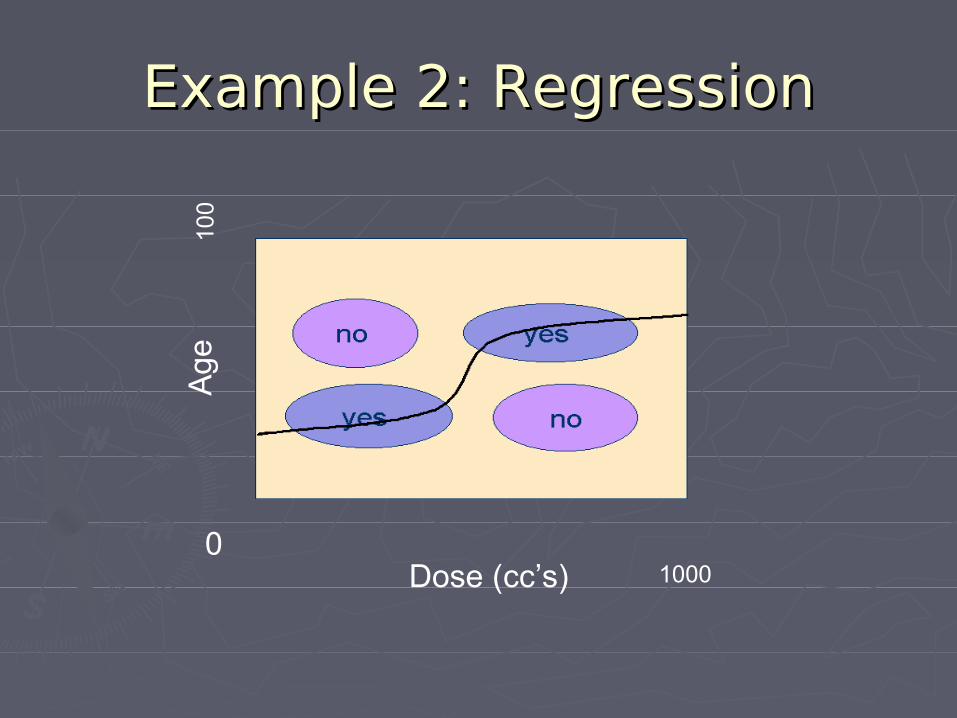
Example 2: RegressionExample 2: Regression
Age
Dose (cc’s)
100
1000 0
Time seriesTime series
►Forecasts the future trendsForecasts the future trends►Model includes time hierarchy like Model includes time hierarchy like
year, quarter, month, week etc.year, quarter, month, week etc.►Considers impact of seasonality, Considers impact of seasonality,
calendar effects such as holidayscalendar effects such as holidays►What is the expected price for What is the expected price for
Microsoft’s stock by the end of this Microsoft’s stock by the end of this year?year?
Data Mining Data Mining TechniquesTechniques
TechniquesTechniques
►Neural NetworksNeural Networks►Decision TreesDecision Trees►Rule InductionRule Induction►K nearest neighbourK nearest neighbour
Neural NetworksNeural Networks
►Parameter adjustment systemsParameter adjustment systems► Interconnected elements (neurons)Interconnected elements (neurons)►Train the net on a training data set Train the net on a training data set ►Use Trained net to make predictionsUse Trained net to make predictions►Can deal with only numeric data Can deal with only numeric data
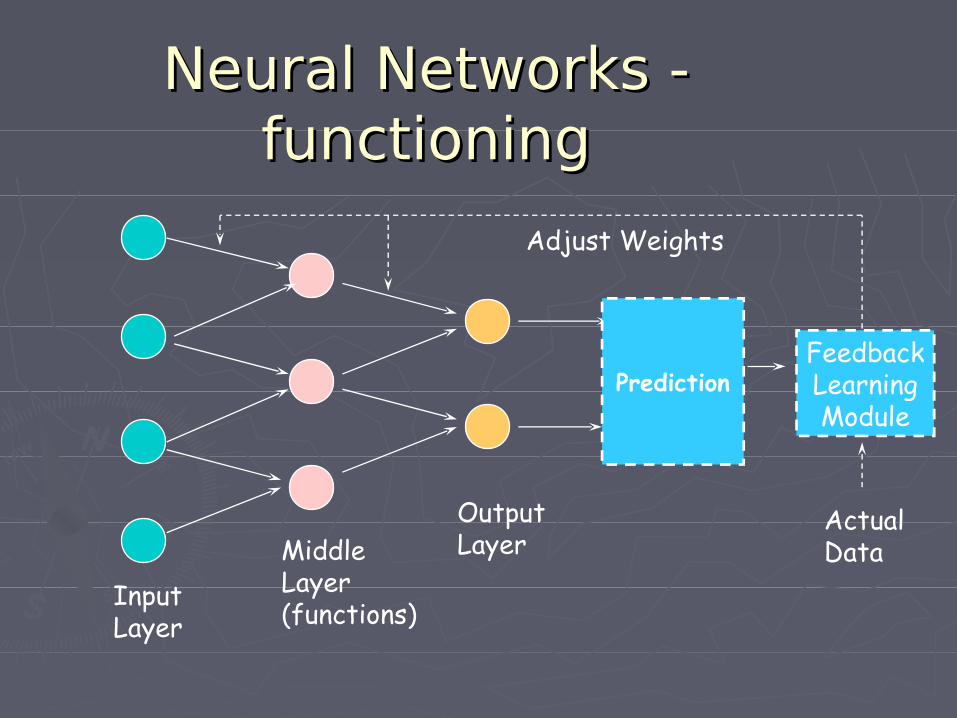
Neural Networks - Neural Networks - functioningfunctioning
Input Layer
Middle Layer(functions)
Output Layer
Adjust Weights
Actual Data
FeedbackLearningModule
Prediction
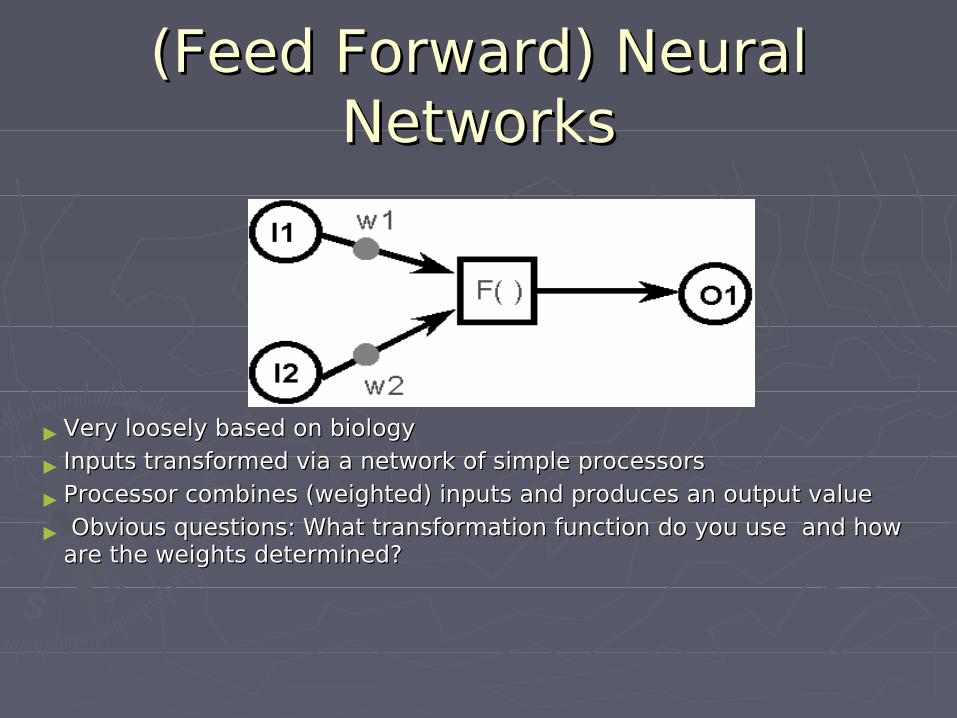
(Feed Forward) Neural (Feed Forward) Neural NetworksNetworks
► Very loosely based on biology Very loosely based on biology
► Inputs transformed via a network of simple processors Inputs transformed via a network of simple processors
► Processor combines (weighted) inputs and produces an output value Processor combines (weighted) inputs and produces an output value
► Obvious questions: What transformation function do you use and how Obvious questions: What transformation function do you use and how are the weights determined?are the weights determined?
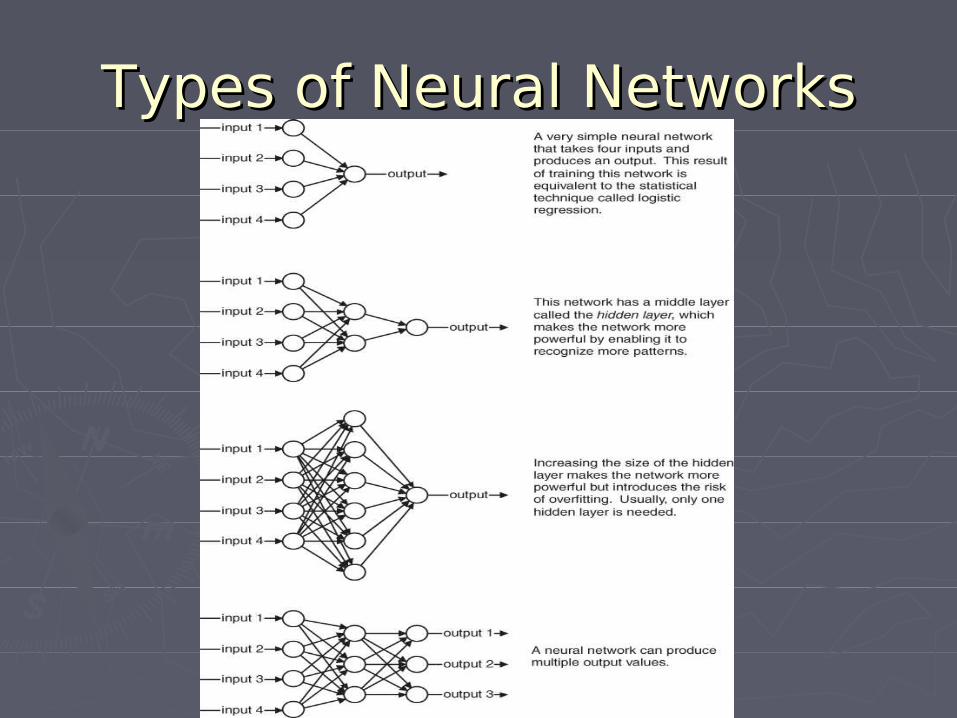
Types of Neural NetworksTypes of Neural Networks
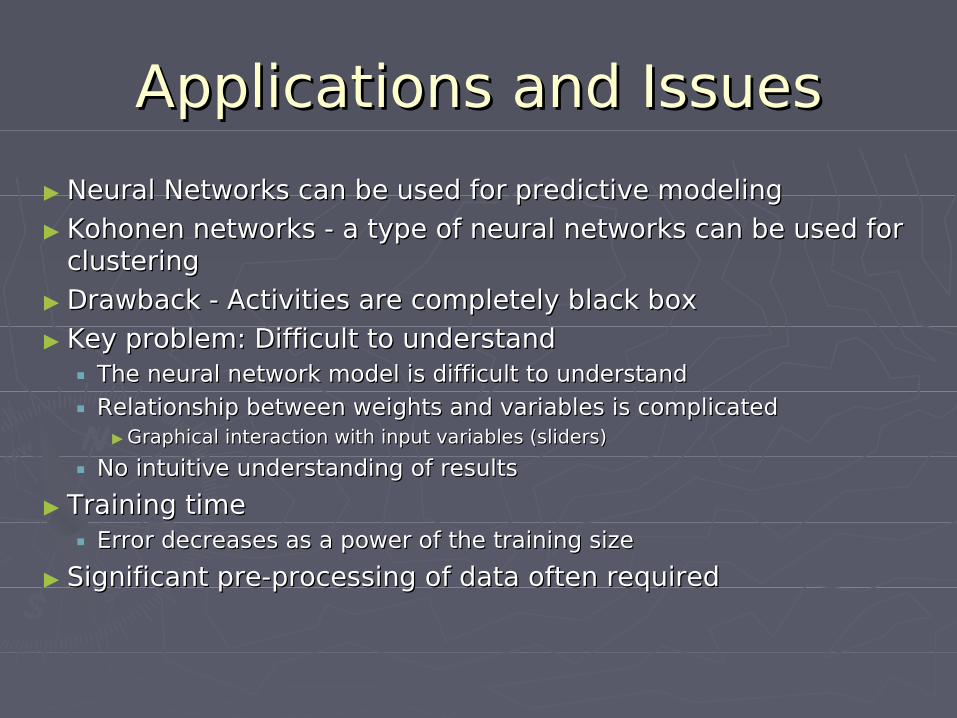
Applications and IssuesApplications and Issues
► Neural Networks can be used for predictive modelingNeural Networks can be used for predictive modeling
► Kohonen networks - a type of neural networks can be used for Kohonen networks - a type of neural networks can be used for clusteringclustering
► Drawback - Activities are completely black boxDrawback - Activities are completely black box
► Key problem: Difficult to understand Key problem: Difficult to understand The neural network model is difficult to understand The neural network model is difficult to understand
Relationship between weights and variables is complicated Relationship between weights and variables is complicated ► Graphical interaction with input variables (sliders) Graphical interaction with input variables (sliders)
No intuitive understanding of results No intuitive understanding of results
► Training time Training time Error decreases as a power of the training size Error decreases as a power of the training size
► Significant pre-processing of data often required Significant pre-processing of data often required
Decision TreesDecision Trees
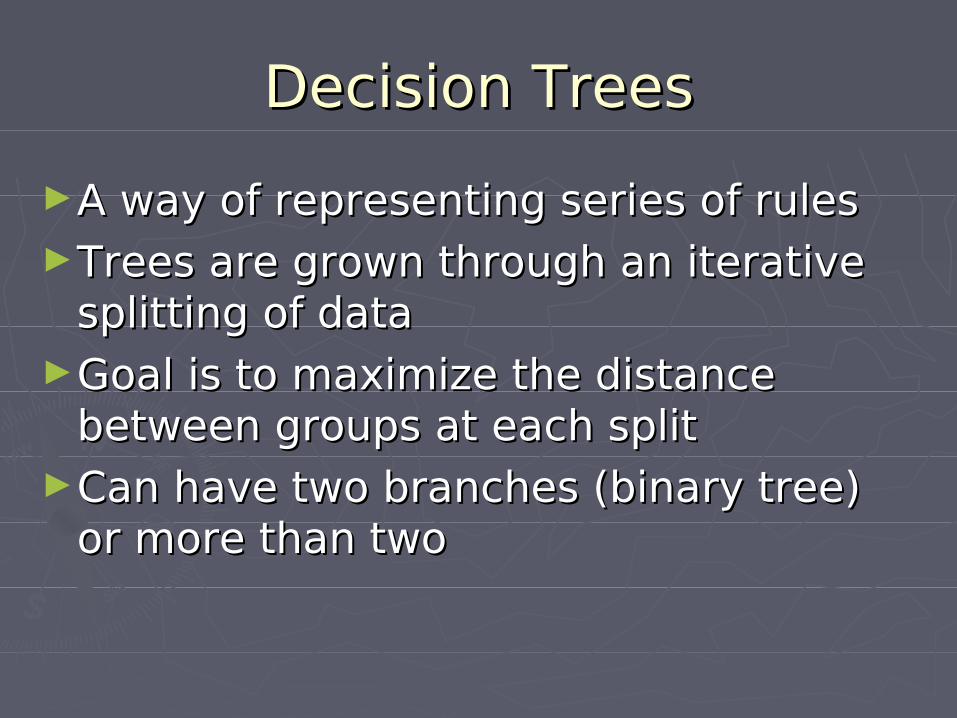
►A way of representing series of rulesA way of representing series of rules►Trees are grown through an iterative Trees are grown through an iterative
splitting of datasplitting of data►Goal is to maximize the distance Goal is to maximize the distance
between groups at each splitbetween groups at each split►Can have two branches (binary tree) Can have two branches (binary tree)
or more than twoor more than two
Decision TreesDecision Trees
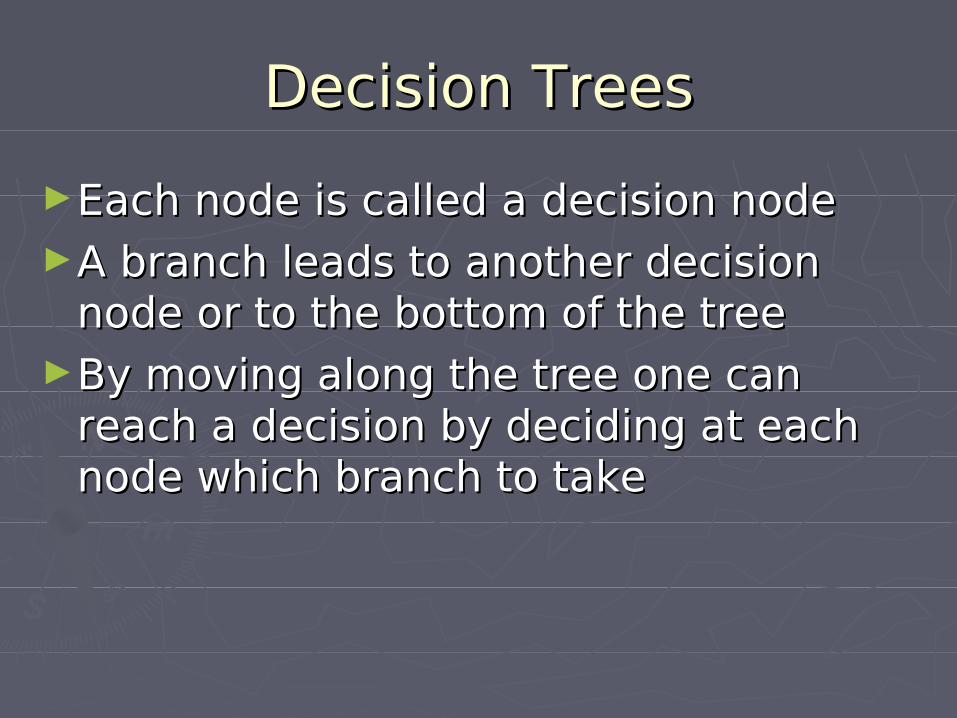
►Each node is called a decision nodeEach node is called a decision node►A branch leads to another decision A branch leads to another decision
node or to the bottom of the treenode or to the bottom of the tree►By moving along the tree one can By moving along the tree one can
reach a decision by deciding at each reach a decision by deciding at each node which branch to takenode which branch to take
Decision TreesDecision Trees
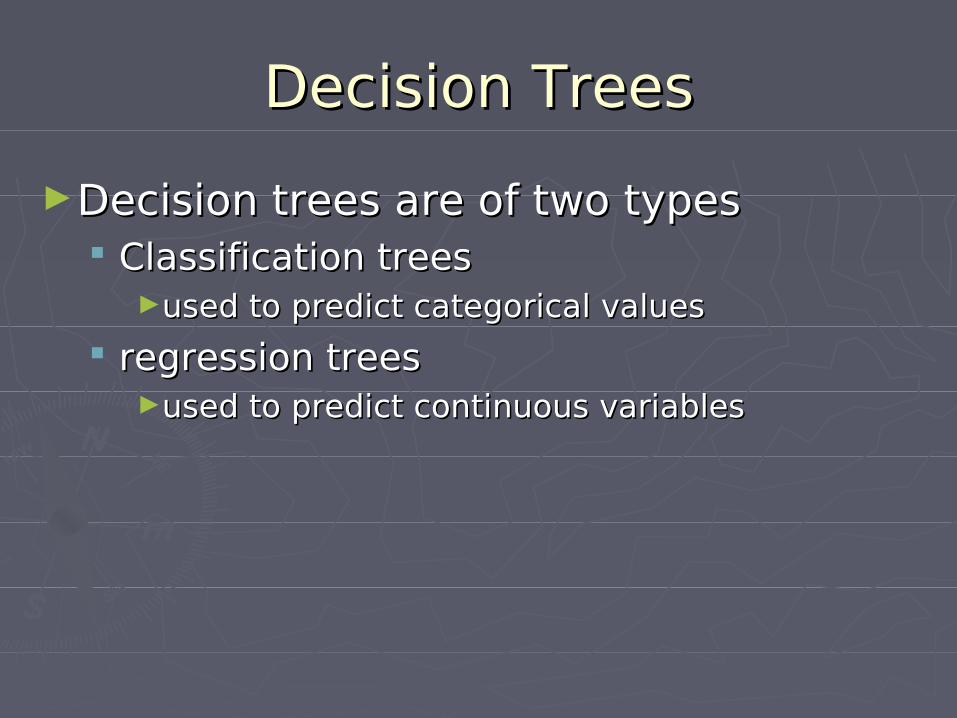
►Decision trees are of two typesDecision trees are of two types Classification trees Classification trees
►used to predict categorical valuesused to predict categorical values
regression treesregression trees►used to predict continuous variablesused to predict continuous variables
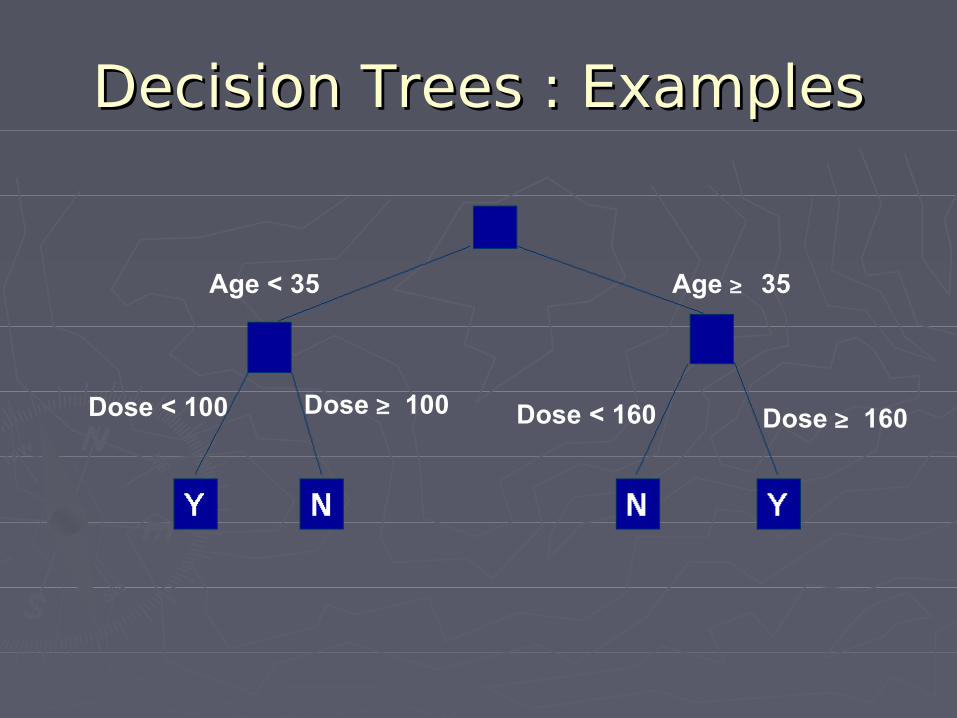
Decision Trees : ExamplesDecision Trees : Examples
Age < 35 Age ≥ 35
Dose < 100 Dose ≥ 100 Dose < 160 Dose ≥ 160
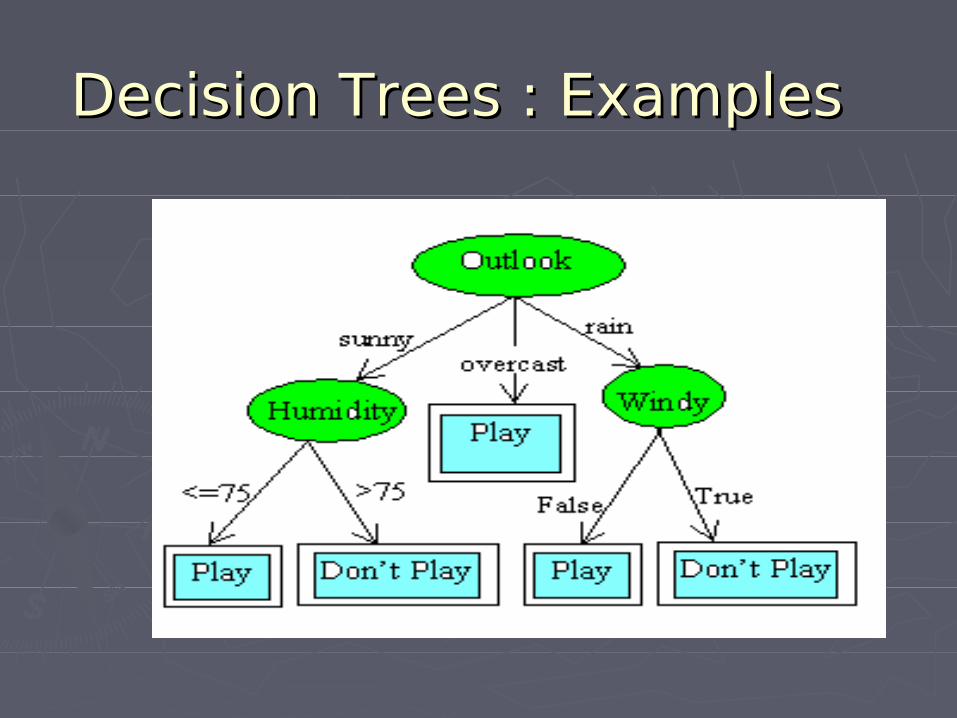
Decision Trees : ExamplesDecision Trees : Examples
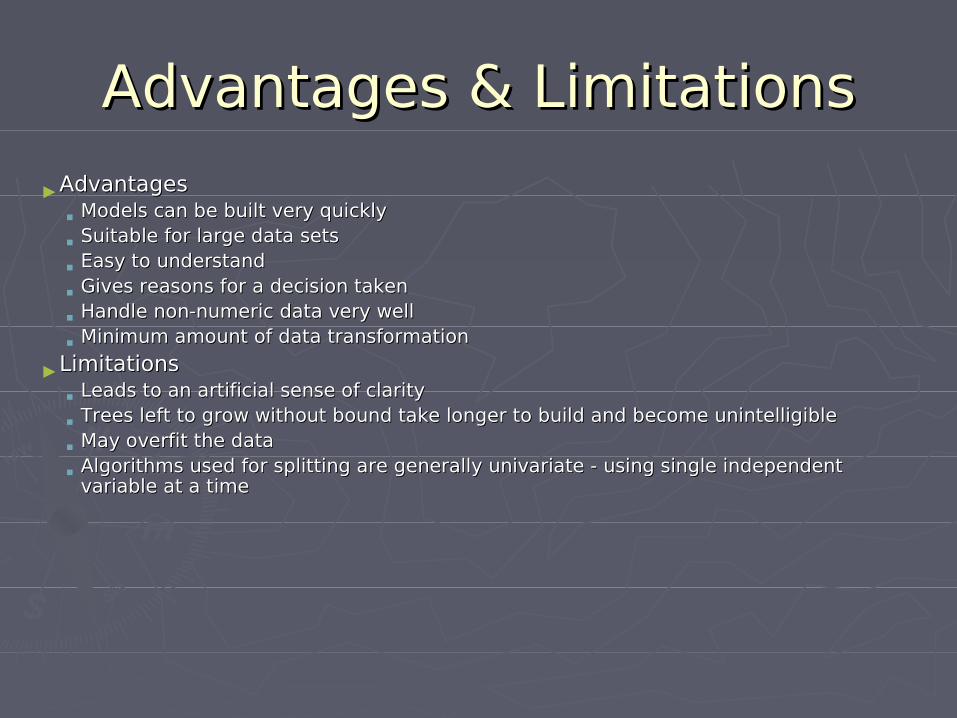
Advantages & LimitationsAdvantages & Limitations
►AdvantagesAdvantages
Models can be built very quicklyModels can be built very quickly
Suitable for large data setsSuitable for large data sets
Easy to understandEasy to understand
Gives reasons for a decision taken Gives reasons for a decision taken
Handle non-numeric data very wellHandle non-numeric data very well
Minimum amount of data transformationMinimum amount of data transformation
►LimitationsLimitations
Leads to an artificial sense of clarityLeads to an artificial sense of clarity
Trees left to grow without bound take longer to build and become unintelligibleTrees left to grow without bound take longer to build and become unintelligible
May overfit the dataMay overfit the data
Algorithms used for splitting are generally univariate - using single independent Algorithms used for splitting are generally univariate - using single independent variable at a timevariable at a time
Rule InductionRule Induction
►Extraction of useful if-then rules from Extraction of useful if-then rules from data based on statistical significance.data based on statistical significance.
►Completely a machine driven process.Completely a machine driven process.►Can discover very general rules which Can discover very general rules which
deal with both numeric and non-numeric deal with both numeric and non-numeric data. data.
►Translating the rules into a usable model Translating the rules into a usable model must be done either by the user or a must be done either by the user or a decision trees interfacedecision trees interface
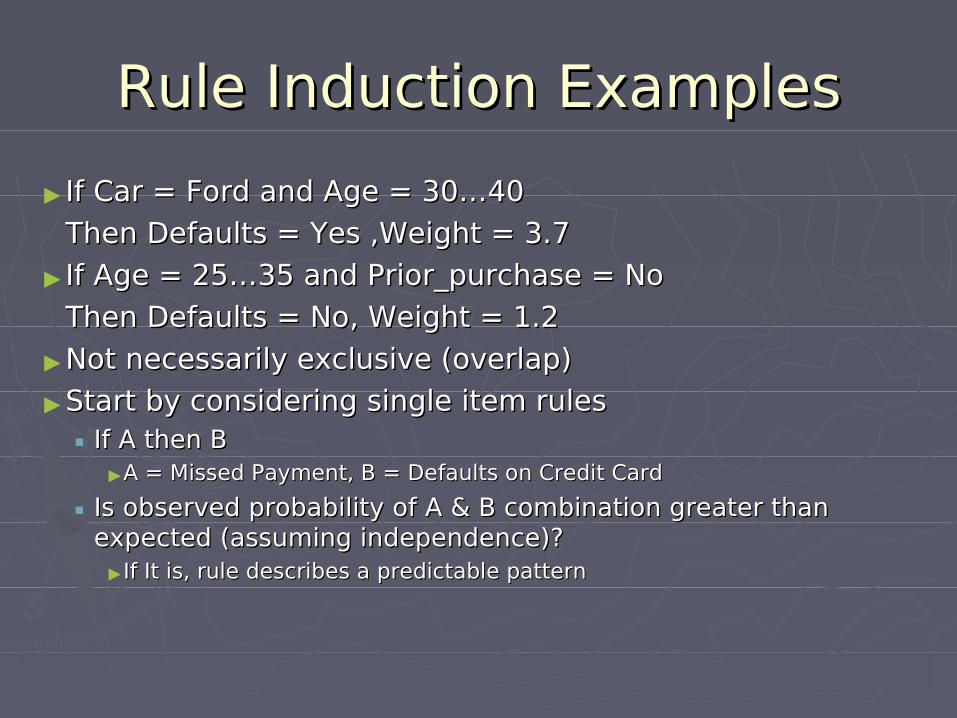
Rule Induction ExamplesRule Induction Examples
► If Car = Ford and Age = 30…40 If Car = Ford and Age = 30…40
Then Defaults = Yes ,Weight = 3.7Then Defaults = Yes ,Weight = 3.7
► If Age = 25…35 and Prior_purchase = No If Age = 25…35 and Prior_purchase = No
Then Defaults = No, Weight = 1.2Then Defaults = No, Weight = 1.2
►Not necessarily exclusive (overlap) Not necessarily exclusive (overlap)
►Start by considering single item rules Start by considering single item rules If A then B If A then B
►A = Missed Payment, B = Defaults on Credit Card A = Missed Payment, B = Defaults on Credit Card
Is observed probability of A & B combination greater than Is observed probability of A & B combination greater than expected (assuming independence)? expected (assuming independence)?
►If It is, rule describes a predictable patternIf It is, rule describes a predictable pattern
Rule Induction: Important Rule Induction: Important points points
►Look at all possible variable combinations Look at all possible variable combinations
►Compute probabilities of combinations Compute probabilities of combinations
►Expensive! Expensive!
►Look only at rules that predict relevant behavior Look only at rules that predict relevant behavior
►Limit calculations to those with sufficient support Limit calculations to those with sufficient support
►When moving onto larger combinations of variables like When moving onto larger combinations of variables like n3, n4, n5, ... n3, n4, n5, ... Support decreases dramatically, limiting calculationsSupport decreases dramatically, limiting calculations
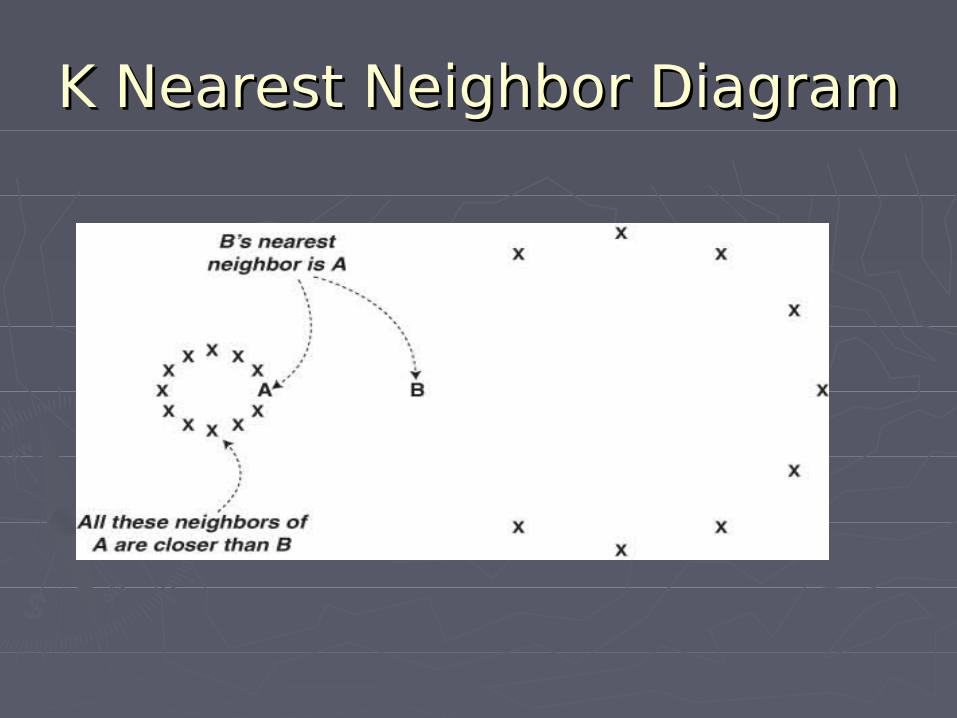
K Nearest NeighborK Nearest Neighbor
►A classification techniqueA classification technique►Decides in which class to put a new Decides in which class to put a new
case incase in►Criterion is to find a maximum number Criterion is to find a maximum number
(k) of neighbors having most similar (k) of neighbors having most similar propertiesproperties
►Assigns a new case to the same class Assigns a new case to the same class to which most of the neighbors belongto which most of the neighbors belong
K Nearest NeighborK Nearest Neighbor
►Set of already classified cases selected to use Set of already classified cases selected to use as a basis. as a basis.
►Neighborhood size, in which to do the Neighborhood size, in which to do the comparisons, decided.comparisons, decided.
►Decided how to count the neighbors (assigning Decided how to count the neighbors (assigning weights to neighbors, may give more weight to weights to neighbors, may give more weight to nearer neighbor than a farther one).nearer neighbor than a farther one).
K Nearest Neighbor ModelK Nearest Neighbor Model
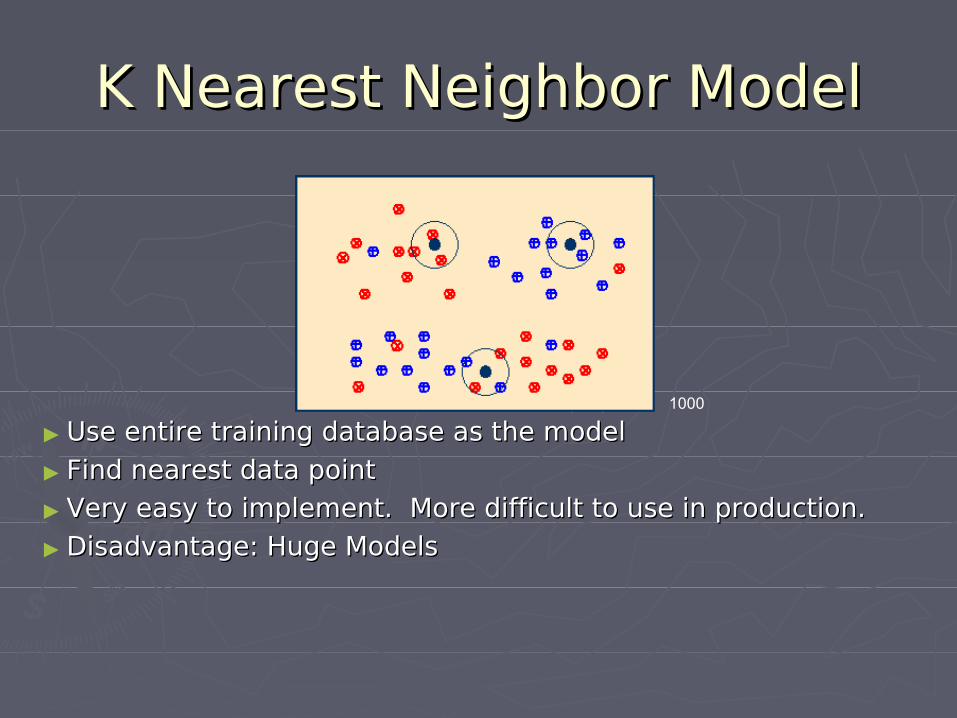
► Use entire training database as the model Use entire training database as the model
► Find nearest data point Find nearest data point
► Very easy to implement. More difficult to use in production. Very easy to implement. More difficult to use in production.
► Disadvantage: Huge ModelsDisadvantage: Huge Models
Ag
e
1
00
0 Dose (cc’s) 1000
K Nearest Neighbor DiagramK Nearest Neighbor Diagram
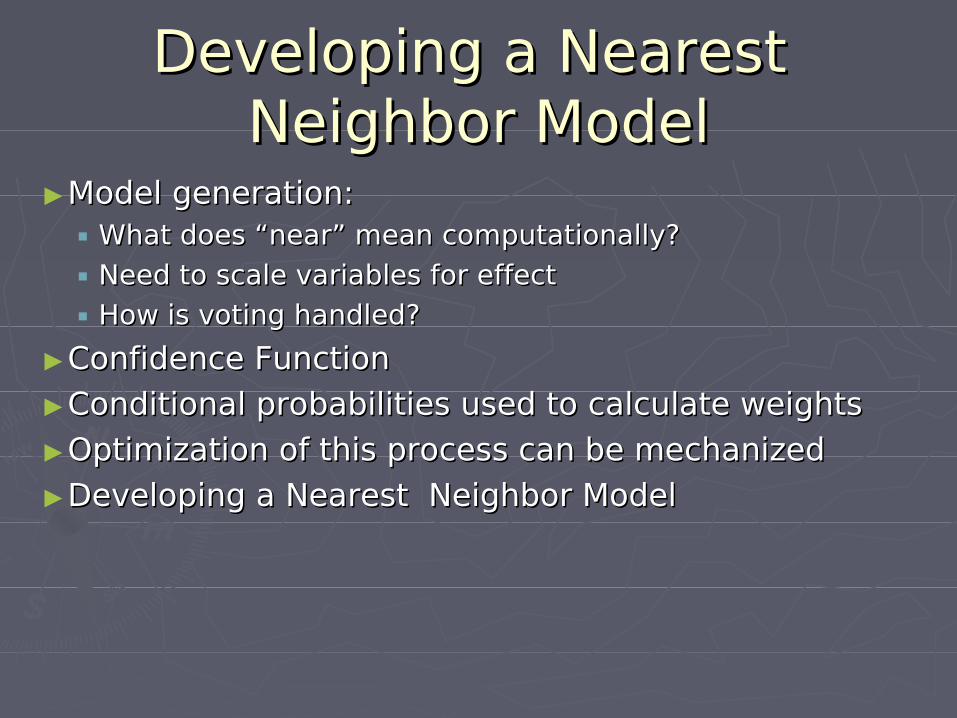
Developing a Nearest Developing a Nearest Neighbor ModelNeighbor Model
►Model generation: Model generation: What does “near” mean computationally? What does “near” mean computationally?
Need to scale variables for effect Need to scale variables for effect
How is voting handled? How is voting handled?
►Confidence Function Confidence Function
►Conditional probabilities used to calculate weights Conditional probabilities used to calculate weights
►Optimization of this process can be mechanizedOptimization of this process can be mechanized
►Developing a Nearest Neighbor ModelDeveloping a Nearest Neighbor Model
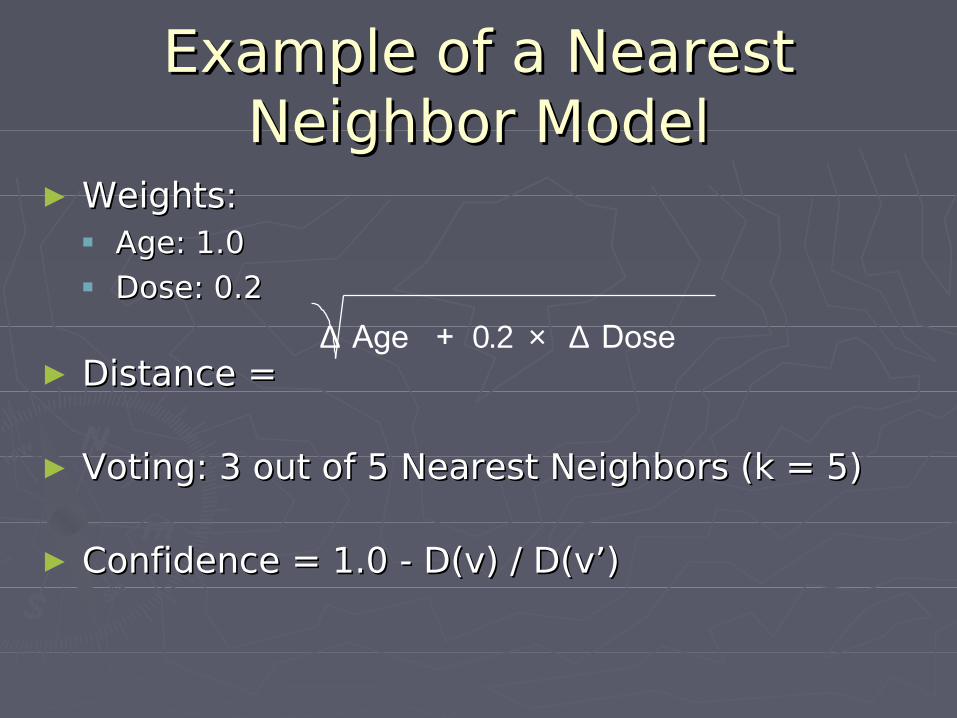
Example of a Nearest Example of a Nearest Neighbor ModelNeighbor Model
► Weights: Weights: Age: 1.0 Age: 1.0 Dose: 0.2Dose: 0.2
► Distance = Distance =
► Voting: 3 out of 5 Nearest Neighbors (k = 5)Voting: 3 out of 5 Nearest Neighbors (k = 5)
► Confidence = 1.0 - D(v) / D(v’)Confidence = 1.0 - D(v) / D(v’)
∆ Age + 0.2 × ∆ Dose
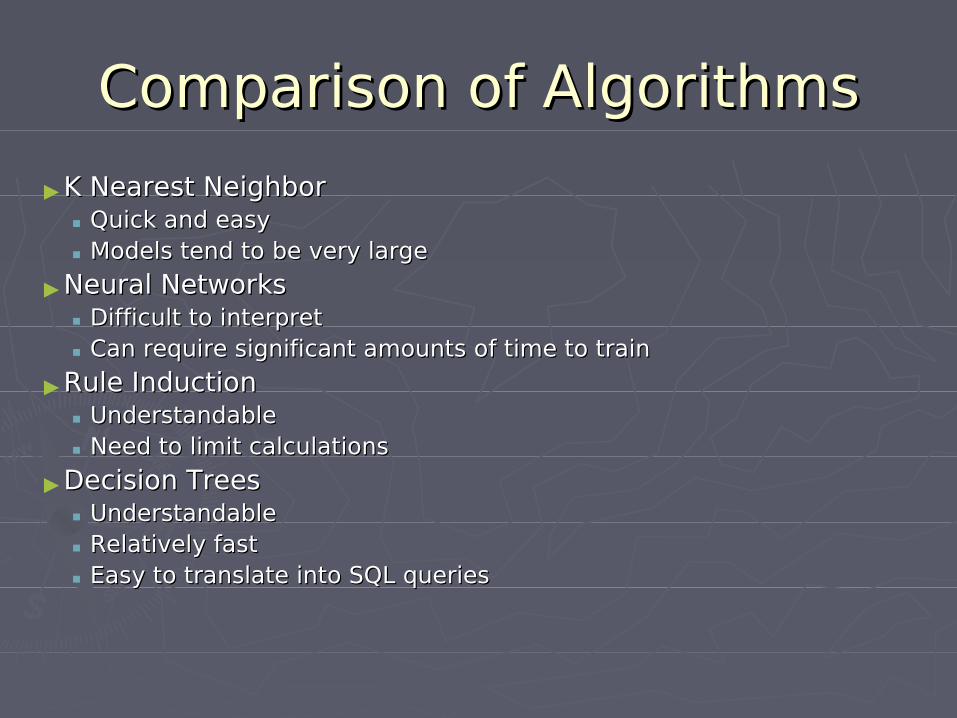
Comparison of AlgorithmsComparison of Algorithms
►K Nearest NeighborK Nearest Neighbor Quick and easy Quick and easy
Models tend to be very large Models tend to be very large
►Neural Networks Neural Networks Difficult to interpret Difficult to interpret
Can require significant amounts of time to train Can require significant amounts of time to train
►Rule Induction Rule Induction Understandable Understandable
Need to limit calculations Need to limit calculations
►Decision Trees Decision Trees Understandable Understandable
Relatively fast Relatively fast
Easy to translate into SQL queriesEasy to translate into SQL queries
Supervised / UnsupervisedSupervised / Unsupervised
► Supervised Learning:Supervised Learning:
1.1. As the name applies Techniques are supervised to work or perform. These models As the name applies Techniques are supervised to work or perform. These models are first TRAINED using data whose RESPONSE variable or result is already are first TRAINED using data whose RESPONSE variable or result is already KNOWN.KNOWN.
2.2. Predictive models (classification, regression etc) fall under this category –They have Predictive models (classification, regression etc) fall under this category –They have to train and then test. Estimated value is to compared with known value to train and then test. Estimated value is to compared with known value
► Unsupervised Learning:Unsupervised Learning:
1.1. As the name applies Techniques are unsupervised. There is no already known As the name applies Techniques are unsupervised. There is no already known result to guide the algorithm.result to guide the algorithm.
2.2. Descriptive Techniques clustering, Association etc falls under this category .Descriptive Techniques clustering, Association etc falls under this category .
Data Mining Data Mining Applications & ToolsApplications & Tools
ApplicationsApplications
►Customer ProfilingCustomer Profiling
►Target MarketingTarget Marketing
►Market Basket AnalysisMarket Basket Analysis
►Fraud DetectionFraud Detection
►Medical DiagnosticsMedical Diagnostics
►Direct mail marketing Direct mail marketing
►Web site personalization Web site personalization
►Bioinformatics Bioinformatics
►Anti Money LaunderingAnti Money Laundering
►Churn AnalysisChurn Analysis
Some Uses of DMSome Uses of DM
► DM can be used to discover new purchasing trends, plan DM can be used to discover new purchasing trends, plan investment strategies, and detect unauthorized expenditures in investment strategies, and detect unauthorized expenditures in the accounting system.the accounting system.
► It can improve marketing campaigns and the outcomes can be It can improve marketing campaigns and the outcomes can be used to provide customers with more focused support and used to provide customers with more focused support and attention.attention.
► Many law enforcement and special investigative units, whose Many law enforcement and special investigative units, whose mission is to identify fraudulent activities and discover crime mission is to identify fraudulent activities and discover crime trends, have also used data mining.trends, have also used data mining.
► Like identifying the critical behavior patterns in the Like identifying the critical behavior patterns in the communication interactions of narcotics organizationcommunication interactions of narcotics organization
► The monetary transactions of money laundering and insider The monetary transactions of money laundering and insider trading operations trading operations
► The movement of serial killers, and the targeting of smugglers at The movement of serial killers, and the targeting of smugglers at border crossings.border crossings.
► Government that maintains large data sources as part of Government that maintains large data sources as part of activities relating to matters of national security.activities relating to matters of national security.
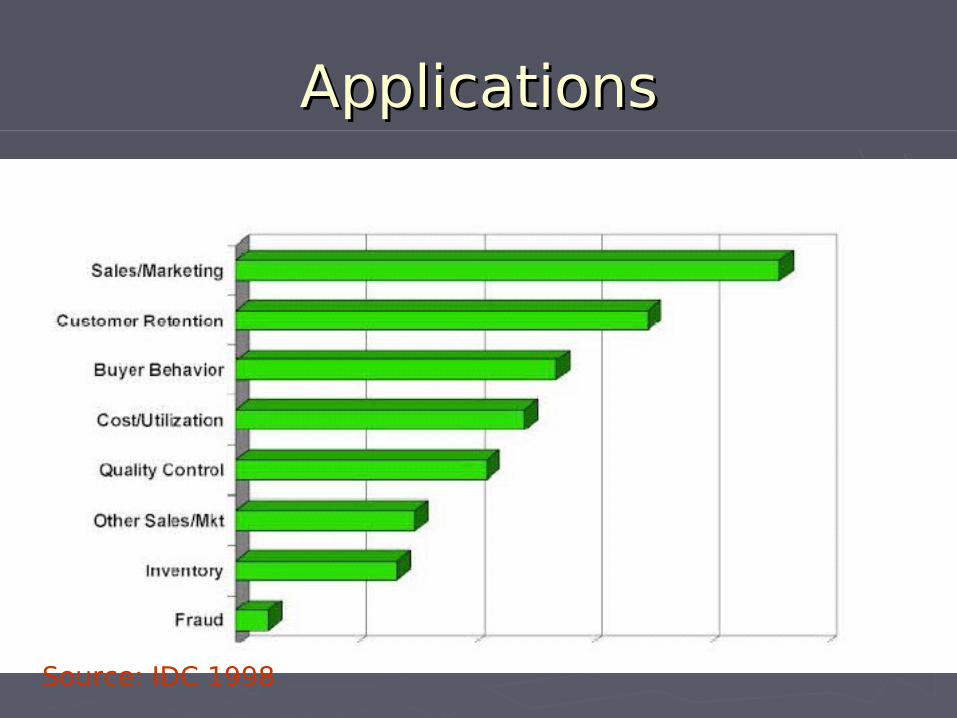
ApplicationsApplications
Source: IDC 1998
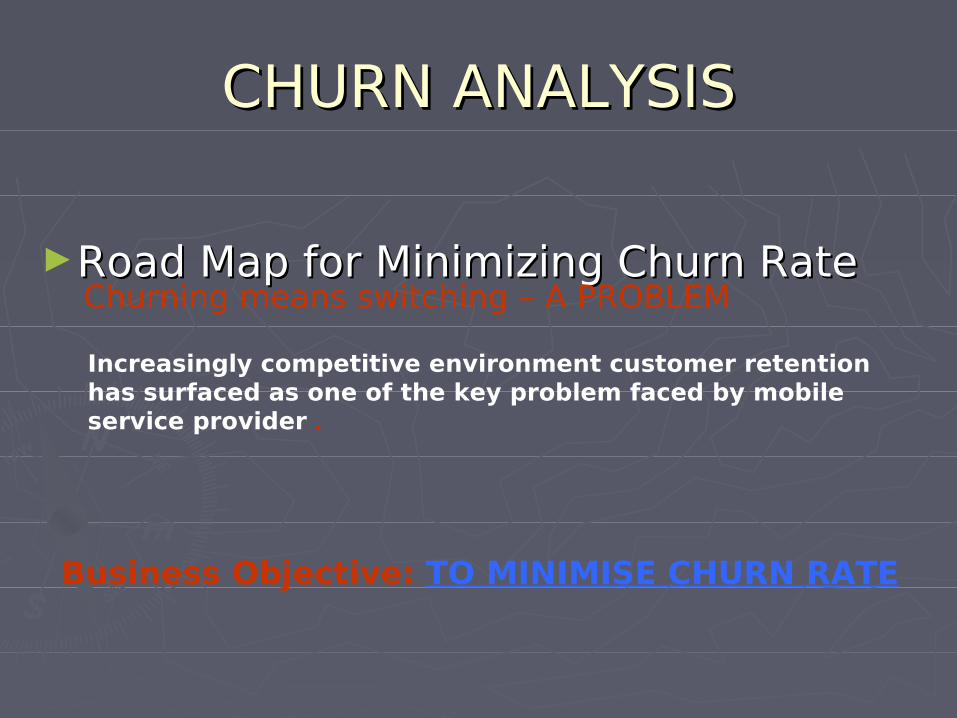
CHURN ANALYSISCHURN ANALYSIS
►Road Map for Minimizing Churn RateRoad Map for Minimizing Churn RateChurning means switching – A PROBLEM
Increasingly competitive environment customer retention has surfaced as one of the key problem faced by mobile
service provider .
Business Objective: TO MINIMISE CHURN RATE
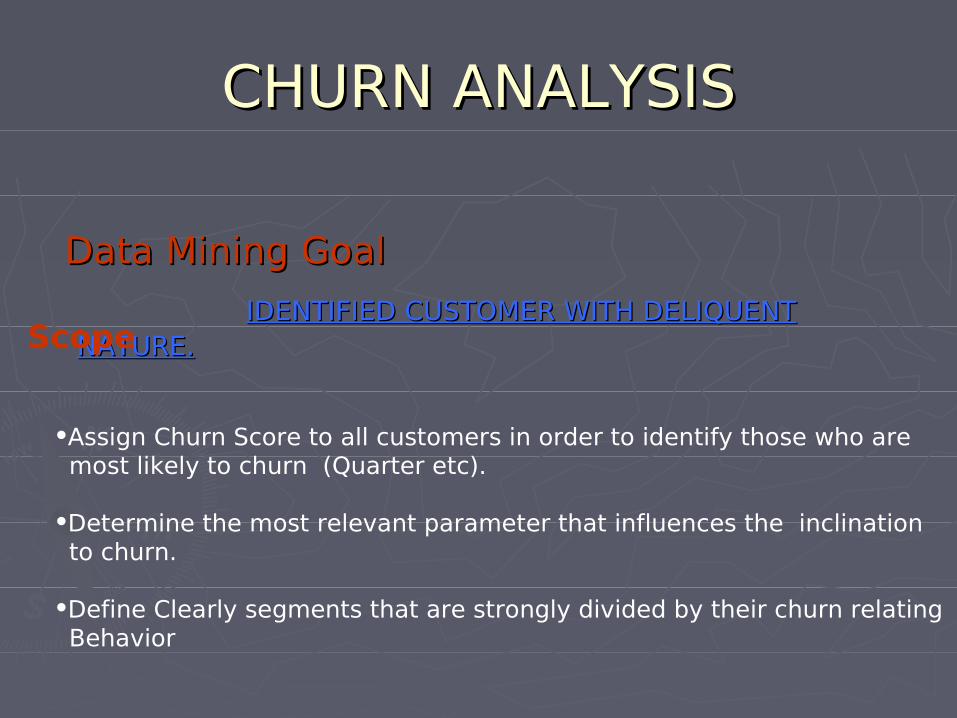
CHURN ANALYSISCHURN ANALYSIS
Data Mining GoalData Mining Goal
IDENTIFIED CUSTOMER WITH DELIQUENT IDENTIFIED CUSTOMER WITH DELIQUENT NATURE.NATURE.
•Assign Churn Score to all customers in order to identify those who are most likely to churn (Quarter etc).
•Determine the most relevant parameter that influences the inclination to churn.
•Define Clearly segments that are strongly divided by their churn relating Behavior
Scope
CHURN ANALYSISCHURN ANALYSIS
►Basic UnderstandingBasic Understanding
There are mainly two types of churnThere are mainly two types of churn
1. Customer Request (CRQ)1. Customer Request (CRQ)
2. Forced Churn (Defaulters)2. Forced Churn (Defaulters)
CHURN ANALYSISCHURN ANALYSIS
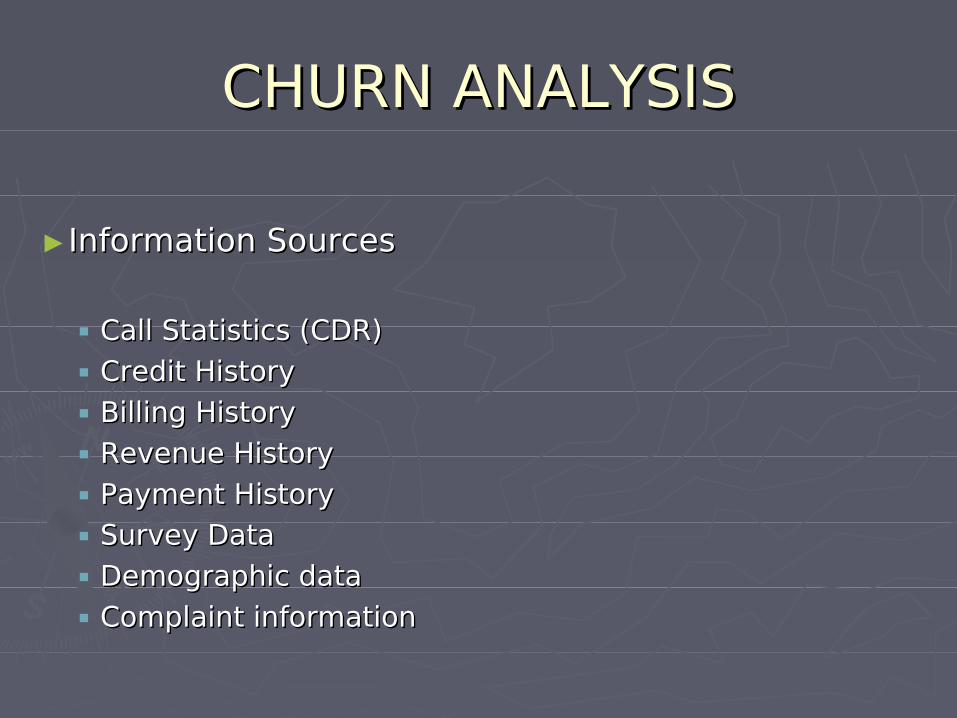
► Information SourcesInformation Sources
Call Statistics (CDR)Call Statistics (CDR)
Credit HistoryCredit History
Billing HistoryBilling History
Revenue HistoryRevenue History
Payment HistoryPayment History
Survey DataSurvey Data
Demographic dataDemographic data
Complaint information Complaint information
CHURN ANALYSISCHURN ANALYSIS
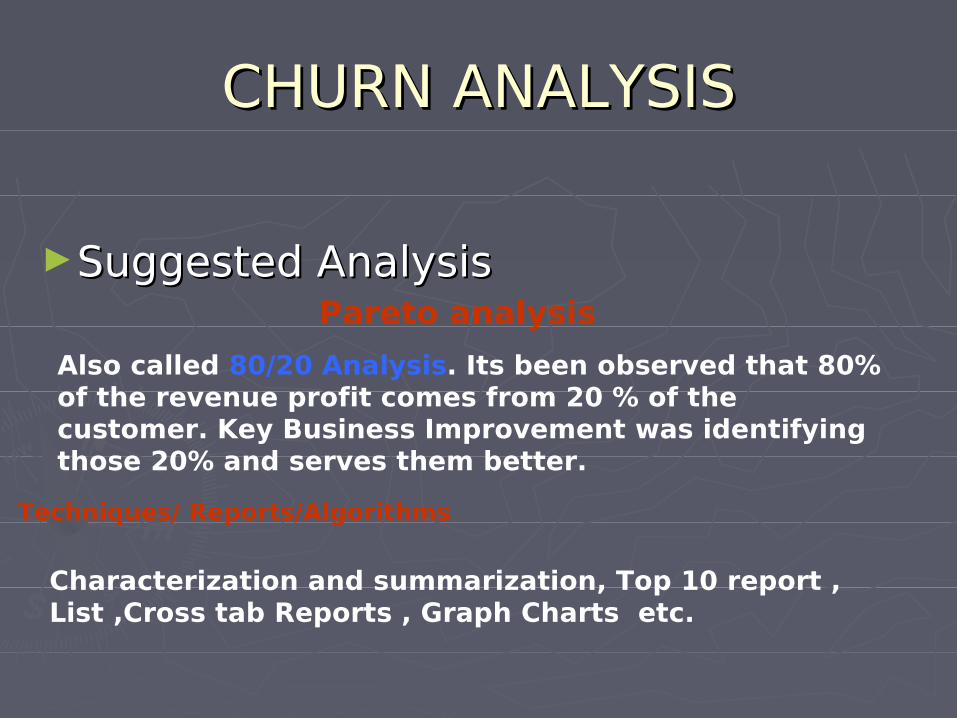
►Suggested AnalysisSuggested AnalysisPareto analysis
Also called 80/20 Analysis. Its been observed that 80% of the revenue profit comes from 20 % of the customer. Key Business Improvement was identifying those 20% and serves them better.
Characterization and summarization, Top 10 report , List ,Cross tab Reports , Graph Charts etc.
Techniques/ Reports/Algorithms
CHURN ANALYSISCHURN ANALYSIS
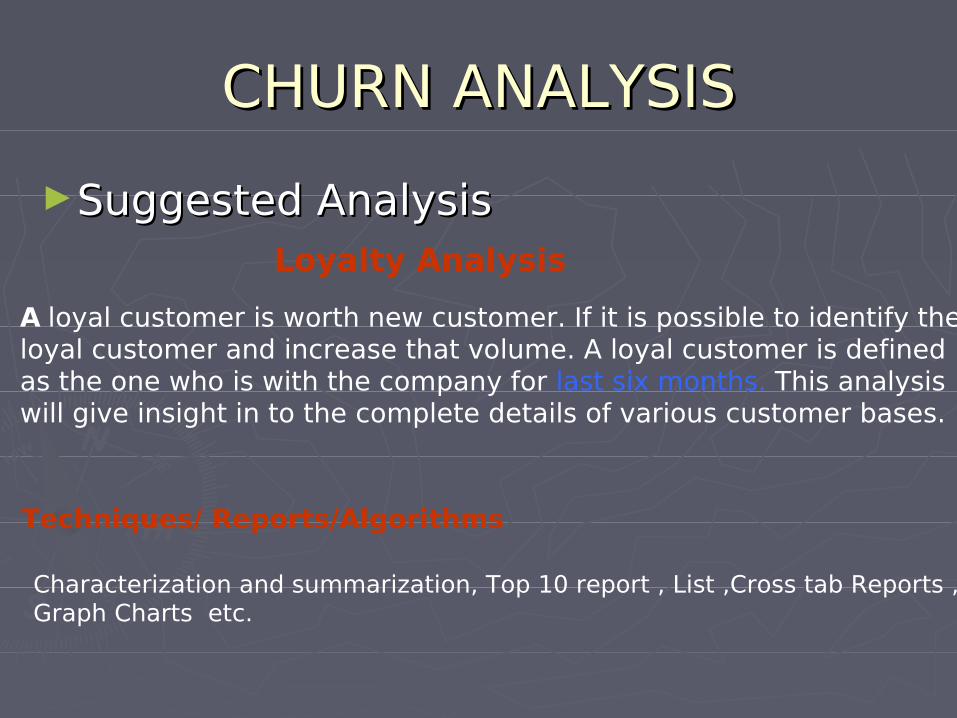
►Suggested AnalysisSuggested AnalysisLoyalty Analysis
A loyal customer is worth new customer. If it is possible to identify theloyal customer and increase that volume. A loyal customer is definedas the one who is with the company for last six months. This analysiswill give insight in to the complete details of various customer bases.
Techniques/ Reports/Algorithms
Characterization and summarization, Top 10 report , List ,Cross tab Reports , Graph Charts etc.
CHURN ANALYSISCHURN ANALYSIS
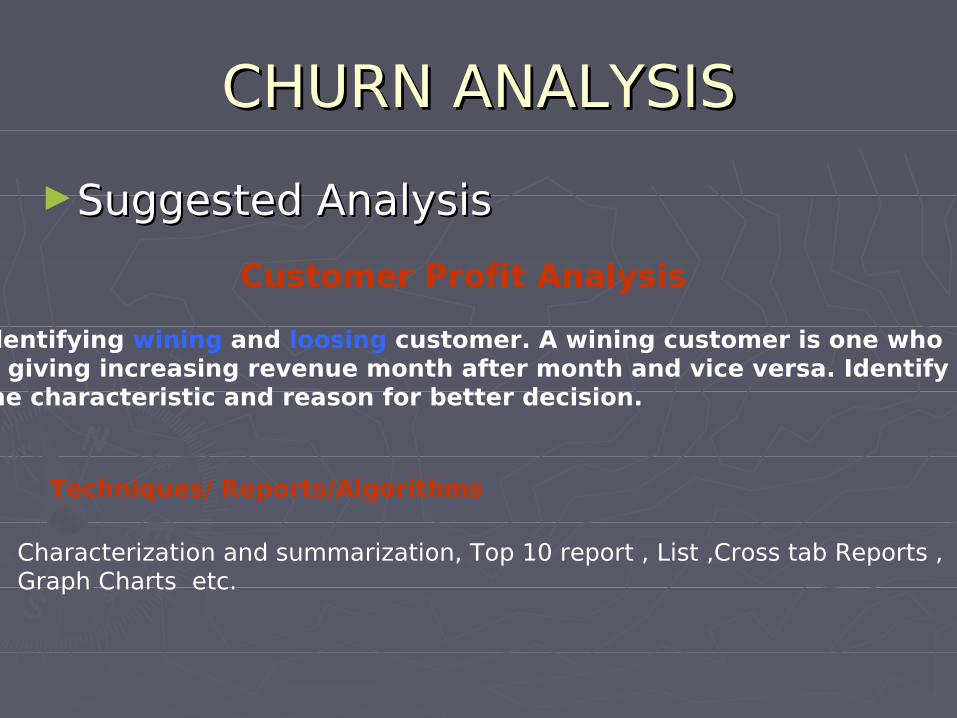
►Suggested AnalysisSuggested Analysis
Customer Profit Analysis
Identifying wining and loosing customer. A wining customer is one who is giving increasing revenue month after month and vice versa. Identifythe characteristic and reason for better decision.
Techniques/ Reports/Algorithms
Characterization and summarization, Top 10 report , List ,Cross tab Reports , Graph Charts etc.
CHURN ANALYSISCHURN ANALYSIS
►Suggested AnalysisSuggested AnalysisTrend Analysis
It’s a Visualization Technique. This Technique uses parallel Coordinate system to show the trend of various measures overdifferent time period
Techniques/ Reports/Algorithms
Parallel Coordinate graph
CHURN ANALYSISCHURN ANALYSIS
►Suggested AnalysisSuggested Analysis
Customer profiling
Inactive accounts, Light user, risky customer Active accounts, Loss making,profit making accounts. This segment helps in mapping with the predictivesegment.
List, Cross Tab, clustering , Graph Charts
Techniques/ Reports/Algorithms
CHURN ANALYSISCHURN ANALYSIS
►Suggested AnalysisSuggested AnalysisLTV Analysis
Called Life Time value Analysis .Revenue projected over 25 yrs and Projected Churning loss and rate.
List report, Line Graphs, graph Charts
Techniques/ Reports/Algorithms
CHURN ANALYSISCHURN ANALYSIS
►Suggested AnalysisSuggested Analysis
Churn Modeling
Cost of acquiring new customer is more than retaining one. Classification of churn models. Assign churn score and predictive modeling.
Techniques/ Reports/Algorithms
Scoring, Decision Tree, neural network, Clustering.
CHURN ANALYSISCHURN ANALYSIS
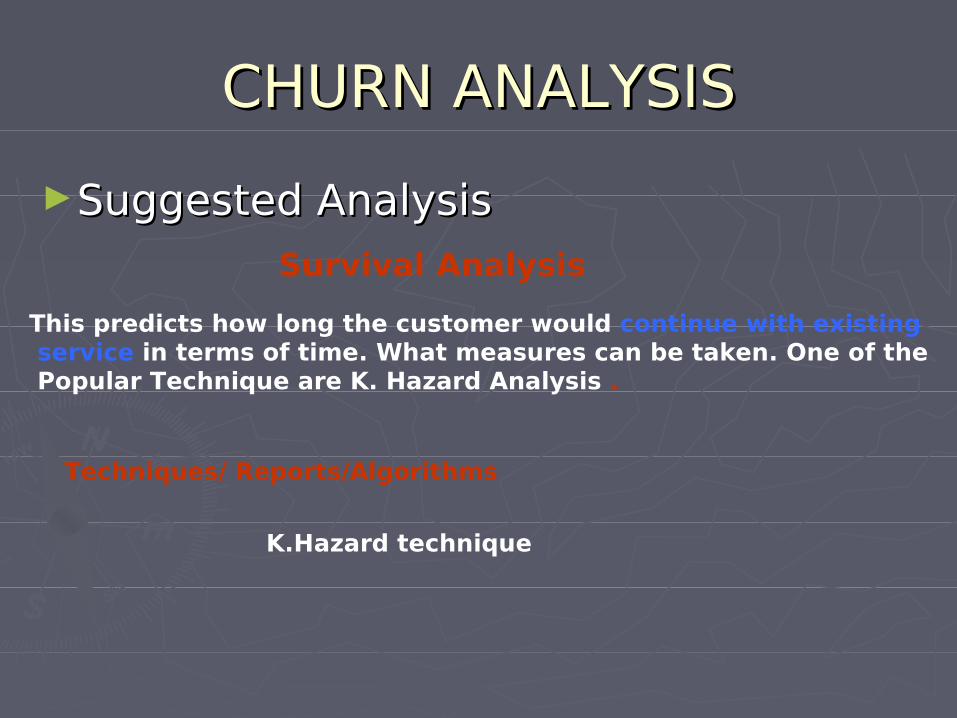
►Suggested AnalysisSuggested AnalysisSurvival Analysis
This predicts how long the customer would continue with existing service in terms of time. What measures can be taken. One of the Popular Technique are K. Hazard Analysis .
Techniques/ Reports/Algorithms
K.Hazard technique
CHURN ANALYSISCHURN ANALYSIS
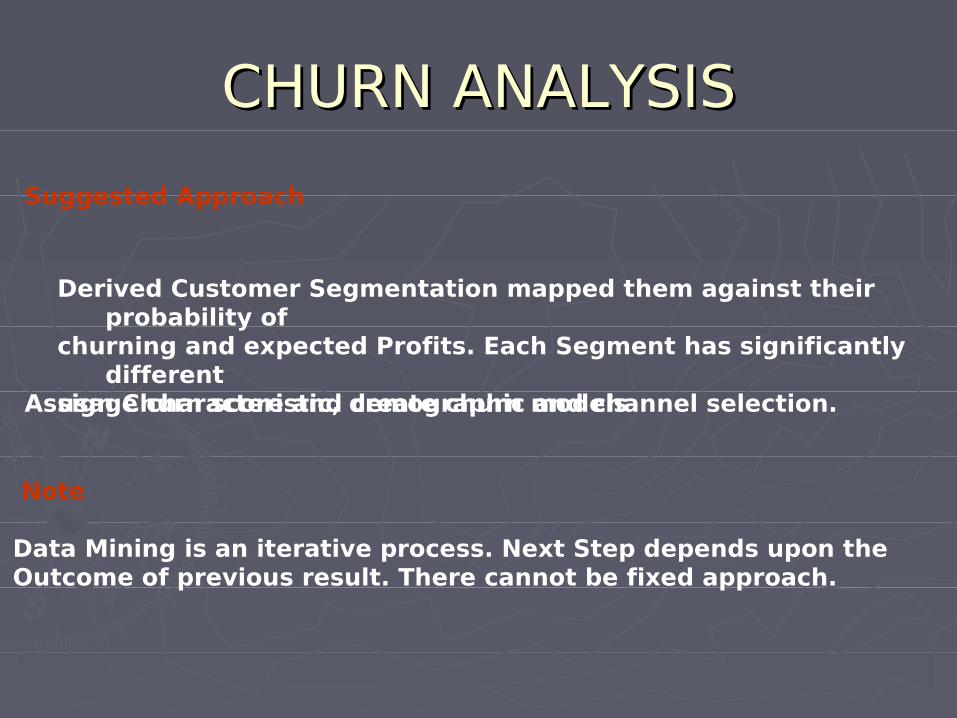
Derived Customer Segmentation mapped them against their probability of
churning and expected Profits. Each Segment has significantly different
usage characteristic, demographic and channel selection.Assign Churn score and create churn models
Suggested Approach
Note
Data Mining is an iterative process. Next Step depends upon the Outcome of previous result. There cannot be fixed approach.
Tools and VendorsTools and Vendors
► IBM - Intelligent minerIBM - Intelligent miner►SPSS - ClementineSPSS - Clementine►SAS - Enterprise minerSAS - Enterprise miner►SGI - Mine SetSGI - Mine Set►Accrue - Decision SeriesAccrue - Decision Series►Poly Analyst – Megaputer.Poly Analyst – Megaputer.
Comparison of ToolsComparison of Tools
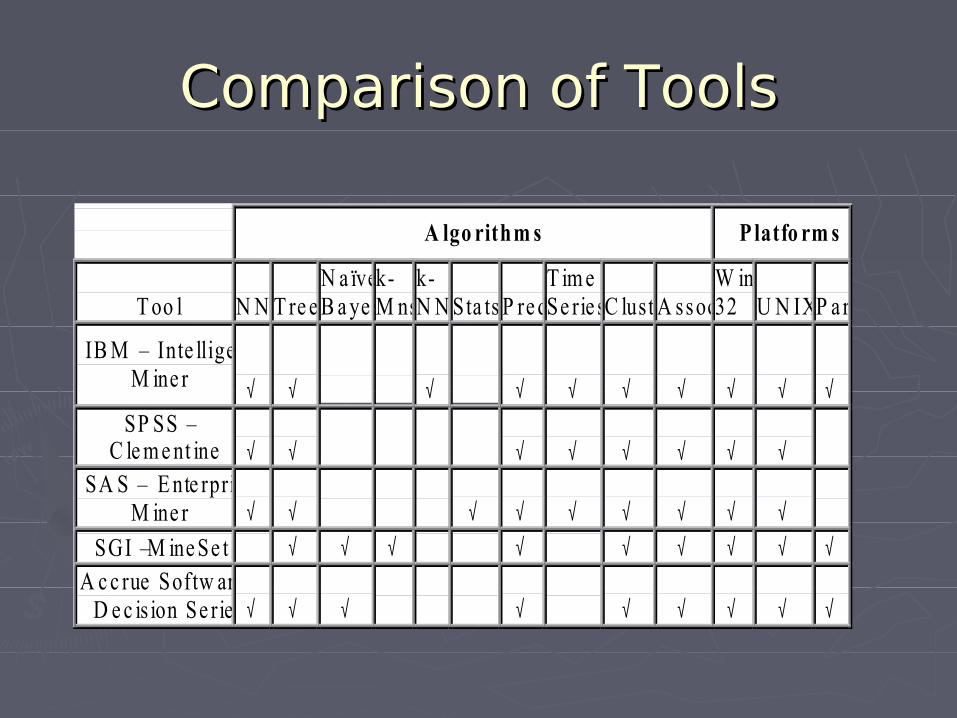
A lgo rithm s P latfo rm s
T oo l N N T re eN a ïveB a ye s
k-M ns
k-N N Sta ts P re d
T im eSe rie sC lust A ssoc
W in32 U N IXP a r
IB M – Inte llige ntM ine r √ √ √ √ √ √ √ √ √ √
SP SS –C le m e nt ine √ √ √ √ √ √ √ √
SA S – E nte rpriseM ine r √ √ √ √ √ √ √ √ √
SGI – M ine Se t √ √ √ √ √ √ √ √ √A c c rue Softw are –
D e c is ion Se rie s √ √ √ √ √ √ √ √ √
Trends and Market UpdatesTrends and Market Updates
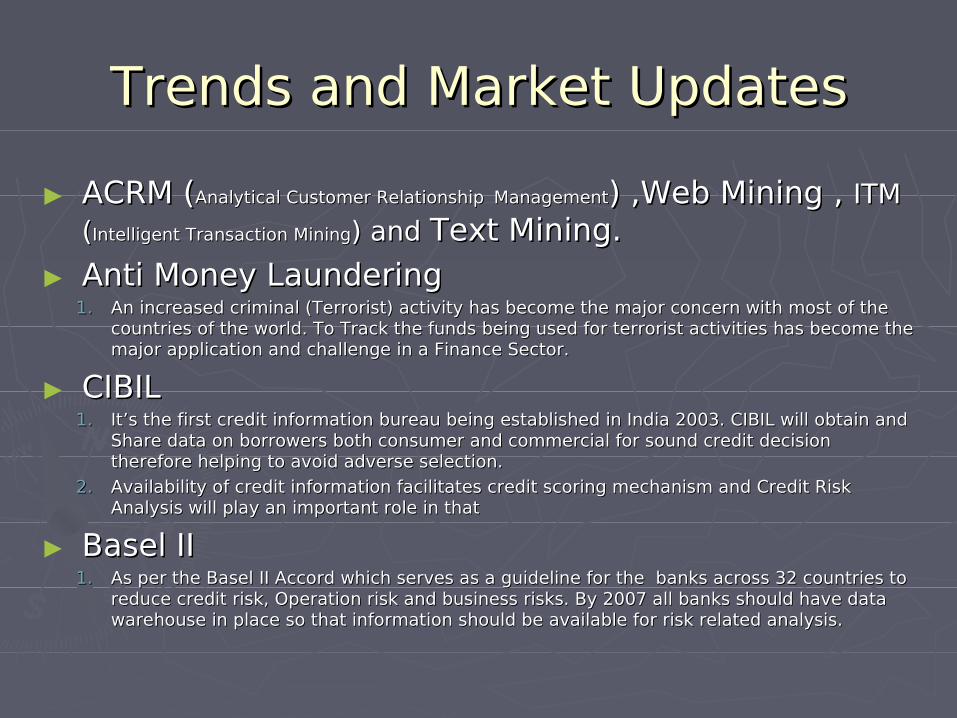
► ACRM (ACRM (Analytical Customer RelationshipAnalytical Customer Relationship ManagementManagement) ,Web Mining , ) ,Web Mining , ITM ITM ((Intelligent Transaction MiningIntelligent Transaction Mining) and ) and Text Mining.Text Mining.
► Anti Money LaunderingAnti Money Laundering1.1. An increased criminal (Terrorist) activity has become the major concern with most of the An increased criminal (Terrorist) activity has become the major concern with most of the
countries of the world. To Track the funds being used for terrorist activities has become the countries of the world. To Track the funds being used for terrorist activities has become the major application and challenge in a Finance Sector.major application and challenge in a Finance Sector.
► CIBIL CIBIL 1.1. It’s the first credit information bureau being established in India 2003. CIBIL will obtain and It’s the first credit information bureau being established in India 2003. CIBIL will obtain and
Share data on borrowers both consumer and commercial for sound credit decision Share data on borrowers both consumer and commercial for sound credit decision therefore helping to avoid adverse selection.therefore helping to avoid adverse selection.
2.2. Availability of credit information facilitates credit scoring mechanism and Credit Risk Availability of credit information facilitates credit scoring mechanism and Credit Risk Analysis will play an important role in that Analysis will play an important role in that
► Basel IIBasel II1.1. As per the Basel II Accord which serves as a guideline for the banks across 32 countries to As per the Basel II Accord which serves as a guideline for the banks across 32 countries to
reduce credit risk, Operation risk and business risks. By 2007 all banks should have data reduce credit risk, Operation risk and business risks. By 2007 all banks should have data warehouse in place so that information should be available for risk related analysis.warehouse in place so that information should be available for risk related analysis.
Data Mining Data Mining MethodologyMethodology
Data Mining MethodologyData Mining Methodology
MethodologiesMethodologies
►Discussion on following methodologiesDiscussion on following methodologies
CRISP-DM methodologyCRISP-DM methodology Wipro - Data mining methodologyWipro - Data mining methodology
CRISP - DMCRISP - DM
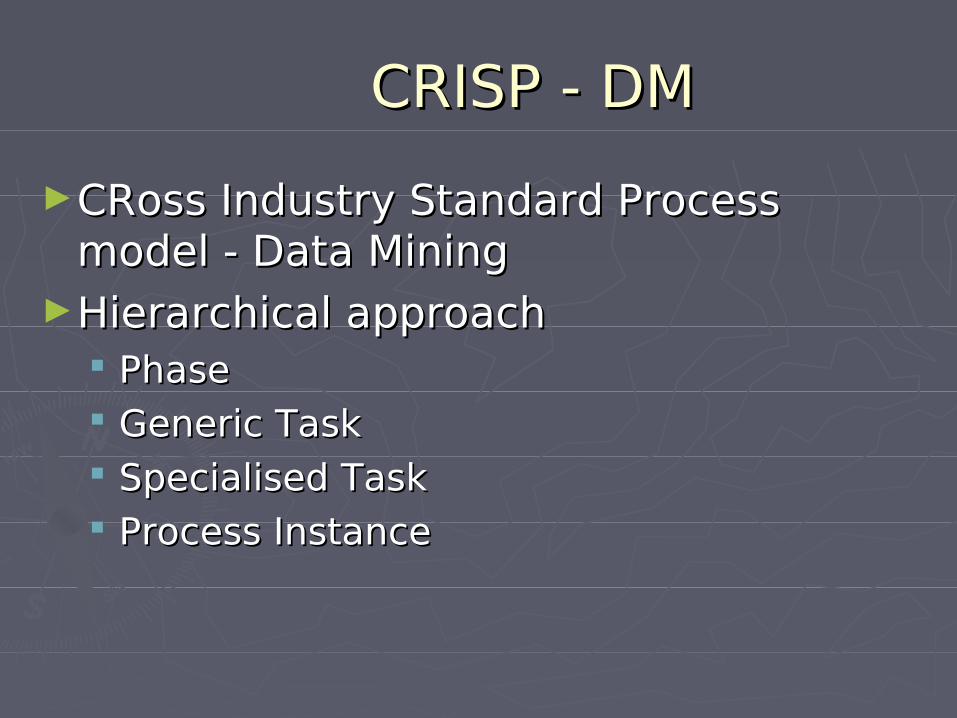
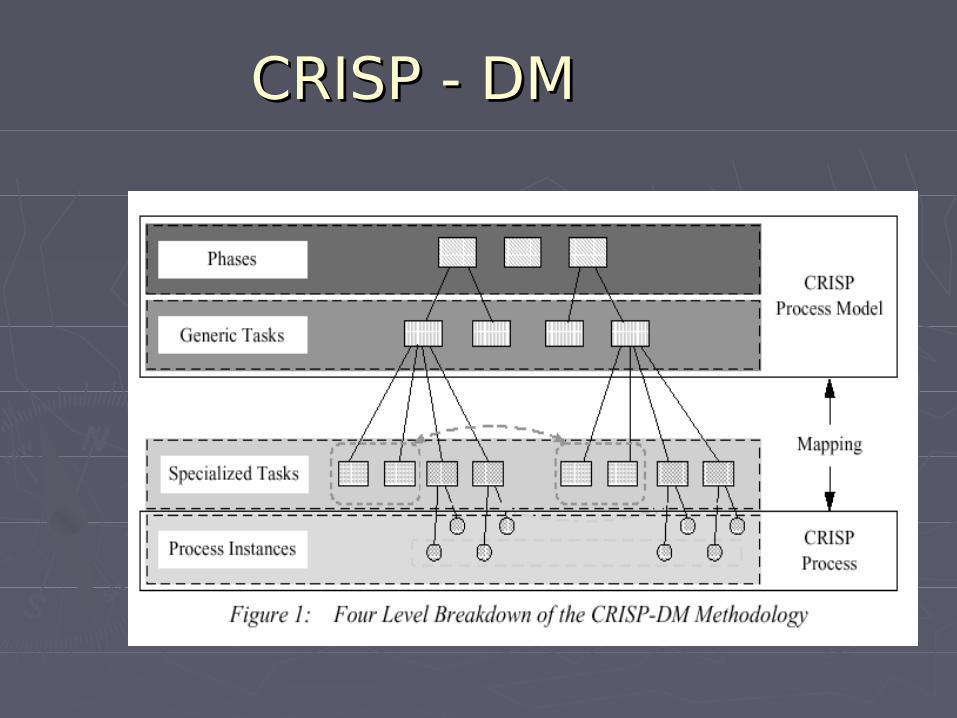
►CRoss Industry Standard Process CRoss Industry Standard Process model - Data Miningmodel - Data Mining
►Hierarchical approachHierarchical approach PhasePhase Generic TaskGeneric Task Specialised TaskSpecialised Task Process InstanceProcess Instance
CRISP - DMCRISP - DM
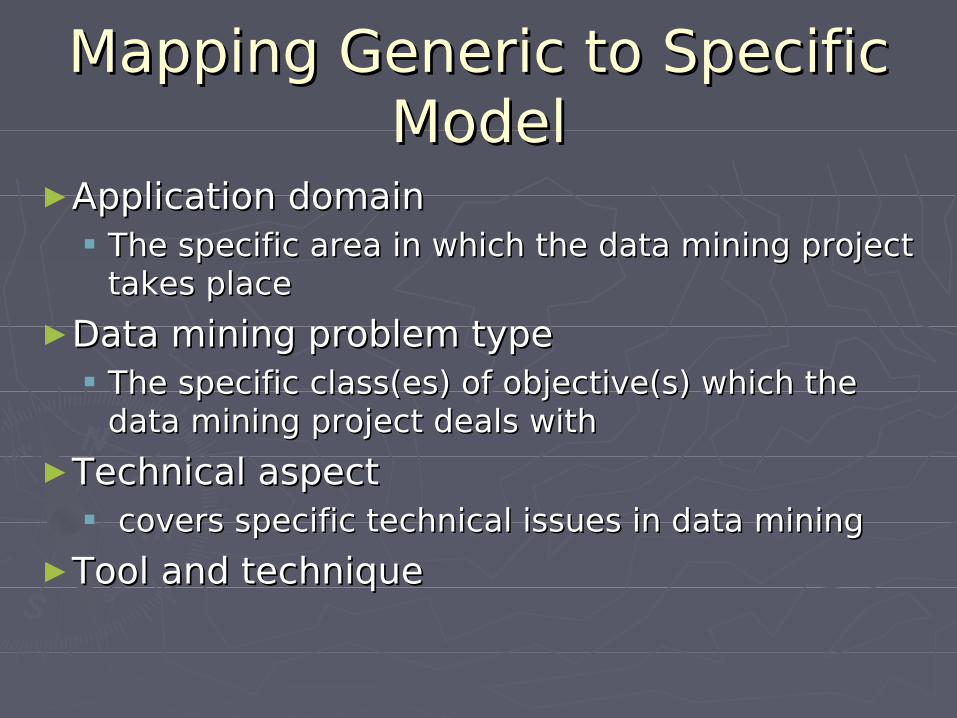
Mapping Generic to Specific Mapping Generic to Specific ModelModel
►Application domainApplication domain The specific area in which the data mining project The specific area in which the data mining project
takes placetakes place
►Data mining problem type Data mining problem type The specific class(es) of objective(s) which the The specific class(es) of objective(s) which the
data mining project deals with data mining project deals with
►Technical aspectTechnical aspect covers specific technical issues in data miningcovers specific technical issues in data mining
►Tool and techniqueTool and technique
The CycleThe Cycle
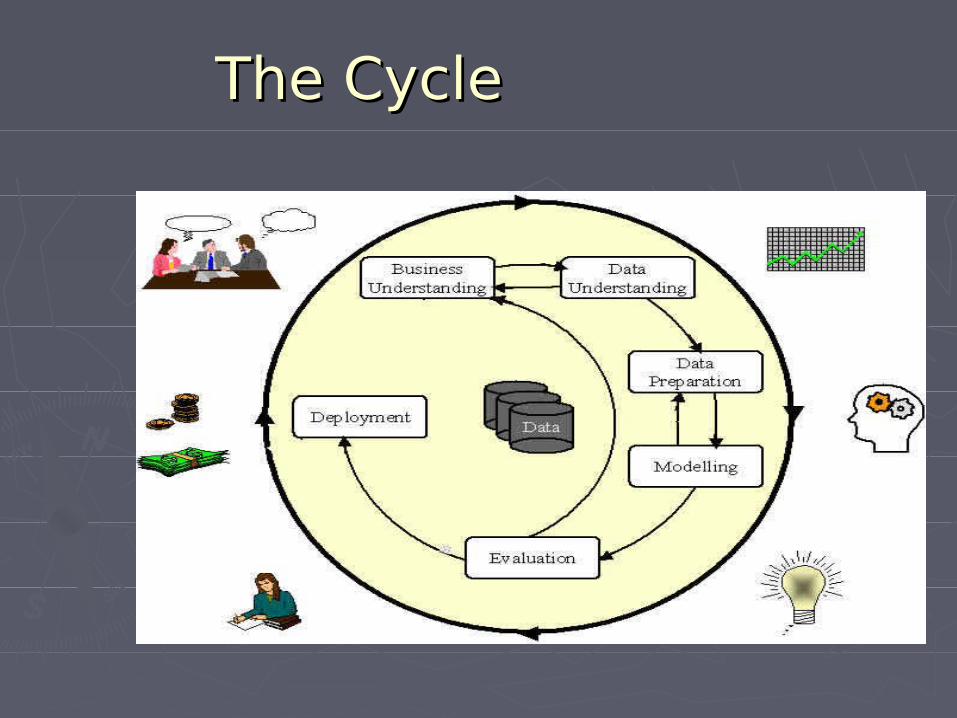
PhasesPhases
►Business UnderstandingBusiness Understanding►Data UnderstandingData Understanding►Data PreparationData Preparation►ModelingModeling►EvaluationEvaluation►DeploymentDeployment
Business UnderstandingBusiness Understanding
►Understanding the project objectives Understanding the project objectives and requirements from a business and requirements from a business perspectiveperspective
►Converting this requirements into a Converting this requirements into a data mining problem definitiondata mining problem definition
►Preliminary plan designed to achieve Preliminary plan designed to achieve the objectives.the objectives.
Data UnderstandingData Understanding
► Initial data collectionInitial data collection► Identifying data quality problemsIdentifying data quality problems►detect interesting subsets to form detect interesting subsets to form
hypotheses for hidden information.hypotheses for hidden information.
Data PreparationData Preparation
► Identification of data at Table, Record, Identification of data at Table, Record, and Attribute leveland Attribute level
►Transformation and cleaning of data Transformation and cleaning of data for modeling tools.for modeling tools.
►Data preparation tasks are performed Data preparation tasks are performed multiple timesmultiple times
ModelingModeling
► Identification of the suitable modeling Identification of the suitable modeling techniques for the requirementtechniques for the requirement
►Applying the various possible models Applying the various possible models on the data seton the data set
►Requires stepping back to the data Requires stepping back to the data preparation phase, due to the model preparation phase, due to the model specific requirementsspecific requirements
EvaluationEvaluation
►Evaluate the model, and review the Evaluate the model, and review the steps executed to construct the model, steps executed to construct the model, from a business perspectivefrom a business perspective
►Determining the business issues that Determining the business issues that are not sufficiently considered. are not sufficiently considered.
►Deciding on the use of the data mining Deciding on the use of the data mining resultsresults
DeploymentDeployment
►This can be as simple as generating a report This can be as simple as generating a report or as complex as implementing a repeatable or as complex as implementing a repeatable data mining process, depending on the data mining process, depending on the requirements.requirements.
► Normally carried out by the customer and Normally carried out by the customer and not the data analyst. not the data analyst.
►Customer has to understand up front what Customer has to understand up front what actions will need to be carried out in order to actions will need to be carried out in order to actually make use of the created models.actually make use of the created models.
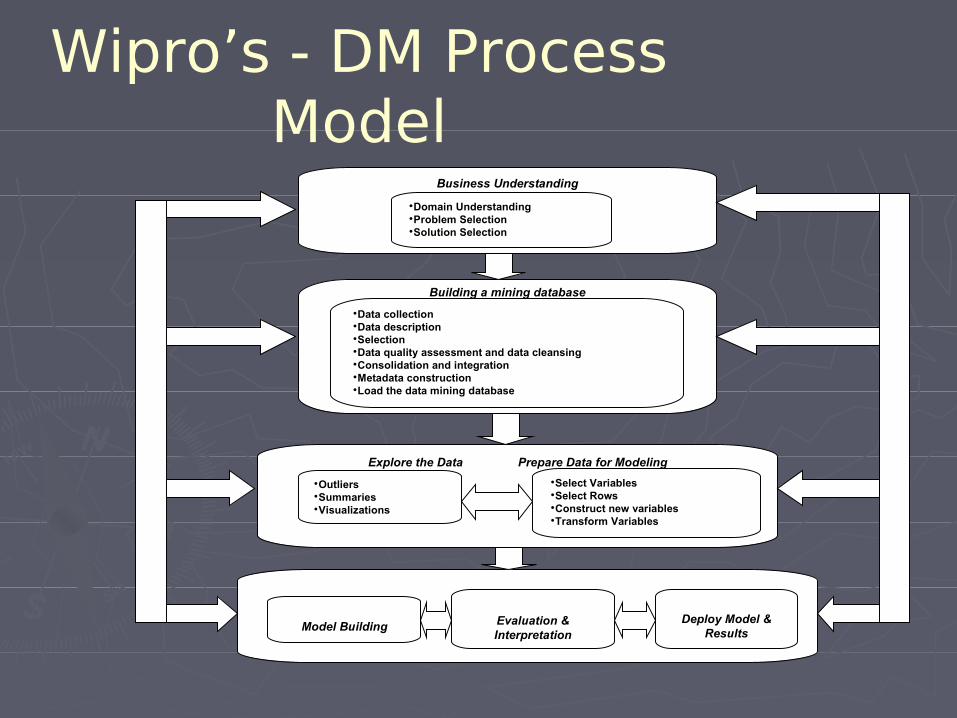
Wipro’s - DM Process Model
Business Understanding
•Domain Understanding •Problem Selection•Solution Selection
Building a mining database
•Data collection•Data description•Selection•Data quality assessment and data cleansing•Consolidation and integration•Metadata construction•Load the data mining database
Explore the Data Prepare Data for Modeling
•Outliers•Summaries•Visualizations
•Select Variables•Select Rows•Construct new variables•Transform Variables
Model Building Evaluation & Interpretation
Deploy Model & Results

Business UnderstandingBusiness Understanding
►Understanding the project objectives Understanding the project objectives and requirements from a business and requirements from a business perspectiveperspective
►Converting this requirements into a Converting this requirements into a data mining problem definitiondata mining problem definition
►Preliminary plan designed to achieve Preliminary plan designed to achieve the objectives.the objectives.
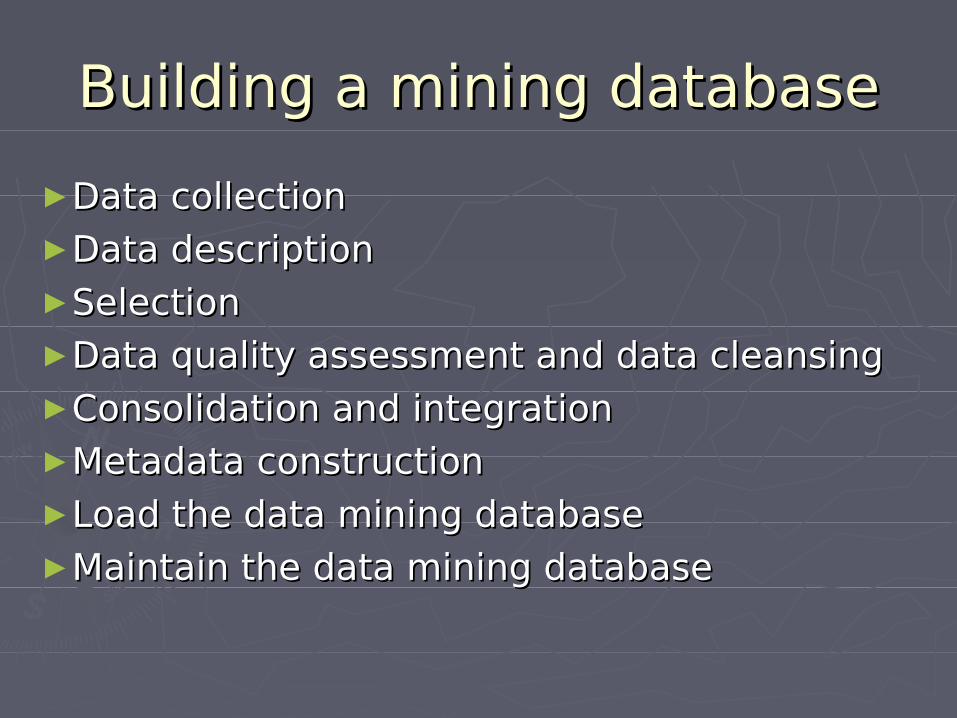
Building a mining databaseBuilding a mining database
►Data collectionData collection►Data descriptionData description►SelectionSelection►Data quality assessment and data cleansingData quality assessment and data cleansing►Consolidation and integrationConsolidation and integration►Metadata constructionMetadata construction►Load the data mining databaseLoad the data mining database►Maintain the data mining databaseMaintain the data mining database
Explore the dataExplore the data
► Identify outliers.Identify outliers.►Summarization.Summarization.►Visualization.Visualization.
Prepare data for modelingPrepare data for modeling
►Select variablesSelect variables►Select rowsSelect rows►Construct new variablesConstruct new variables►Transform variablesTransform variables
Building and Deploying Building and Deploying modelmodel
►Data mining model buildingData mining model building►Evaluation and interpretation of the Evaluation and interpretation of the
modelmodel►Deploy the Model and ResultsDeploy the Model and Results
Any Questions ?Any Questions ?Thank You forThank You for
your time your time