Embed Size (px)
Citation preview

Data Mining: Data Mining: Discovering Discovering Information From Information From Bio-DataBio-Data
Present by:Present by:
Hongli Li & Nianya LiuHongli Li & Nianya Liu
University of Massachusetts University of Massachusetts LowellLowell
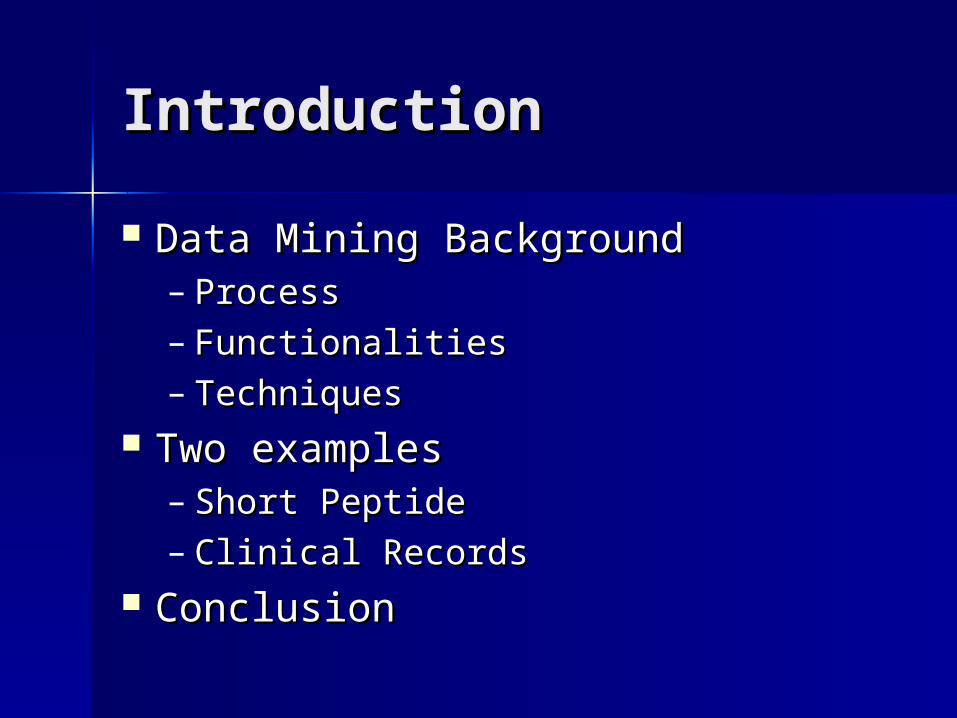
IntroductionIntroduction
Data Mining BackgroundData Mining Background– ProcessProcess– FunctionalitiesFunctionalities– TechniquesTechniques
Two examplesTwo examples– Short Peptide Short Peptide – Clinical RecordsClinical Records
ConclusionConclusion
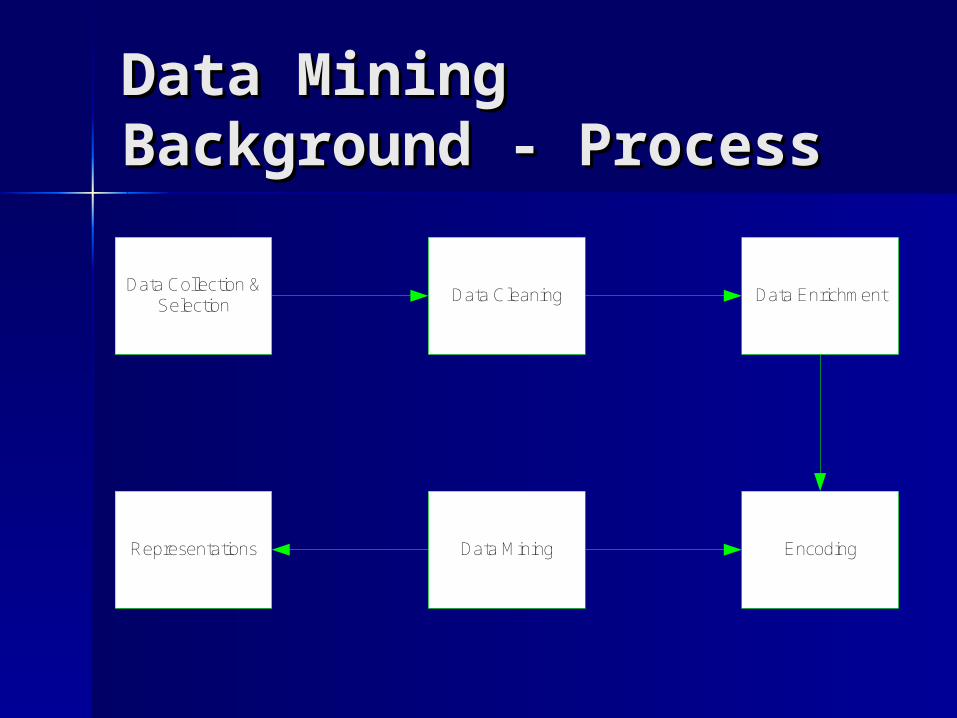
Data Mining Data Mining Background - ProcessBackground - Process
Data Collection &Selection
Data Cleaning Data Enrichment
Data MiningRepresentations Encoding
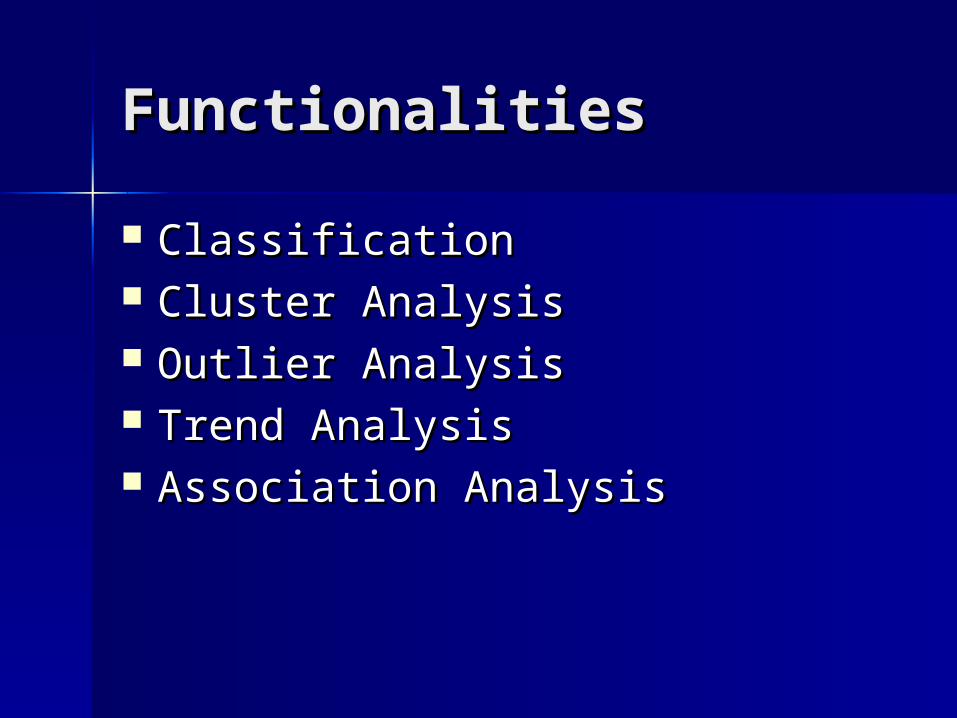
FunctionalitiesFunctionalities
ClassificationClassification Cluster AnalysisCluster Analysis Outlier AnalysisOutlier Analysis Trend AnalysisTrend Analysis Association AnalysisAssociation Analysis
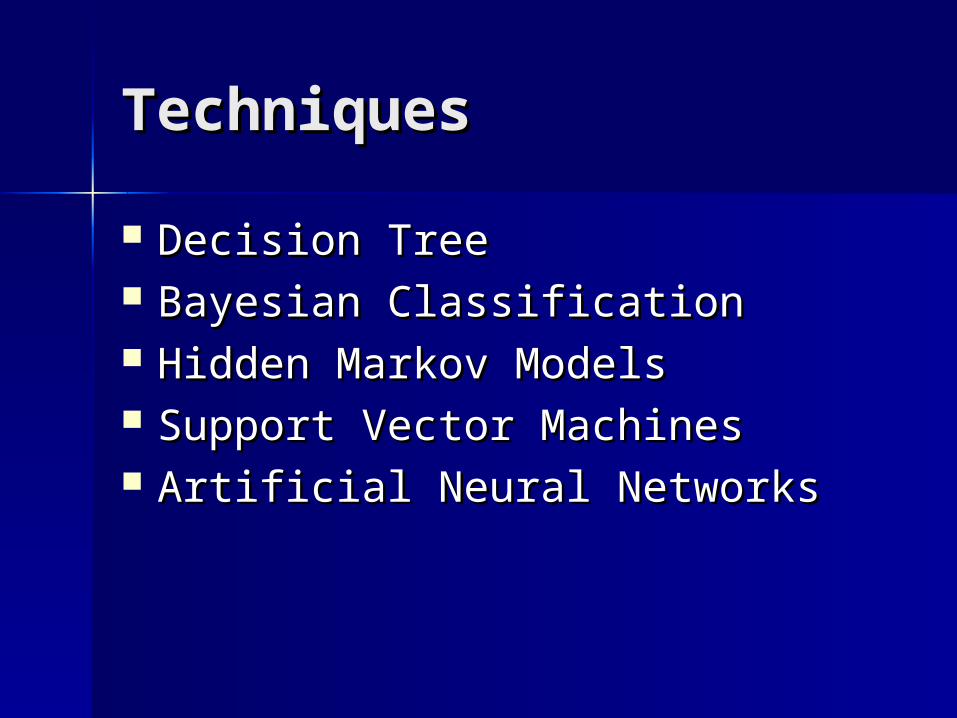
TechniquesTechniques
Decision TreeDecision Tree Bayesian ClassificationBayesian Classification Hidden Markov ModelsHidden Markov Models Support Vector MachinesSupport Vector Machines Artificial Neural NetworksArtificial Neural Networks
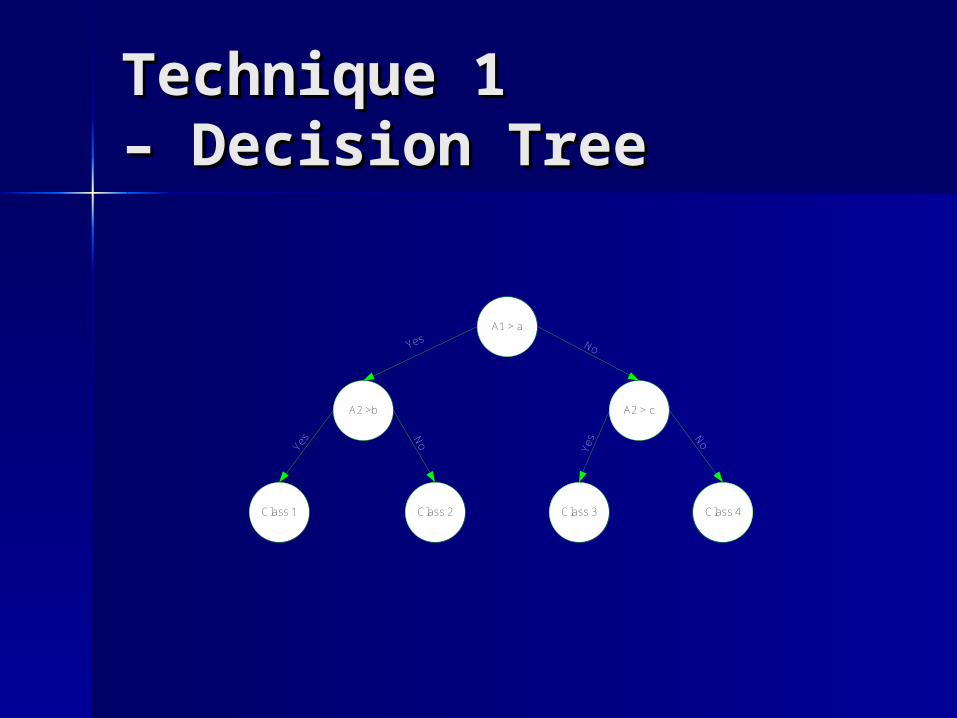
Technique 1 Technique 1 – Decision Tree– Decision Tree
A1 > a
A2 >b A2 > c
Class 1 Class 2 Class 3 Class 4
Yes No
No
No
Yes
Yes
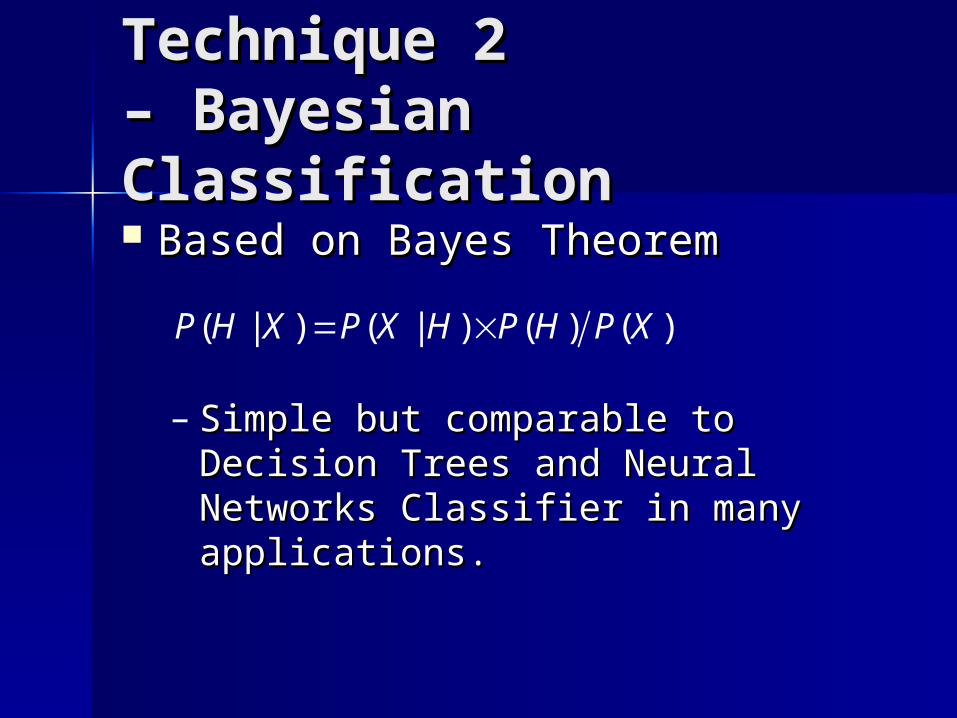
Technique 2 Technique 2 – Bayesian – Bayesian ClassificationClassification Based on Bayes TheoremBased on Bayes Theorem
– Simple but comparable to Decision Simple but comparable to Decision Trees and Neural Networks Classifier Trees and Neural Networks Classifier in many applications.in many applications.
( | ) ( | ) ( ) ( )P H X P X H P H P X
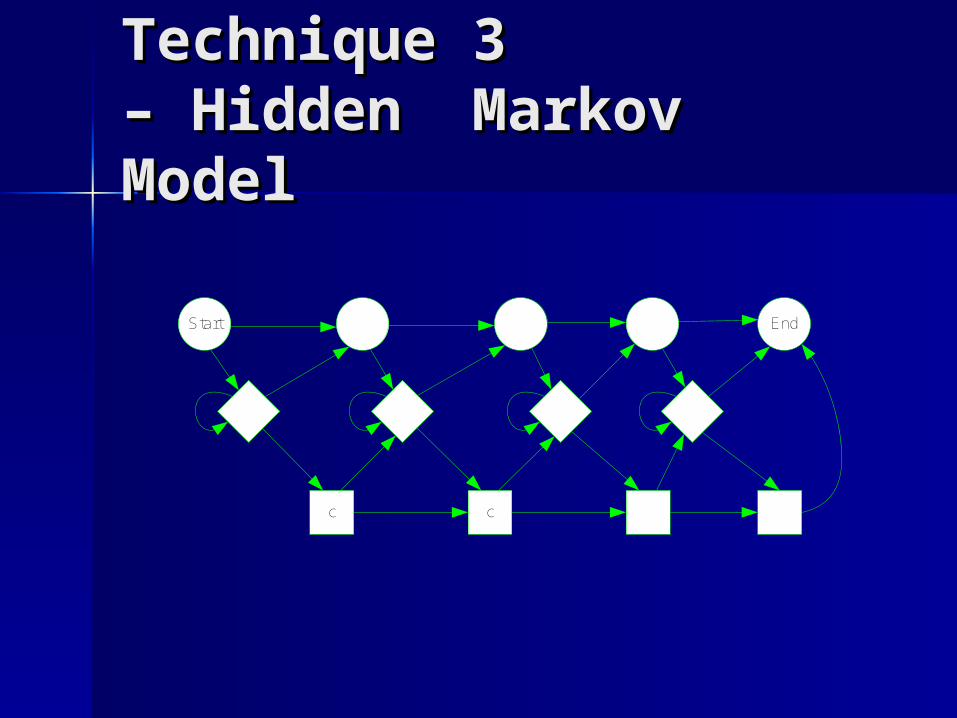
Technique 3 Technique 3 – Hidden Markov – Hidden Markov ModelModel
Start
c c
End
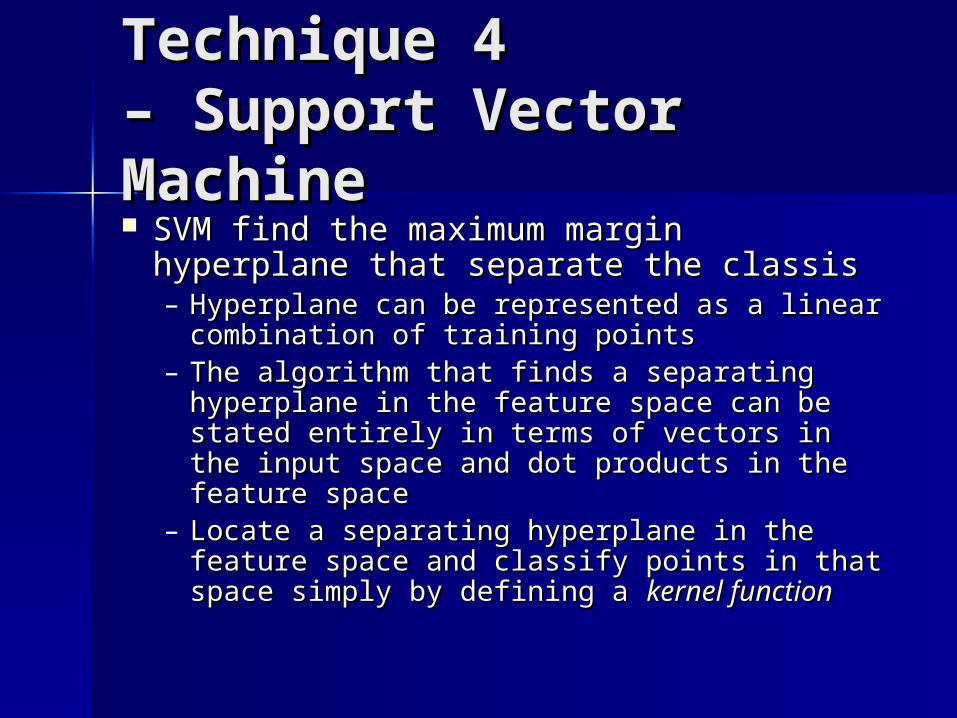
Technique 4 Technique 4 – Support Vector – Support Vector MachineMachine SVM find the maximum margin SVM find the maximum margin
hyperplane that separate the classishyperplane that separate the classis– Hyperplane can be represented as a linear Hyperplane can be represented as a linear
combination of training pointscombination of training points– The algorithm that finds a separating The algorithm that finds a separating
hyperplane in the feature space can be hyperplane in the feature space can be stated entirely in terms of vectors in the stated entirely in terms of vectors in the input space and dot products in the feature input space and dot products in the feature spacespace
– Locate a separating hyperplane in the Locate a separating hyperplane in the feature space and classify points in that feature space and classify points in that space simply by defining a space simply by defining a kernel functionkernel function
Example 1 Example 1 – Short Peptides– Short Peptides ProblemProblem
– Identify T-cell epitopes from Identify T-cell epitopes from Melanoma antigensMelanoma antigens
– Training Set: Training Set: 602 HLA-DR4 binding peptides602 HLA-DR4 binding peptides 713 non-binding713 non-binding
Solution – Neural NetworksSolution – Neural Networks
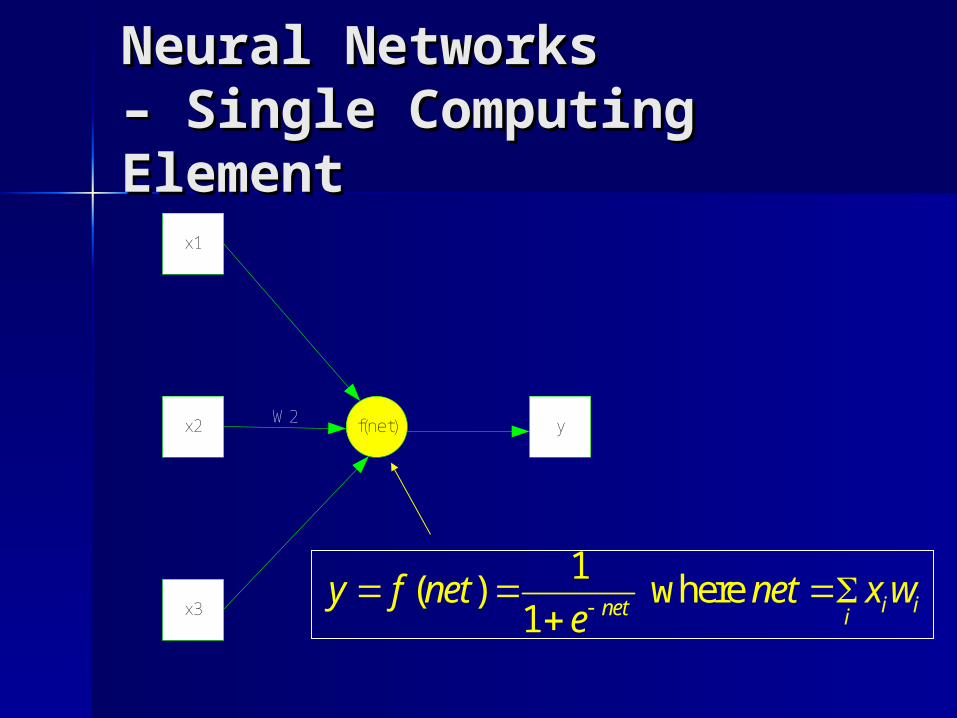
Neural Networks Neural Networks – Single Computing – Single Computing ElementElement
x1
x2
x3
f(net)W2 y
1( ) where
1 i inet iy f net net x w
e
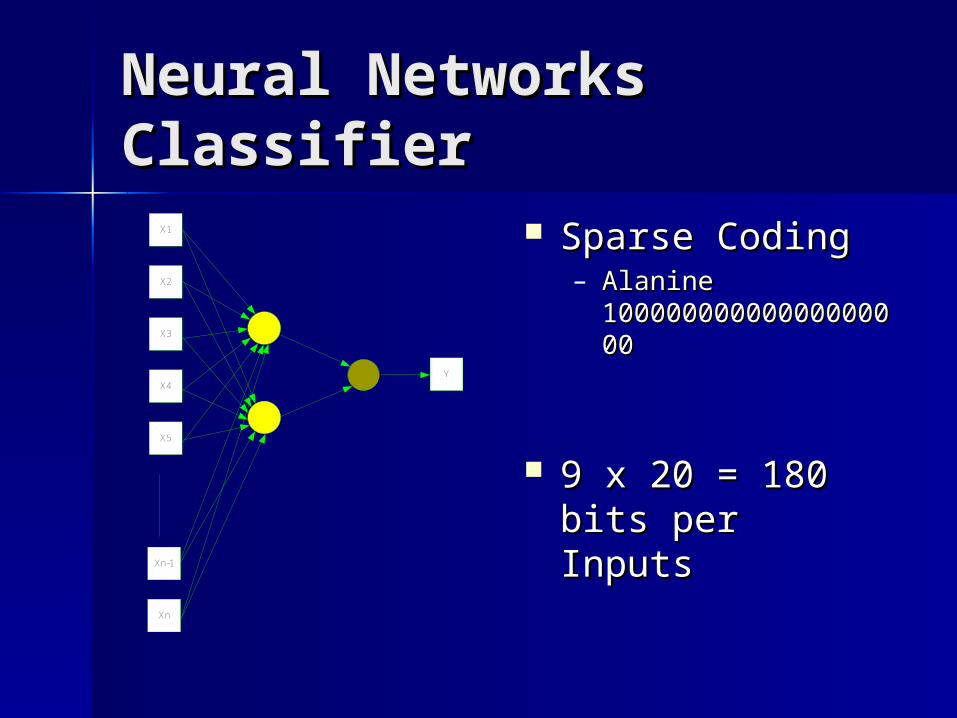
Neural Networks Neural Networks Classifier Classifier
X1
X2
X3
X4
X5
Xn-1
Xn
Y
Sparse CodingSparse Coding– Alanine Alanine
1000000000000000010000000000000000000000
9 x 20 = 180 bits 9 x 20 = 180 bits per Inputsper Inputs

Neural Networks Neural Networks – Error Back-– Error Back-Propagation Propagation
x1
x2
x3
y
v3,2
v3,1
v2,2
v2,1
v1,1
v1,2
w1
w2
Squared error: Squared error: Adjustment Adjustment
2( )
2
t yE
( ( ))j i ijj
i
y f w f x v
jzWhere is the output of the computing element of the first Where is the output of the computing element of the first layerlayer
And And is the difference between the output y and correct output t. is the difference between the output y and correct output t.
thj
( )( )(1 )( )j jj
Ew y y z
w
( )( )(1 )( )ij j j j iv w z z x
WhereWhere is a fixed leaning rate is a fixed leaning rate
Result & RemarksResult & Remarks
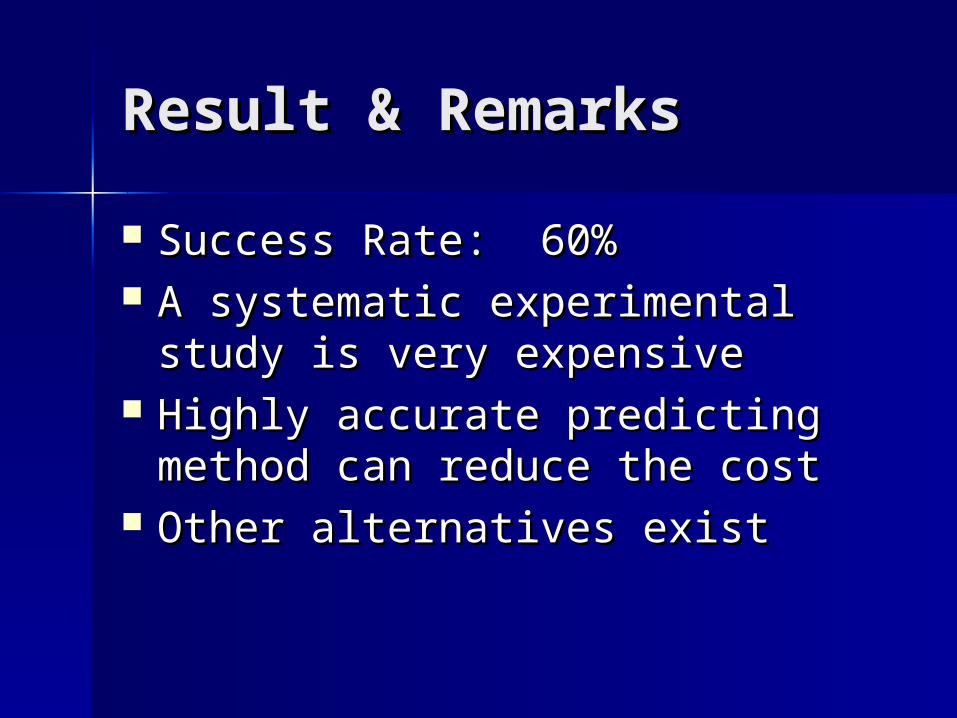
Success Rate: 60%Success Rate: 60% A systematic experimental study A systematic experimental study
is very expensiveis very expensive Highly accurate predicting Highly accurate predicting
method can reduce the costmethod can reduce the cost Other alternatives existOther alternatives exist

Datamining: Discovering Information
A Clinical Records
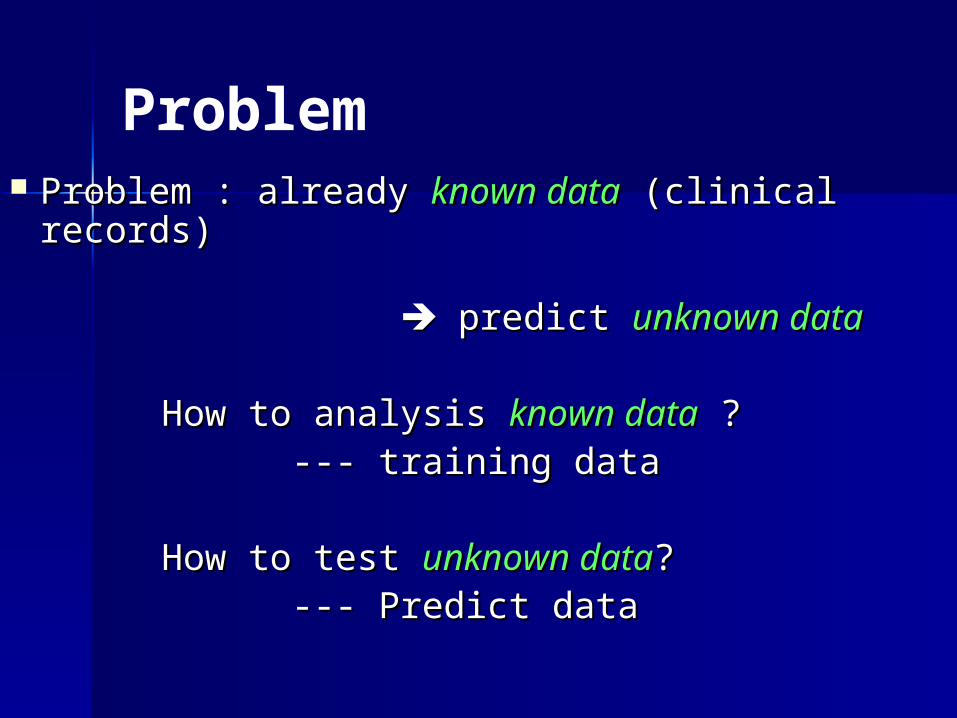
Problem Problem : already Problem : already known dataknown data (clinical records) (clinical records)
predict predict unknown dataunknown data How to analysis How to analysis known dataknown data ? ? --- training data--- training data
How to test How to test unknown dataunknown data?? --- Predict data--- Predict data

The data has many attributes.The data has many attributes.
Ex: Having 2300 combinations of Ex: Having 2300 combinations of
attributes with 8 attributes for attributes with 8 attributes for oneone
class.class.
It is impossible to calculate all It is impossible to calculate all manually manually
Problem
Problem
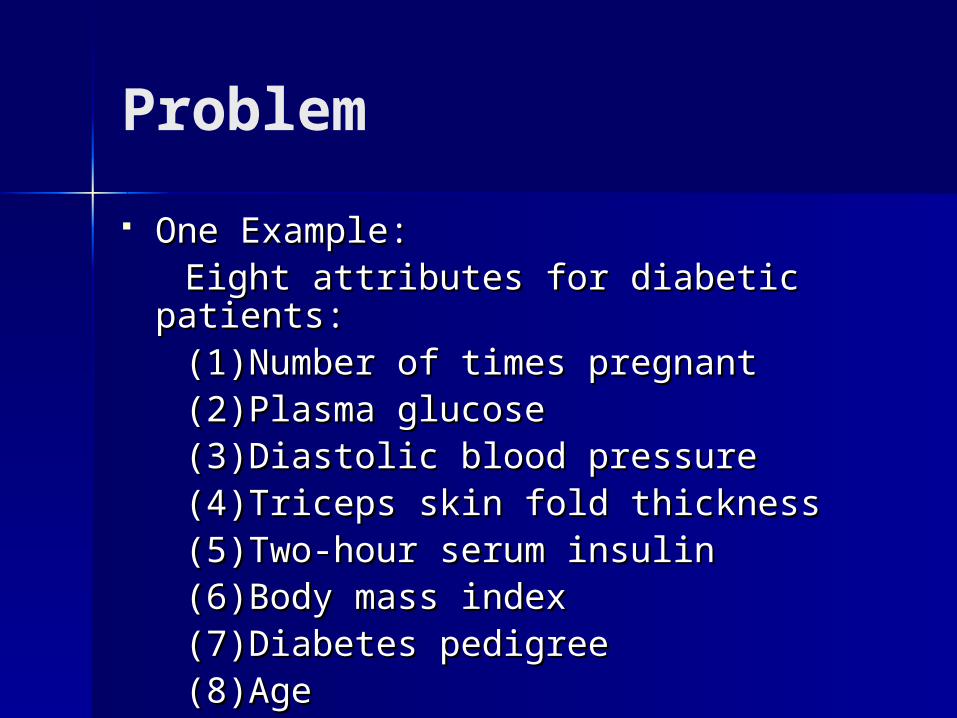
One Example:One Example: Eight attributes for diabetic patients:Eight attributes for diabetic patients: (1)Number of times pregnant(1)Number of times pregnant (2)Plasma glucose(2)Plasma glucose (3)Diastolic blood pressure(3)Diastolic blood pressure (4)Triceps skin fold thickness(4)Triceps skin fold thickness (5)Two-hour serum insulin(5)Two-hour serum insulin (6)Body mass index(6)Body mass index (7)Diabetes pedigree(7)Diabetes pedigree (8)Age(8)Age
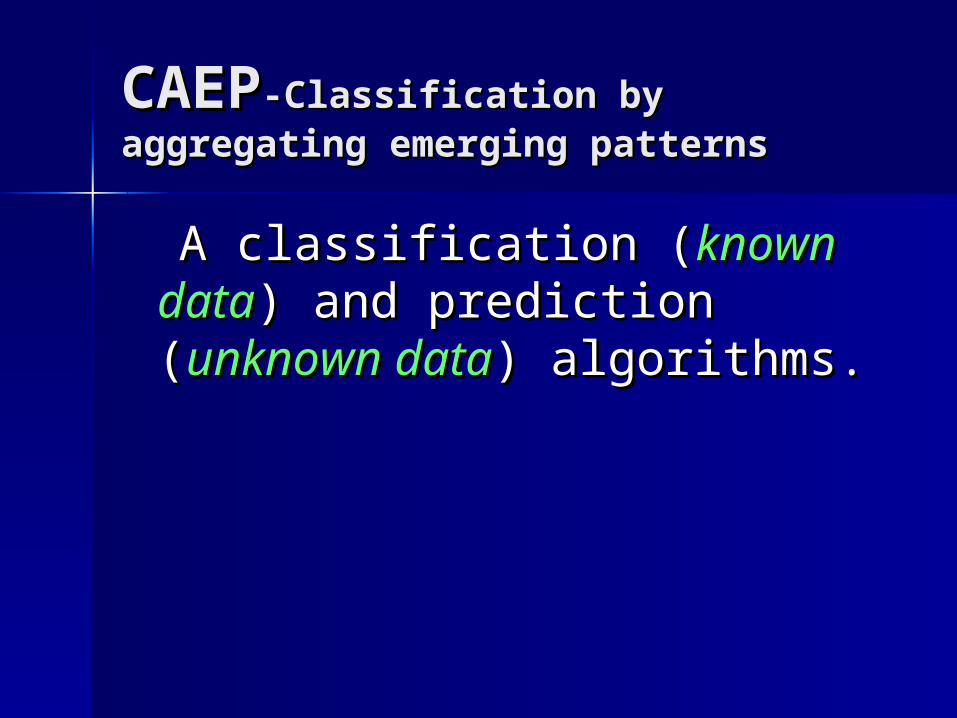
CAEPCAEP-Classification by -Classification by aggregating emerging patternsaggregating emerging patterns
A classification (A classification (known dataknown data) ) and prediction (and prediction (unknown unknown datadata) algorithms. ) algorithms.
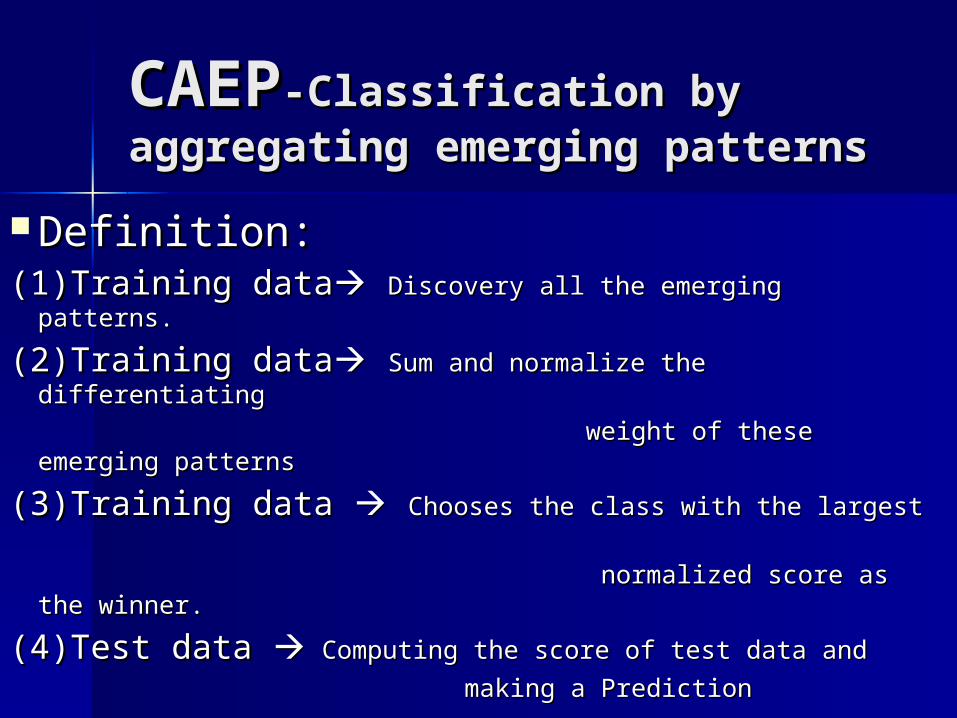
CAEPCAEP-Classification by -Classification by aggregating emerging aggregating emerging patternspatterns
Definition:Definition:(1)Training data(1)Training data Discovery all the emerging patterns.Discovery all the emerging patterns.
(2)Training data(2)Training data Sum and normalize the differentiating Sum and normalize the differentiating
weight of these emerging patterns weight of these emerging patterns
(3)Training data (3)Training data Chooses the class with the largest Chooses the class with the largest
normalized score as the winner.normalized score as the winner.
(4)Test data (4)Test data Computing the score of test data and Computing the score of test data and
making a Prediction making a Prediction
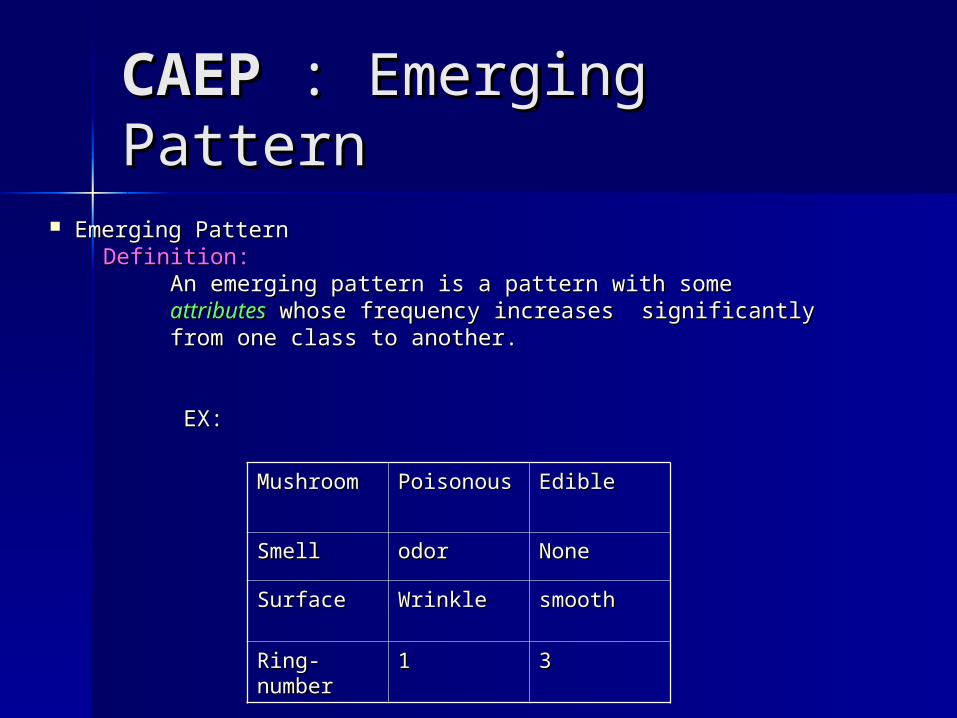
CAEP CAEP : Emerging Pattern: Emerging Pattern
Emerging PatternEmerging Pattern Definition:Definition: An emerging pattern is a pattern with some An emerging pattern is a pattern with some attributesattributes whose frequency increases significantly whose frequency increases significantly from one class to another.from one class to another.
EX:EX:
MushroomMushroom Poisonous Poisonous EdibleEdible
SmellSmell odorodor NoneNone
SurfaceSurface Wrinkle Wrinkle smoothsmooth
Ring-Ring-numbernumber
11 33

CAEP CAEP : Classification: Classification
Classification: Classification: Definition:Definition:
(1) Discover the (1) Discover the factorsfactors that differentiate the two groups that differentiate the two groups
(2) Find a way to use these factors to predict to Which (2) Find a way to use these factors to predict to Which group a group a
new patient should belong. new patient should belong.
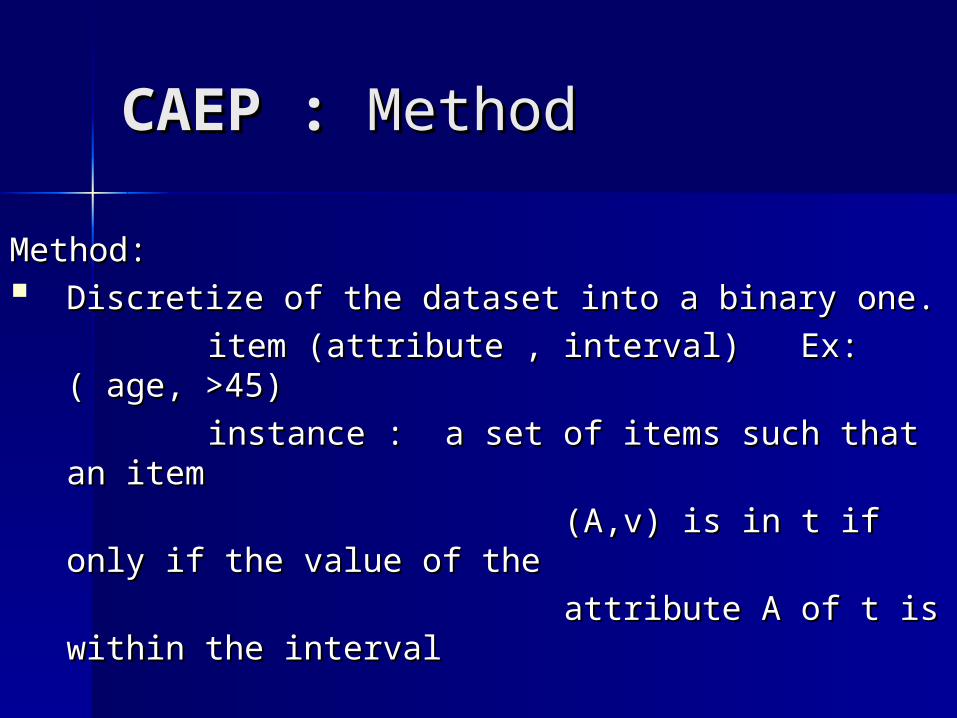
CAEP : CAEP : MethodMethod
Method:Method: Discretize of the dataset into a binary one. Discretize of the dataset into a binary one.
item (attribute , interval) Ex:( age, >45)item (attribute , interval) Ex:( age, >45)
instance : a set of items such that an item instance : a set of items such that an item
(A,v) is in t if only if the value of (A,v) is in t if only if the value of the the
attribute A of t is within the attribute A of t is within the intervalinterval
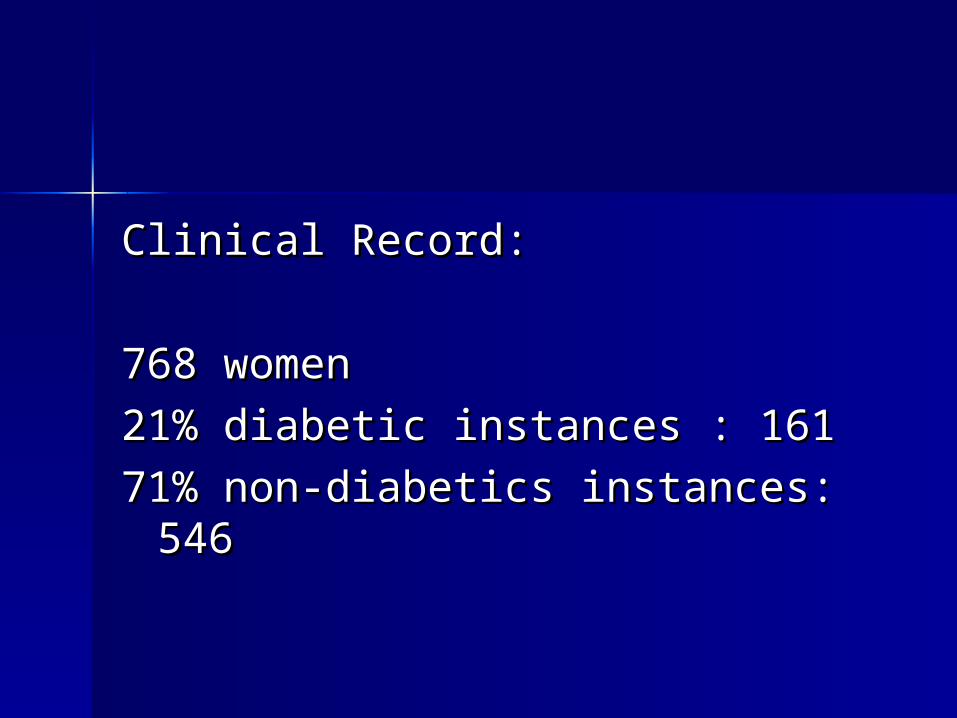
Clinical Record:Clinical Record:
768 women768 women
21% diabetic instances : 16121% diabetic instances : 161
71% non-diabetics instances: 54671% non-diabetics instances: 546

CAEP: CAEP: SupportSupportSupport of X Support of X (attribute)(attribute) DefinitionDefinition: the : the ratioratio of number of items has this attribute of number of items has this attribute
over the number of total items in this class.over the number of total items in this class.
Formula: suppFormula: suppDD(x)=(x)=
Meaning: If supp(x) is high which means attribute xMeaning: If supp(x) is high which means attribute x
exist in many items in this class.exist in many items in this class.
Example : How many people in diabetic class are Example : How many people in diabetic class are
older than 60? (attribute : >60) older than 60? (attribute : >60)
148/161 =91%148/161 =91%
||
|}|{|
D
tXDt
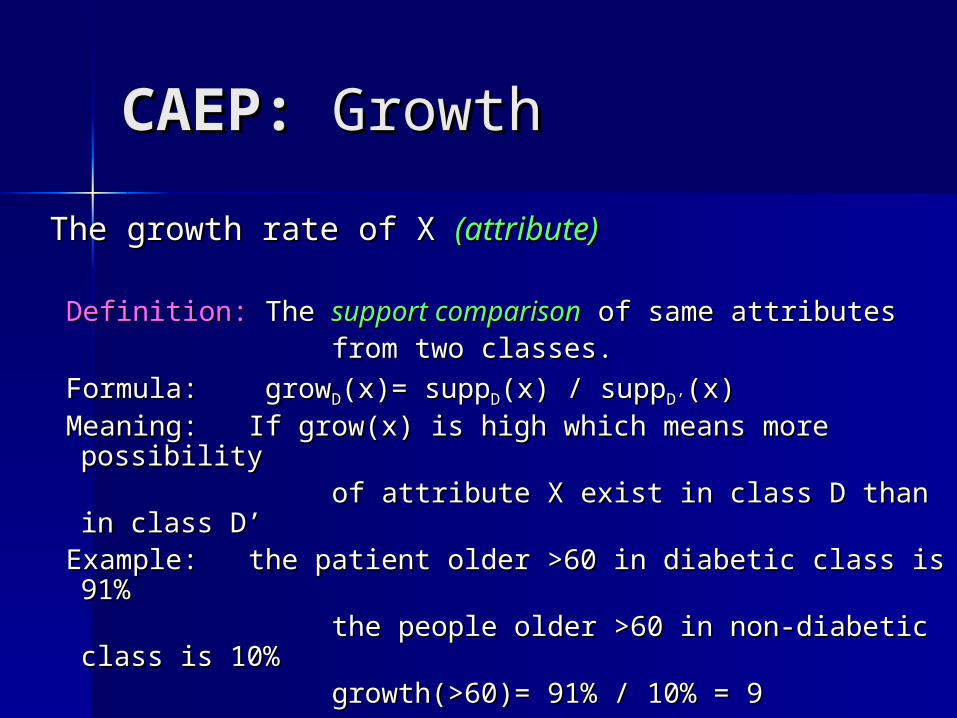
CAEP: CAEP: GrowthGrowth
The growth rate of X The growth rate of X (attribute)(attribute)
Definition: Definition: The The support comparisonsupport comparison of same attributes of same attributes from two classes. from two classes.
Formula: growFormula: growDD(x)= supp(x)= suppDD(x) / supp(x) / suppD’D’(x)(x) Meaning: If grow(x) is high which means more Meaning: If grow(x) is high which means more
possibility possibility of attribute X exist in class D than in class D’of attribute X exist in class D than in class D’ Example: the patient older >60 in diabetic class is 91% Example: the patient older >60 in diabetic class is 91% the people older >60 in non-diabetic class is the people older >60 in non-diabetic class is
10%10% growth(>60)= 91% / 10% = 9 growth(>60)= 91% / 10% = 9
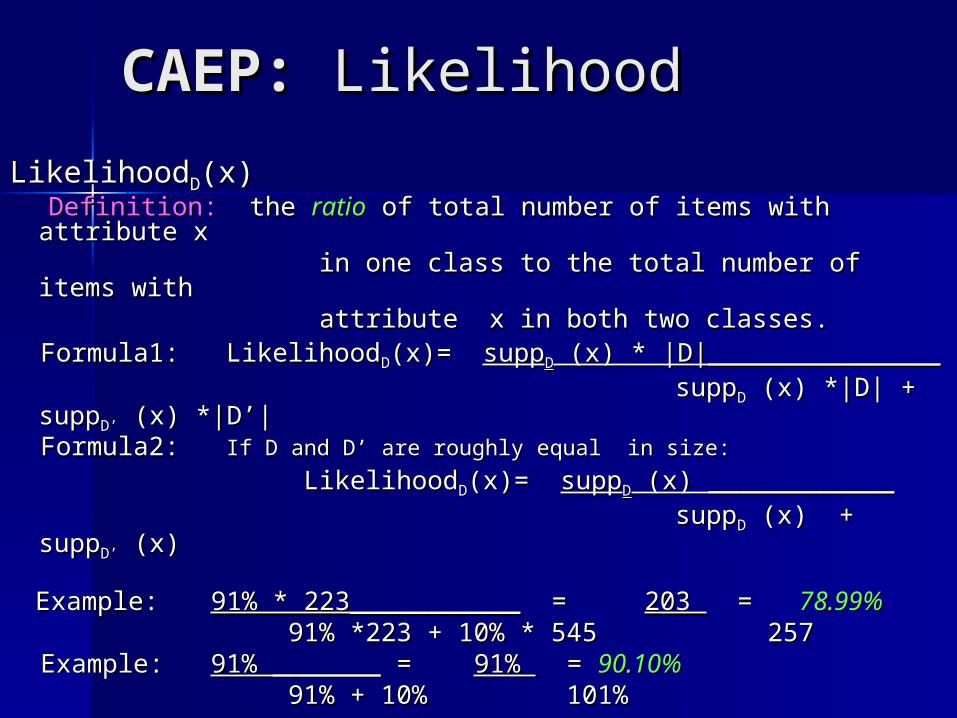
CAEP: CAEP: LikelihoodLikelihood
LikelihoodLikelihoodDD(x)(x) Definition: Definition: the the ratioratio of total number of items with attribute of total number of items with attribute
x x in one class to the total number of items with in one class to the total number of items with attribute x in both two classes. attribute x in both two classes. Formula1: LikelihoodFormula1: LikelihoodDD(x)= (x)= suppsuppDD (x) * |D|_______________ (x) * |D|_______________ suppsuppDD (x) *|D| + supp (x) *|D| + suppD’D’ (x) *|D’| (x) *|D’| Formula2: Formula2: If D and D’ are roughly equal in size:If D and D’ are roughly equal in size:
LikelihoodLikelihoodDD(x)= (x)= suppsuppDD (x) ____________ (x) ____________ suppsuppDD (x) + supp (x) + suppD’D’ (x) (x)
Example:Example: 91% * 223___________91% * 223___________ = = 203 203 = = 78.99%78.99% 91% *223 + 10% * 545 25791% *223 + 10% * 545 257 Example: Example: 91% _______91% _______ = = 91% 91% = = 90.10%90.10% 91% + 10% 101%91% + 10% 101%
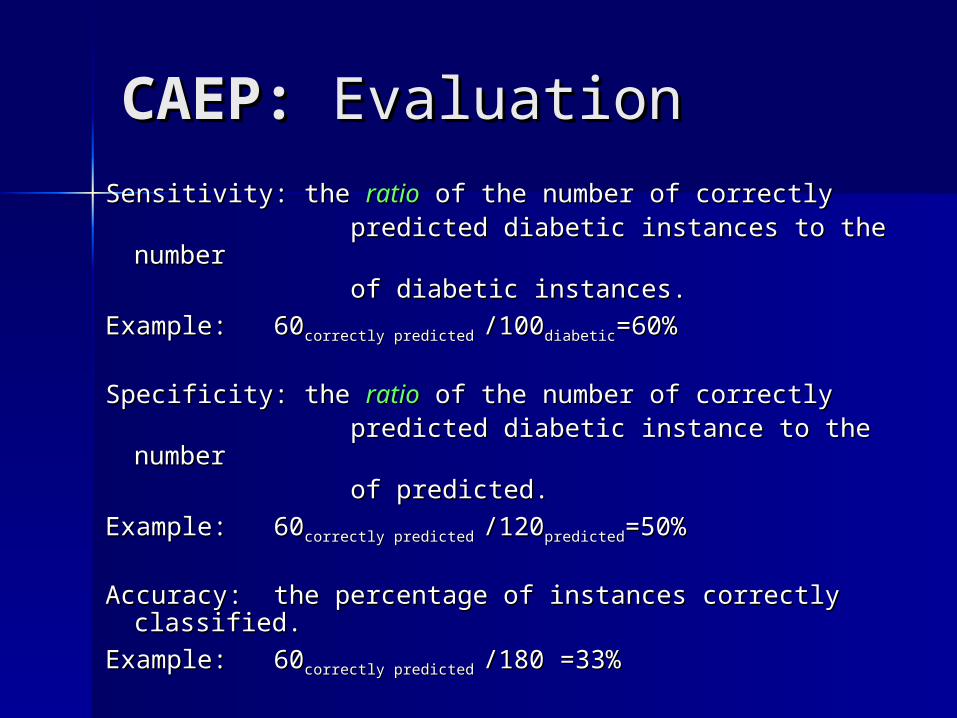
CAEP: CAEP: Evaluation Evaluation
Sensitivity: the Sensitivity: the ratioratio of the number of correctly of the number of correctly predicted diabetic instances to the number predicted diabetic instances to the number of diabetic instances. of diabetic instances.
Example: 60Example: 60correctly predicted correctly predicted /100/100diabeticdiabetic=60%=60%
Specificity: the Specificity: the ratioratio of the number of correctly of the number of correctly predicted diabetic instance to the number predicted diabetic instance to the number of predicted.of predicted.
Example: 60Example: 60correctly predicted correctly predicted /120/120predictedpredicted=50% =50%
Accuracy: the percentage of instances correctly Accuracy: the percentage of instances correctly classified. classified.
Example: 60Example: 60correctly predicted correctly predicted /180 =33%/180 =33%
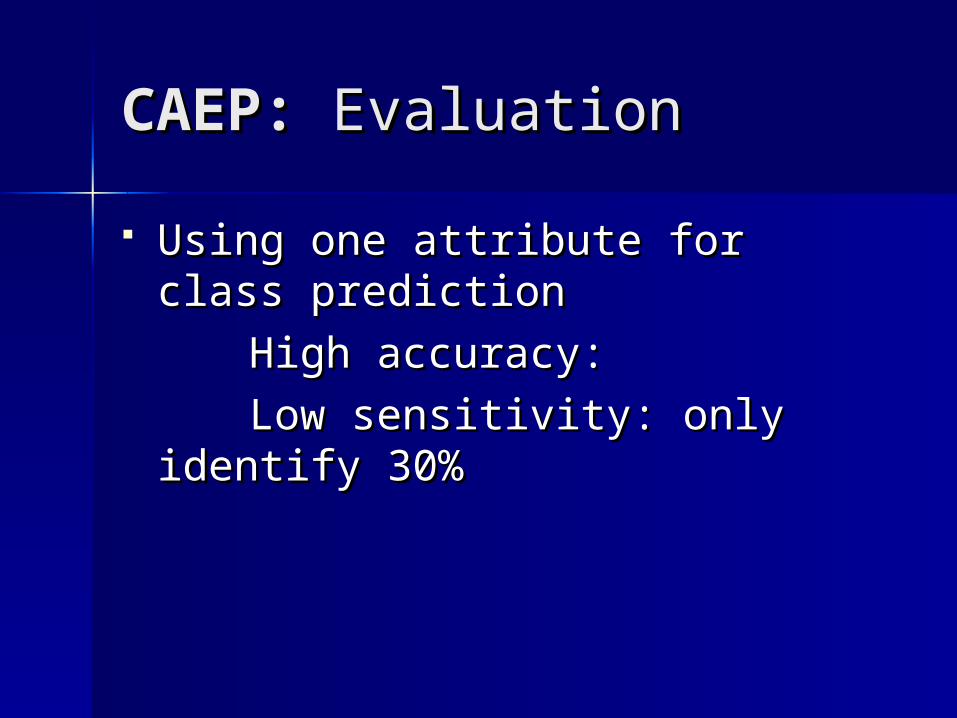
CAEP: CAEP: EvaluationEvaluation
Using one attribute for class Using one attribute for class predictionprediction
High accuracy: High accuracy:
Low sensitivity: only identify Low sensitivity: only identify 30% 30%
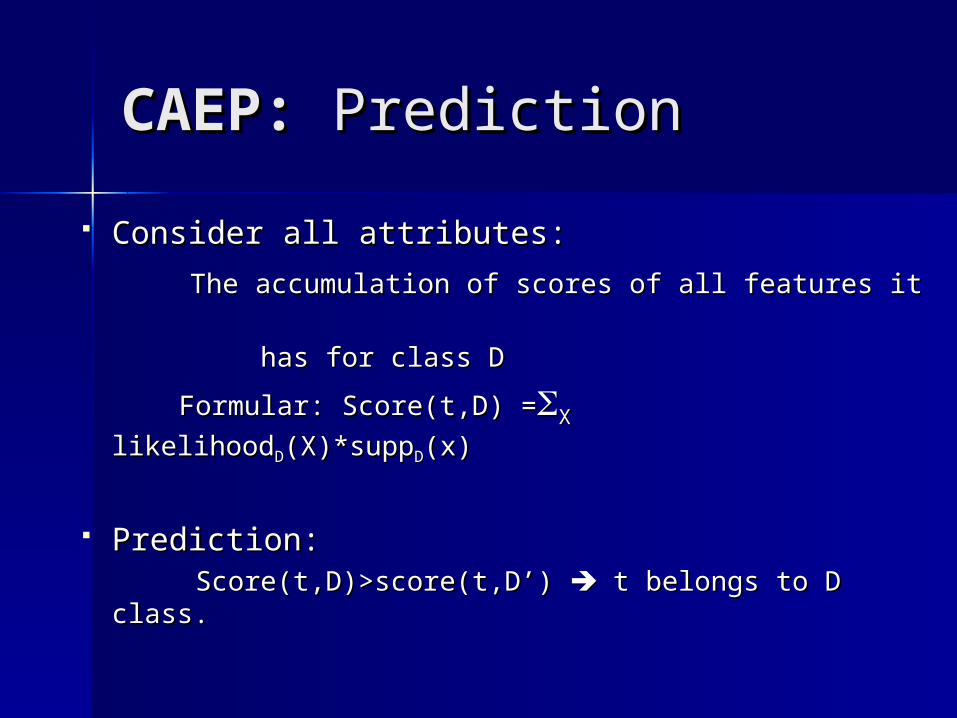
CAEP: CAEP: PredictionPrediction
Consider all attributes:Consider all attributes:
The accumulation of scores of all features it The accumulation of scores of all features it
has for class Dhas for class D
Formular: Score(t,D) =Formular: Score(t,D) =XX
likelihoodlikelihoodDD(X)*supp(X)*suppDD(x)(x)
Prediction:Prediction: Score(t,D)>score(t,D’) Score(t,D)>score(t,D’) t belongs to D class. t belongs to D class.
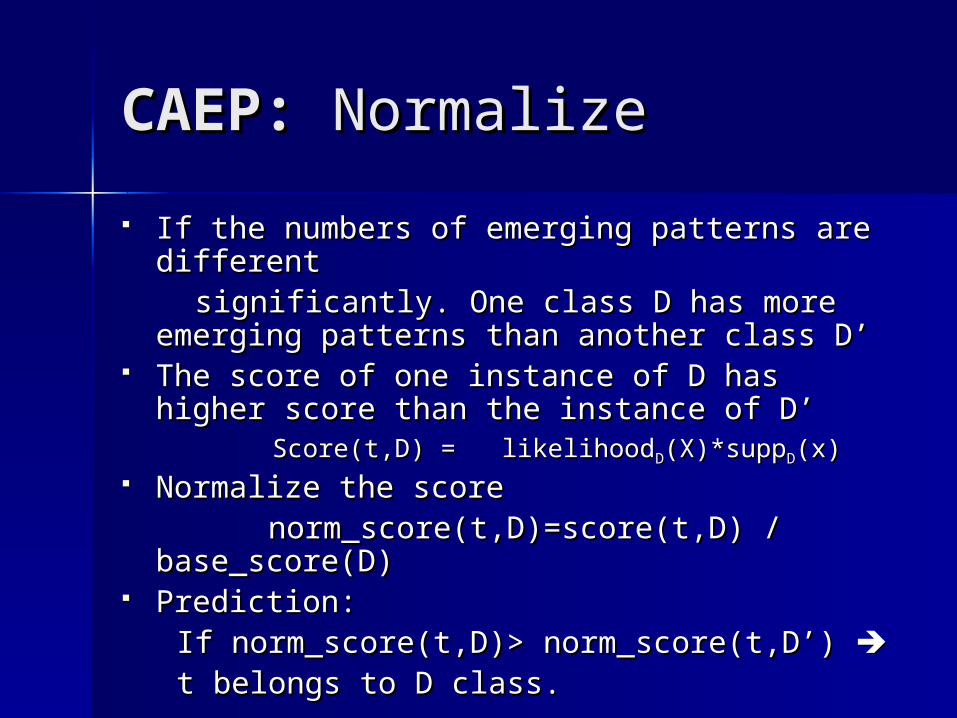
CAEP: CAEP: NormalizeNormalize
If the numbers of emerging patterns are If the numbers of emerging patterns are different different
significantly. One class D has more emerging significantly. One class D has more emerging patterns than another class D’patterns than another class D’
The score of one instance of D has higher The score of one instance of D has higher score than the instance of D’ score than the instance of D’
Score(t,D) = likelihoodScore(t,D) = likelihoodDD(X)*supp(X)*suppDD(x)(x) Normalize the scoreNormalize the score norm_score(t,D)=score(t,D) / norm_score(t,D)=score(t,D) /
base_score(D)base_score(D) Prediction:Prediction: If norm_score(t,D)> norm_score(t,D’) If norm_score(t,D)> norm_score(t,D’) t belongs to D class.t belongs to D class.
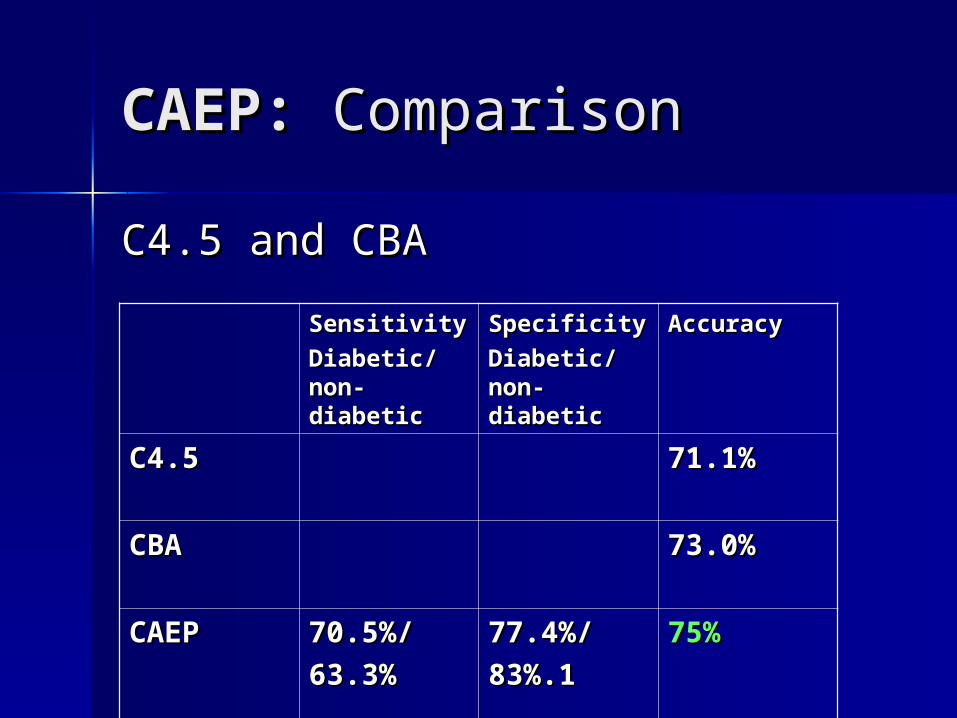
CAEP: CAEP: Comparison Comparison
C4.5 and CBA C4.5 and CBA
SensitivitySensitivity
Diabetic/Diabetic/non-non-diabeticdiabetic
SpecificitySpecificity
Diabetic/Diabetic/non-non-diabeticdiabetic
Accuracy Accuracy
C4.5C4.5 71.1%71.1%
CBACBA 73.0%73.0%
CAEPCAEP 70.5%/70.5%/
63.3%63.3%77.4%/77.4%/
83%.183%.175%75%
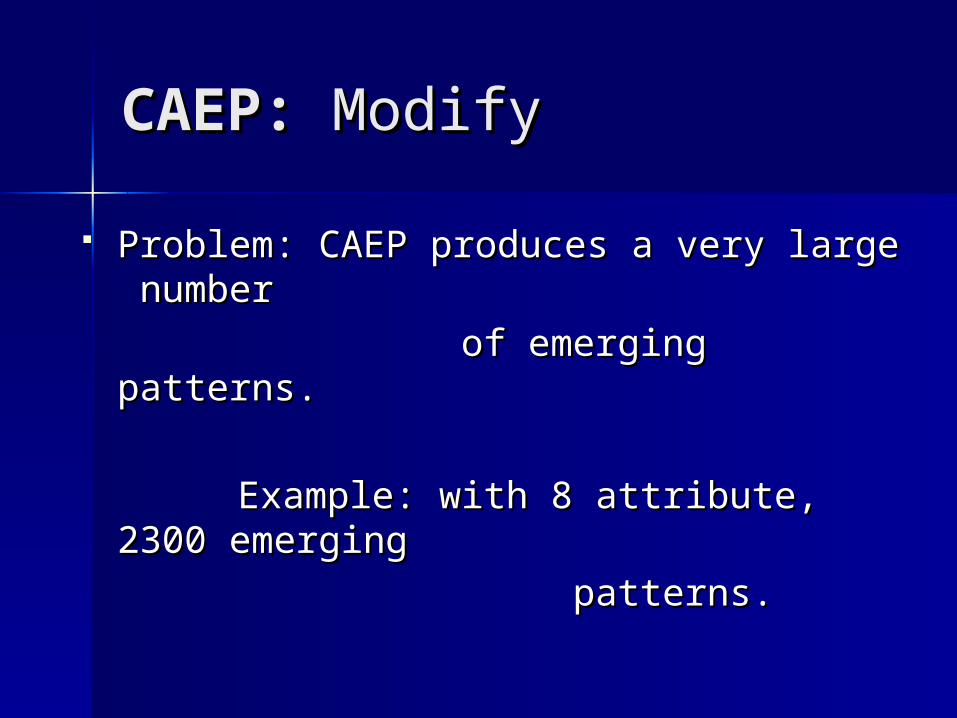
CAEP: CAEP: ModifyModify
Problem: CAEP produces a very large Problem: CAEP produces a very large number number
of emerging patterns.of emerging patterns.
Example: with 8 attribute, 2300 Example: with 8 attribute, 2300 emerging emerging
patterns.patterns.
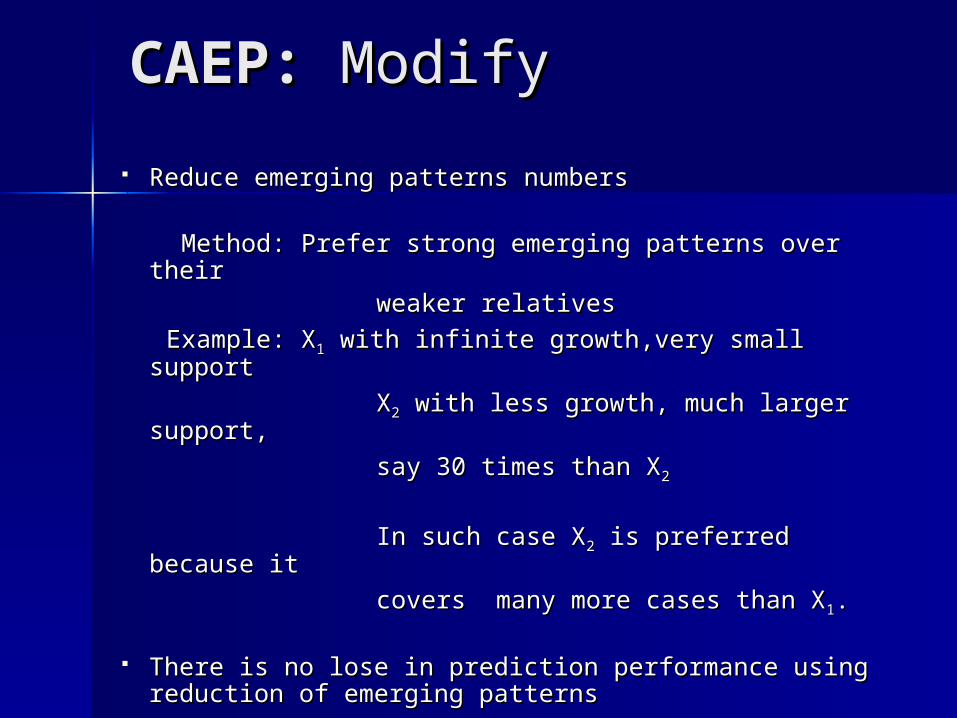
CAEP: CAEP: ModifyModify
Reduce emerging patterns numbersReduce emerging patterns numbers
Method: Prefer strong emerging patterns over their Method: Prefer strong emerging patterns over their weaker relatives weaker relatives
Example: XExample: X11 with infinite growth,very small support with infinite growth,very small support
XX22 with less growth, much larger support, with less growth, much larger support,
say 30 times than Xsay 30 times than X22
In such case XIn such case X22 is preferred because it is preferred because it
covers many more cases than Xcovers many more cases than X11..
There is no lose in prediction performance using There is no lose in prediction performance using reduction of emerging patternsreduction of emerging patterns
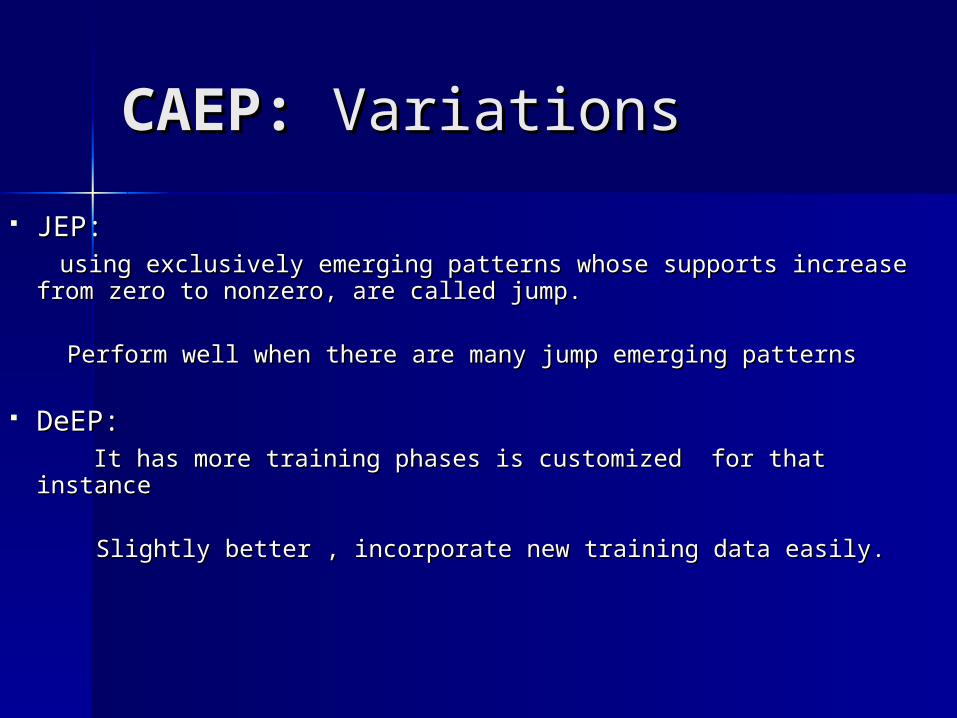
CAEP: CAEP: Variations Variations
JEP:JEP: using exclusively emerging patterns whose supports increase from using exclusively emerging patterns whose supports increase from
zero to nonzero, are called jump.zero to nonzero, are called jump.
Perform well when there are many jump emerging patternsPerform well when there are many jump emerging patterns
DeEP:DeEP: It has more training phases is customized for that instanceIt has more training phases is customized for that instance
Slightly better , incorporate new training data easily.Slightly better , incorporate new training data easily.

Relevance analysisRelevance analysis
Datamining algorithms are in general Datamining algorithms are in general exponential in complexity exponential in complexity
Relevance analysis :Relevance analysis :
exclude the attributes that do not exclude the attributes that do not contribute to the classification processcontribute to the classification process
Deal with much higher dimension Deal with much higher dimension datasetsdatasets
Not always useful for lower ranking Not always useful for lower ranking dimensions.dimensions.
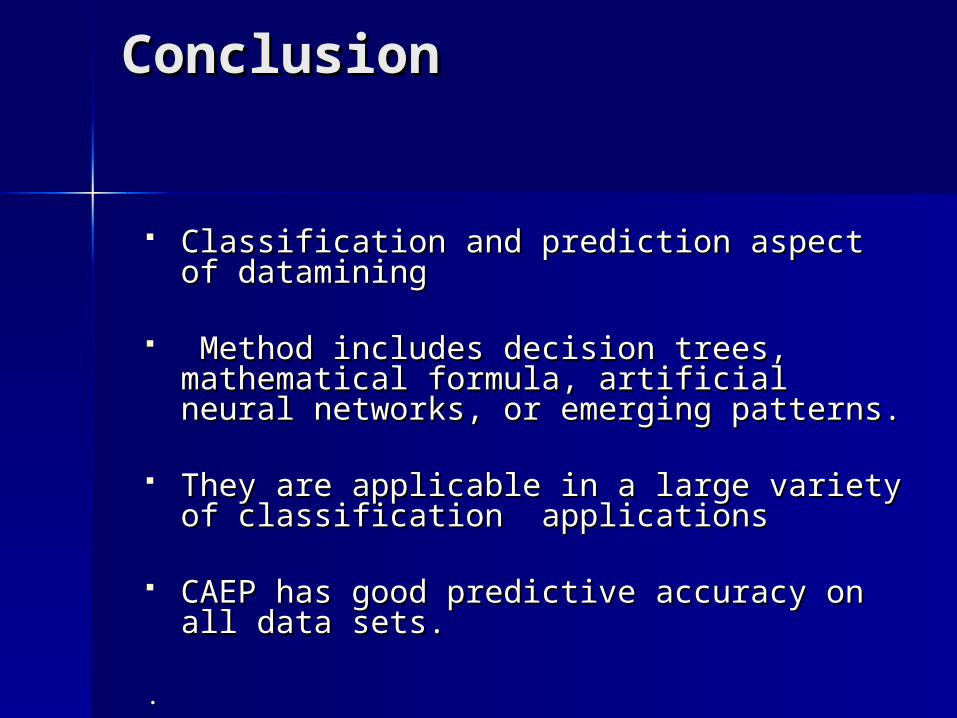
ConclusionConclusion
Classification and prediction aspect of Classification and prediction aspect of datamining datamining
Method includes decision trees, Method includes decision trees, mathematical formula, artificial neural mathematical formula, artificial neural networks, or emerging patterns.networks, or emerging patterns.
They are applicable in a large variety of They are applicable in a large variety of classification applicationsclassification applications
CAEP has good predictive accuracy on all CAEP has good predictive accuracy on all data sets.data sets.
..