Embed Size (px)
Citation preview

Data Mining Essentials
Social Media Mining

2Social Media Mining
Measures and Metrics 2Social Media Mining
Data Mining Essentials
Introduction
• Data production rate has been increased dramatically (Big Data) and we are able store much more data than before– E.g., purchase data, social media data, mobile
phone data
• Businesses and customers need useful or actionable knowledge and gain insight from raw data for various purposes– It’s not just searching data or databases
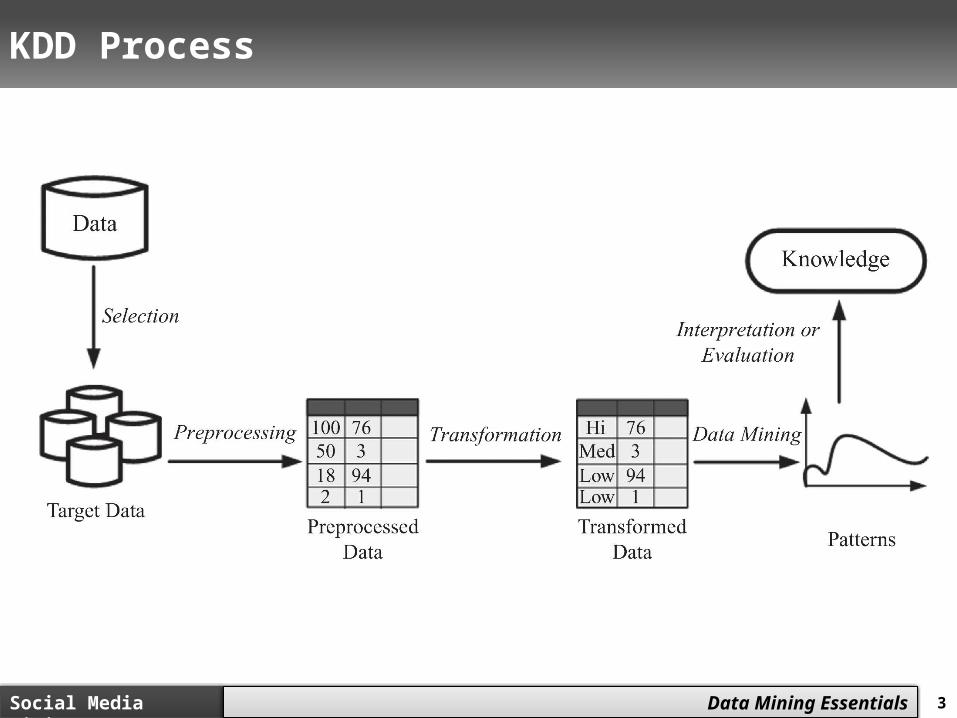
The process of extracting useful patterns from raw data is known as Knowledge Discovery in Databases (KDD).
3Social Media Mining
Measures and Metrics 3Social Media Mining
Data Mining Essentials
KDD Process

4Social Media Mining
Measures and Metrics 4Social Media Mining
Data Mining Essentials
Data Mining
• Extracting or “mining” knowledge from large amounts of data, or big data
• Data-driven discovery and modeling of hidden patterns in big data
• Extracting implicit, previously unknown, unexpected, and potentially useful information/knowledge from data
The process of discovering hidden patterns in large data sets
It utilizes methods at the intersection of artificial intelligence, machine learning, statistics, and database systems

5Social Media Mining
Measures and Metrics 5Social Media Mining
Data Mining Essentials
Data

6Social Media Mining
Measures and Metrics 6Social Media Mining
Data Mining Essentials
Data Instances
• In the KDD process, data is represented in a tabular format
• A collection of properties and features related to an object or person– A patient’s medical record– A user’s profile– A gene’s information
• Instances are also called points, data points, or observations
Data Instance:
Features ( Attributes or measurements)Class Label
Feature Value Class Attribute

7Social Media Mining
Measures and Metrics 7Social Media Mining
Data Mining Essentials
Data Instances
• Predicting whether an individual who visits an online book seller is going to buy a specific book
• Continues feature: values are numeric values– Money spent: $25
• Discrete feature: Can take a number of values – Money spent: {high, normal, low}
LabeledExample
UnlabeledExample

8Social Media Mining
Measures and Metrics 8Social Media Mining
Data Mining Essentials
Data Types + Permissible Operations (statistics)
• Nominal (categorical)– Operations: Mode (most common feature value), Equality
Comparison– E.g., {male, female}
• Ordinal– Feature values have an intrinsic order to them, but the
difference is not defined– Operations: same as nominal, feature value rank– E.g., {Low, medium, high}
• Interval– Operations: Addition and subtractions are allowed
whereas divisions and multiplications are not– E.g., 3:08 PM, calendar dates
• Ratio– Operations: divisions and multiplications are are allowed – E.g., Height, weight, money quantities

9Social Media Mining
Measures and Metrics 9Social Media Mining
Data Mining Essentials
Sample Datasetoutlook temperature humidity windy play
sunny 85 85 FALSE nosunny 80 90 TRUE no
overcast 83 86 FALSE yesrainy 70 96 FALSE yesrainy 68 80 FALSE yesrainy 65 70 TRUE no
overcast 64 65 TRUE yessunny 72 95 FALSE nosunny 69 70 FALSE yesrainy 75 80 FALSE yessunny 75 70 TRUE yes
overcast 72 90 TRUE yesovercast 81 75 FALSE yes
rainy 71 91 TRUE no
Nominal OrdinalInterval Ratio

10Social Media Mining
Measures and Metrics 10Social Media Mining
Data Mining Essentials
Text Representation
• The most common way to model documents is to transform them into sparse numeric vectors and then deal with them with linear algebraic operations
• This representation is called “Bag of Words”
• Methods:– Vector space model– TF-IDF

11Social Media Mining
Measures and Metrics 11Social Media Mining
Data Mining Essentials
Vector Space Model
• In the vector space model, we start with a set of documents, D
• Each document is a set of words• The goal is to convert these textual
documents to vectors
• di : document i, wj,i : the weight for word j in document i
we can set it to 1 when the word j exists in document i and 0 when it does not. We can also set this weight to the number of times the word j is observed in document i

12Social Media Mining
Measures and Metrics 12Social Media Mining
Data Mining Essentials
Vector Space Model: An Example
• Documents:– d1: data mining and social media mining– d2: social network analysis– d3: data mining
• Reference vector:– (social, media, mining, network, analysis,
data)
• Vector representation:
analysi
s data media
mining
networksocial
d1 0 1 1 1 0 1d2 1 0 0 0 1 1d3 0 1 0 1 0 0

13Social Media Mining
Measures and Metrics 13Social Media Mining
Data Mining Essentials
TF-IDF (Term Frequency-Inverse Document Frequency)
tf-idf of term t, document d, and document corpus D is calculated as follows:
is the frequency of word j in document i
The total number of documents in the corpus
The number of documents where the term j appears

14Social Media Mining
Measures and Metrics 14Social Media Mining
Data Mining Essentials
TF-IDF: An Example
Consider the words “apple” and “orange” that appear 10 and 20 times in document 1 (d1), which contains 100 words. Let |D| = 20 and assume the word “apple” only appears in document d1 and the word “orange” appears in all 20 documents

15Social Media Mining
Measures and Metrics 15Social Media Mining
Data Mining Essentials
TF-IDF : An Example
• Documents:– d1: social media mining– d2: social media data– d3: financial market data
• TF values:
• TFIDF

16Social Media Mining
Measures and Metrics 16Social Media Mining
Data Mining Essentials
Data Quality
When making data ready for data mining algorithms, data quality need to be assured• Noise
– Noise is the distortion of the data
• Outliers– Outliers are data points that are considerably different
from other data points in the dataset
• Missing Values– Missing feature values in data instances– To solve this problem: 1) remove instances that have
missing values 2) estimate missing values, and 3) ignore missing values when running data mining algorithm
• Duplicate data

17Social Media Mining
Measures and Metrics 17Social Media Mining
Data Mining Essentials
Data Preprocessing
• Aggregation– It is performed when multiple features need to be combined into a
single one or when the scale of the features change– Example: image width , image height -> image area (width x height)
• Discretization– From continues values to discrete values– Example: money spent -> {low, normal, high}
• Feature Selection– Choose relevant features
• Feature Extraction– Creating new features from original features– Often, more complicated than aggregation
• Sampling– Random Sampling– Sampling with or without replacement– Stratified Sampling: useful when having class imbalance– Social Network Sampling

18Social Media Mining
Measures and Metrics 18Social Media Mining
Data Mining Essentials
Data Preprocessing
• Sampling social networks:• starting with a small set of nodes (seed
nodes) and sample– (a) the connected components they belong to;– (b) the set of nodes (and edges) connected to
them directly; or– (c) the set of nodes and edges that are within
n-hop distance from them.

19Social Media Mining
Measures and Metrics 19Social Media Mining
Data Mining Essentials
Data Mining Algorithms
• Supervised Learning Algorithm– Classification (class attribute is discrete)
• Assign data into predefined classes– Spam Detection, fraudulent credit card detection
– Regression (class attribute takes real values)• Predict a real value for a given data instance
– Predict the price for a given house
• Unsupervised Learning Algorithm– Group similar items together into some
clusters• Detect communities in a given social network

20Social Media Mining
Measures and Metrics 20Social Media Mining
Data Mining Essentials
Supervised Learning

21Social Media Mining
Measures and Metrics 21Social Media Mining
Data Mining Essentials
Classification Example
Learning patterns from labeled data and classify new data with labels (categories)– For example, we want to classify an e-mail as
"legitimate" or "spam"

22Social Media Mining
Measures and Metrics 22Social Media Mining
Data Mining Essentials
Supervised Learning: The Process
• We are given a set of labeled examples• These examples are records/instances in the format
(x, y) where x is a vector and y is the class attribute, commonly a scalar
• The supervised learning task is to build model that maps x to y (find a mapping m such that m(x) = y)
• Given an unlabeled instances (x’,?), we compute m(x’)– E.g., spam/non-spam prediction

23Social Media Mining
Measures and Metrics 23Social Media Mining
Data Mining Essentials
A Twitter Example

24Social Media Mining
Measures and Metrics 24Social Media Mining
Data Mining Essentials
Supervised Learning Algorithm
• Classification
– Decision tree learning
– Naive Bayes Classifier
– K-nearest neighbor classifier
– Classification with Network information
• Regression
– Linear Regression
– Logistic Regression

25Social Media Mining
Measures and Metrics 25Social Media Mining
Data Mining Essentials
Decision Tree
• A decision tree is learned from the dataset (training data with known classes) and later applied to predict the class attribute value of new data (test data with unknown classes) where only the feature values are known

26Social Media Mining
Measures and Metrics 26Social Media Mining
Data Mining Essentials
Decision Tree: Example
Learned Decision Tree 1 Learned Decision Tree 2
Class Labels

27Social Media Mining
Measures and Metrics 27Social Media Mining
Data Mining Essentials
Decision Tree Construction
• Decision trees are constructed recursively from training data using a top-down greedy approach in which features are sequentially selected.
• After selecting a feature for each node, based on its values, different branches are created.
• The training set is then partitioned into subsets based on the feature values, each of which fall under the respective feature value branch; the process is continued for these subsets and other nodes
• When selecting features, we prefer features that partition the set of instances into subsets that are more pure. A pure subset has instances that all have the same class attribute value.
28Social Media Mining
Measures and Metrics 28Social Media Mining
Data Mining Essentials
Decision Tree Construction
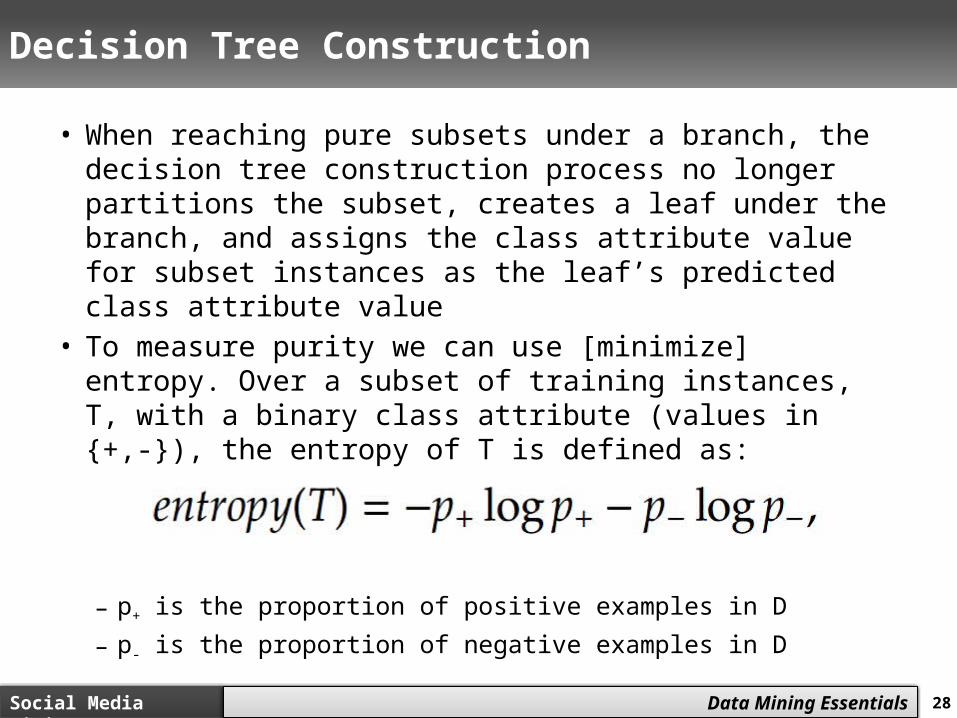
• When reaching pure subsets under a branch, the decision tree construction process no longer partitions the subset, creates a leaf under the branch, and assigns the class attribute value for subset instances as the leaf’s predicted class attribute value
• To measure purity we can use [minimize] entropy. Over a subset of training instances, T, with a binary class attribute (values in {+,-}), the entropy of T is defined as:
– p+ is the proportion of positive examples in D
– p- is the proportion of negative examples in D

29Social Media Mining
Measures and Metrics 29Social Media Mining
Data Mining Essentials
Entropy Example
Assume there is a subset T, containing 10 instances. Seven instances have a positive class attribute value and three have a negative class attribute value [7+, 3-]. The entropy measure for subset T is
In a pure subset, all instances have the same class attribute value and the entropy is 0. If the subset being measured contains an unequal number of positive and negative instances, the entropy is between 0 and 1.

30Social Media Mining
Measures and Metrics 30Social Media Mining
Data Mining Essentials
Naive Bayes Classifier
For two random variables X and Y, Bayes theorem states that,
class variable the instance features
Then class attribute value for instance X
We assume that features are independent given the class attribute

31Social Media Mining
Measures and Metrics 31Social Media Mining
Data Mining Essentials
NBC: An Example

32Social Media Mining
Measures and Metrics 32Social Media Mining
Data Mining Essentials
Nearest Neighbor Classifier
• k-nearest neighbor or kNN, as the name suggests, utilizes the neighbors of an instance to perform classification.
• In particular, it uses the k nearest instances, called neighbors, to perform classification.
• The instance being classified is assigned the label (class attribute value) that the majority of its k neighbors are assigned
• When k = 1, the closest neighbor’s label is used as the predicted label for the instance being classified
• To determine the neighbors of an instance, we need to measure its distance to all other instances based on some distance metric. Commonly, Euclidean distance is employed

33Social Media Mining
Measures and Metrics 33Social Media Mining
Data Mining Essentials
K-NN: Algorithm

34Social Media Mining
Measures and Metrics 34Social Media Mining
Data Mining Essentials
K-NN example
• When k=5, the predicted label is: triangle• When k=9, the predicted label is: square

35Social Media Mining
Measures and Metrics 35Social Media Mining
Data Mining Essentials
Classification with Network Information
• Consider a friendship network on social media and a product being marketed to this network.
• The product seller wants to know who the potential buyers are for this product.
• Assume we are given the network with the list of individuals that decided to buy or not buy the product. Our goal is to predict the decision for the undecided individuals.
• This problem can be formulated as a classification problem based on features gathered from individuals.
• However, in this case, we have additional friendship information that may be helpful in building better classification models

36Social Media Mining
Measures and Metrics 36Social Media Mining
Data Mining Essentials
• Let y_i denote the label for node i. We can assume that

37Social Media Mining
Measures and Metrics 37Social Media Mining
Data Mining Essentials
Weighted-vote Relational-Neighbor (wvRN)
• To find the label of a node, we can perform a weighted vote among its neighbors
• Note that we need to compute these probabilities using some order until convergence [i.e., they don’t change]

38Social Media Mining
Measures and Metrics 38Social Media Mining
Data Mining Essentials
wvRN example

39Social Media Mining
Measures and Metrics 39Social Media Mining
Data Mining Essentials
Regression

40Social Media Mining
Measures and Metrics 40Social Media Mining
Data Mining Essentials
Regression
• In regression, the class attribute takes real values – In classification, class values or labels are categories
y ≈ f(X)
Features (Regressors)x1, x2, …, xm
Class attribute(Dependent variable)y R
Regression finds the relation between y and the vector (x1, x2, …, xm)

41Social Media Mining
Measures and Metrics 41Social Media Mining
Data Mining Essentials
Linear Regression
In linear regression, we assume the relation between the class attribute y and feature set x to be linear
where w represents the vector of regression coefficients• The problem of regression can be solved
by estimating w and using the provided dataset and the labels y– The least squares is often used to solve the
problem

42Social Media Mining
Measures and Metrics 42Social Media Mining
Data Mining Essentials
Solving Linear Regression Problems
• The problem of regression can be solved by estimating w and using the dataset provided and the labels y– “Least squares” is a popular method to solve
regression problems
43Social Media Mining
Measures and Metrics 43Social Media Mining
Data Mining Essentials
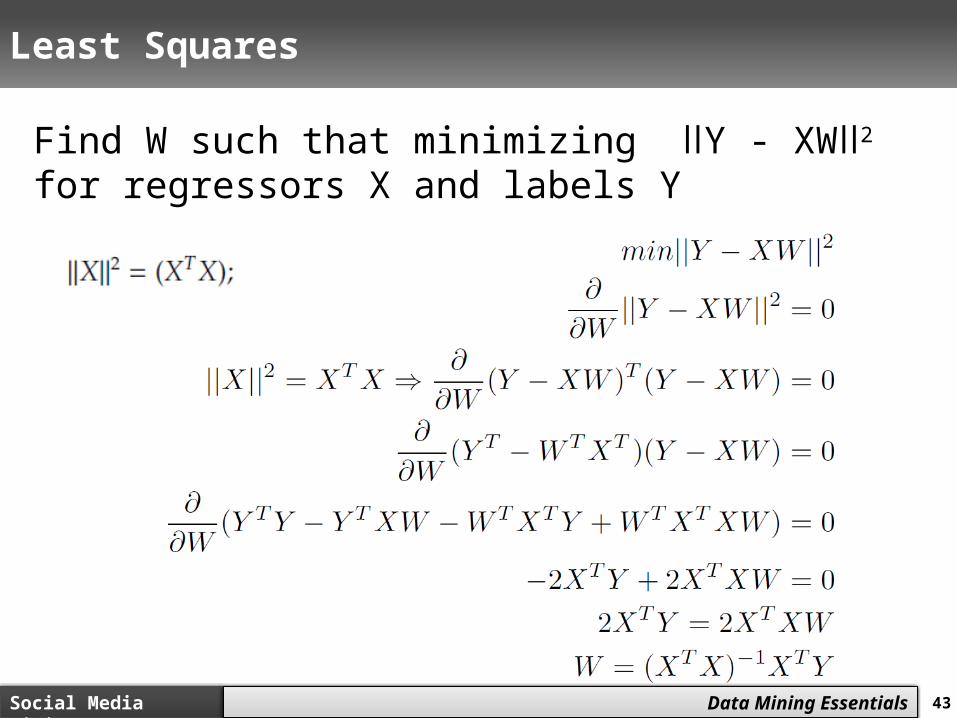
Least Squares
Find W such that minimizing ǁY - XWǁ2 for regressors X and labels Y

44Social Media Mining
Measures and Metrics 44Social Media Mining
Data Mining Essentials
Least Squares

45Social Media Mining
Measures and Metrics 45Social Media Mining
Data Mining Essentials
Evaluating Supervised Learning
• To evaluate we use a training-testing framework– A training dataset (i.e., the labels are known) is used to train a
model– the model is evaluated on a test dataset.
• Since the correct labels of the test dataset are unknown, in practice, the training set is divided into two parts, one used for training and the other used for testing.
• When testing, the labels from this test set are removed. After these labels are predicted using the model, the predicted labels are compared with the masked labels (ground truth).

46Social Media Mining
Measures and Metrics 46Social Media Mining
Data Mining Essentials
Evaluating Supervised Learning
• Dividing the training set into train/test sets– divide the training set into k equally sized
partitions, or folds, and then using all folds but one to train and the one left out for testing. This technique is called leave-one-out training.
– Divide the training set into k equally sized sets and then run the algorithm k times. In round i, we use all folds but fold i for training and fold i for testing. The average performance of the algorithm over k rounds measures the performance of the algorithm. This robust technique is known as k-fold cross validation.

47Social Media Mining
Measures and Metrics 47Social Media Mining
Data Mining Essentials
Evaluating Supervised Learning
• As the class labels are discrete, we can measure the accuracy by dividing number of correctly predicted labels (C) by the total number of instances (N)
• Accuracy = C/N
• Error rate = 1 – Accuracy
• More sophisticated approaches of evaluation will be discussed later

48Social Media Mining
Measures and Metrics 48Social Media Mining
Data Mining Essentials
Evaluating Regression Performance
• The labels cannot be predicted precisely• It is needed to set a margin to accept or
reject the predictions– For example, when the observed temperature
is 71 any prediction in the range of 71±0.5 can be considered as correct prediction

49Social Media Mining
Measures and Metrics 49Social Media Mining
Data Mining Essentials
Unsupervised Learning

50Social Media Mining
Measures and Metrics 50Social Media Mining
Data Mining Essentials
Unsupervised Learning
• Clustering is a form of unsupervised learning– The clustering algorithms do not have
examples showing how the samples should be grouped together (unlabeled data)
• Clustering algorithms group together similar items
Unsupervised division of instances into groups of similar objects

51Social Media Mining
Measures and Metrics 51Social Media Mining
Data Mining Essentials
Measuring Distance/Similarity in Clustering Algorithms
• The goal of clustering: – to group together similar items
• Instances are put into different clusters based on the distance to other instances
• Any clustering algorithm requires a distance measure
The most popular (dis)similarity measure for continuous features are Euclidean Distance and Pearson Linear Correlation

52Social Media Mining
Measures and Metrics 52Social Media Mining
Data Mining Essentials
Similarity Measures: More Definitions
Once a distance measure is selected, instances are grouped using it.

53Social Media Mining
Measures and Metrics 53Social Media Mining
Data Mining Essentials
Clustering
• Clusters are usually represented by compact and abstract notations.
• “Cluster centroids” are one common example of this abstract notation.
• Partitional Algorithms
– Partition the dataset into a set of clusters– In other words, each instance is assigned to a
cluster exactly once and no instance remains unassigned to clusters.
– k-Means

54Social Media Mining
Measures and Metrics 54Social Media Mining
Data Mining Essentials
k-means for k=6

55Social Media Mining
Measures and Metrics 55Social Media Mining
Data Mining Essentials
k-Means
The algorithm is the most commonly used clustering algorithm and is based on the idea of Expectation Maximization in statistics.

56Social Media Mining
Measures and Metrics 56Social Media Mining
Data Mining Essentials
When do we stop?
• Note that this procedure is repeated until convergence.
• The most common criterion to determine convergence is to check whether centroids are no longer changing.
• This is equivalent to clustering assignments of the data instances stabilizing.
• In practice, the algorithm execution can be stopped when the Euclidean distance between the centroids in two consecutive steps is bounded above by some small positive

57Social Media Mining
Measures and Metrics 57Social Media Mining
Data Mining Essentials
k-Means
• As an alternative, k-means implementations try to minimize an objective function. A well-known objective function in these implementations is the squared distance error:
• where is the jth instance of cluster i, n(i) is the number of instances in cluster i, and ci is the centroid of cluster i.
• The process stops when the difference between the objective function values of two consecutive iterations of the k-means algorithm is bounded by some small value .

58Social Media Mining
Measures and Metrics 58Social Media Mining
Data Mining Essentials
k-Means
• Finding the global optimum of the k partitions is computationally expensive (NP-hard).
• This is equivalent to finding the optimal centroids that minimize the objective function
• However, there are efficient heuristic algorithms that are commonly employed and converge quickly to an optimum that might not be global.– running k-means multiple times and selecting the
clustering assignment that is observed most often or is more desirable based on an objective function, such as the squared error.

59Social Media Mining
Measures and Metrics 59Social Media Mining
Data Mining Essentials
Evaluating the Clusterings
• Evaluation with ground truth• Evaluation without ground truth
When we are given objects of two different kinds, the perfect clustering would be that objects of the same type are clustered together.

60Social Media Mining
Measures and Metrics 60Social Media Mining
Data Mining Essentials
Evaluation with Ground Truth
When ground truth is available, the evaluator has prior knowledge of what a clustering should be– That is, we know the correct clustering
assignments.
• We will discuss these methods in community analysis chapter

61Social Media Mining
Measures and Metrics 61Social Media Mining
Data Mining Essentials
Evaluation without Ground Truth
• Cohesiveness– In clustering, we are interested in clusters
that exhibit cohesiveness. – In cohesive clusters, instances inside the
clusters are close to each other.
• Separateness– We are also interested in clusterings of the
data that generates clusters that are well separated from one another

62Social Media Mining
Measures and Metrics 62Social Media Mining
Data Mining Essentials
Cohesiveness
• Cohesiveness– In statistical terms, this is equivalent to having
a small standard deviation, i.e., being close to the mean value.
– In clustering, this translates to being close to the centroid of the cluster

63Social Media Mining
Measures and Metrics 63Social Media Mining
Data Mining Essentials
Separateness
• Separateness– We are also interested in clusterings of the
data that generates clusters that are well separated from one another
– In statistics, separateness can be measured by standard deviation.
– Standard deviation is maximized when instances are far from the mean.
– In clustering terms, this is equivalent to cluster centroids being far from the mean of the entire dataset

64Social Media Mining
Measures and Metrics 64Social Media Mining
Data Mining Essentials
Separateness Example
• In general we are interested in clusters that are both cohesive and separate -> Silhouette index

65Social Media Mining
Measures and Metrics 65Social Media Mining
Data Mining Essentials
Silhouette Index
• The silhouette index combines both cohesiveness and separateness.
• It compares the average distance value between instances in the same cluster and the average distance value between instances in different clusters.
• In a well-clustered dataset, the average distance between instances in the same cluster is small (cohesiveness) and the average distance between instances in different clusters is large (separateness).

66Social Media Mining
Measures and Metrics 66Social Media Mining
Data Mining Essentials
Silhouette Index
• For any instance x that is a member of cluster C
• Compute the within-cluster average distance
• Compute the average distance between x and instances in cluster G that is closest to x in terms of the average distance between x and members of G

67Social Media Mining
Measures and Metrics 67Social Media Mining
Data Mining Essentials
Silhouette Index
• Clearly we are interested in clusterings where a(x)<b(x)
• Silhouette can take values between [-1,1]• The best case happens when for all x, – a(x)=0, b(x)>a(x)

68Social Media Mining
Measures and Metrics 68Social Media Mining
Data Mining Essentials
Silhouette Index - Example