Embed Size (px)
Citation preview
DATA MINING
LECTURE 1 Introduction
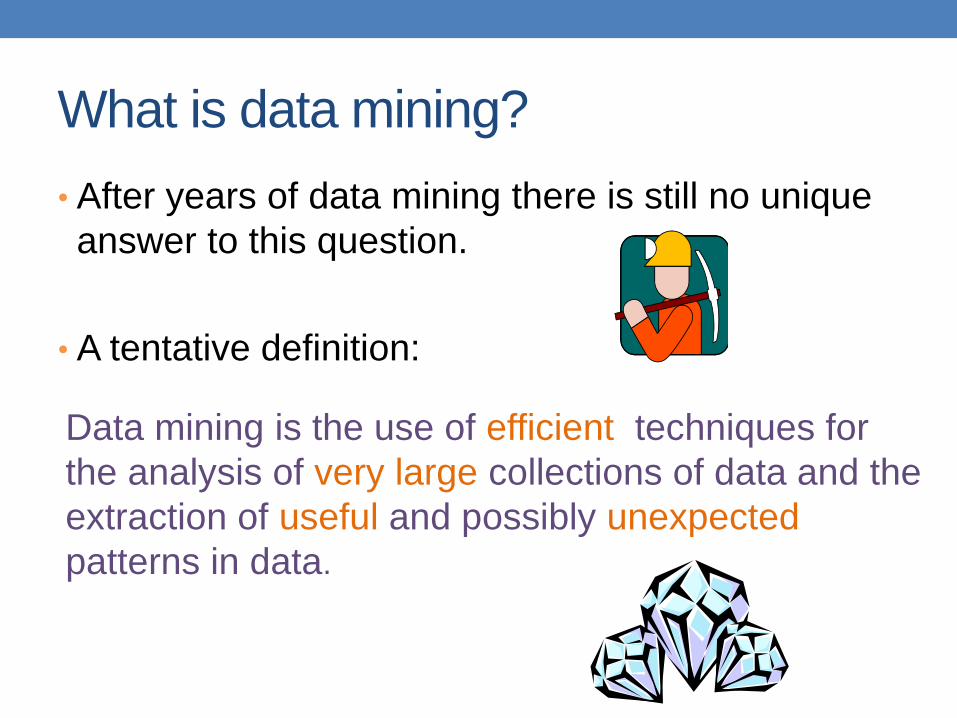
What is data mining?
• After years of data mining there is still no unique
answer to this question.
• A tentative definition:
Data mining is the use of efficient techniques for
the analysis of very large collections of data and the
extraction of useful and possibly unexpected
patterns in data.
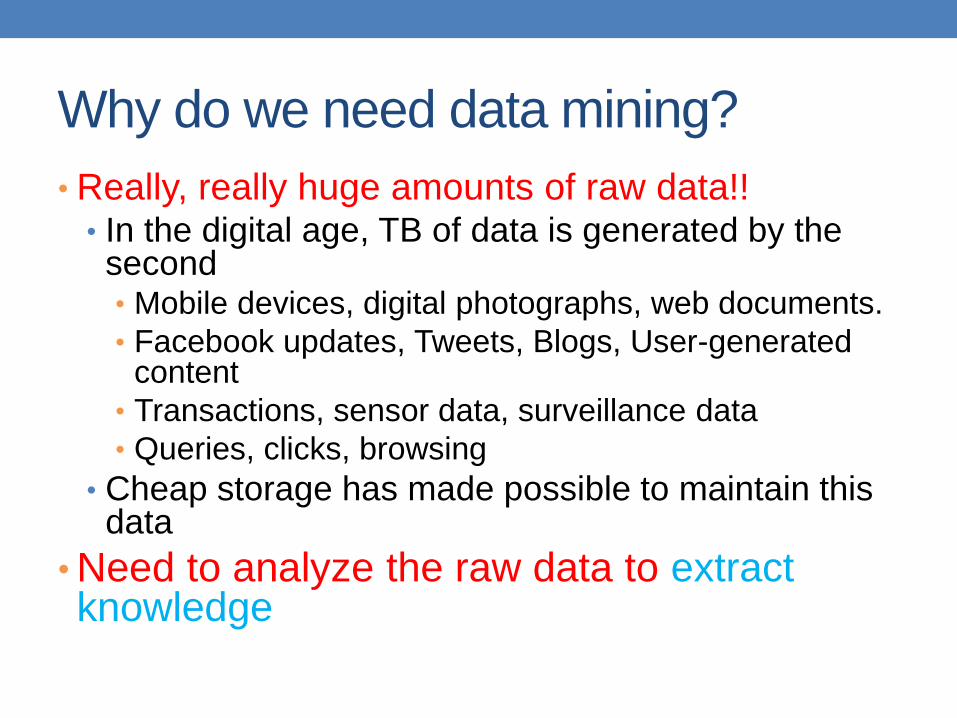
Why do we need data mining?
• Really, really huge amounts of raw data!! • In the digital age, TB of data is generated by the second • Mobile devices, digital photographs, web documents.
• Facebook updates, Tweets, Blogs, User-generated content
• Transactions, sensor data, surveillance data
• Queries, clicks, browsing
• Cheap storage has made possible to maintain this data
• Need to analyze the raw data to extract knowledge
Why do we need data mining?
• “The data is the computer” • Large amounts of data can be more powerful than
complex algorithms and models • Google has solved many Natural Language Processing
problems, simply by looking at the data
• Example: misspellings, synonyms
• Data is power! • Today, the collected data is one of the biggest assets of an
online company
• Query logs of Google
• The friendship and updates of Facebook
• Tweets and follows of Twitter
• Amazon transactions
• We need a way to harness the collective intelligence
The data is also very complex
• Multiple types of data: tables, time series,
images, graphs, etc
• Spatial and temporal aspects
• Interconnected data of different types:
• From the mobile phone we can collect, location of the
user, friendship information, check-ins to venues,
opinions through twitter, images though cameras,
queries to search engines
Example: transaction data
• Billions of real-life customers:
• WALMART: 20M transactions per day
• AT&T 300 M calls per day
• Credit card companies: billions of transactions per day.
• The point cards allow companies to collect
information about specific users
Example: document data
• Web as a document repository: estimated 50
billions of web pages
• Wikipedia: 4 million articles (and counting)
• Online news portals: steady stream of 100’s of
new articles every day
• Twitter: ~300 million tweets every day
Example: network data
• Web: 50 billion pages linked via hyperlinks
• Facebook: 500 million users
• Twitter: 300 million users
• Instant messenger: ~1billion users
• Blogs: 250 million blogs worldwide, presidential candidates run blogs
Example: genomic sequences
• http://www.1000genomes.org/page.php
• Full sequence of 1000 individuals
• 3*109 nucleotides per person 3*1012
nucleotides
• Lots more data in fact: medical history of the
persons, gene expression data
Example: environmental data
• Climate data (just an example)
http://www.ncdc.gov/oa/climate/ghcn-monthly/index.php
• “a database of temperature, precipitation and
pressure records managed by the National Climatic
Data Center, Arizona State University and the Carbon
Dioxide Information Analysis Center”
• “6000 temperature stations, 7500 precipitation
stations, 2000 pressure stations”
• Spatiotemporal data
Behavioral data
• Mobile phones today record a large amount of information about the user behavior • GPS records position
• Camera produces images
• Communication via phone and SMS
• Text via facebook updates
• Association with entities via check-ins
• Amazon collects all the items that you browsed, placed into your basket, read reviews about, purchased.
• Google and Bing record all your browsing activity via toolbar plugins. They also record the queries you asked, the pages you saw and the clicks you did.
• Data collected for millions of users on a daily basis
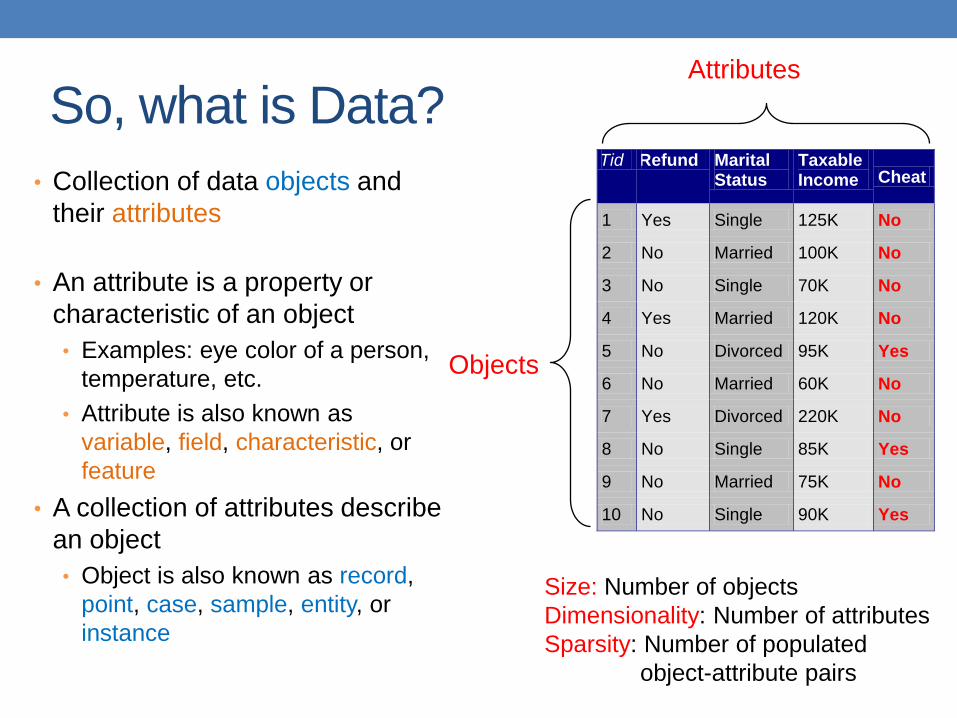
So, what is Data?
• Collection of data objects and
their attributes
• An attribute is a property or
characteristic of an object
• Examples: eye color of a person,
temperature, etc.
• Attribute is also known as
variable, field, characteristic, or
feature
• A collection of attributes describe
an object
• Object is also known as record,
point, case, sample, entity, or
instance
Tid Refund Marital Status
Taxable Income Cheat
1 Yes Single 125K No
2 No Married 100K No
3 No Single 70K No
4 Yes Married 120K No
5 No Divorced 95K Yes
6 No Married 60K No
7 Yes Divorced 220K No
8 No Single 85K Yes
9 No Married 75K No
10 No Single 90K Yes 10
Attributes
Objects
Size: Number of objects
Dimensionality: Number of attributes
Sparsity: Number of populated
object-attribute pairs
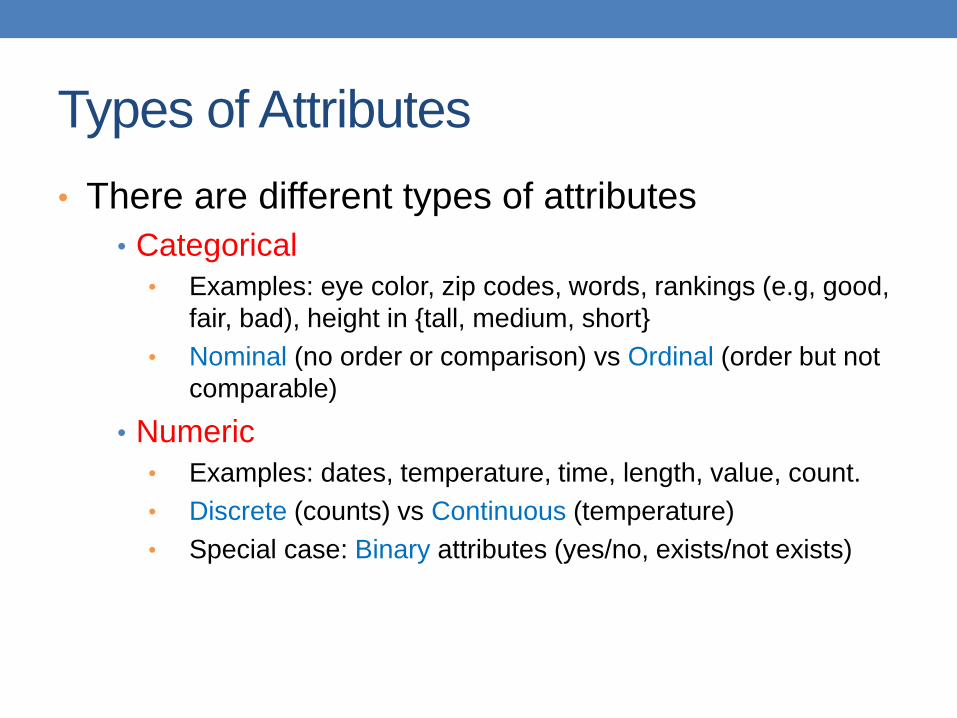
Types of Attributes
• There are different types of attributes
• Categorical
• Examples: eye color, zip codes, words, rankings (e.g, good,
fair, bad), height in {tall, medium, short}
• Nominal (no order or comparison) vs Ordinal (order but not
comparable)
• Numeric
• Examples: dates, temperature, time, length, value, count.
• Discrete (counts) vs Continuous (temperature)
• Special case: Binary attributes (yes/no, exists/not exists)
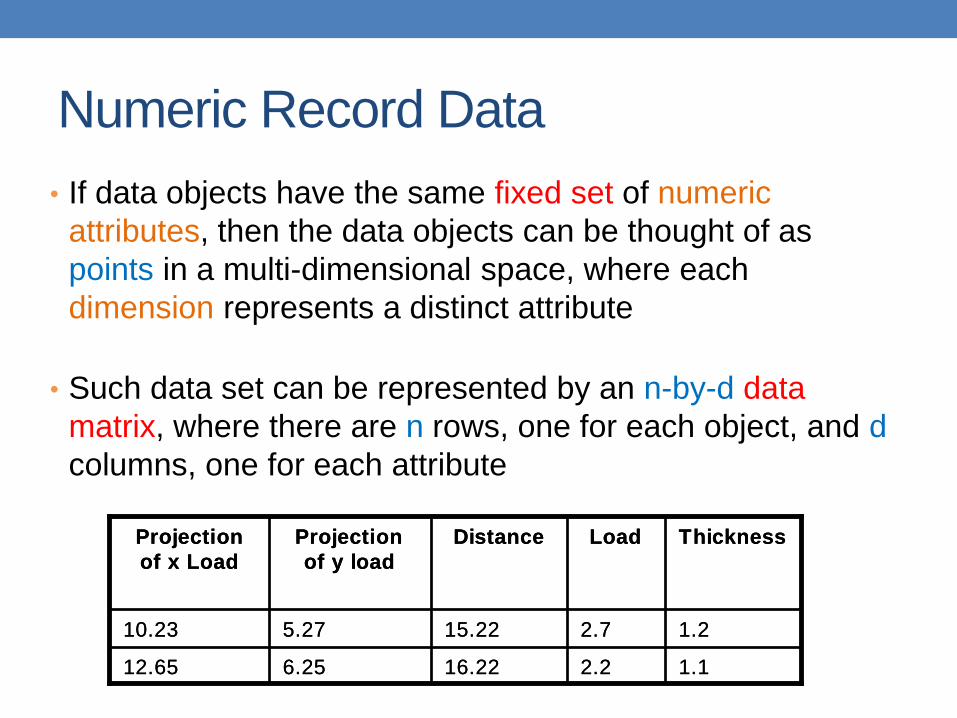
Numeric Record Data
• If data objects have the same fixed set of numeric
attributes, then the data objects can be thought of as
points in a multi-dimensional space, where each
dimension represents a distinct attribute
• Such data set can be represented by an n-by-d data
matrix, where there are n rows, one for each object, and d
columns, one for each attribute
1.12.216.226.2512.65
1.22.715.225.2710.23
Thickness LoadDistanceProjection
of y load
Projection
of x Load
1.12.216.226.2512.65
1.22.715.225.2710.23
Thickness LoadDistanceProjection
of y load
Projection
of x Load
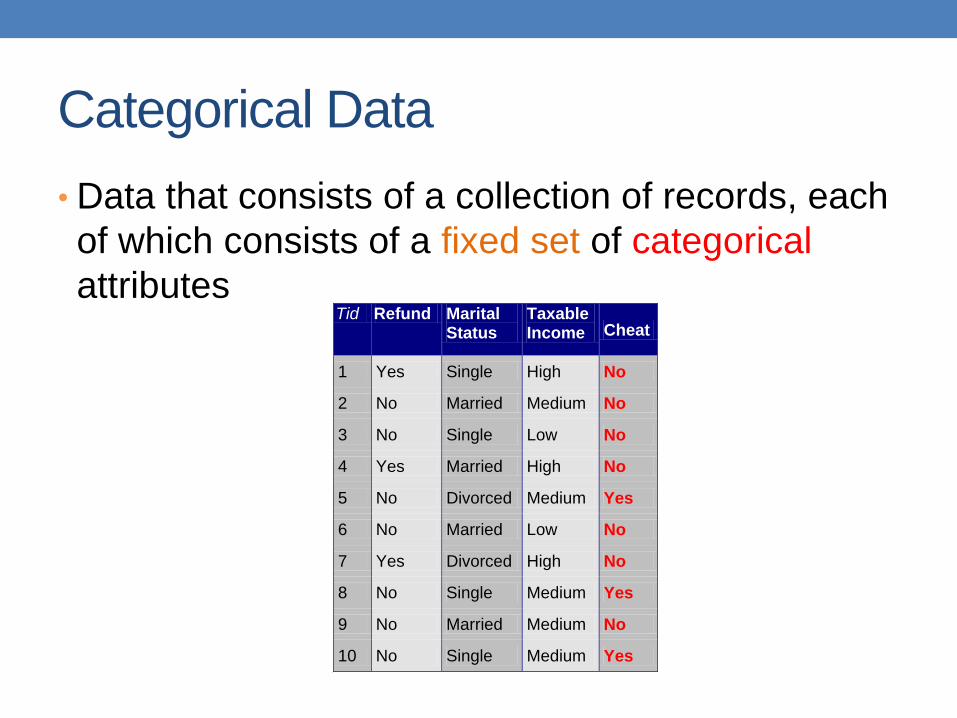
Categorical Data
• Data that consists of a collection of records, each
of which consists of a fixed set of categorical
attributes
Tid Refund Marital Status
Taxable Income Cheat
1 Yes Single High No
2 No Married Medium No
3 No Single Low No
4 Yes Married High No
5 No Divorced Medium Yes
6 No Married Low No
7 Yes Divorced High No
8 No Single Medium Yes
9 No Married Medium No
10 No Single Medium Yes 10
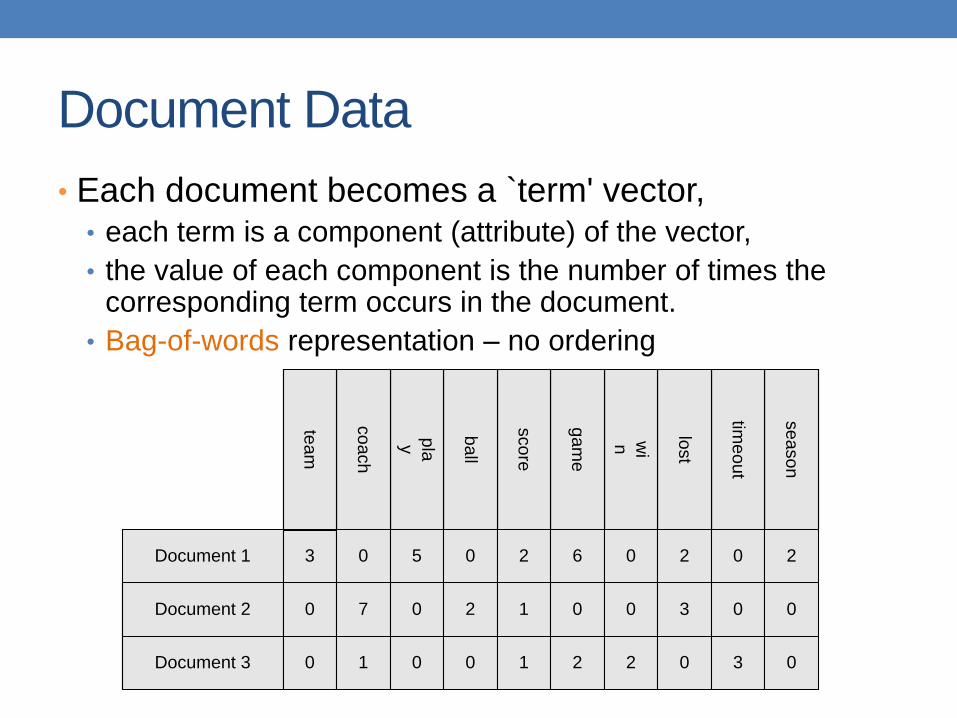
Document Data
• Each document becomes a `term' vector, • each term is a component (attribute) of the vector,
• the value of each component is the number of times the corresponding term occurs in the document.
• Bag-of-words representation – no ordering
Document 1
se
aso
n
time
ou
t
lost
wi
n
ga
me
sco
re
ba
ll
play
co
ach
tea
m
Document 2
Document 3
3 0 5 0 2 6 0 2 0 2
0
0
7 0 2 1 0 0 3 0 0
1 0 0 1 2 2 0 3 0
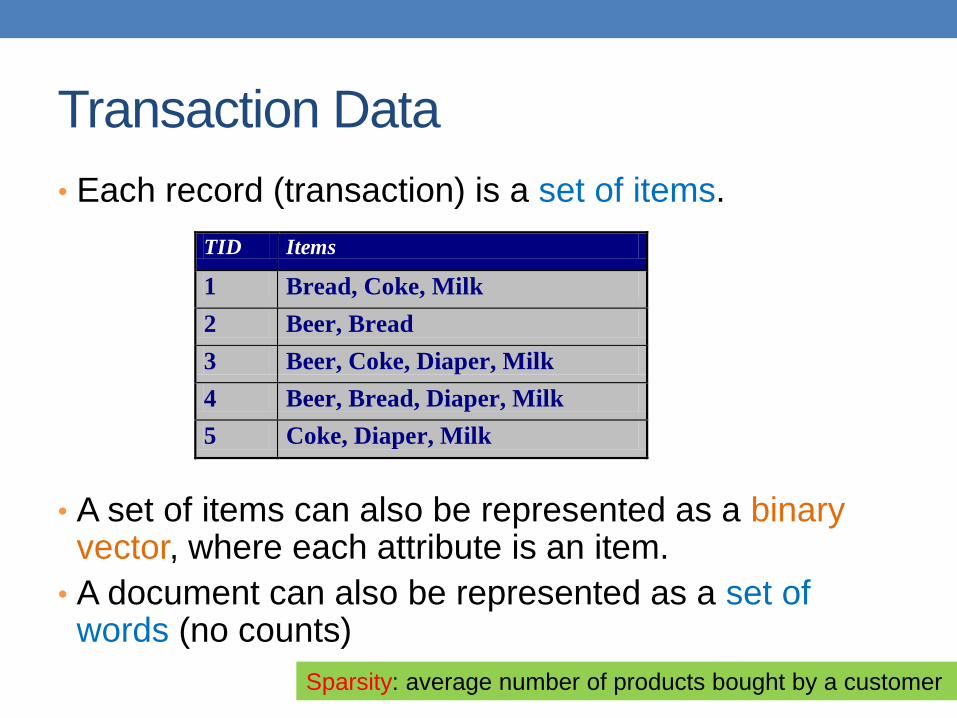
Transaction Data
• Each record (transaction) is a set of items.
• A set of items can also be represented as a binary vector, where each attribute is an item.
• A document can also be represented as a set of words (no counts)
TID Items
1 Bread, Coke, Milk
2 Beer, Bread
3 Beer, Coke, Diaper, Milk
4 Beer, Bread, Diaper, Milk
5 Coke, Diaper, Milk
Sparsity: average number of products bought by a customer
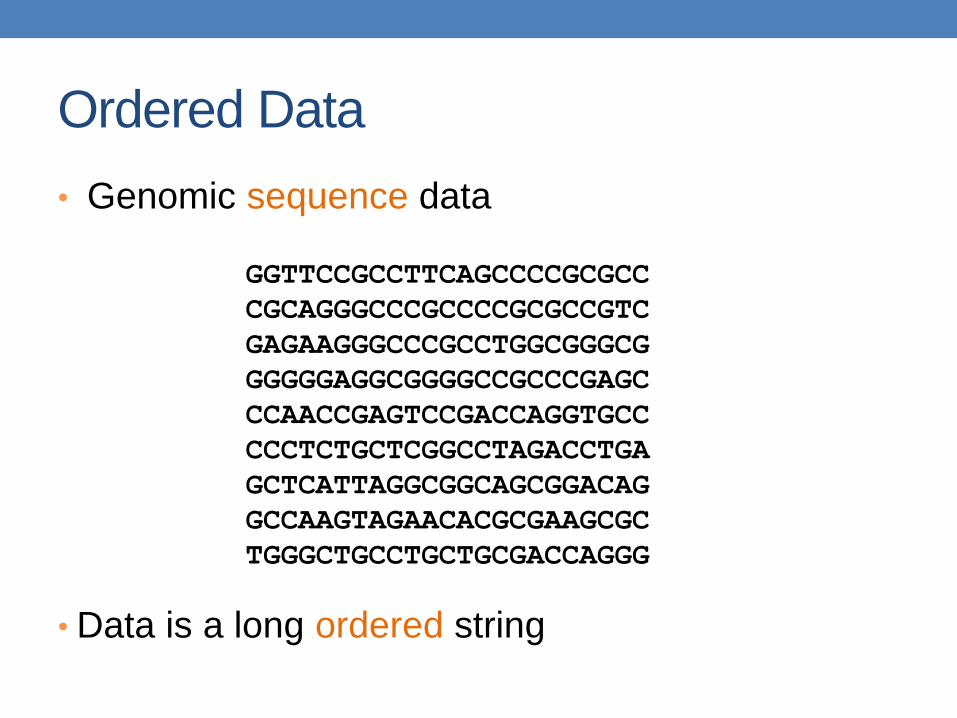
Ordered Data
• Genomic sequence data
• Data is a long ordered string
GGTTCCGCCTTCAGCCCCGCGCC
CGCAGGGCCCGCCCCGCGCCGTC
GAGAAGGGCCCGCCTGGCGGGCG
GGGGGAGGCGGGGCCGCCCGAGC
CCAACCGAGTCCGACCAGGTGCC
CCCTCTGCTCGGCCTAGACCTGA
GCTCATTAGGCGGCAGCGGACAG
GCCAAGTAGAACACGCGAAGCGC
TGGGCTGCCTGCTGCGACCAGGG

Ordered Data
• Time series
• Sequence of ordered (over “time”) numeric values.
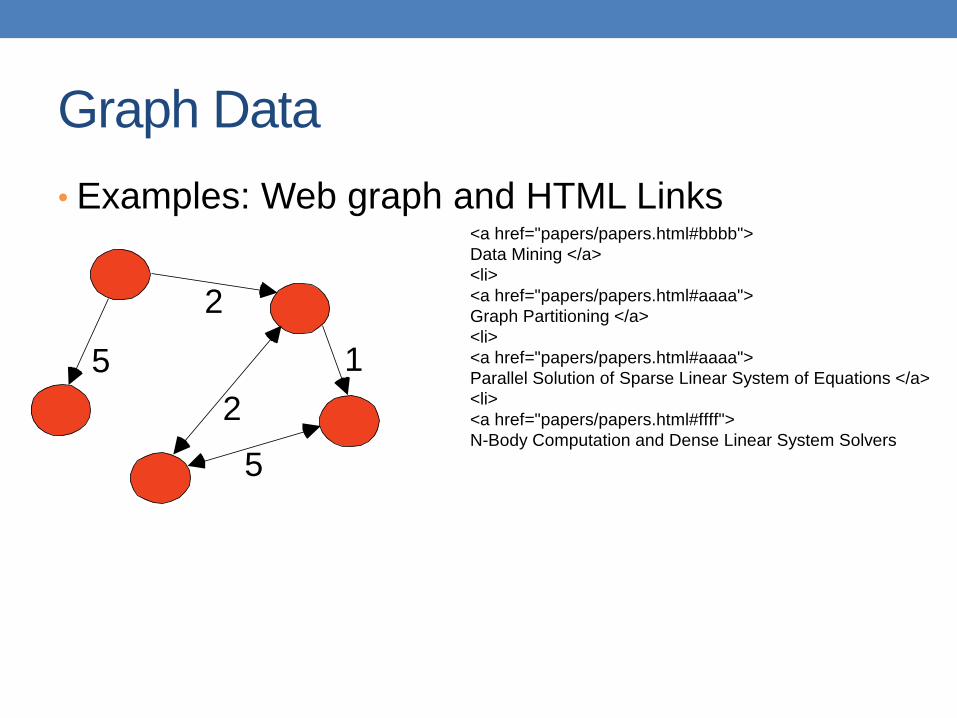
Graph Data
• Examples: Web graph and HTML Links
5
2
1
2
5
<a href="papers/papers.html#bbbb">
Data Mining </a>
<li>
<a href="papers/papers.html#aaaa">
Graph Partitioning </a>
<li>
<a href="papers/papers.html#aaaa">
Parallel Solution of Sparse Linear System of Equations </a>
<li>
<a href="papers/papers.html#ffff">
N-Body Computation and Dense Linear System Solvers

Types of data
• Numeric data: Each object is a point in a multidimensional space
• Categorical data: Each object is a vector of categorical values
• Set data: Each object is a set of values (with or without counts) • Sets can also be represented as binary vectors, or
vectors of counts
• Ordered sequences: Each object is an ordered sequence of values.
• Graph data
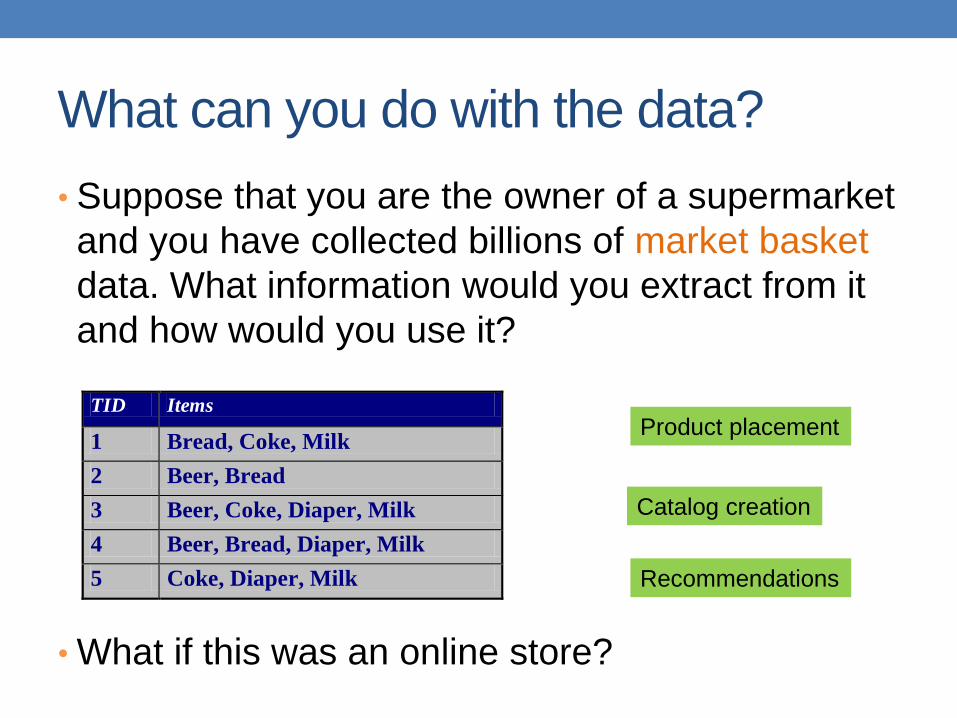
What can you do with the data?
• Suppose that you are the owner of a supermarket
and you have collected billions of market basket
data. What information would you extract from it
and how would you use it?
• What if this was an online store?
TID Items
1 Bread, Coke, Milk
2 Beer, Bread
3 Beer, Coke, Diaper, Milk
4 Beer, Bread, Diaper, Milk
5 Coke, Diaper, Milk
Product placement
Catalog creation
Recommendations
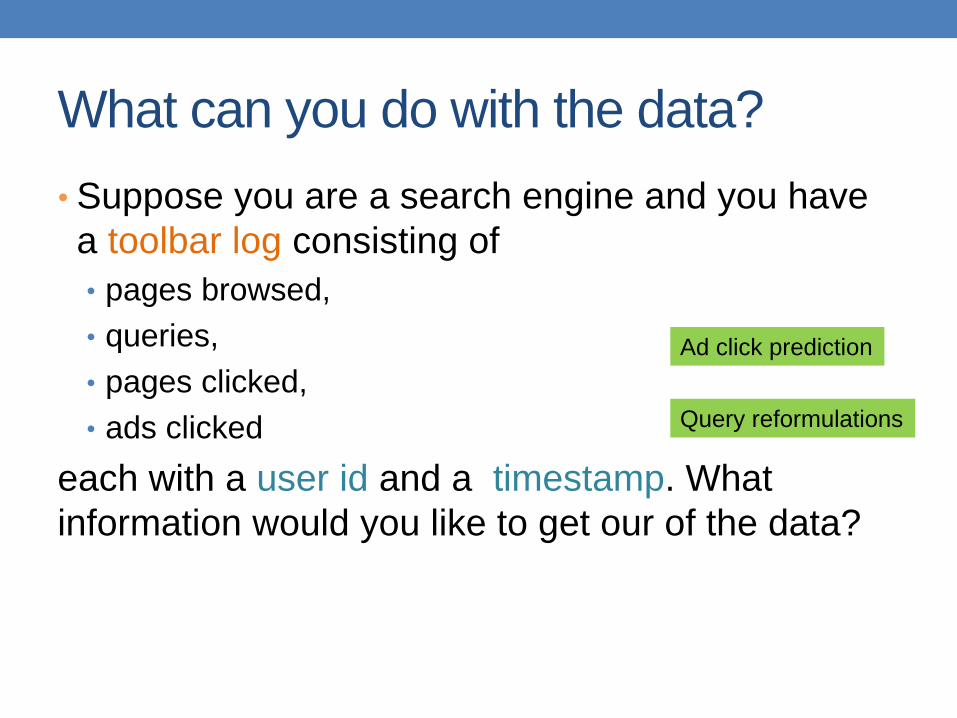
What can you do with the data?
• Suppose you are a search engine and you have
a toolbar log consisting of
• pages browsed,
• queries,
• pages clicked,
• ads clicked
each with a user id and a timestamp. What
information would you like to get our of the data?
Ad click prediction
Query reformulations
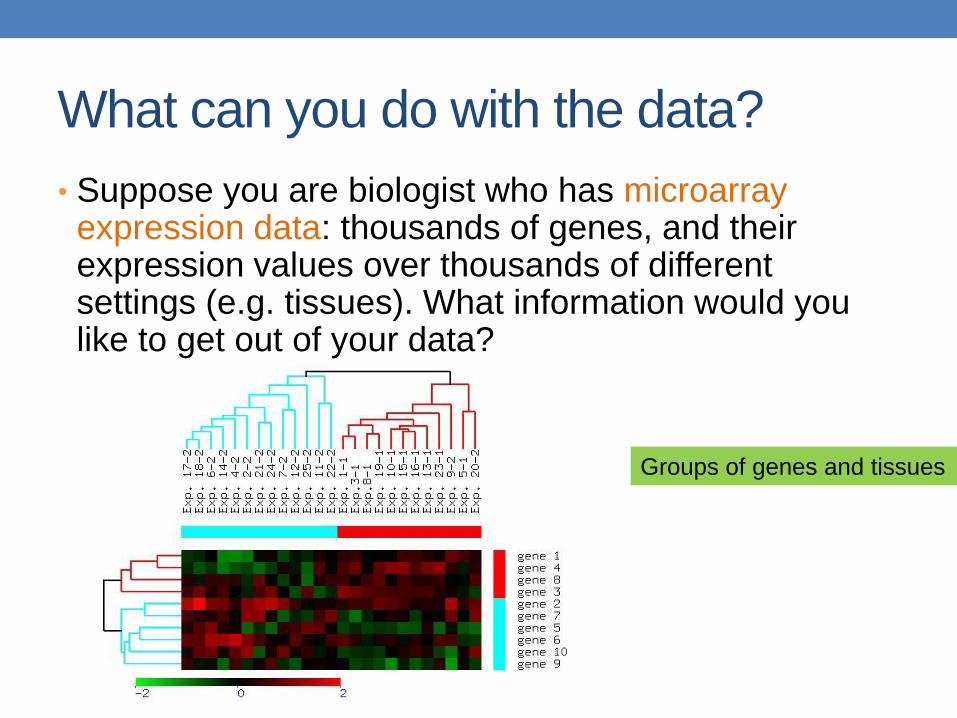
What can you do with the data?
• Suppose you are biologist who has microarray expression data: thousands of genes, and their expression values over thousands of different settings (e.g. tissues). What information would you like to get out of your data?
Groups of genes and tissues
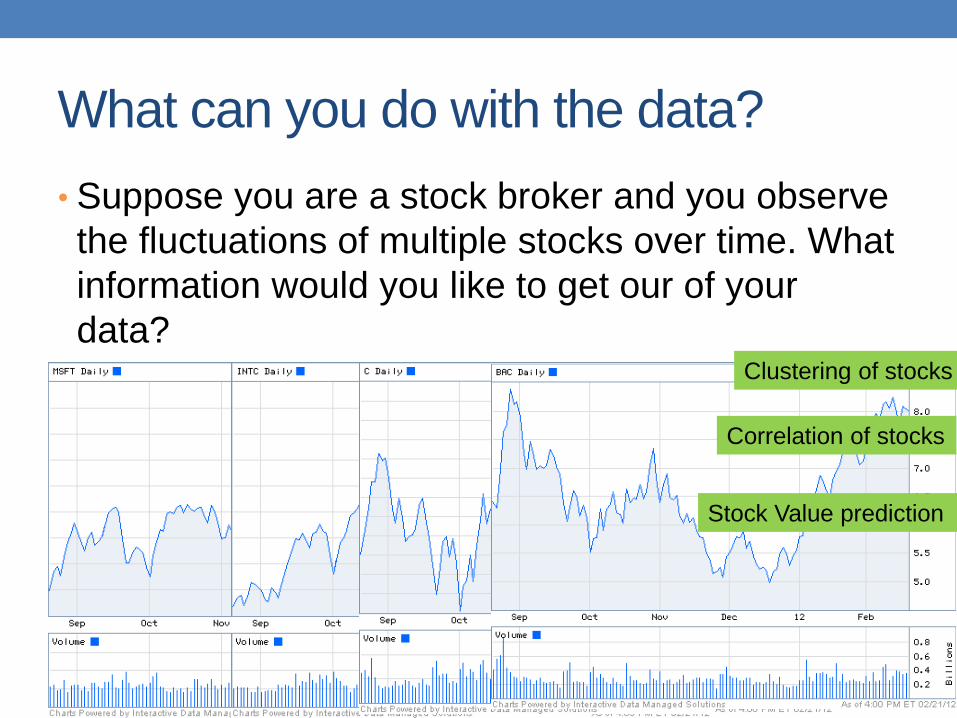
What can you do with the data?
• Suppose you are a stock broker and you observe
the fluctuations of multiple stocks over time. What
information would you like to get our of your
data? Clustering of stocks
Correlation of stocks
Stock Value prediction
What can you do with the data?
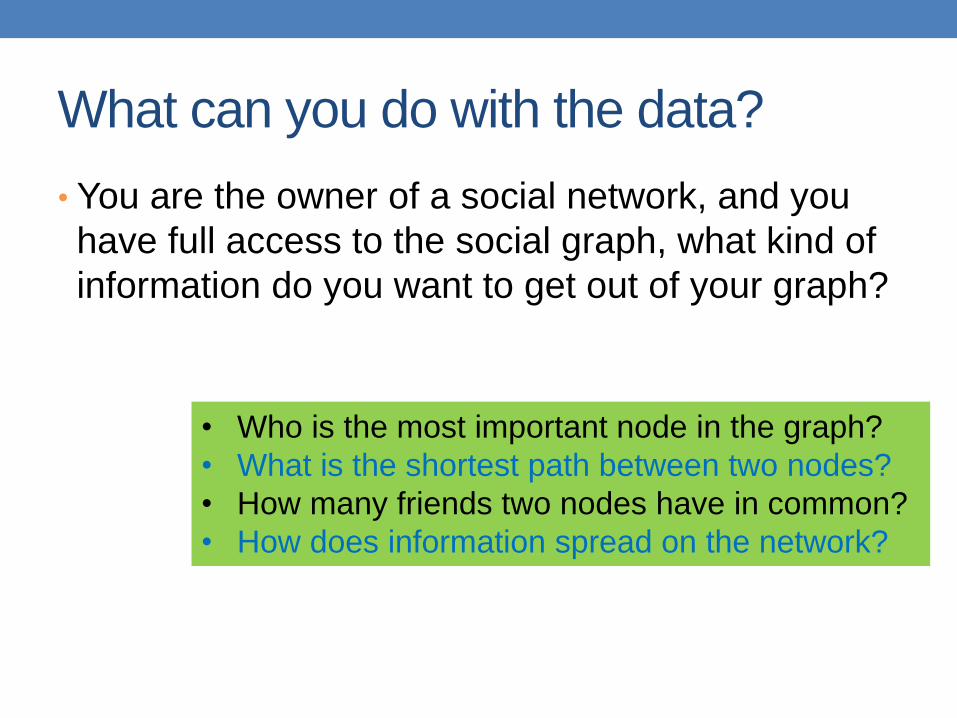
• You are the owner of a social network, and you
have full access to the social graph, what kind of
information do you want to get out of your graph?
• Who is the most important node in the graph?
• What is the shortest path between two nodes?
• How many friends two nodes have in common?
• How does information spread on the network?
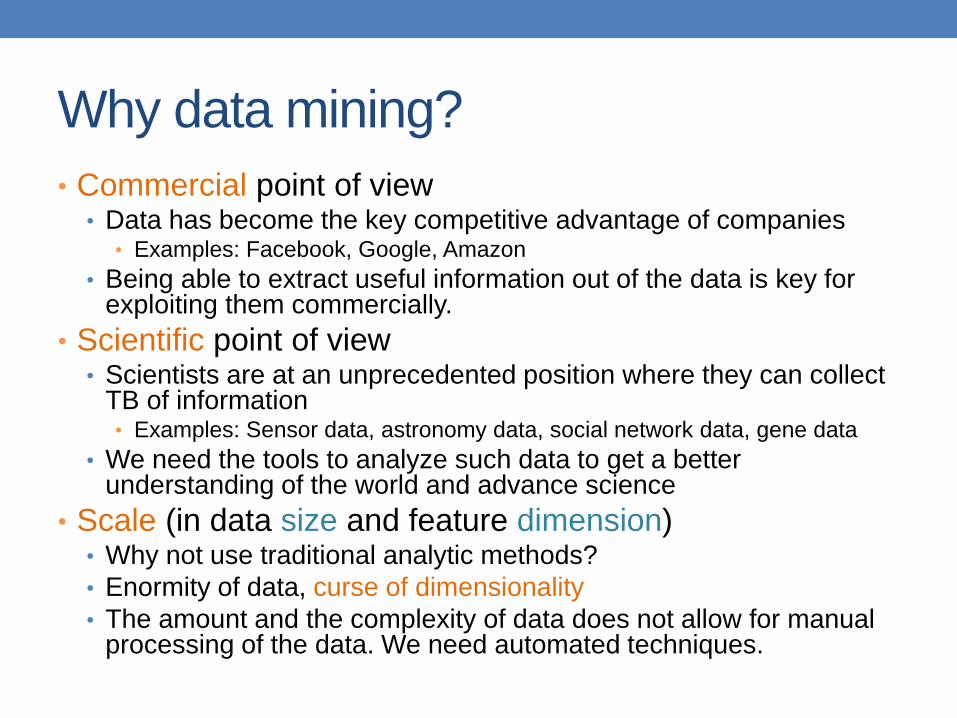
Why data mining?
• Commercial point of view • Data has become the key competitive advantage of companies
• Examples: Facebook, Google, Amazon
• Being able to extract useful information out of the data is key for exploiting them commercially.
• Scientific point of view • Scientists are at an unprecedented position where they can collect
TB of information • Examples: Sensor data, astronomy data, social network data, gene data
• We need the tools to analyze such data to get a better understanding of the world and advance science
• Scale (in data size and feature dimension) • Why not use traditional analytic methods?
• Enormity of data, curse of dimensionality
• The amount and the complexity of data does not allow for manual processing of the data. We need automated techniques.
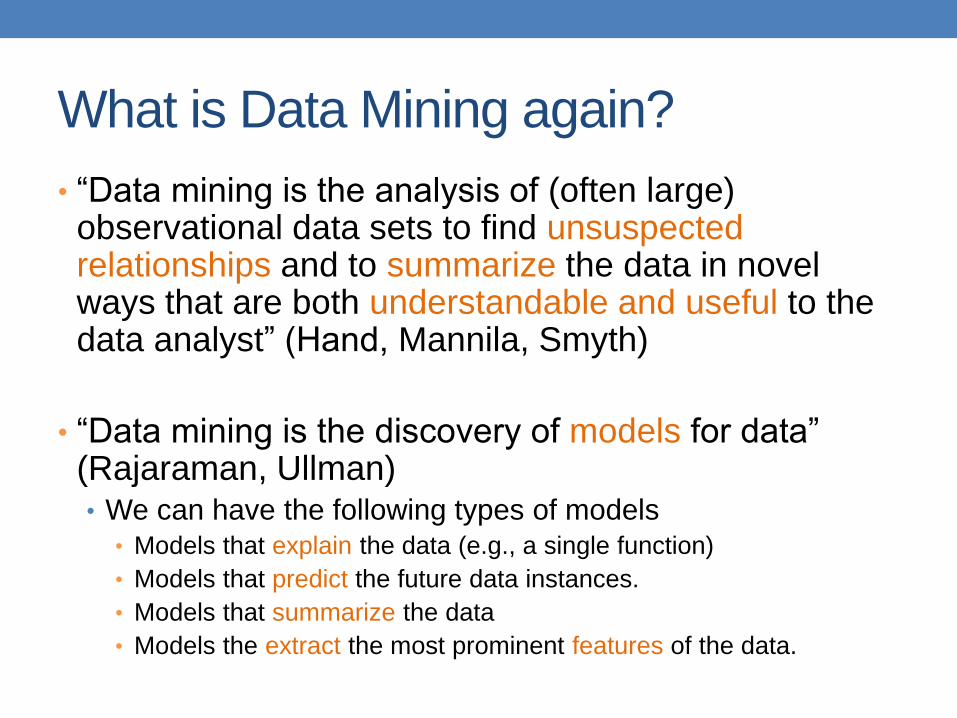
What is Data Mining again?
• “Data mining is the analysis of (often large) observational data sets to find unsuspected relationships and to summarize the data in novel ways that are both understandable and useful to the data analyst” (Hand, Mannila, Smyth)
• “Data mining is the discovery of models for data” (Rajaraman, Ullman) • We can have the following types of models
• Models that explain the data (e.g., a single function)
• Models that predict the future data instances.
• Models that summarize the data
• Models the extract the most prominent features of the data.
What can we do with data mining?
• Some examples:
• Frequent itemsets and Association Rules extraction
• Coverage
• Clustering
• Classification
• Ranking
• Exploratory analysis
Frequent Itemsets and Association Rules
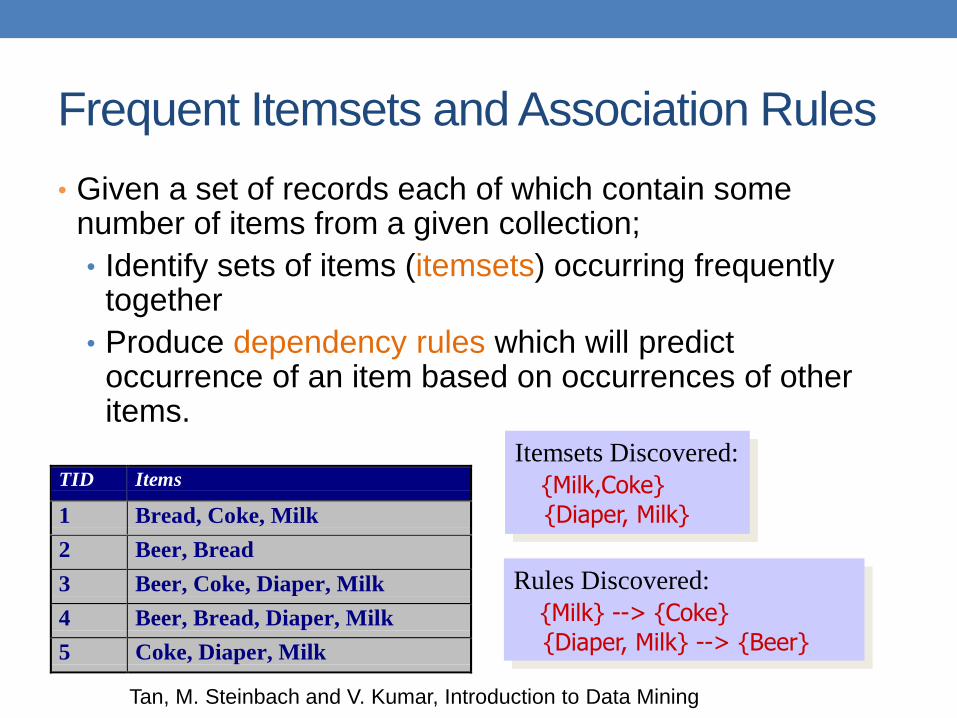
• Given a set of records each of which contain some number of items from a given collection;
• Identify sets of items (itemsets) occurring frequently together
• Produce dependency rules which will predict occurrence of an item based on occurrences of other items.
TID Items
1 Bread, Coke, Milk
2 Beer, Bread
3 Beer, Coke, Diaper, Milk
4 Beer, Bread, Diaper, Milk
5 Coke, Diaper, Milk
Rules Discovered:
{Milk} --> {Coke}
{Diaper, Milk} --> {Beer}
Itemsets Discovered:
{Milk,Coke}
{Diaper, Milk}
Tan, M. Steinbach and V. Kumar, Introduction to Data Mining
Frequent Itemsets: Applications
• Text mining: finding associated phrases in text
• There are lots of documents that contain the phrases
“association rules”, “data mining” and “efficient
algorithm”
• Recommendations:
• Users who buy this item often buy this item as well
• Users who watched James Bond movies, also watched
Jason Bourne movies.
• Recommendations make use of item and user similarity
Association Rule Discovery: Application
• Supermarket shelf management.
• Goal: To identify items that are bought together by
sufficiently many customers.
• Approach: Process the point-of-sale data collected
with barcode scanners to find dependencies among
items.
• A classic rule --
• If a customer buys diaper and milk, then he is very likely to
buy beer.
• So, don’t be surprised if you find six-packs stacked next to
diapers!
Tan, M. Steinbach and V. Kumar, Introduction to Data Mining
Clustering Definition
• Given a set of data points, each having a set of attributes, and a similarity measure among them, find clusters such that • Data points in one cluster are more similar to one
another.
• Data points in separate clusters are less similar to one another.
• Similarity Measures? • Euclidean Distance if attributes are continuous.
• Other Problem-specific Measures.
Tan, M. Steinbach and V. Kumar, Introduction to Data Mining
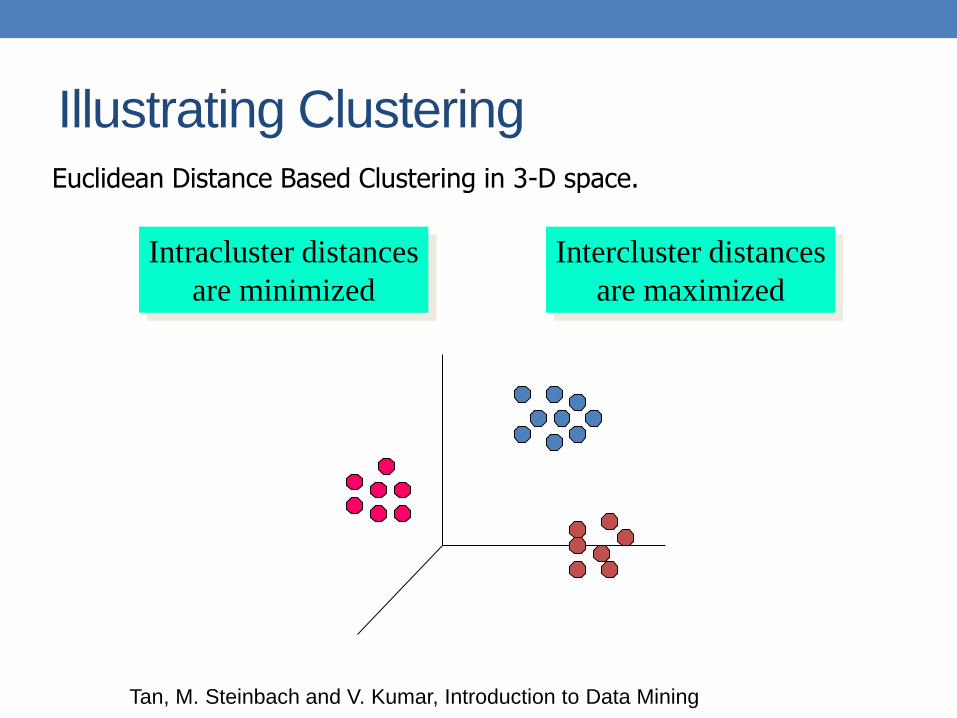
Illustrating Clustering Euclidean Distance Based Clustering in 3-D space.
Intracluster distances
are minimized
Intercluster distances
are maximized
Tan, M. Steinbach and V. Kumar, Introduction to Data Mining
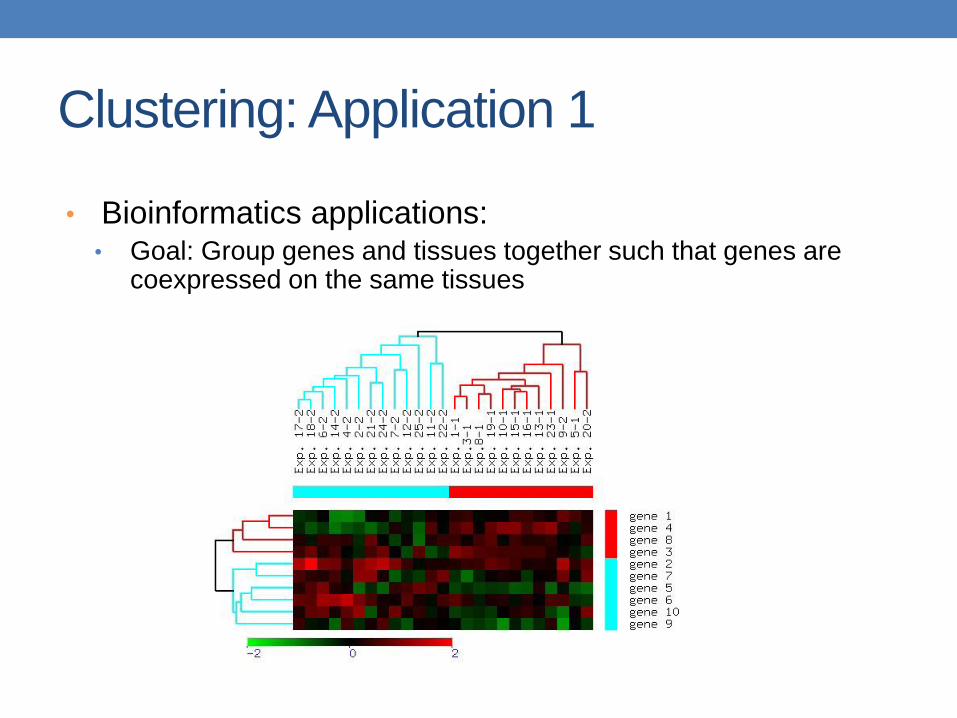
Clustering: Application 1
• Bioinformatics applications: • Goal: Group genes and tissues together such that genes are
coexpressed on the same tissues
Clustering: Application 2
• Document Clustering:
• Goal: To find groups of documents that are similar to
each other based on the important terms appearing in
them.
• Approach: To identify frequently occurring terms in
each document. Form a similarity measure based on
the frequencies of different terms. Use it to cluster.
• Gain: Information Retrieval can utilize the clusters to
relate a new document or search term to clustered
documents.
Tan, M. Steinbach and V. Kumar, Introduction to Data Mining
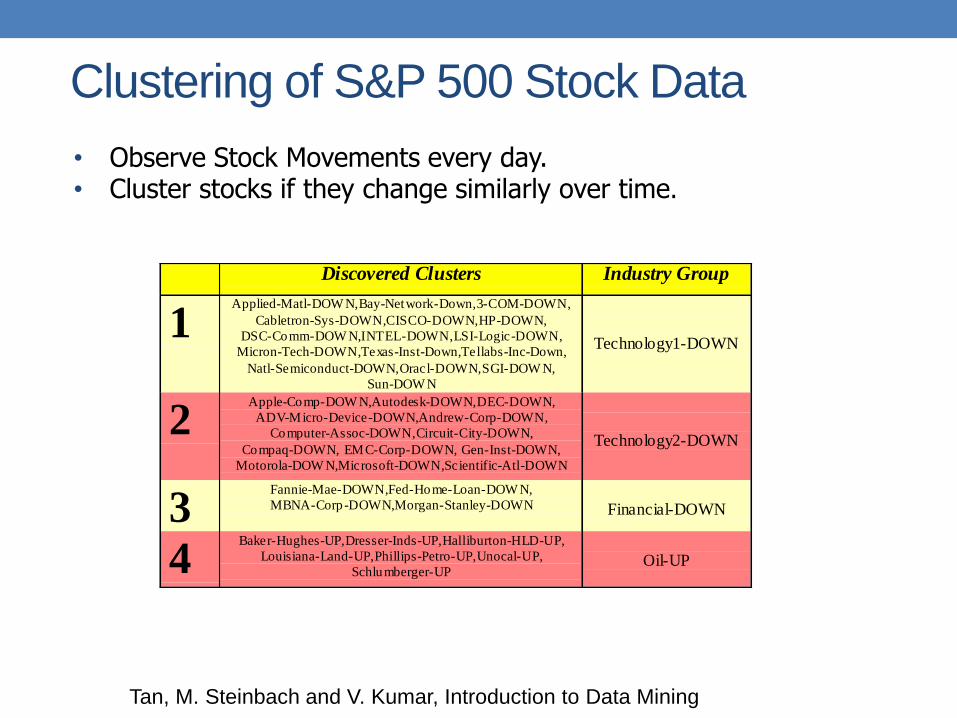
Clustering of S&P 500 Stock Data
Discovered Clusters Industry Group
1Applied-Matl-DOW N,Bay-Network-Down,3-COM-DOWN,
Cabletron-Sys-DOWN,CISCO-DOWN,HP-DOWN,
DSC-Comm-DOW N,INTEL-DOWN,LSI-Logic-DOWN,
Micron-Tech-DOWN,Texas-Inst-Down,Tellabs-Inc-Down,
Natl-Semiconduct-DOWN,Oracl-DOWN,SGI-DOW N,
Sun-DOW N
Technology1-DOWN
2Apple-Comp-DOW N,Autodesk-DOWN,DEC-DOWN,
ADV-Micro-Device-DOWN,Andrew-Corp-DOWN,
Computer-Assoc-DOWN,Circuit-City-DOWN,
Compaq-DOWN, EMC-Corp-DOWN, Gen-Inst-DOWN,
Motorola-DOW N,Microsoft-DOWN,Scientific-Atl-DOWN
Technology2-DOWN
3Fannie-Mae-DOWN,Fed-Home-Loan-DOW N,
MBNA-Corp-DOWN,Morgan-Stanley-DOWN Financial-DOWN
4Baker-Hughes-UP,Dresser-Inds-UP,Halliburton-HLD-UP,
Louisiana-Land-UP,Phillips-Petro-UP,Unocal-UP,
Schlumberger-UPOil-UP
• Observe Stock Movements every day. • Cluster stocks if they change similarly over time.
Tan, M. Steinbach and V. Kumar, Introduction to Data Mining
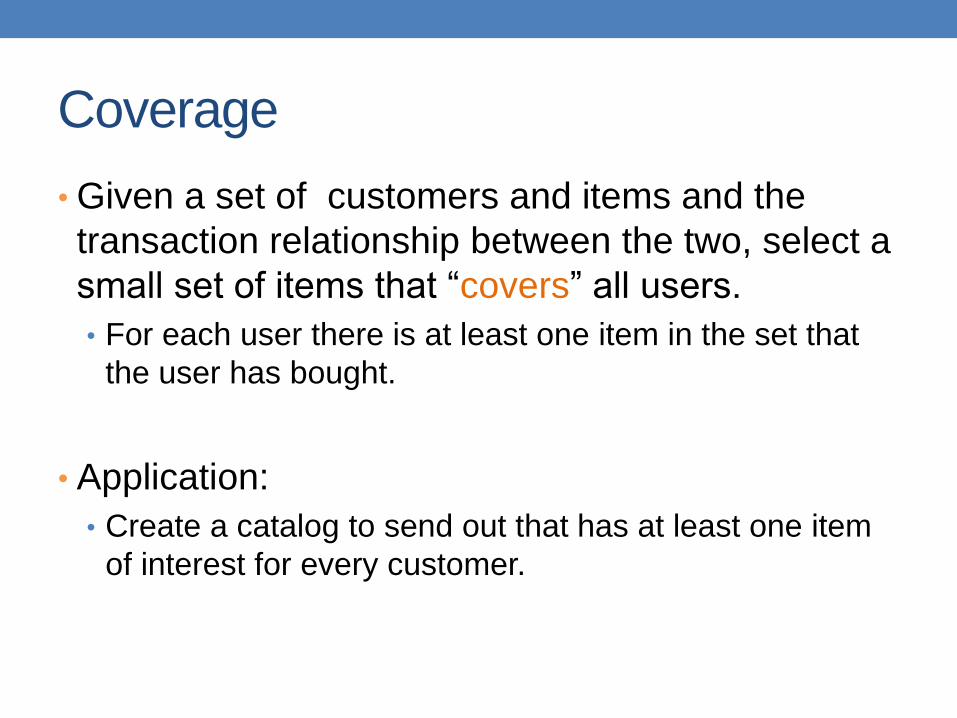
Coverage
• Given a set of customers and items and the
transaction relationship between the two, select a
small set of items that “covers” all users.
• For each user there is at least one item in the set that
the user has bought.
• Application:
• Create a catalog to send out that has at least one item
of interest for every customer.
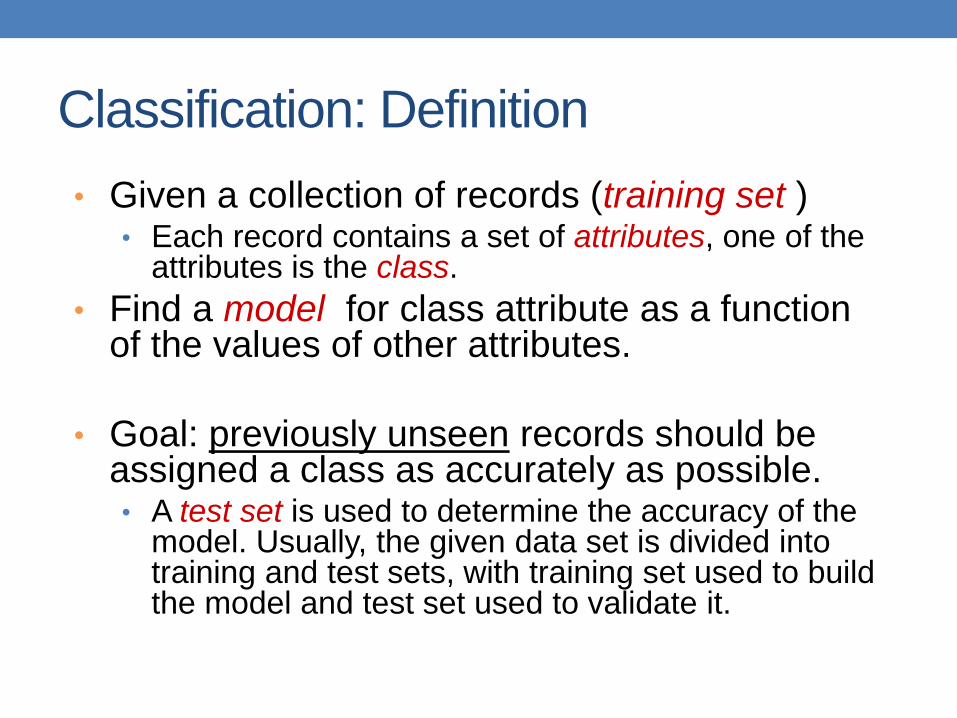
Classification: Definition
• Given a collection of records (training set ) • Each record contains a set of attributes, one of the
attributes is the class.
• Find a model for class attribute as a function of the values of other attributes.
• Goal: previously unseen records should be assigned a class as accurately as possible. • A test set is used to determine the accuracy of the
model. Usually, the given data set is divided into training and test sets, with training set used to build the model and test set used to validate it.
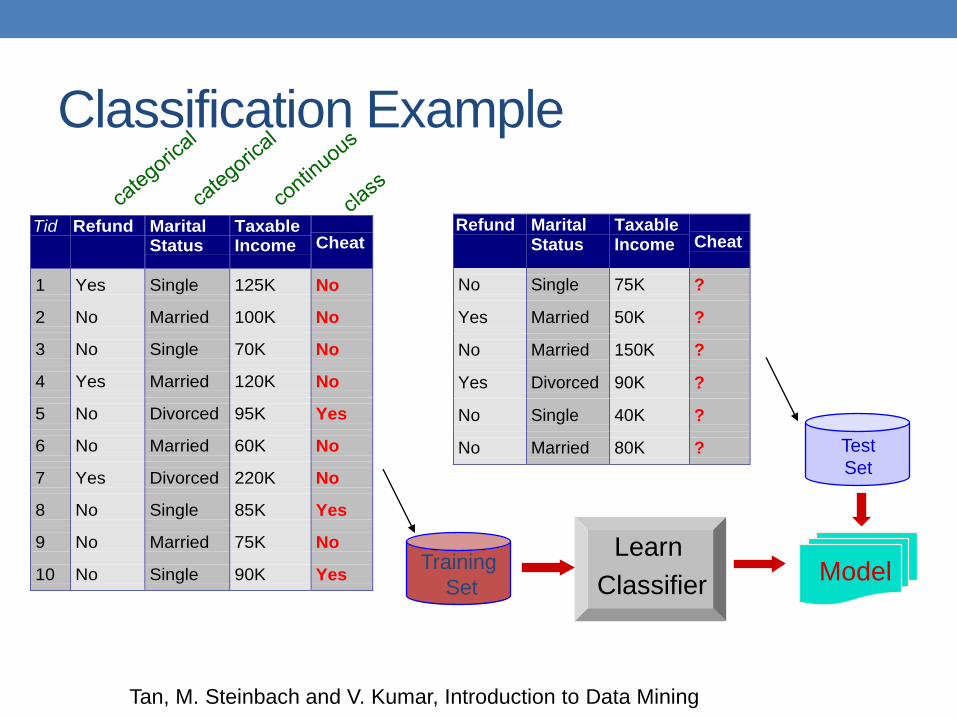
Classification Example
Tid Refund MaritalStatus
TaxableIncome Cheat
1 Yes Single 125K No
2 No Married 100K No
3 No Single 70K No
4 Yes Married 120K No
5 No Divorced 95K Yes
6 No Married 60K No
7 Yes Divorced 220K No
8 No Single 85K Yes
9 No Married 75K No
10 No Single 90K Yes10
Refund MaritalStatus
TaxableIncome Cheat
No Single 75K ?
Yes Married 50K ?
No Married 150K ?
Yes Divorced 90K ?
No Single 40K ?
No Married 80K ?10
Test
Set
Training
Set Model
Learn
Classifier
Tan, M. Steinbach and V. Kumar, Introduction to Data Mining
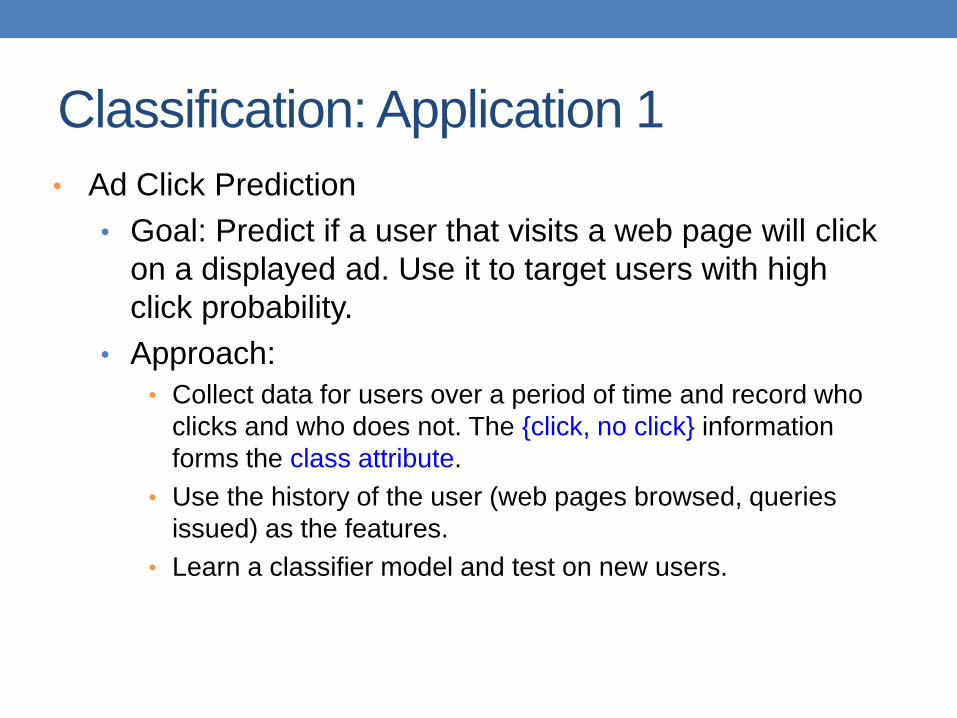
Classification: Application 1
• Ad Click Prediction
• Goal: Predict if a user that visits a web page will click
on a displayed ad. Use it to target users with high
click probability.
• Approach:
• Collect data for users over a period of time and record who
clicks and who does not. The {click, no click} information
forms the class attribute.
• Use the history of the user (web pages browsed, queries
issued) as the features.
• Learn a classifier model and test on new users.
Classification: Application 2
• Fraud Detection
• Goal: Predict fraudulent cases in credit card transactions.
• Approach: • Use credit card transactions and the information on its
account-holder as attributes. • When does a customer buy, what does he buy, how often he pays on
time, etc
• Label past transactions as fraud or fair transactions. This forms the class attribute.
• Learn a model for the class of the transactions.
• Use this model to detect fraud by observing credit card transactions on an account.
Tan, M. Steinbach and V. Kumar, Introduction to Data Mining
Link Analysis Ranking
• Given a collection of web pages that are linked to
each other, rank the pages according to
importance (authoritativeness) in the graph
• Intuition: A page gains authority if it is linked to by
another page.
• Application: When retrieving pages, the
authoritativeness is factored in the ranking.
Exploratory Analysis
• Trying to understand the data as a physical
phenomenon, and describe them with simple metrics
• What does the web graph look like?
• How often do people repeat the same query?
• Are friends in facebook also friends in twitter?
• The important thing is to find the right metrics and
ask the right questions
• It helps our understanding of the world, and can lead
to models of the phenomena we observe.
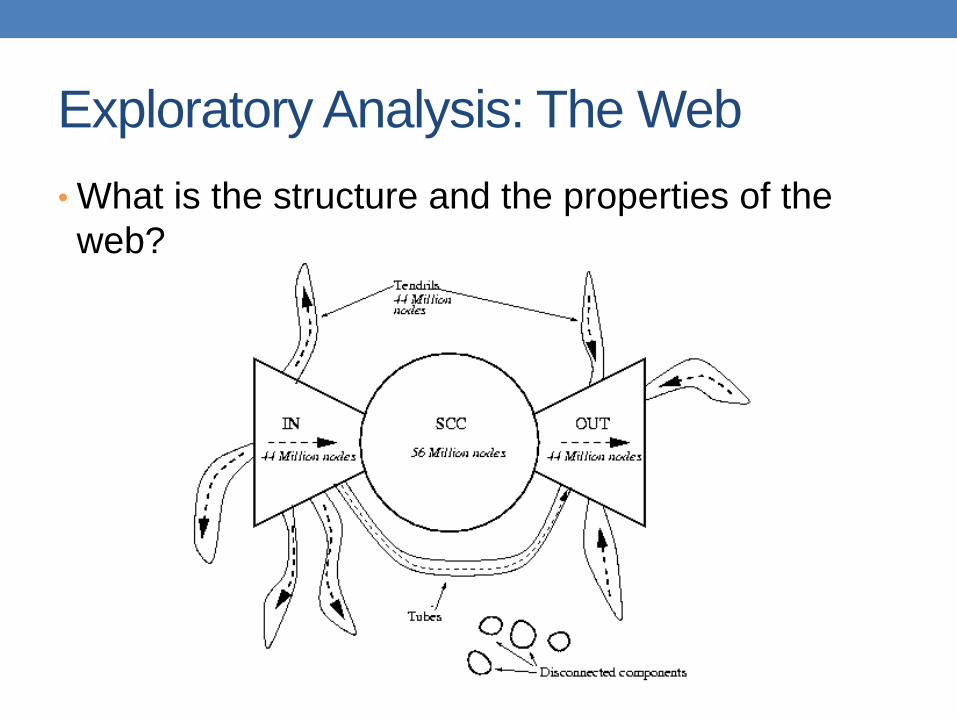
Exploratory Analysis: The Web
• What is the structure and the properties of the
web?
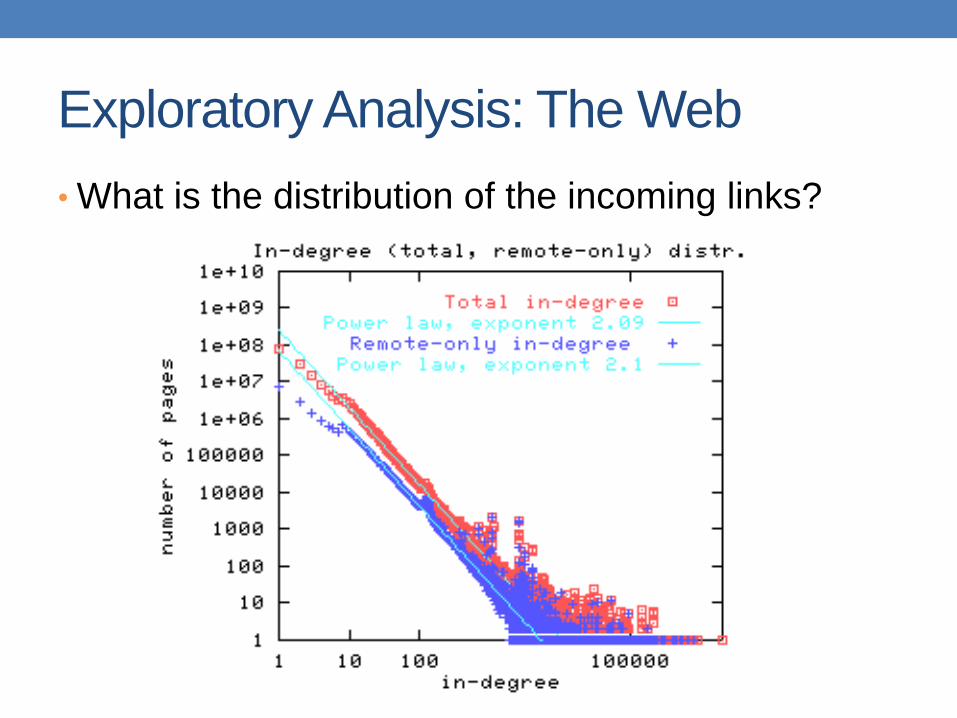
Exploratory Analysis: The Web
• What is the distribution of the incoming links?
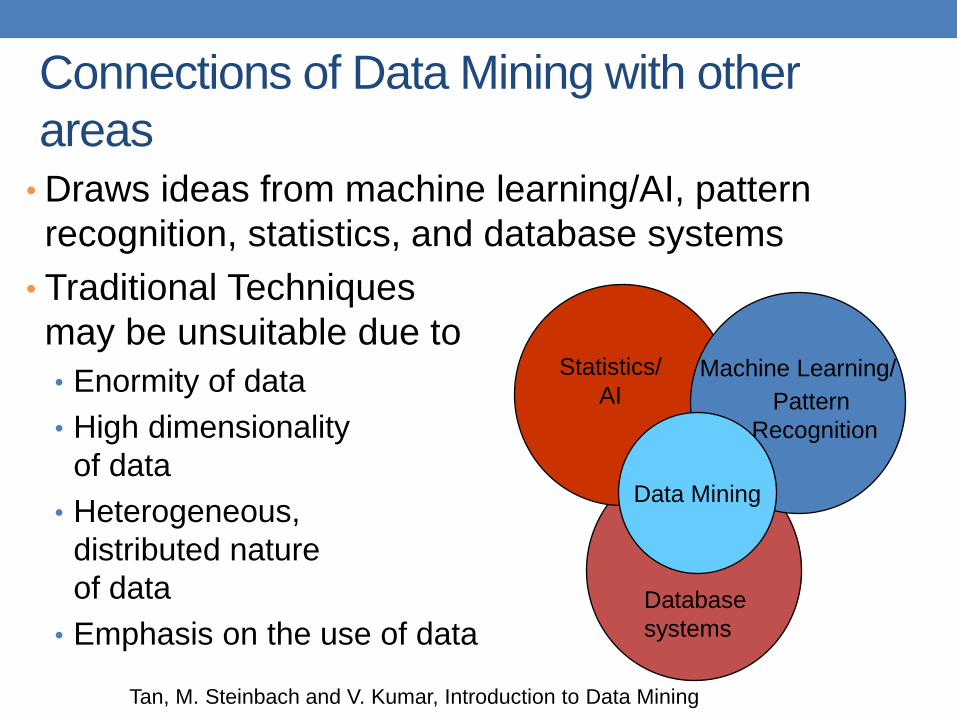
• Draws ideas from machine learning/AI, pattern
recognition, statistics, and database systems
• Traditional Techniques
may be unsuitable due to
• Enormity of data
• High dimensionality
of data
• Heterogeneous,
distributed nature
of data
• Emphasis on the use of data
Connections of Data Mining with other
areas
Machine Learning/
Pattern
Recognition
Statistics/
AI
Data Mining
Database
systems
Tan, M. Steinbach and V. Kumar, Introduction to Data Mining
48
Cultures
• Databases: concentrate on large-scale (non-
main-memory) data.
• AI (machine-learning): concentrate on complex
methods, small data.
• In today’s world data is more important than algorithms
• Statistics: concentrate on models.
CS345A Data Mining on the Web: Anand Rajaraman, Jeff Ullman
49
Models vs. Analytic Processing
• To a database person, data-mining is an
extreme form of analytic processing – queries
that examine large amounts of data.
• Result is the query answer.
• To a statistician, data-mining is the inference of
models.
• Result is the parameters of the model.
CS345A Data Mining on the Web: Anand Rajaraman, Jeff Ullman
50
(Way too Simple) Example
• Given a billion numbers, a DB person would
compute their average and standard deviation.
• A statistician might fit the billion points to the best
Gaussian distribution and report the mean and
standard deviation of that distribution.
CS345A Data Mining on the Web: Anand Rajaraman, Jeff Ullman
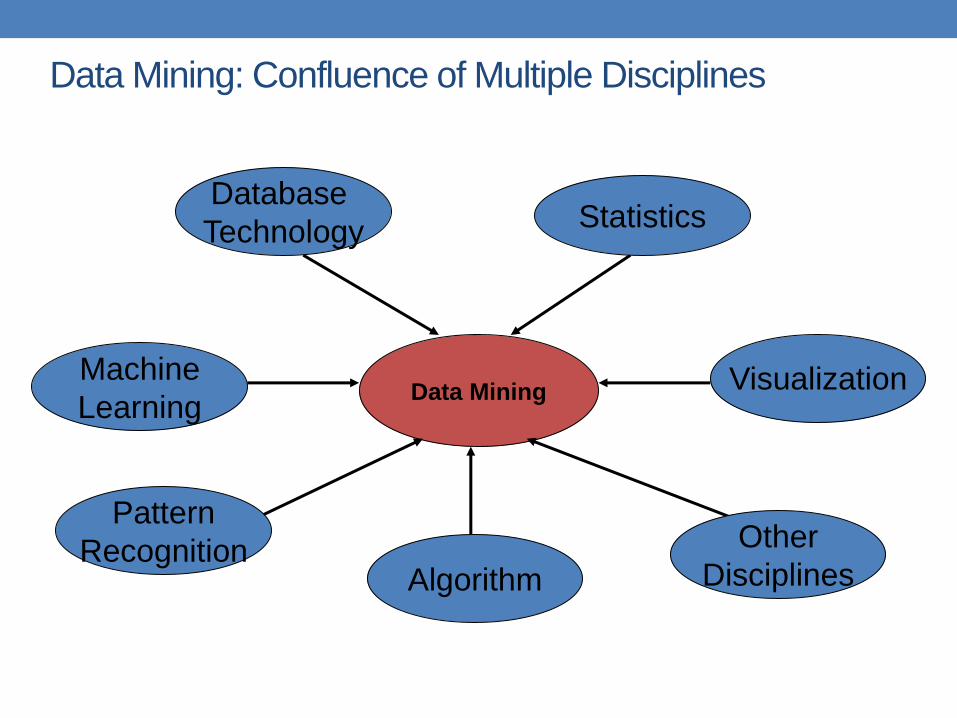
Data Mining: Confluence of Multiple Disciplines
Data Mining
Database
Technology Statistics
Machine
Learning
Pattern
Recognition Algorithm
Other
Disciplines
Visualization
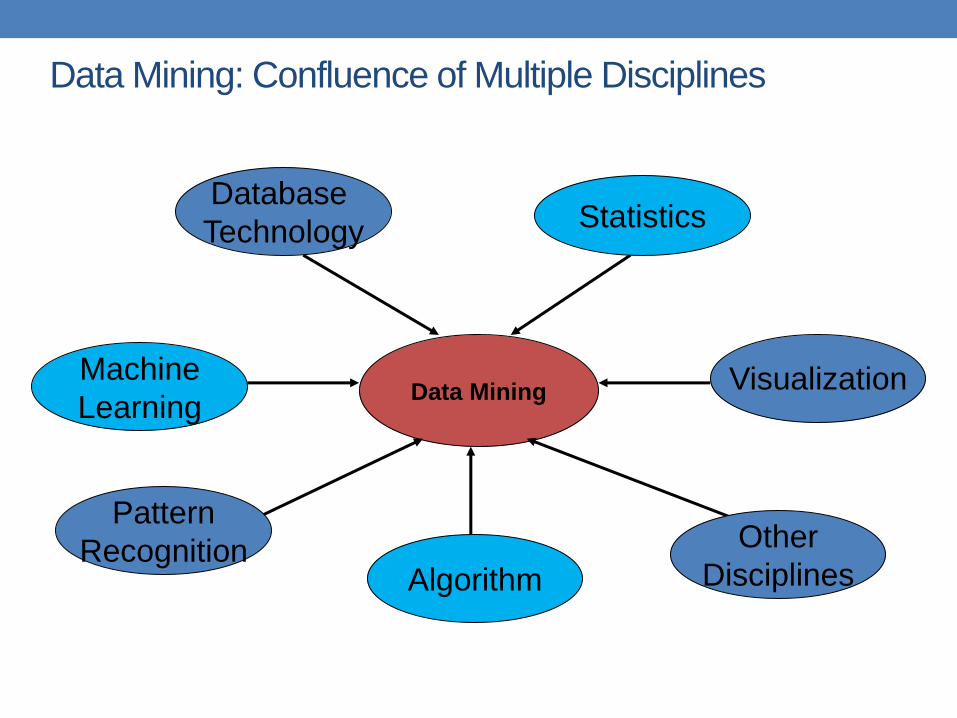
Data Mining: Confluence of Multiple Disciplines
Data Mining
Database
Technology Statistics
Machine
Learning
Pattern
Recognition Algorithm
Other
Disciplines
Visualization
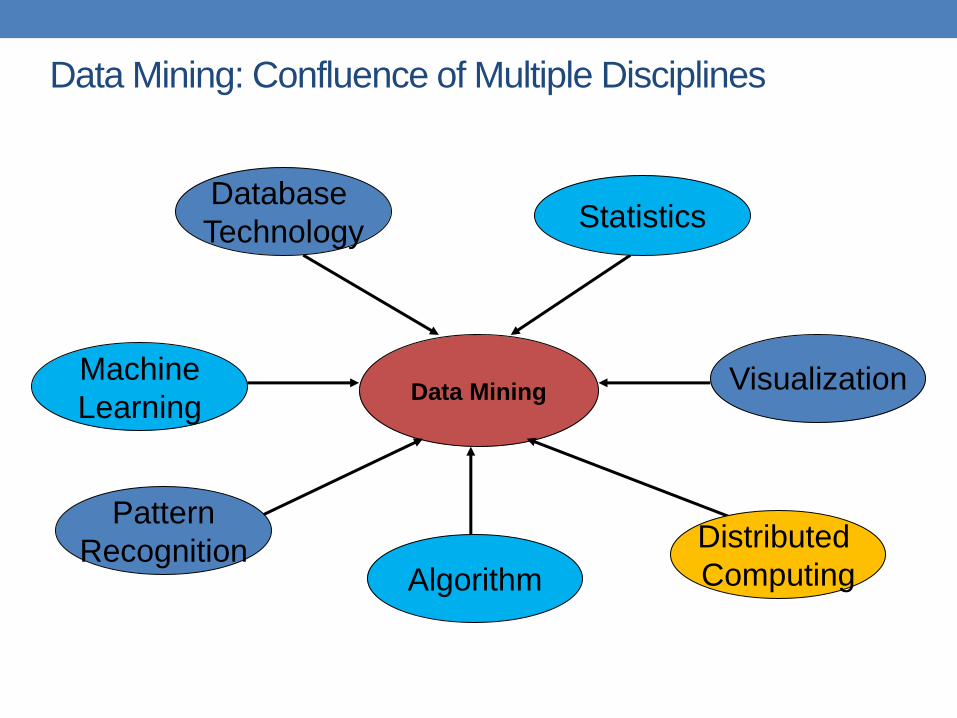
Data Mining: Confluence of Multiple Disciplines
Data Mining
Database
Technology Statistics
Machine
Learning
Pattern
Recognition Algorithm
Distributed
Computing
Visualization
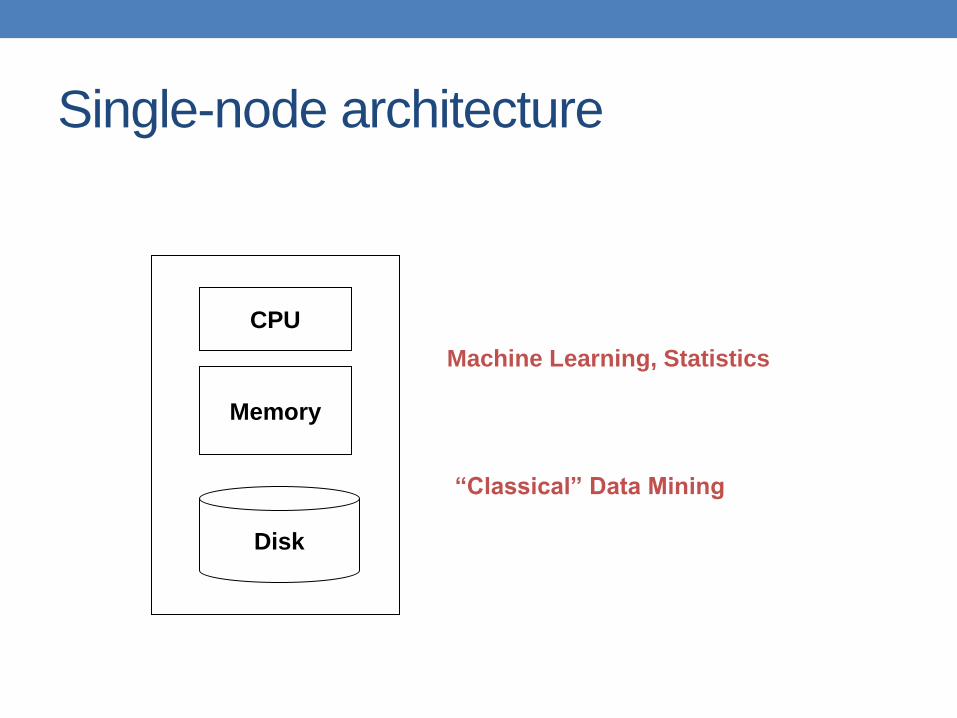
Single-node architecture
Memory
Disk
CPU
Machine Learning, Statistics
“Classical” Data Mining
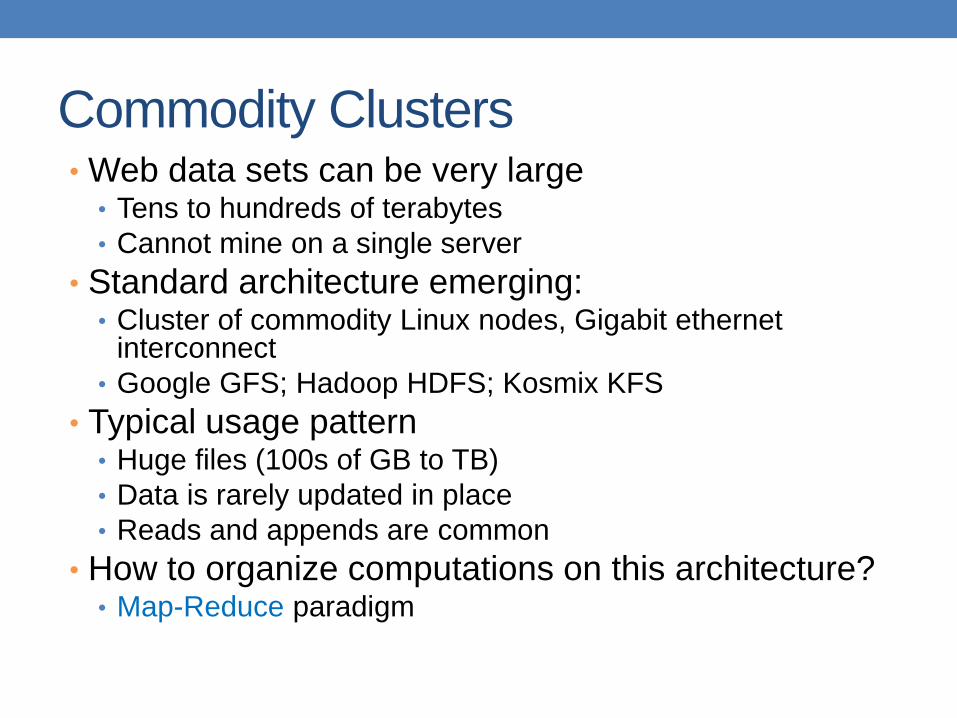
Commodity Clusters • Web data sets can be very large
• Tens to hundreds of terabytes
• Cannot mine on a single server
• Standard architecture emerging: • Cluster of commodity Linux nodes, Gigabit ethernet
interconnect
• Google GFS; Hadoop HDFS; Kosmix KFS
• Typical usage pattern • Huge files (100s of GB to TB)
• Data is rarely updated in place
• Reads and appends are common
• How to organize computations on this architecture? • Map-Reduce paradigm
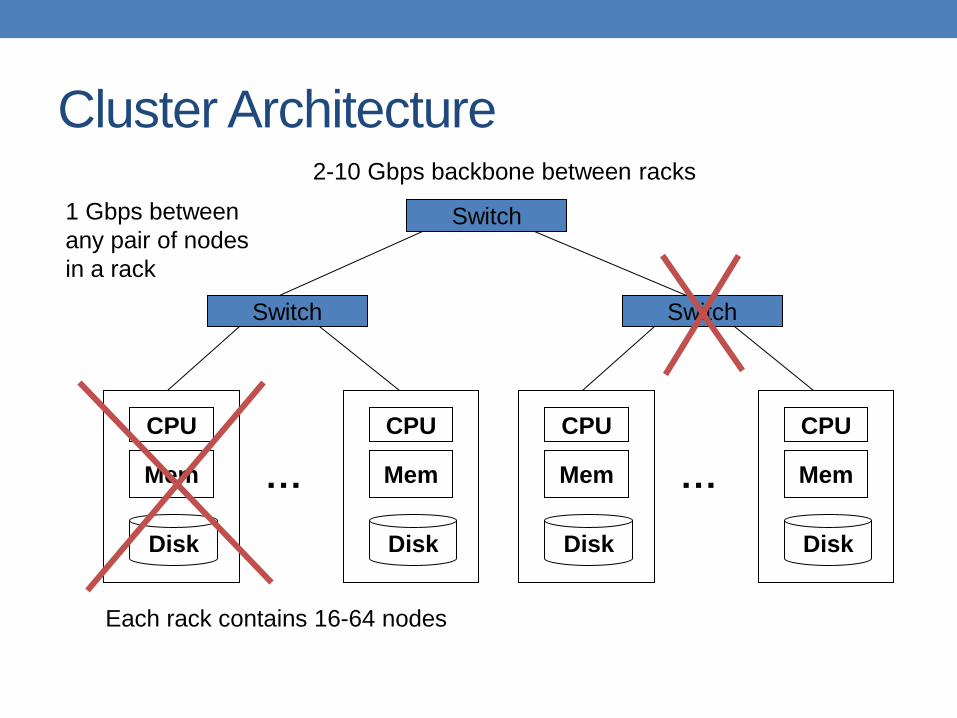
Cluster Architecture
Mem
Disk
CPU
Mem
Disk
CPU
…
Switch
Each rack contains 16-64 nodes
Mem
Disk
CPU
Mem
Disk
CPU
…
Switch
Switch 1 Gbps between
any pair of nodes
in a rack
2-10 Gbps backbone between racks
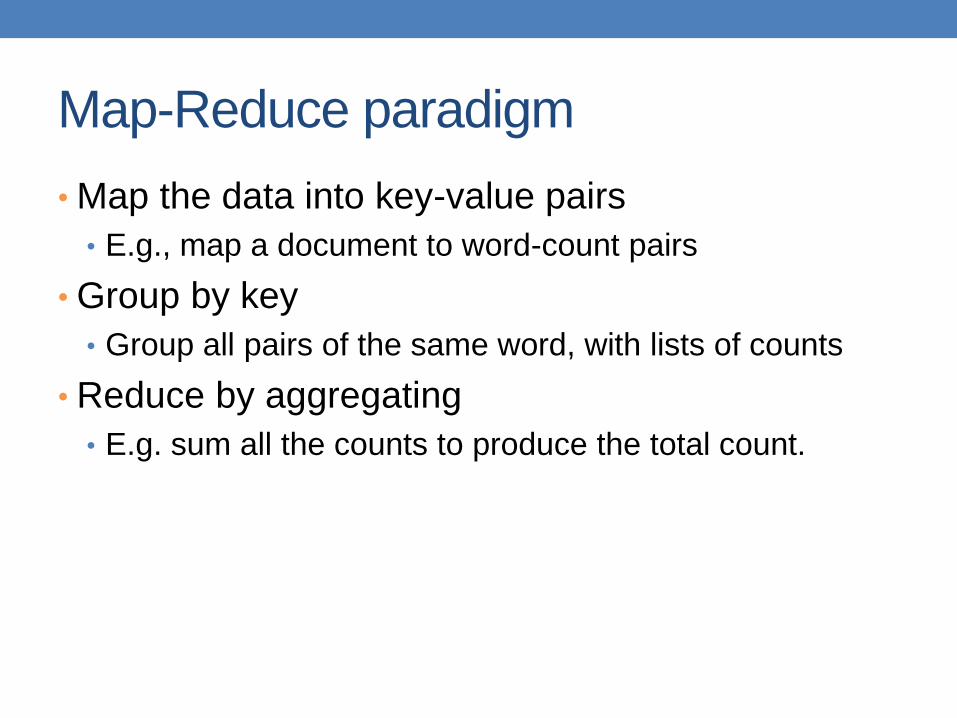
Map-Reduce paradigm
• Map the data into key-value pairs
• E.g., map a document to word-count pairs
• Group by key
• Group all pairs of the same word, with lists of counts
• Reduce by aggregating
• E.g. sum all the counts to produce the total count.
The data analysis pipeline
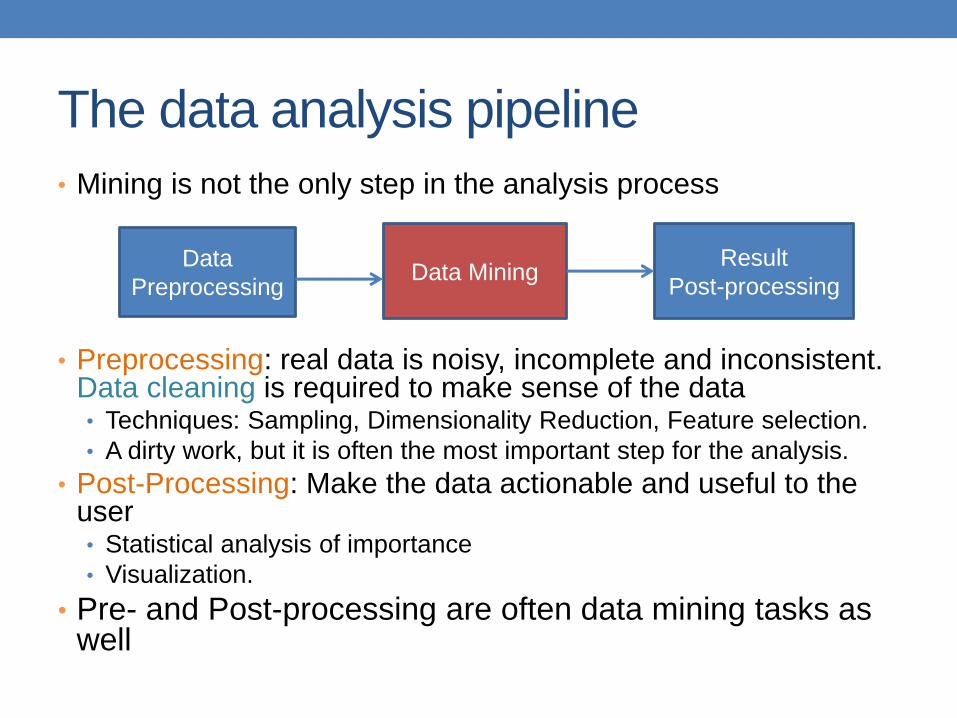
• Mining is not the only step in the analysis process
• Preprocessing: real data is noisy, incomplete and inconsistent. Data cleaning is required to make sense of the data • Techniques: Sampling, Dimensionality Reduction, Feature selection.
• A dirty work, but it is often the most important step for the analysis.
• Post-Processing: Make the data actionable and useful to the user • Statistical analysis of importance
• Visualization.
• Pre- and Post-processing are often data mining tasks as well
Data
Preprocessing Data Mining
Result
Post-processing
Data Quality
• Examples of data quality problems:
• Noise and outliers
• missing values
• duplicate data
Sampling
• Sampling is the main technique employed for data selection. • It is often used for both the preliminary investigation of the data and
the final data analysis.
• Statisticians sample because obtaining the entire set of data of interest is too expensive or time consuming.
• Sampling is used in data mining because processing the entire set of data of interest is too expensive or time consuming.
Sampling …
• The key principle for effective sampling is the
following:
• using a sample will work almost as well as using the
entire data sets, if the sample is representative
• A sample is representative if it has approximately the
same property (of interest) as the original set of data
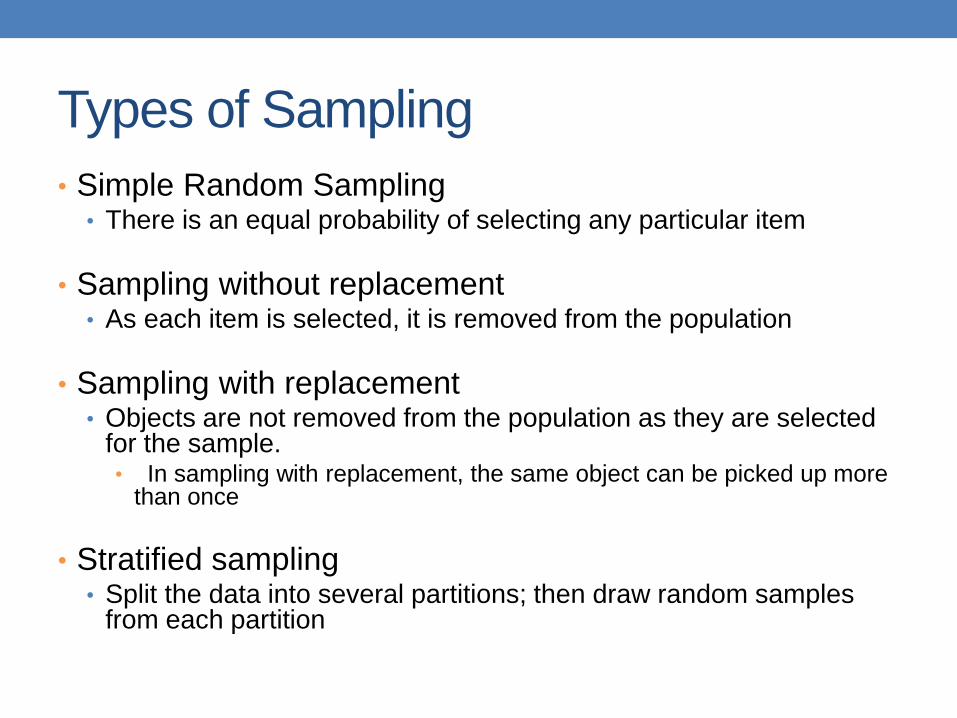
Types of Sampling
• Simple Random Sampling • There is an equal probability of selecting any particular item
• Sampling without replacement • As each item is selected, it is removed from the population
• Sampling with replacement • Objects are not removed from the population as they are selected
for the sample. • In sampling with replacement, the same object can be picked up more
than once
• Stratified sampling • Split the data into several partitions; then draw random samples
from each partition
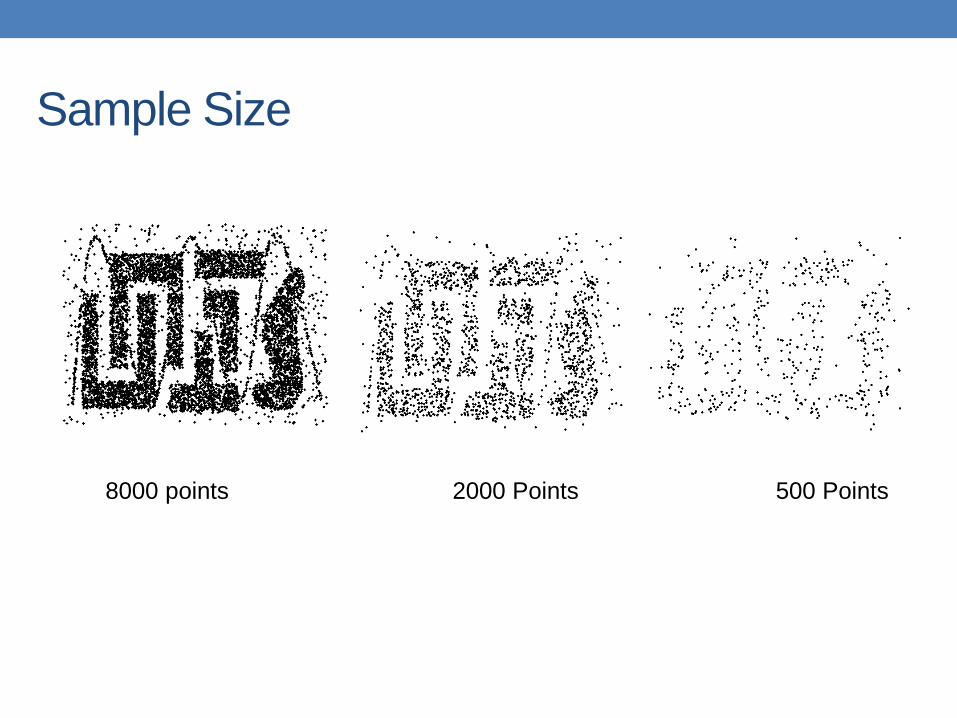
Sample Size
8000 points 2000 Points 500 Points
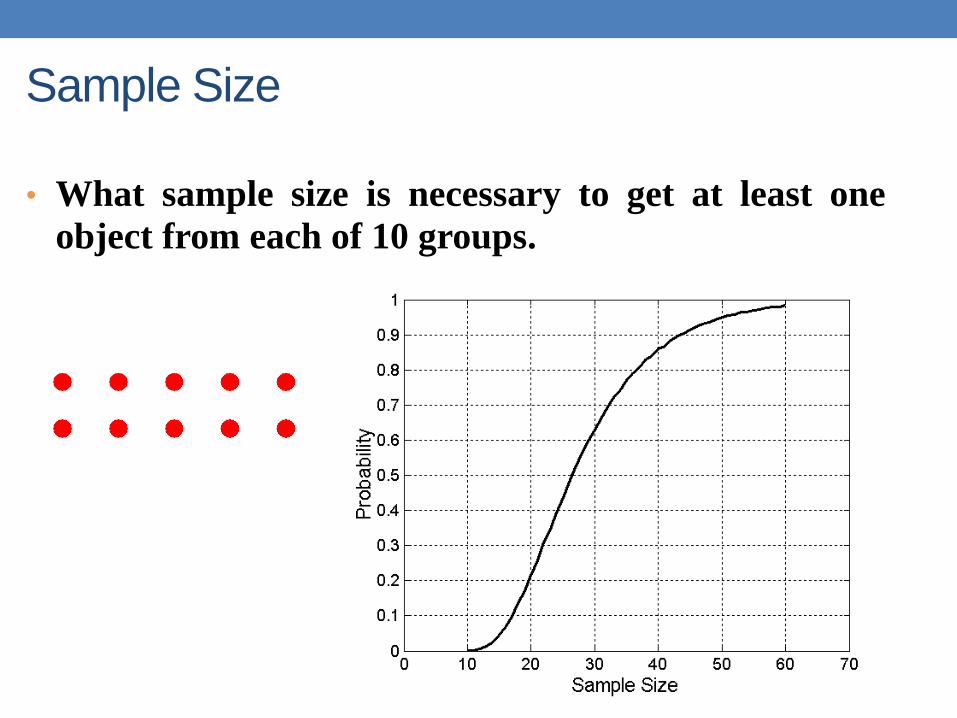
Sample Size
• What sample size is necessary to get at least one
object from each of 10 groups.
A data mining challenge
• You are reading a stream of integers, and you want to sample one integer uniformly at random but you do not know the size (N) of the stream in advance. You can only keep a constant amount of integers in memory
• How do you sample? • Hint: the last integer in the stream should have probability
1/N to be selected.
• Reservoir Sampling: • Standard interview question
66
Meaningfulness of Answers
• A big data-mining risk is that you will “discover”
patterns that are meaningless.
• Statisticians call it Bonferroni’s principle:
(roughly) if you look in more places for
interesting patterns than your amount of data
will support, you are bound to find crap.
• The Rhine Paradox: a great example of how
not to conduct scientific research.
CS345A Data Mining on the Web: Anand Rajaraman, Jeff Ullman
67
Rhine Paradox – (1)
• Joseph Rhine was a parapsychologist in the
1950’s who hypothesized that some people had
Extra-Sensory Perception.
• He devised (something like) an experiment where
subjects were asked to guess 10 hidden cards –
red or blue.
• He discovered that almost 1 in 1000 had ESP –
they were able to get all 10 right!
CS345A Data Mining on the Web: Anand Rajaraman, Jeff Ullman
68
Rhine Paradox – (2)
• He told these people they had ESP and called
them in for another test of the same type.
• Alas, he discovered that almost all of them had
lost their ESP.
• What did he conclude?
• Answer on next slide.
CS345A Data Mining on the Web: Anand Rajaraman, Jeff Ullman
69
Rhine Paradox – (3)
• He concluded that you shouldn’t tell people they
have ESP; it causes them to lose it.
CS345A Data Mining on the Web: Anand Rajaraman, Jeff Ullman