Embed Size (px)
Citation preview

©2004 Data Miners, Inc.http://www.data-miners.com 2
What to Expect from this Talk
Background on survival analysis from a data miner’s perspectiveIntroduction to key ideas in survival analysis– hazards– survival– competing risks
Lots of examples– Stratification– Quantifying Loyalty Effort– Voluntary and Involuntary Churn– Forecasting– Time to Reactivation and Re-purchase

©2004 Data Miners, Inc.http://www.data-miners.com 3
Who Am I?
I am not a statisticianAdept with databases and advanced algorithmsFounded Data Miners with Michael Berry in 1998We have written three books on data miningHave become very interested in survival analysis for mining customer data – survival data mining

©2004 Data Miners, Inc.http://www.data-miners.com 4
What Does Data Mining Really Do?
Provides ways to quantitatively measure what business users know or should know qualitatively
Connects data to business practices
Used to understand customers
Occasionally, produces interesting predictive models

©2004 Data Miners, Inc.http://www.data-miners.com 5
Data Mining Is About Customers
Customer Relationship LifetimeNew
CustomerEstablishedCustomer
FormerCustomerProspect
Events • Initial Purchase•Sign-Up
•2nd Purchase•Usage
•Failure to Pay•Voluntary Churn
Customers Evolve Over Time

©2004 Data Miners, Inc.http://www.data-miners.com 6
The State of the Customer Relationship Changes Over Time
Starts P1
P1 P2
P2 P1STOP
Starts P1P1 P2
Starts P1
P1 P3
P3 P1
STOP

©2004 Data Miners, Inc.http://www.data-miners.com 7
Traditional Approach to Data Mining Uses Predictive Modeling
JulJan Feb Mar Apr May Jun Aug Sep
4 3 2 1 +1Model Set
Score Set 4 3 2 1 +1Data to build the model comes from the pastPredictions for some fixed period in the futurePresent when new data is scoredModels built with decision trees, neural networks, logistic regression, regression, and so on

©2004 Data Miners, Inc.http://www.data-miners.com 8
Survival Data Mining Adds the Element of When Things Happen
Time-to-event analysis
Terminology comes from the medical world– which patients survive a treatment, which patients do not
Can measure effects of variables (initial covariates or time-dependent covariates) on survival time
Natural for understanding customers
Can be used to quantify marketing efforts
©2004 Data Miners, Inc.http://www.data-miners.com 9
Example Results (Made Up)
99.9% of Life bulbs will last 2000 hoursMean-time-to-failure for hard disk is 500,000 hours“A recent study published in the American Journal of Public Health found that ‘life expectancy’ among smokers who quit at age 35 exceeded that of continuing smokers by 6.9 to 8.5 years for men and 6.1 to 7.7 years for women.” [www.med.upenn.edu/tturc/pdf/benefits.pdf ]– Example of initial covariate
Stopping smoking before age 50 increases lifespan by one year for every decade before 50

©2004 Data Miners, Inc.http://www.data-miners.com 10
Original Statistics
Life table methods used by actuaries for a long, long time– These the are the methods we will be focused on
Applied with vigor to medicine in the mid-20th CenturyApplied with vigor to manufacturing during 20th Century as wellTook off with Sir David Cox’s Proportion Hazards Models in 1972 that provide effects of initial covariates

©2004 Data Miners, Inc.http://www.data-miners.com 11
Survival for Marketing Has Some Differences
We are happy with discrete time (probability vs rate)– Traditional survival analysis uses continuous time
Marketers have hundreds of thousands or millions of examples– Traditional survival analysis might be done on dozens or
hundreds of participants
We have the benefit of a wealth of data– Traditional survival analysis looks at factors incorporated
into the study
We have to deal with “window” effects due to business practices and database reality– Traditional survival ignores left truncation

©2004 Data Miners, Inc.http://www.data-miners.com 12
To Understand the Calculation, Let’s Focus on the End of the Relationship
START STOPtenure is the duration of the relationship
Challenge defining beginning of customer relationship
Challenge defining end of customer relationship
Challenge finding either in customer databases
©2004 Data Miners, Inc.http://www.data-miners.com 13
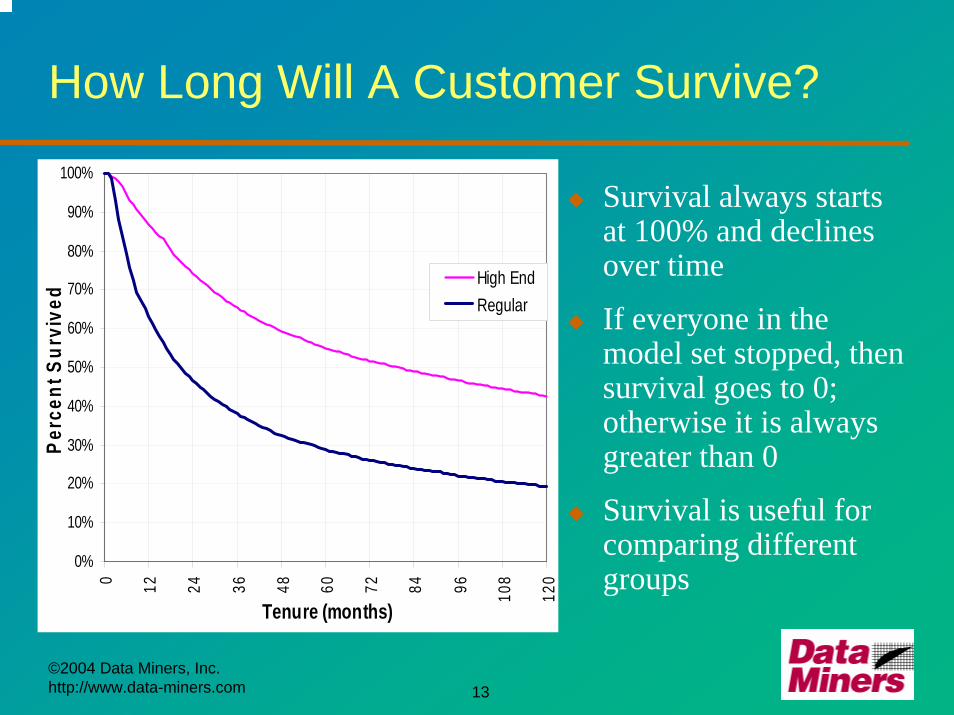
How Long Will A Customer Survive?
Survival always starts at 100% and declines over time
If everyone in the model set stopped, then survival goes to 0; otherwise it is always greater than 0
Survival is useful for comparing different groups
0%
10%
20%
30%
40%
50%
60%
70%
80%
90%
100%
0 12 24 36 48 60 72 84 96 108
120
Tenure (months)
Perc
ent S
urvi
ved High End
Regular

©2004 Data Miners, Inc.http://www.data-miners.com 14
Key Idea: Data is Censored
time
Known Customer
Start
Known tenure when customers stop
Unknown tenure for active customers
(censored)

©2004 Data Miners, Inc.http://www.data-miners.com 15
Use Censored Data to Calculate Hazard Probabilities
Hazard, h(t), at time t is the probability that a customer who has survived to time t will not survive to time t+1
h(t) =
Value of hazard depends on units of time – days, weeks, months, yearsDiffers from traditional definition because time is discrete – hazard probability not hazard rate
# customers who stop at exactly time t# customers at risk of stopping at time t

©2004 Data Miners, Inc.http://www.data-miners.com 16
Bathtub Hazard(Risk of Dying by Age)
Bathtub hazard starts high, goes down, and then increases again
Example from US mortality tables shows probability of dying at a given age
0.0%
0.5%
1.0%
1.5%
2.0%
2.5%
3.0%
0-1
yrs
1-4
yrs
5-9
yrs
10-1
4 yr
s15
-19
yrs
20-2
4 yr
s25
-29
yrs
30-3
4 yr
s35
-39
yrs
40-4
4 yr
s45
-49
yrs
50-5
4 yr
s55
-59
yrs
60-6
4 yr
s65
-69
yrs
70-7
4 yr
sAge (Years)
Haza
rd

©2004 Data Miners, Inc.http://www.data-miners.com 17
Hazards Are Like An X-Ray Into Customers
0.00%
0.05%
0.10%
0.15%
0.20%
0.25%
0.30%
0 60 120 180 240 300 360 420 480 540 600 660 720
Tenure (Days)
Haz
ard
(Dai
ly R
isk
of C
hurn
)
Peak here is for non-payment and end of
initial promotion
Bumpiness is due to within week variation

©2004 Data Miners, Inc.http://www.data-miners.com 18
Hazards Can Show Interesting Features of the Customer Lifecycle
0%
1%
2%
3%
4%
5%
6%
7%
8%0 30 60 90 120
150
180
210
240
270
300
330
360
390
420
450
480
510
540
570
600
630
660
690
720
750
780
810
840
870
900
930
960
990
Tenure (Days After Start)
Dai
ly C
hurn
Haz
ard
Peak here is for non-payment after one year
Peak here is for non-payment after two years

©2004 Data Miners, Inc.http://www.data-miners.com 19
How Long Will A Customer Survive?
Survival analysis answers the question by rephrasing it slightly:– What proportion of customers survive to time t?
Survival at time t, S(t), is the probability that a customer will survive exactly to time tCalculation:– S(t) = S(t – 1) * (1 – h(t – 1))– S(0) = 100%
Given a set of hazards by time, survival can be easily calculated in SAS or a spreadsheet

©2004 Data Miners, Inc.http://www.data-miners.com 20
Survival is Similar to Retention
0%
10%
20%
30%
40%
50%
60%
70%
80%
90%
100%
0 10 20 30 40 50 60 70 80 90 100 110
Tenure (Weeks)
Rete
ntio
n/Su
rviv
al
Retention is jagged.It is calculated on customers who started exactly w weeks ago.
Survival is smooth.It is calculated using customers who started up to w weeks ago.

©2004 Data Miners, Inc.http://www.data-miners.com 21
Why Survival is Useful
Compare hazards for different groups of customers Calculate median time to event– How long does it take for half the customers to
leave?
Calculate truncated mean tenure– What is the average customer tenure for the first
year after starting? For the first two years?– Can be used to quantify effects

©2004 Data Miners, Inc.http://www.data-miners.com 22
Median Lifetime is the Tenure Where Survival = 50%
0%
10%
20%
30%
40%
50%
60%
70%
80%
90%
100%
0 12 24 36 48 60 72 84 96 108
120
Tenure (months)
Perc
ent S
urvi
ved High End
Regular

©2004 Data Miners, Inc.http://www.data-miners.com 23
Average Tenure Is The Area Under The Curves
0%
10%
20%
30%
40%
50%
60%
70%
80%
90%
100%
0 12 24 36 48 60 72 84 96 108
120
Tenure
Perc
ent S
urvi
ved High End
Regular
average 10-year tenurehigh end customers =73 months (6.1 years)
average 10-year tenureregular customers =
44 months (3.7 years)
©2004 Data Miners, Inc.http://www.data-miners.com 24
Survival to Quantify Marketing Efforts
A company has a loyalty marketing effort designed to keep customers
This effort costs money
What is the value of the effort as measured in increased customer lifetimes?
SOLUTION: survival analysis– How much longer to customers survive after accepting the
offer?– How to quantify this in dollars and cents?

©2004 Data Miners, Inc.http://www.data-miners.com 25
Loyalty Offers is an Example of a Time-Dependent Covariate
time
Time = 0 Time = n Time c
Open Circle indicates that customer has
stopped before (or on) the analysis
date
Non-Responders have no “loyalty” date
Responders have a “loyalty” date

©2004 Data Miners, Inc.http://www.data-miners.com 26
We Can Use Area to Quantify Results
65%
70%
75%
80%
85%
90%
95%
100%
0 2 4 6 8 10 12 14 16 18
Months After Intervention
Perc
ent R
etai
ned
Group 1 Group 2
How much is this
difference worth?
Chart shows survival after loyalty offer acceptance compared to similar group not given offer

©2004 Data Miners, Inc.http://www.data-miners.com 27
We Can Use Area to Quantify Results
Increase in survival is given by the area between the curves.For the first year, area of triangle is a good enough estimate
65%
70%
75%
80%
85%
90%
95%
100%
0 2 4 6 8 10 12 14 16 18
Months After Intervention
Perc
ent R
etai
ned
Group 1 Group 2
93.4%
85.6%
Note: there are easy ways to calculate the exact value
©2004 Data Miners, Inc.http://www.data-miners.com 28
Loyalty-Responsive Customers Are Doing Better Than Others
Survival for first year after loyalty intervention– Group 1: 93.4%– Group 2: 85.6%– Increase for Group 1: 7.8%
Average increase in lifetime for first year is 3.9% (assuming the 7.8% would have stayed, on average, 6 months)Assuming revenue of $400/year, loyalty responsive contribute an additional revenue of $15.60 during the first yearThis actually compares favorably to cost of loyalty program

©2004 Data Miners, Inc.http://www.data-miners.com 29
Competing Risks: Customers May Leave for Many Reasons
Customers may cancel– Voluntarily– Involuntarily– Migration
Survival Analysis Can Show Competing Risks– overall S(t) is the product of Sr(t) for all risks
We’ll walk through an example– Overall survival– Competing risks survival– Competing risks hazards– Stratified competing risks survival

©2004 Data Miners, Inc.http://www.data-miners.com 30
Overall Survival for a Group of Customers
0%
10%
20%
30%
40%
50%
60%
70%
80%
90%
100%
0 30 60 90 120 150 180 210 240 270 300 330 360 390 420 450 480 510 540 570 600
OverallSharp drop during this period, otherwise
smooth

©2004 Data Miners, Inc.http://www.data-miners.com 31
Competing Risks for Voluntary and Involuntary Churn
0%
10%
20%
30%
40%
50%
60%
70%
80%
90%
100%
0 30 60 90 120 150 180 210 240 270 300 330 360 390 420 450 480 510 540 570 600
Involuntary
Voluntary
Overall
Steep drop is associated with
involuntary churn
Survival for each risk is always greater than
overall survival

©2004 Data Miners, Inc.http://www.data-miners.com 32
What the Hazards Look Like
0%
1%
2%
3%
4%
5%
6%
7%
8%
9%
0 30 60 90 120 150 180 210 240 270 300 330 360 390 420 450 480 510 540 570 600
Involuntary
Voluntary
As expected, steep drop has a very high
hazard

©2004 Data Miners, Inc.http://www.data-miners.com 33
Most Involuntary Churn is fromNon Credit Card Payers
0%
10%
20%
30%
40%
50%
60%
70%
80%
90%
100%
0 30 60 90 120 150 180 210 240 270 300 330 360 390 420 450 480 510 540 570 600
Involuntary-CC
Voluntary-CC
Involuntary-Other
Voluntary-Other
Steep drop associated only with non-credit card
payers

©2004 Data Miners, Inc.http://www.data-miners.com 34
Time to Reactivation
When a customer stops, often they come back –this is winback or reactivation
In this case, the “initial condition” is the stop
The “final condition” is the restart
Not all customers restart

©2004 Data Miners, Inc.http://www.data-miners.com 35
Survival Can Be Applied to Other Events: Reactivation
0%
10%
20%
30%
40%
50%
60%
70%
80%
90%
100%
0 30 60 90 120 150 180 210 240 270 300 330 360
Days After Deactivation
Surv
ival
(Rem
ain
Dea
ctiv
ated
)
0%
1%
2%
3%
4%
5%
6%
7%
8%
9%
10%
Hazard Probability
("Risk" of Reactivating)

©2004 Data Miners, Inc.http://www.data-miners.com 36
Time to Next Order
In retailing type businesses, customers make multiple purchases
Survival analysis can be applied here, too
The question is: how long to the next purchase?
Initial state is: date of purchase
Final state is: date of next purchase
It is better to look at 1 – survival rather than survival

©2004 Data Miners, Inc.http://www.data-miners.com 37
Time to Next Purchase, Stratified by Number of Previous Purchases
0%
5%
10%
15%
20%
25%
30%
35%
40%
45%
50%
0 30 60 90 120 150 180 210 240 270 300 330 360 390 420 450 480
05-->06
04-->05
03-->04
02-->03
ALL
01-->02
©2004 Data Miners, Inc.http://www.data-miners.com 38
Customer-Centric Forecasting Using Survival Analysis
Forecasting customer numbers is important in many businessesSurvival analysis makes it possible to do the forecasts at the finest level of granularity – the customer levelSurvival analysis makes it possible to incorporate customer-specific factorsCan be used to estimate restarts as well as stops

©2004 Data Miners, Inc.http://www.data-miners.com 39
Using Survival for Customer Centric Forecasting
0102030405060708090
100110120130
Day of Month1 3 5 7 9 11 13 15 17 19 21 23 25 27 29
Number Actual Predicted

©2004 Data Miners, Inc.http://www.data-miners.com 40
The Forecasting Solution is a Bit Complicated
ExistingCustomer
Base
New StartForecast
Do Existing BaseForecast (EBF)
Do New StartForecast (NSF)
Do Existing BaseChurn Forecast
(EBCF)
Do New Start ChurnForecast (NSCF)
Existing CustomerBase Forecast
New StartForecast
ChurnForecast
ChurnActuals
Compare
©2004 Data Miners, Inc.http://www.data-miners.com 41
Survival Data Mining Connects Data to Business Needs
Provides ways to quantitatively measure what business users know or should know qualitativelyConnects data to business practicesTechniques such as survival analysis provide new ways of looking at customersTechniques such as customer-centric forecasting integrate data mining with business processes such as forecasting