Embed Size (px)
Citation preview

DATA MINING
Team #1Kristen Durst
Mark GillespieBanan Mandura
University of Dayton MBA 664 13 APR 09

MBA 664, Team #1 2
Data Mining: Outline
• Introduction• Applications / Issues• Products• Process• Techniques• Example

MBA 664, Team #1 3
Introduction
• Data Mining Definition– Analysis of large amounts of digital data– Identify unknown patterns, relationships– Draw conclusions AND predict future
• Data Mining Growth– Increase in computer processing speed– Decrease in cost of data storage

MBA 664, Team #1 4
Introduction
• High Level Process– Summarize the Data– Generate Predictive Model– Verify the Model
• Analyst Must Understand– The business– Data and its origins– Analysis methods and results– Value provided

MBA 664, Team #1 5
Applications / Issues
• Applications – Telecommunications
• Cell phone contract turnover– Credit Card
• Fraud identification– Finance
• Corporate performance– Retail
• Targeting products to customers
• Legal and Ethical Issues– Aggregation of data to track individual behavior

MBA 664, Team #1 6
Data Mining Products
• Angoss Software (www.angoss.com)– Knowledge Seeker/Studio– Strategy Builder
• Infor Global Solutions (www.infor.com)– Infor CRM Epiphany
• Portrait Software (www.portraitsoftware.com)• SAS Institute (www.sas.com)
– SAS Enterprise Miner– SAS Analytics
• SPSS Inc (www.spss.com)– Clementine
MBA 664, Team #1 7
Angoss Knowledge Studio

MBA 664, Team #1 8
SAS Institute

MBA 664, Team #1 9
SPSS Inc.

MBA 664, Team #1 10
Data Mining Process
• No uniformly accepted practice• 2002 www.KDnuggets.com survey
– SPSS CRISP-DM– SAS SEMMA

MBA 664, Team #1 11
Data Mining Process
• SPSS CRISP-DM– CRoss Industry Standard Process for Data
Modeling– Consortium: Daimler-Chrysler, SPSS, NCR– Hierarchical Process – Cyclical and Iterative

MBA 664, Team #1 12
Data Mining Process
• CRISP-DM

MBA 664, Team #1 13
Data Mining Process
• SAS SEMMA– Model development is focus– User defines problem, conditions data outside
SEMMA• Sample – portion data, statistically• Explore – view, plot, subgroup• Modify – select, transform, update• Model – fit data, any technique• Assess – evaluate for usefulness

MBA 664, Team #1 14
Data Mining Process
• Common Steps in Any DM Process– 1. Problem Definition– 2. Data Collection– 3. Data Review– 4. Data Conditioning– 5. Model Building– 6. Model Evaluation– 7. Documentation / Deployment

MBA 664, Team #1 15
Data Mining Techniques
• Statistical Methods (Sample Statistics, Linear Regression)
• Nearest Neighbor Prediction• Neural Network• Clustering/Segmenting• Decision Tree

MBA 664, Team #1 16
Statistical Methods
• Sample Statistics– Quick look at the data– Ex: Minimum, Maximum, Mean, Median, Variance
• Linear Regression– Easy and works with simple problems– May need more complex model using different
method

MBA 664, Team #1 17
Example: Linear Regression
Customer Income

MBA 664, Team #1 18
Nearest Neighbor Prediction
• Easy to understand• Used for predicting• Works best with few predictor variables• Based on the idea that something will behave
the same as how others “near” it behave• Can also show level of confidence in
prediction

MBA 664, Team #1 19
Distance from Competitor
Popu
latio
n of
City
B
A
A
A
AAA
AUB
BB B A
C
CC
C
Product Sales by Population of City and Distance from
Competitor
A: > 200 unitsB: 100 – 200 unitsC: < 100 units
Example: Nearest Neighbor

MBA 664, Team #1 20
Neural Network
• Contains input, hidden and output layer• Used when there are large amounts of
predictive variables• Model can be used again and again once
confirmed successful• Can be hard to interpret• Extremely time consuming to format the data

MBA 664, Team #1 21
Example: Neural Network
W1 =.36
W2 =.64
Population of City
Product SalesPrediction
Distance from Competitor
0.736

MBA 664, Team #1 22
Clustering/Segmenting
• Not used for prediction• Forms groups that are very similar or very
different• Gives an overall view of the data• Can also be used to identify potential
problems if there is an outlier

MBA 664, Team #1 23
Example: Clustering/Segmenting
< 40 years
>= 40 years
Red = Female
Blue = Male
Dimension A

MBA 664, Team #1 24
Decision Trees
• Uses categorical variables• Determines what variable is causing the
greatest “split” between the data• Easy to interpret• Not much data formatting • Can be used for many different situations

MBA 664, Team #1 25
Example: Decision Trees
FM
-.63n = 24
-.29n = 24
-.29n = 24
Change from original score
.14n = 115
.58n = 67
-.46n = 48
Baseline < 3.75
Baseline >= 3.75
M F
.76n = 51
.47n = 28
1.11n = 23
Largebody type
Smallbody type

MBA 664, Team #1 26
Data Mining Example1. Problem Definition
• Improve On-Time Delivery of New Products
On Time Delivery
0
0.05
0.1
0.15
0.2
0.25
0.3
0.35
0.4
-50
-45
-40
-35
-30
-25
-20
-15
-10 -5 1 6 11 16 21 26 31 36 41 46 51 56 61 66 71 76 81 86 91 96
Pro
bab
ility
Delivery Actual - f it
Delivery Required
MBA 664, Team #1 27
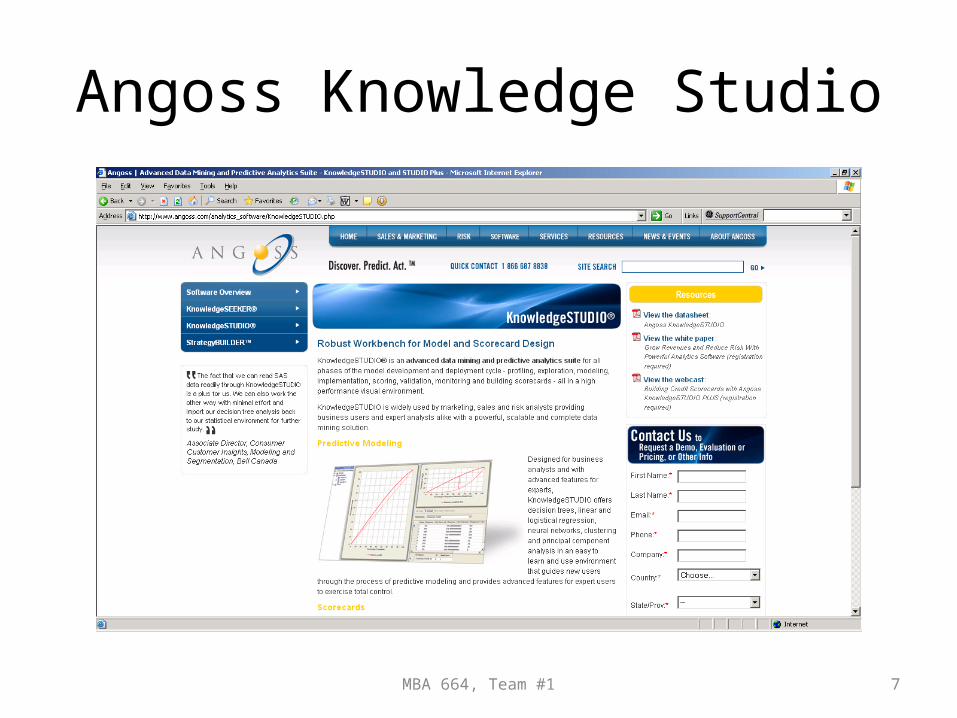
Data Mining Example2. Collect Data
Brainstorm Variation Sources Data Collection Plan
MBA 664, Team #1 28
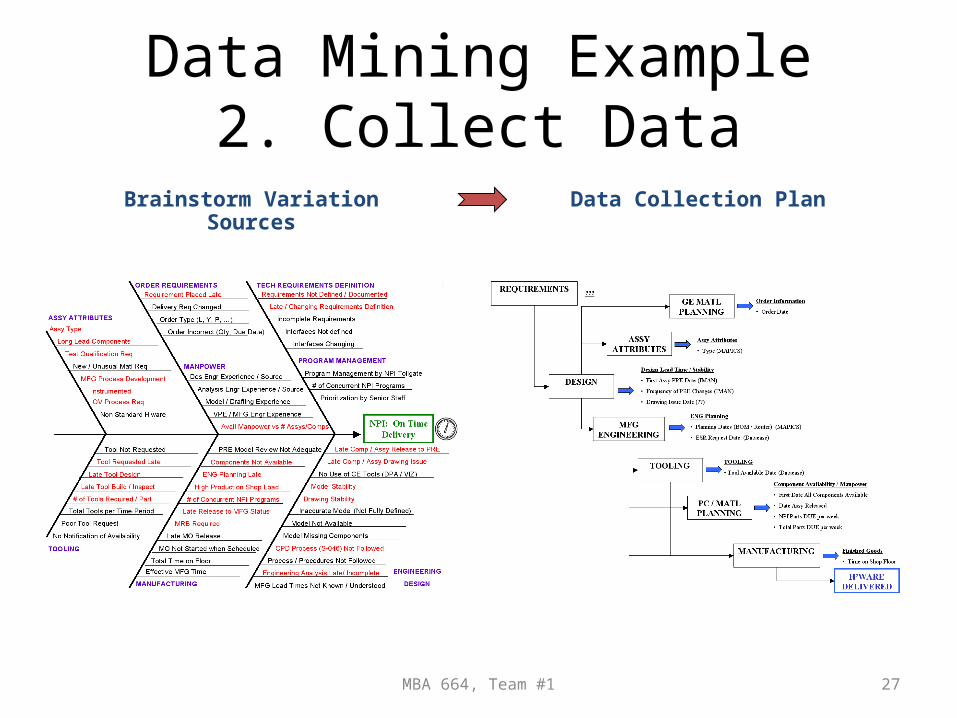
Data Mining Example3. Data Review
• Data Segments
TOTAL LEAD TIME by Part Type: p < .05
Level N Mean StDev ----+---------+---------+---------+--BRACKET 520 x6.76 x3.14 (--*-) DUCT 138 x6.70 x0.40 (----*---) MANIFOLD 44 x9.95 x4.68 (-------*-------) TUBE 47 x3.60 x2.79 (------*-------) ----+---------+---------+---------+--Pooled StDev = 68.47

MBA 664, Team #1 29
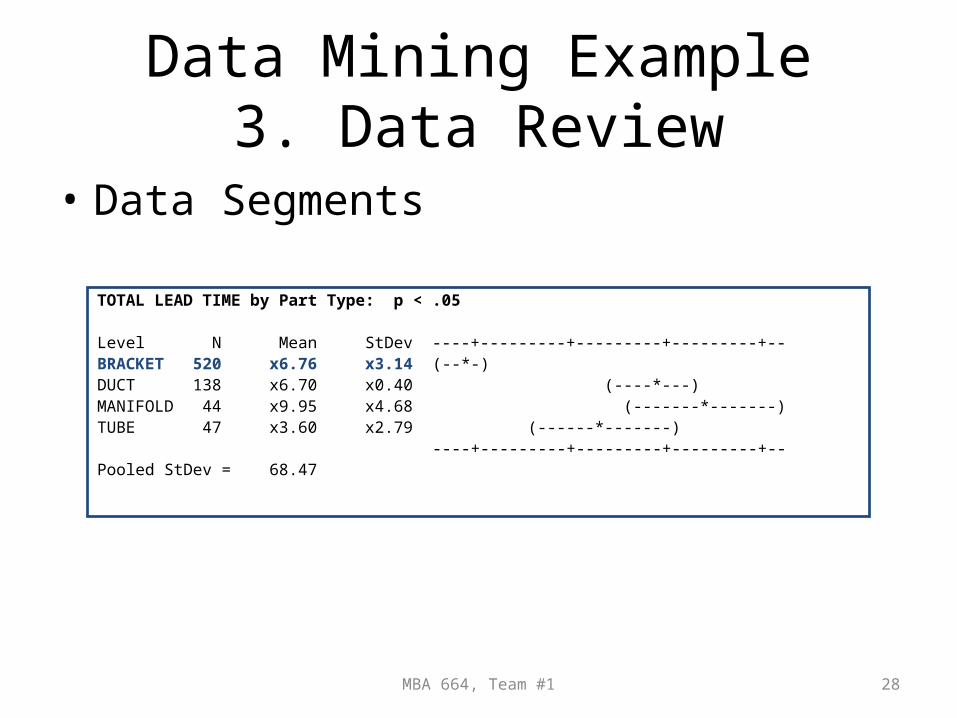
Data Mining Example5. Build Model
72.75
18.25
38114.3
38038.8
38131.5
38044.5
144
48
95.75
7.25
85.25
-20.25
-34.5
-155.5
21.5
-91.5
24.75
-43.75
SHIP_DUE
IR CREATE
BOM CREATE
BOMC_MODC
BOMC_MODP
BOMC_MODI
MODC_DUE
MODI_DUE
BOMC_DUE
MODI_MODC CAT MO_FINIS
CAT MO_START
CAT SCHED_ST
CAT MAN-DUE
CAT BOM_CR-D
CAT MOD_ISSU
CAT MODEL_CR
60
45
30
15
0
SH
IP-D
UE
Main Effects Plot - Data Means for SHIP-DUE

MBA 664, Team #1 30
Data Mining Example5. Build Model
ModelPRE
ModelPRE
0
DUE DATE
SHIP DATEBOM Create
- Time + Time
ComponentsAvailable
ComponentsAvailable
MANRelease
MANRelease
MOFinishMO
FinishScheduledMO Start
ScheduledMO Start
MOStartMO
StartModel / DWG
IssueModel / DWG
IssueIR
CreateIR
Create
X – make smaller
X – make more negative
Y – make smaller
X – make smaller
X – make smaller
X – make smaller
Model Create
52.8%
28.3%
8.4%7.1%
3.5%
SHIP-DUE = 7.97 + 0.269*(MODEL_CR-DUE) + 0.173*(CR-ISS) + 0.704*(MAN_BOMC) + 0.748*(SCH_ST-MAN) + 0.862*(MOS_MOFIN) [R^2A 4.4%] – {R^2A(1) 76.5%, R^2A(2) 68.0%}
Combined Model: 2 separate regressions Design and Manufacturing – combined thru a common term

MBA 664, Team #1 31
Data Mining Example6. Model Evaluation
Model Accurately Reflects Delivery Distribution
Overlay Chart
0
0.2
0.4
0.6
0.8
1
1.2
-49.
25
-34.
25
-19.
25
-4.2
5
10.7
5
25.7
5
40.7
5
55.7
5
70.7
5
85.7
5
Pro
bab
ility
SHIP DUE MODEL
SHIP DUE ACTUAL
Actual Delivery
Predicted Delivery
(Regression)

MBA 664, Team #1 32
Data Mining Example7. Document / Deploy
Design Release Required for On Time Delivery
Overlay Chart
0
0.2
0.4
0.6
0.8
1
1.2
-298
.00
-278
.00
-258
.00
-238
.00
-218
.00
-198
.00
-178
.00
-158
.00
-138
.00
-118
.00
-98.
00
-78.
00-5
8.00
-38.
00-1
8.00
2.00
22.0
0
42.0
062
.00
82.0
0
Pro
bab
ility
MODI ACT
modi calc new
Overlay Chart
0
0.2
0.4
0.6
0.8
1
1.2
-298
.00
-278
.00
-258
.00
-238
.00
-218
.00
-198
.00
-178
.00
-158
.00
-138
.00
-118
.00
-98.
00
-78.
00-5
8.00
-38.
00-1
8.00
2.00
22.0
0
42.0
062
.00
82.0
0
Pro
bab
ility
MODI ACT
modi calc new
Overlay Chart
0
0.2
0.4
0.6
0.8
1
1.2
-298
.00
-278
.00
-258
.00
-238
.00
-218
.00
-198
.00
-178
.00
-158
.00
-138
.00
-118
.00
-98.
00
-78.
00-5
8.00
-38.
00-1
8.00
2.00
22.0
0
42.0
062
.00
82.0
0
Pro
bab
ility
MODI ACT
modi calc new
Issue Required for On-Time Delivery
Issue Actual
Due Date

MBA 664, Team #1 33
Data Mining Example7. Document / Deploy
Update Planning and Automate TrackingProduct Structure, Characteristics,
Quantity on Hand
Active Work Order Status
Open Customer Orders
Shipped Item Information
BRACKETS SUMMARY
0
10
20
30
40
50
60
70
80
90
100
08
/06
/05
08
/20
/05
09
/03
/05
09
/17
/05
10
/01
/05
10
/15
/05
10
/29
/05
11
/12
/05
11
/26
/05
12
/10
/05
12
/24
/05
01
/07
/06
01
/21
/06
02
/04
/06
02
/18
/06
03
/04
/06
03
/18
/06
04
/01
/06
04
/15
/06
04
/29
/06
05
/13
/06
05
/27
/06
06
/10
/06
06
/24
/06
Date
Nu
mb
er
of
Pa
rts
CUM Req Issue
CUM Plan Issue
CUM Actual Issue
*** WARNINGS ***
# Issed No PRE - 6# Issued Post Due - 0
# Multiple Issued Files - 12# Complex Not Planned Early - 0# Complex Not Issued Early - 0
All Due Dates
Product Structure, Characteristics, Quantity on Hand
Active Work Order Status
Open Customer Orders
Shipped Item Information
BRACKETS SUMMARY
0
10
20
30
40
50
60
70
80
90
100
08
/06
/05
08
/20
/05
09
/03
/05
09
/17
/05
10
/01
/05
10
/15
/05
10
/29
/05
11
/12
/05
11
/26
/05
12
/10
/05
12
/24
/05
01
/07
/06
01
/21
/06
02
/04
/06
02
/18
/06
03
/04
/06
03
/18
/06
04
/01
/06
04
/15
/06
04
/29
/06
05
/13
/06
05
/27
/06
06
/10
/06
06
/24
/06
Date
Nu
mb
er
of
Pa
rts
CUM Req Issue
CUM Plan Issue
CUM Actual Issue
*** WARNINGS ***
# Issed No PRE - 6# Issued Post Due - 0
# Multiple Issued Files - 12# Complex Not Planned Early - 0# Complex Not Issued Early - 0
All Due Dates
Requirements
Plan
Actual
BRACKET PLANNING
0.5
0.6
0.7
0.8
0.9
1
1.1
-200 -150 -100 -50 0 50
Days
Cu
mu
lati
ve P
erce
nt
OLD PLAN
NEW PLAN
REQUIRED

MBA 664, Team #1 34
Data Mining
• Questions?